_Bryant.png)
Use of Chipless Radio Frequency Identification Technology for Smart Food Packaging: An Economic Analysis for an Australian Seafood Industry


Abstract
1. Introduction
2. Literature Review

| Ref. | Country of Study | Approach | Methodology | Application | Major Conclusion | The Variables of Interest |
|---|---|---|---|---|---|---|
| [38] | China | Quantitative | Cost–benefit analysis based on survey results | Distribution process | Item tagging is the ideal approach in the printing industry’s supply chain | Tag cost, reader cost, IT infrastructure costs, required number of readers, price of controller and antennas, required number of controllers, number of publications, the average time saved via RFID, working hours of labour, and average salary of labour. |
| [40] | The Netherlands | Quantitative | Break-even analysis | Inventory management | RFID technology facilitates more information about inventory that comes with a price. The break-even prices of the implementation of the technology should be considered and compared with potential gains | Tag costs, observation cycle length, audit costs, theft fraction, the value of an item, annual interest rate, expected demand, coefficient of variation demand, lead time, target fill rate, and fraction of theft that cannot be solved by using RFID. |
| [41] | Italy | Quantitative | Activity-Based Costing (ABC) analysis | Pallet management | Results show that the proposed model clearly allocates the cost of the technology by introducing benefits in terms of cost savings | Direct costs (pallet park purchase, RFID equipment and infrastructure), indirect costs (replenishment, maintenance, tag replacement, cleaning, storage, reverse logistics, tracking and tracing, RFID system maintenance, and accounting). |
| [42] | Europe | Quantitative | Cost/effetive-ness analysis | Onboard emergency response system for passenger ships | Using RFID technology in passenger-monitoring systems is not a cost-effective approach at this point. So, the technology should not be implemented for safety considerations alone. | Data acquisition and installation, support, maintenance and renewal, tags cost, training costs, distribution of accidents on year and accident type, and distribution of number of fatalities. |
| [46] | United States | Quantitative | Markov chain model | Equipment Tracking in U.S hospitals | The proposed model can be used to estimate the benefits and choose appropriate RFID-based investment plans. | Patient demand and service (daily patient demand, average duration of patient service), searching efficiency (average duration of search, probability of search upon demand, average time until inquired equipment is declared lost, average time until lost equipment is found), preparation and maintenance policies (average time equipment spent in preparation, time until lost equipment needs maintenance) |
| [44] | Italy | Quantitative | System Dynamics | Italian apparel retailer | It has been revealed that RFID implementation increases sales in addition to reducing the operational costs. | Order rate, incoming items rate, sales, returnable items, inventory level check, staff-assisted sales time, time index, weekly sales, a binary RFID input variable (1 for store with RFID, 0 for store without RFID). |
| [53] | Italy | Quantitative | ROI based cost benefit analysis model | Fashion supply chain | A proposed model that considers most cost variables in implementing and managing RFID systems, which provides managers with a useful tool to benchmark RFID implementation in their firms. | Hourly labour cost for error correction, tag insertion, reworks cost, tag cost, purchase cost, holding item costs, receiving errors, shipping errors, picking errors. |
| [54] | China | Quantitative | Classic economic Order quantity (EOQ) model | Supply chain | This study reveals the impact of imperfect RFID technology on inventory management and provides a quantitative model to suggest optimal investment decisions for RFID adoption in inventory management. | Annual demand rate, an order quantity of the manufacturer, inventory level, setup cost, shortage in inventory, the unit cost of item, holding cost per unit, shortage cost. |
| [55] | South Africa | Quantitative | Cost–benefit analysis | Sheep feed lot | RFID can provide supplier data and consequently helps in selecting lambs from top suppliers | RFID ear tag lifespan, daily feed intake, feed-conversion ratio, slaughter percentage, feeding cost, meat price, selling price, buying price, veterinary costs, transport cost, feedlot numbers, water consumption, inflation, and minimum wage. |
| [56] | Portugal | Quantitative | IRR and NPV analysis | Home appliance retail business | This study reveals that RFID can reduce checking, control, reception, picking, and delivery-processing time, resulting in avoided costs of labour. | Tag, reader, software, printer, and RFID tunnel costs, elimination of checking and handling of disputes, time reduction in item search, delivery, and item reception. |
| Ref. | Country of Study | Approach | Methodology | Application | Major Conclusion | The Variables of Interest |
|---|---|---|---|---|---|---|
| [47] | United States | Hybrid | Factorial structure for non-cost related benefits and traditional ROI analysis | U.S army in inventory management | Cost analysis shows that RFID technology implementations result in substantial cost reductions. Sensitivity analysis shows that the cost reduction is robust against inaccurate estimation of parameters. | Unit cost of fixed readers, unit cost of portable readers, unit cost of handheld readers, unit cost of frequency extenders, cost of hardware installation, cost of software installation, number of personnel to be trained, number of hours required per person, annual scheduled tag re-placement, annual frequency extender failure, annual tag failure, annual reader failure, reported labour savings, causative research labour saving, transportation redistribution savings, demilitarisation, maintenance and surveillance (DMS) out of pocket holding cost savings, DMS surveillance maintenance labour savings. |
| [48] | Germany | Hybrid | Survey integrated with technology acceptance model (TAM) | Electronic retail corporation | This study reveals that the acceptance of RFID technology depends mostly on perceived usefulness and transparency in data privacy. | Perceived ease of use, security concerns, perceived use fulness, general attitude toward new technology, general attitude toward data security, male customer, younger costumer, school degree, income, political attitude, reduction of waiting time of checkout, cost reduction. |
| [49] | Italy | Hybrid | Analytic hierarchic Process | - | Important factors affecting RFID technology adoption are identified and classified into three categories: development phase, trial phase, and implementation phase. | Cost (system integration costs, system maintenance costs, reusability of tags), environmental sustainability (energy consumption, electromagnetic compatibility, WEEE disposal), technology (sensitivity, transmit power, communication, tag), international standards (system compatibility in the supply chain, consistency of data format, standard isolation of frequency), security and privacy (relevant legal regulations, exposure and outflow of product information, prevention of stealing and loss), and product (material, placement in the market, geometry). |
| [50] | Thailand | Hybrid | Adaptive neurofuzzy inference system (ANFIS) integrated by Monte Carlo simulation | Construction industries | This study reveals that the cost–benefit analysis of RFID investments can be improved using the ANFIS model | Hardware costs, software costs, service costs, improvements of management materials, men, and machines. |
3. Methodology
3.1. Costs
3.2. Benefits
3.3. Operational Efficiency
3.3.1. Automated Tracking and Tracing
3.3.2. Quality Improvement
4. Investment Analysis
- Package sizes
- Tag/sensor per unit cost
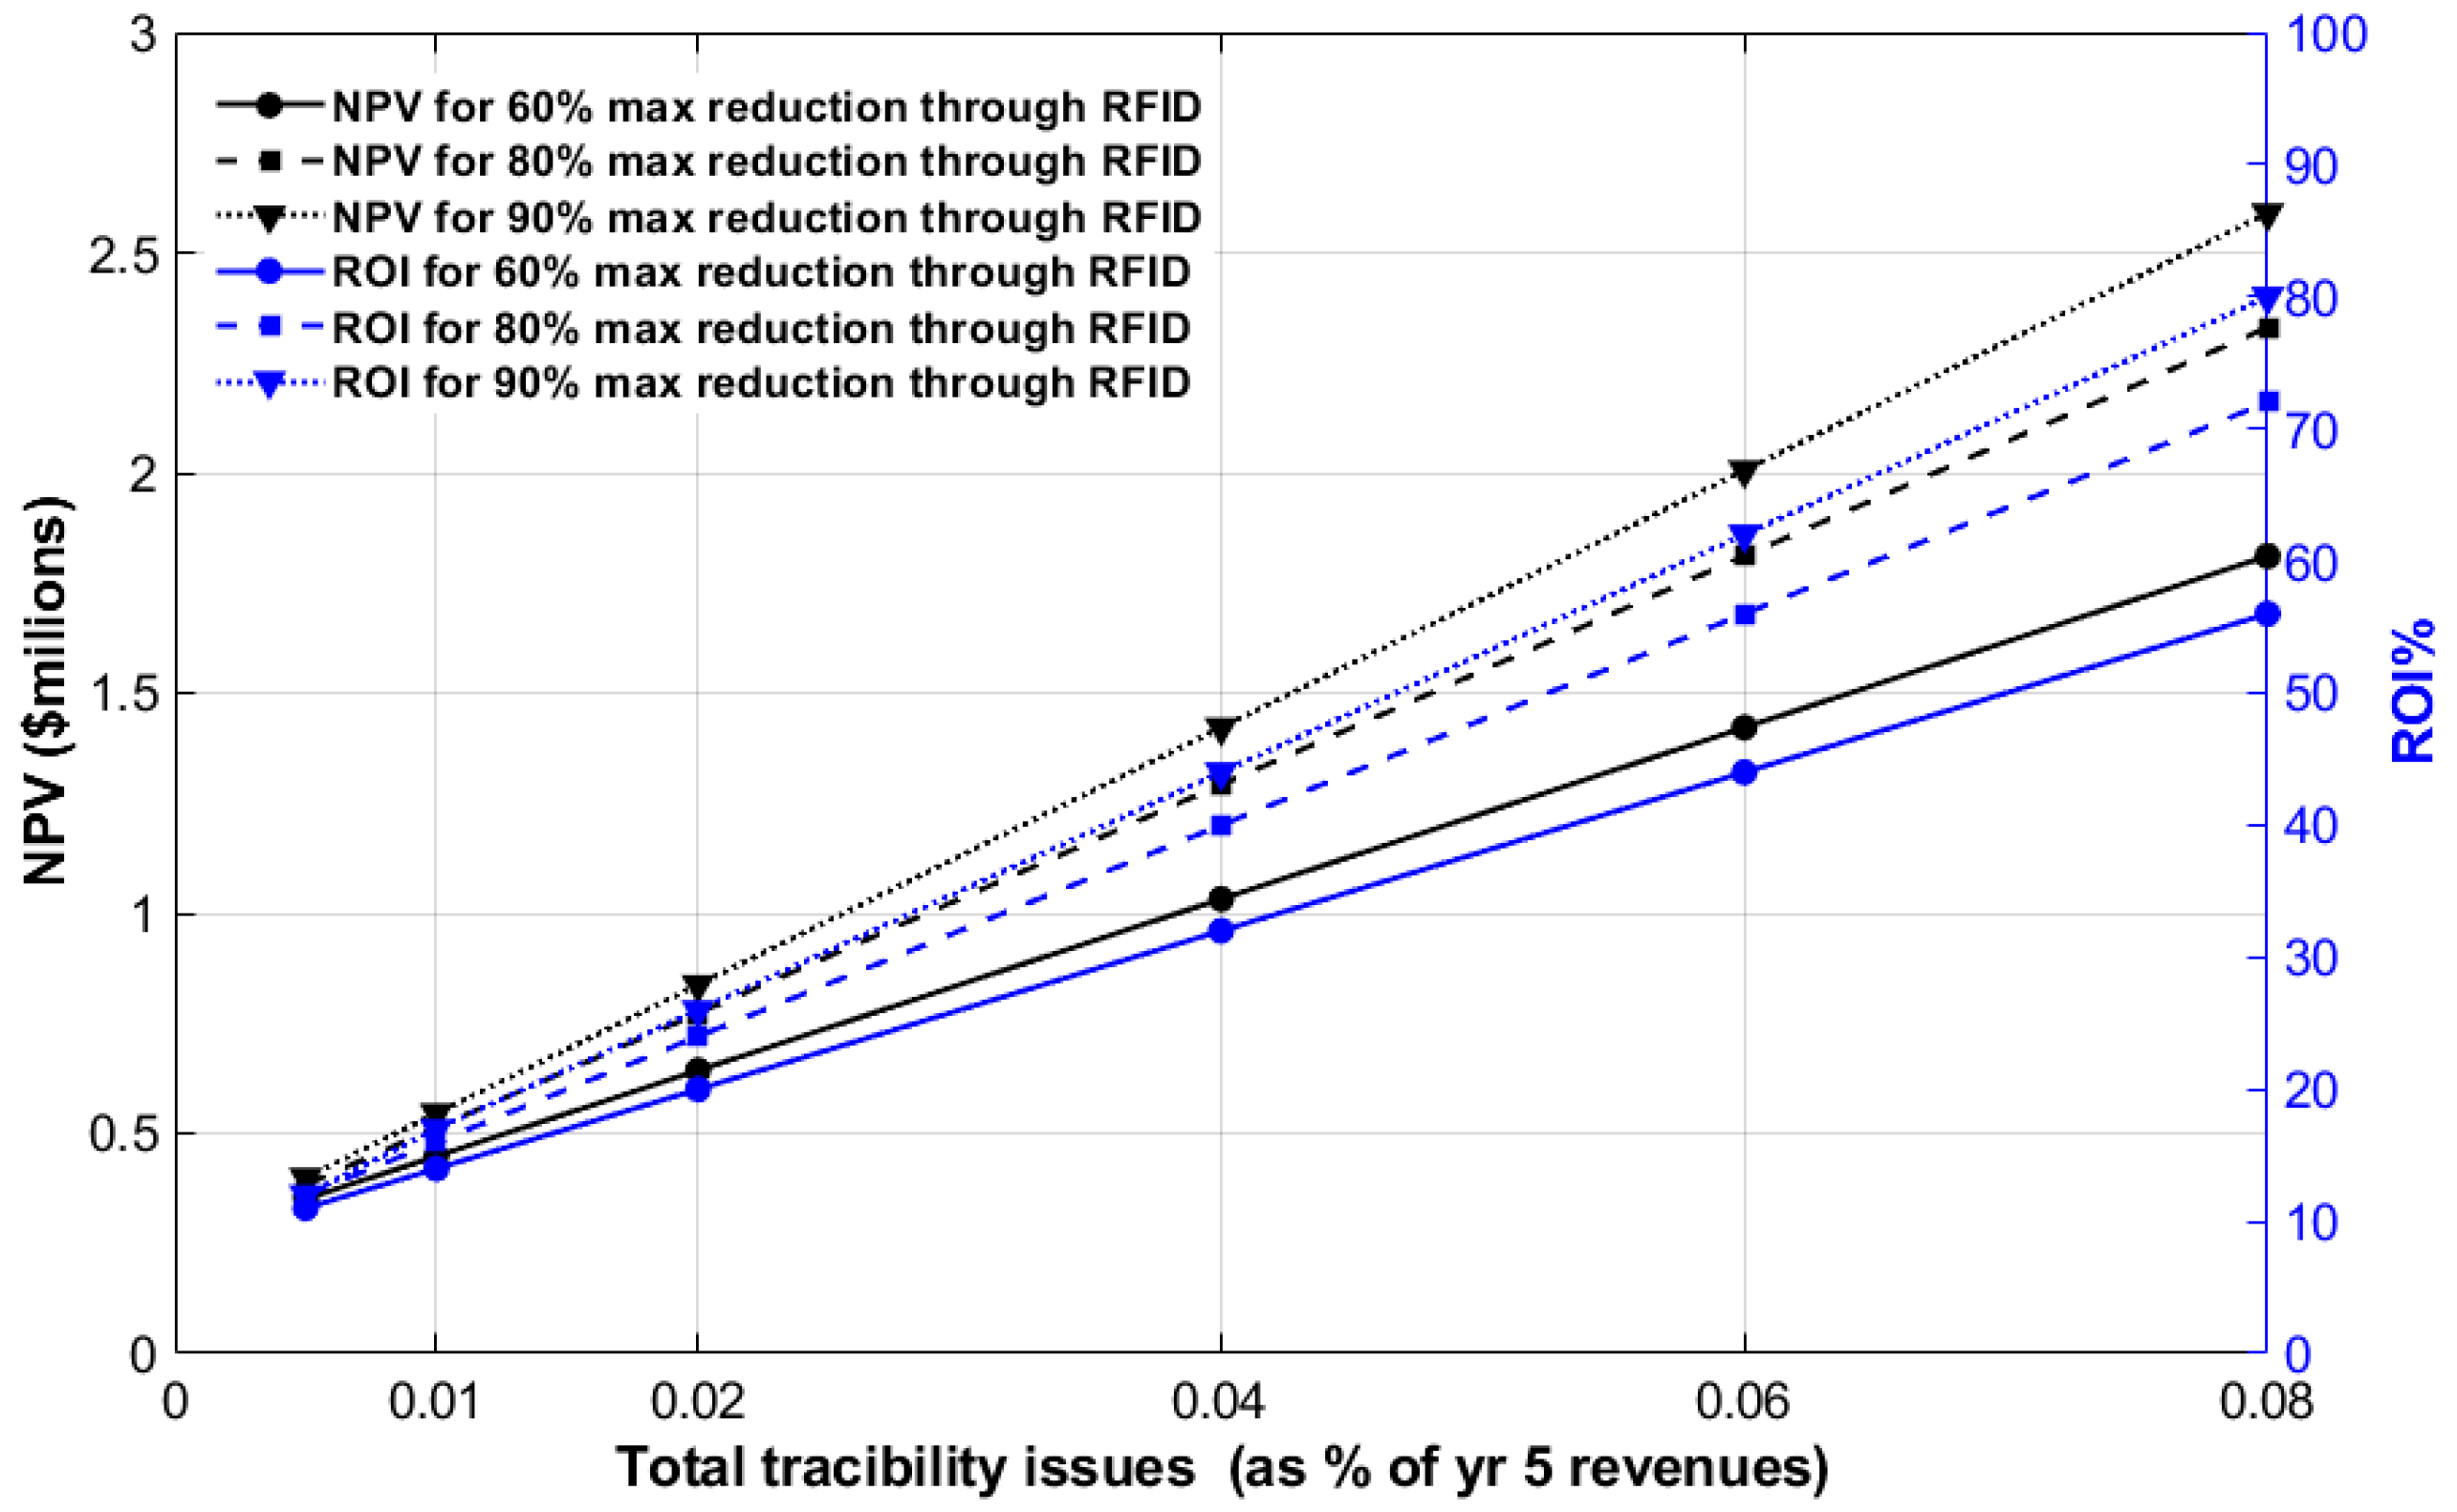
- Total traceability issues as a percentage of 1-year revenue
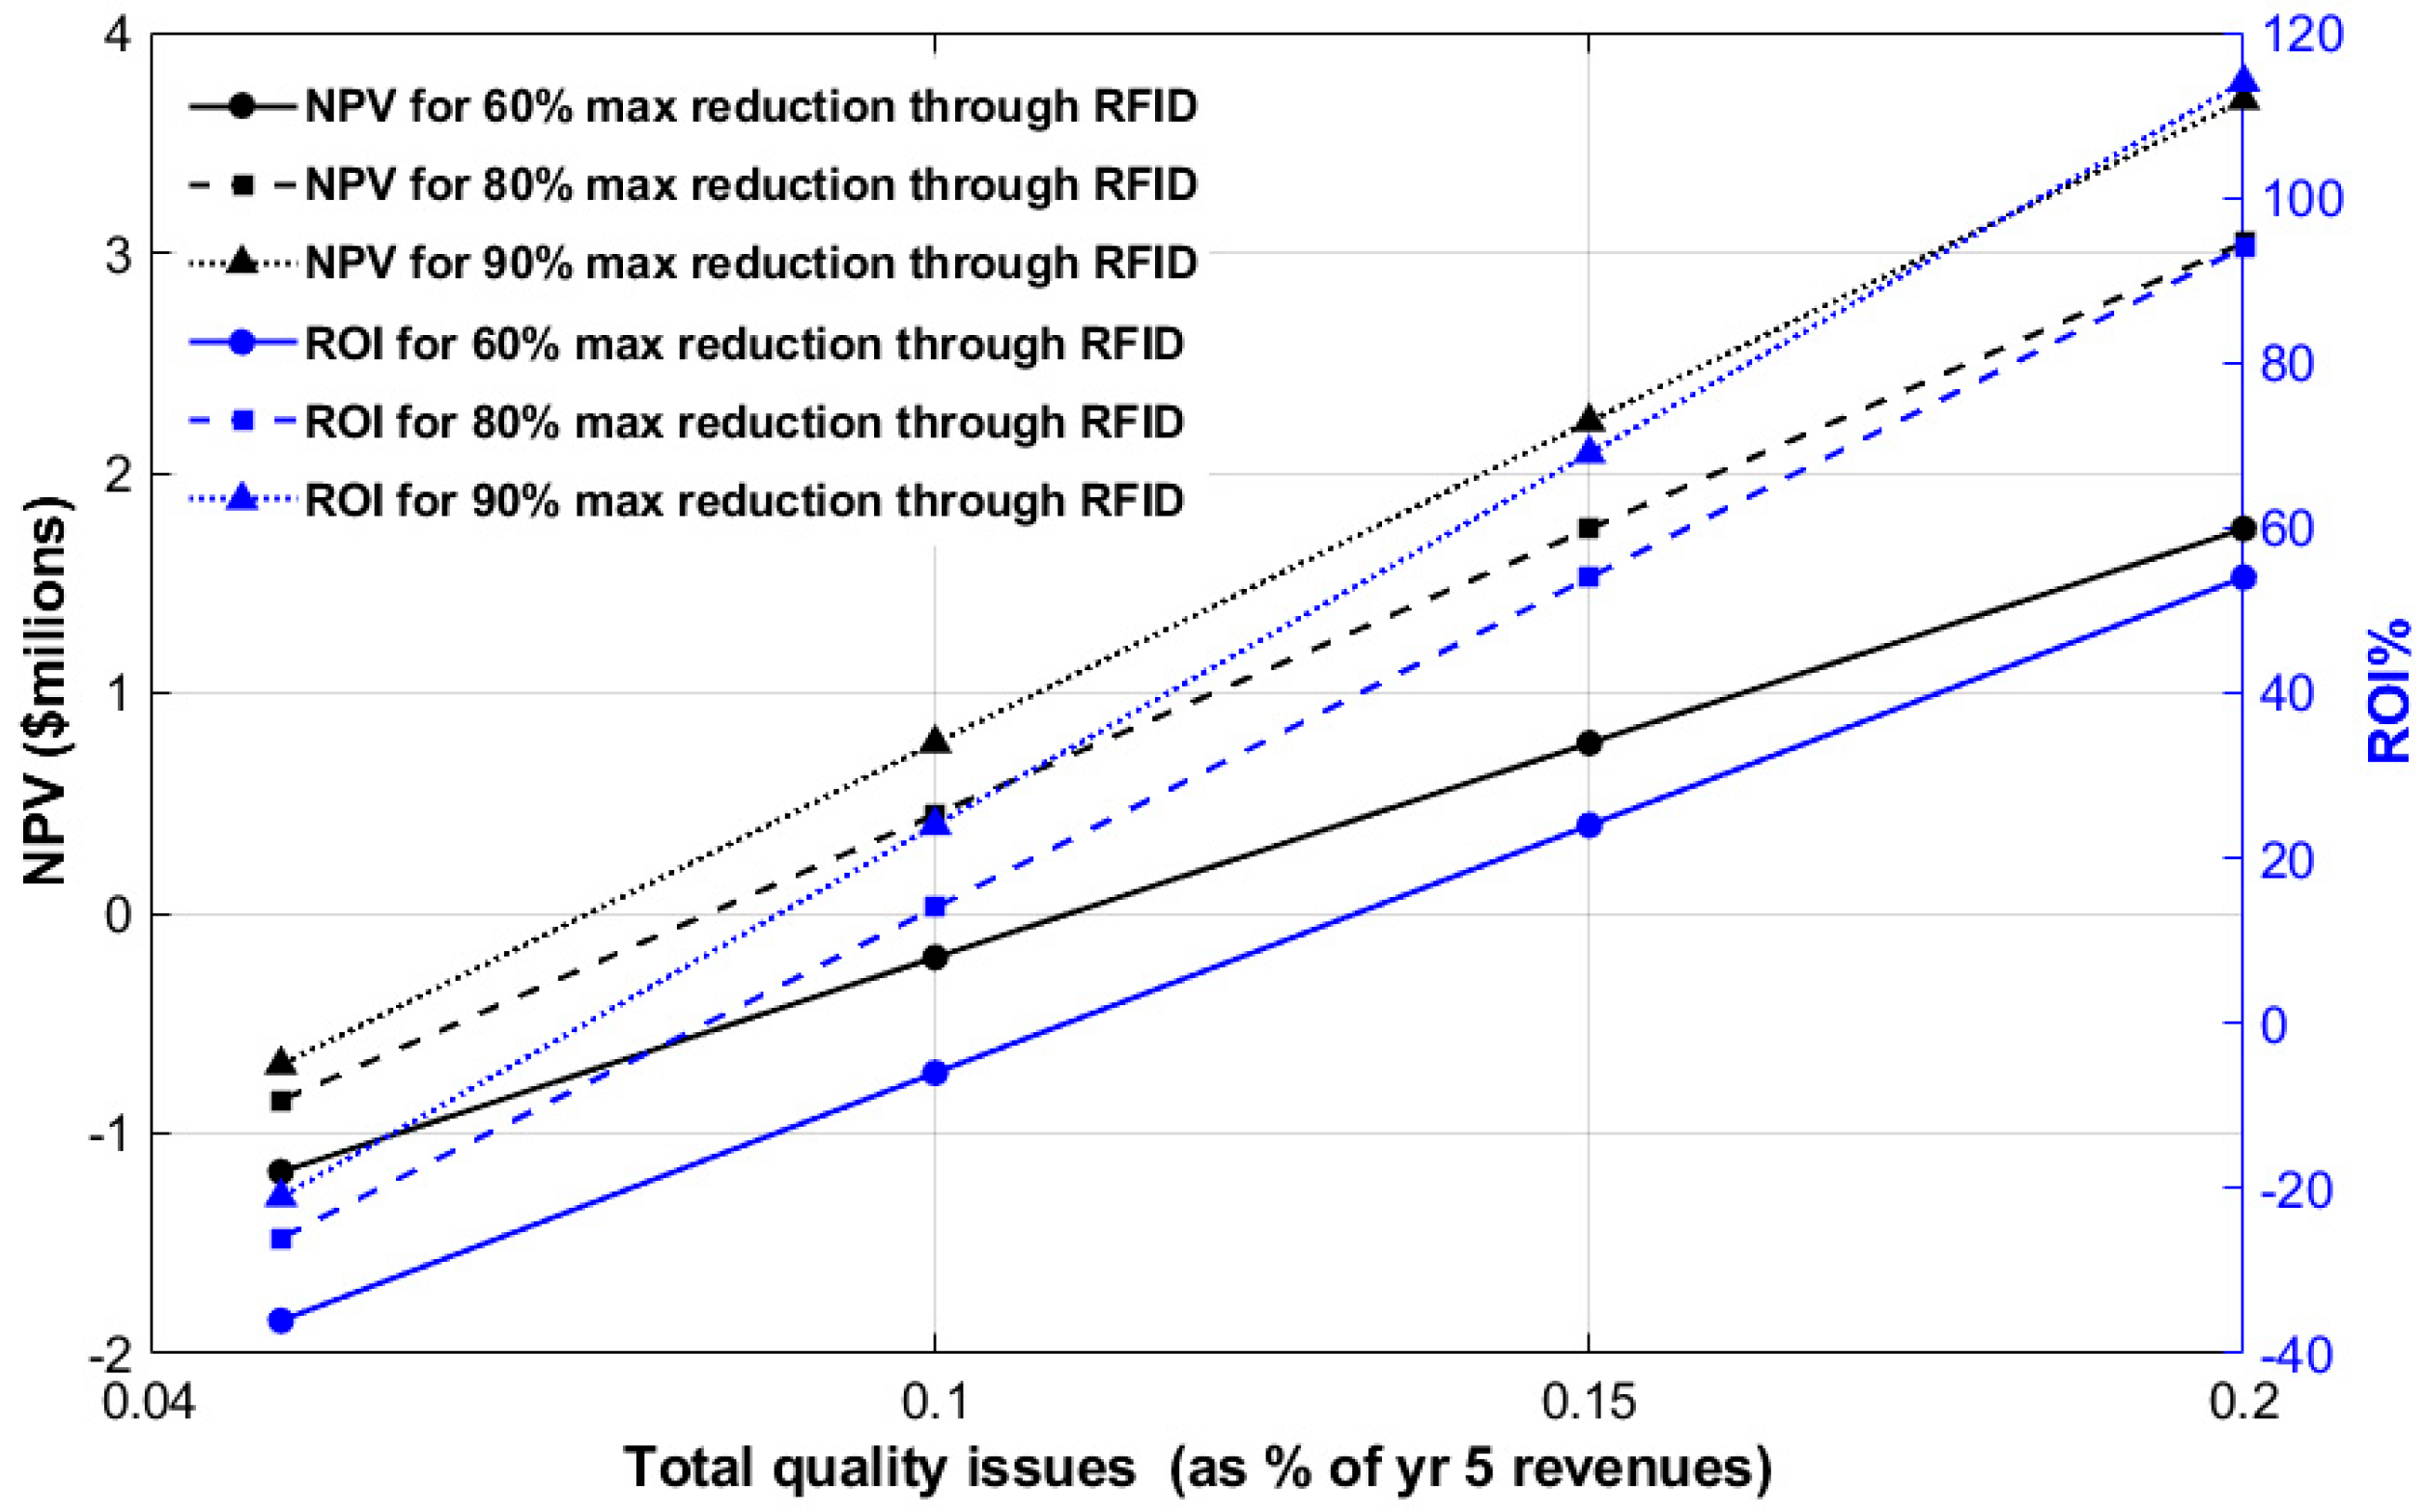
- Total quality issues as a percentage of 1-year revenue.
5. Concluding Remarks
Author Contributions
Funding
Institutional Review Board Statement
Informed Consent Statement
Data Availability Statement
Conflicts of Interest
References
- Yousefi, H.; Su, H.-M.; Imani, S.M.; Alkhaldi, K.; Filipe, C.D.M.; Didar, T.F. Intelligent food packaging: A review of smart sensing technologies for monitoring food quality. ACS Sens. 2019, 4, 808–821. [Google Scholar] [CrossRef] [PubMed]
- Abraham, J. Future of food packaging: Intelligent packaging. In Nanotechnology in Intelligent Food Packaging; Wiley: Hoboken, NJ, USA, 2022; pp. 383–417. [Google Scholar]
- Alizadeh, A.M.; Masoomian, M.; Shakooie, M.; Khajavi, M.Z.; Farhoodi, M. Trends and applications of intelligent packaging in dairy products: A review. Crit. Rev. Food Sci. Nutr. 2021, 62, 383–397. [Google Scholar] [CrossRef] [PubMed]
- Mu, P.; Schmid, M. Intelligent packaging in the food sector: A brief overview. Foods 2019, 8, 16. [Google Scholar] [CrossRef]
- Yang, G.; Xie, L.; Ma, M.; Zhou, X.; Pang, Z.; Da Xu, L.; Walter, S.K.; Chen, Q.; Zheng, L.-R. A health-iot platform based on the integration of intelligent packaging, unobtrusive bio-sensor, and intelligent medicine box. IEEE Trans. Ind. Inform. 2014, 10, 2180–2191. [Google Scholar] [CrossRef]
- Pang, Z.; Tian, J.; Chen, Q. Intelligent packaging and intelligent medicine box for medication management towards the internet-of-things. In Proceedings of the 16th International Conference on Advanced Communication Technology, Pyeong Chang, Republic of Korea, 16–19 February 2014; IEEE: Piscataway, NJ, USA, 2014; pp. 352–360. [Google Scholar]
- Endoza, T.M.; Welt, B.; Otwell, S.; Teixeira, A.; Kristonsson, H.; Balaban, M. Kinetic parameter estimation of time-temperature integrators intended for use with packaged fresh seafood. J. Food Sci. 2004, 69, FMS90–FMS96. [Google Scholar] [CrossRef]
- Pandey, S.K.; Kim, K.-H. The relative performance of RFID-based sensors in the near real-time analysis of CO2 in air. Sensors 2007, 7, 1683–1696. [Google Scholar] [CrossRef] [PubMed]
- Bibi, F.; Guillaume, C.; Gontard, N.; Sorli, B. A review: RFID technology having sensing aptitudes for food industry and their contribution to tracking and monitoring of food products. Trends Food Sci. Technol. 2017, 62, 91–103. [Google Scholar] [CrossRef]
- Preradovic, S.; Karmakar, N.C. Multiresonator-Based Chipless RFID: Barcode of the Future; Springer Science & Business Media: Berlin/Heidelberg, Germany, 2012. [Google Scholar]
- Bi, H.H.; Lin, D.K. RFID-enabled discovery of supply networks. IEEE Trans. Eng. Manag. 2008, 56, 129–141. [Google Scholar] [CrossRef]
- Gandino, F.; Montrucchio, B.; Rebaudengo, M.; Sanchez, E.R. On improving automation by integrating RFID in the traceability management of the agri-food sector. IEEE Trans. Ind. Electron. 2009, 56, 2357–2365. [Google Scholar] [CrossRef]
- Osmo, E.; Stoma, M.; Starek-Wo, A. Application of biosensors, sensors, and tags in intelligent packaging used for food products—A review. Sensors 2022, 22, 9956. [Google Scholar] [CrossRef]
- Yam, K.L.; Takhistov, P.T.; Miltz, J. Intelligent packaging: Concepts and applications. J. Food Sci. 2005, 70, R1–R10. [Google Scholar] [CrossRef]
- Vanderroost, M.; Ragaert, P.; Devlieghere, F.; De Meulenaer, B. Intelligent food packaging: The next generation. Trends Food Sci. Technol. 2014, 39, 47–62. [Google Scholar] [CrossRef]
- Brody, A.L.; Bugusu, B.; Han, J.H.; Sand, C.K.; McHugh, T.H. Innovative food packaging solutions. J. Food Sci. 2008, 73, 107–116. [Google Scholar] [CrossRef] [PubMed]
- Costa, F.; Genovesi, S.; Borgese, M.; Michel, A.; Dicandia, F.A.; Manara, G. A review of RFID sensors, the new frontier of internet of things. Sensors 2021, 21, 3138. [Google Scholar] [CrossRef] [PubMed]
- Athauda, T.; Karmakar, N.C. Review of RFID-based sensing in monitoring physical stimuli in smart packaging for food-freshness applications. Wirel. Power Transf. 2019, 6, 161–174. [Google Scholar] [CrossRef]
- Mezzanotte, P.; Palazzi, V.; Alimenti, F.; Roselli, L. Innovative RFID sensors for internet of things applications. IEEE J. Microw. 2021, 1, 55–65. [Google Scholar] [CrossRef]
- Lazaro, A.; Villarino, R.; Girbau, D. A survey of nfc sensors based on energy harvesting for iot applications. Sensors 2018, 18, 3746. [Google Scholar] [CrossRef] [PubMed]
- Fathi, P.; Karmakar, N.C.; Bhattacharya, M.; Bhattacharya, S. Potential chipless RFID sensors for food packaging applications: A review. IEEE Sens. J. 2020, 20, 9618–9636. [Google Scholar] [CrossRef]
- Dey, S.; Saha, J.K.; Karmakar, N.C. Smart sensing: Chipless RFID solutions for the internet of everything. IEEE Microw. Mag. 2015, 16, 26–39. [Google Scholar] [CrossRef]
- Zuo, J.; Feng, J.; Gameiro, M.G.; Tian, Y.; Liang, J.; Wang, Y.; Ding, J.; He, Q. RFID-based sensing in smart packaging for food applications: A review. Future Foods 2022, 6, 100198. [Google Scholar] [CrossRef]
- Dainelli, D.; Gontard, N.; Spyropoulos, D.; den Beuken, E.Z.-V.; Tobback, P. Active and intelligent food packaging: Legal aspects and safety concerns. Trends Food Sci. Technol. 2008, 19, S103–S112. [Google Scholar] [CrossRef]
- Casella, G.; Bigliardi, B.; Bottani, E. The evolution of RFID technology in the logistics field: A review. Procedia Comput. Sci. 2022, 200, 1582–1592. [Google Scholar] [CrossRef]
- Flanagan, J.; McGovern, C. A qualitative study of improving the operations strategy of logistics using radio frequency identification. J. Glob. Oper. Strateg. Sourc. 2022, 16, 47–68. [Google Scholar] [CrossRef]
- Hossain, M.A. Development of an integrated model for RFID extension. Bus. Process Manag. J. 2014, 20, 752–772. [Google Scholar] [CrossRef]
- Shahrabi, M.S. A quantitative analysis of inaccuracy inventory reducing in multi-period mode: Comparison between RFID and inventory counting. Comput. Ind. Eng. 2023, 177, 109089. [Google Scholar] [CrossRef]
- Ustundag, A.; Satoglu, S.I. Cost-Benefit Analysis for RFID Based Pallet Pooling Systems. 2010. Available online: https://www.researchgate.net/publication/299484863_Cost-Benefit_Analysis_for_RFID_Based_Pallet_Pooling_Systems (accessed on 14 July 2024).
- Bevilacqua, M.; Ciarapica, F.E.; Mazzuto, G.; Paciarotti, C. The impact of RFID technology in hospital drug management: An economic and qualitative assessment. Int. J. RF Technol. 2013, 4, 181–208. [Google Scholar] [CrossRef]
- Dwivedi, Y.K.; Kapoor, K.K.; Williams, M.D.; Williams, J. RFID systems in libraries: An empirical examination of factors affecting system use and user satisfaction. Int. J. Inf. Manag. 2013, 33, 367–377. [Google Scholar] [CrossRef]
- Sellitto, C.; Burgess, S.; Hawking, P. Information quality attributes associated with RFID-derived benefits in the retail supply chain. Int. J. Retail Distrib. Manag. 2007, 35, 69–87. [Google Scholar] [CrossRef]
- Tajima, M. Strategic value of RFID in supply chain management. J. Purch. Supply Manag. 2007, 13, 261–273. [Google Scholar] [CrossRef]
- Kim, E.Y.; Ko, E.; Kim, H.; Koh, C.E. Comparison of benefits of radio frequency identification: Implications for business strategic performance in the US and Korean retailers. Ind. Mark. Manag. 2008, 37, 797–806. [Google Scholar] [CrossRef]
- Katz, J.E.; Rice, R.E. Public views of mobile medical devices and services: A us national survey of consumer sentiments towards RFID healthcare technology. Int. J. Med. Inform. 2009, 78, 104–114. [Google Scholar] [CrossRef] [PubMed]
- Kasemsap, K. The role of radio frequency identification in modern libraries. In Identity Theft: Breakthroughs in Research and Practice; IGI Global: Hershey, PA, USA, 2017; pp. 174–200. [Google Scholar]
- Shafeie, S.; Chaudhry, B.M.; Mohamed, M. Modeling subcutaneous microchip implant acceptance in the general population: A cross-sectional survey about concerns and expectations. Informatics 2022, 9, 24. [Google Scholar] [CrossRef]
- Hou, J.-L.; Huang, C.-H. Quantitative performance evaluation of RFID applications in the supply chain of the printing industry. Ind. Manag. Data Syst. 2006, 106, 96–120. [Google Scholar] [CrossRef]
- Duran-Sindreu, M.; Bonache, J.; Martin, F.; Itoh, T. Single-layer fully-planar extended-composite right-/left-handed transmission lines based on substrate integrated waveguides for dual-band and quad- band applications. Int. J. Microw. Wirel. Technol. 2013, 5, 213–220. [Google Scholar] [CrossRef]
- Alfiana, G.; Syafrudinb, M.; Farooqc, U.; Ma, M.R.; Syaekhonib, M.A.; Fitriyanib, N.L.; Leea, J.; Rhee, J. Improving efficiency of RFID-based traceability system for perishable food by utilizing IoT sensors and machine learning model. Food Control 2020, 110, 107016. [Google Scholar] [CrossRef]
- Gnoni, M.G.; Rollo, A. A scenario analysis for evaluating RFID investments in pallet management. Int. J. RF Technol. 2010, 2, 1–21. [Google Scholar] [CrossRef]
- Visich, J.K.; Li, S.; Khumawala, B.M.; Reyes, P.M. Empirical evidence of RFID impacts on supply chain performance. Int. J. Oper. Prod. Manag. 2009, 29, 1290–1315. [Google Scholar] [CrossRef]
- Vanem, E.; Ellis, J. Evaluating the cost-effectiveness of a monitoring system for improved evacuation from passenger ships. Saf. Sci. 2010, 48, 788–802. [Google Scholar] [CrossRef]
- Yue, C.; Wang, J.; Wang, Z.; Kong, B.; Wang, G. Flexible printed electronics and their applications in food quality monitoring and intelligent food packaging: Recent advances. Food Control 2023, 154, 109983. [Google Scholar] [CrossRef]
- Feng, J.; Fu, Z.; Wang, Z.; Xu, M.; Zhang, X. Development and evaluation on a RFID-based traceability system for cattle/beef quality safety in China. Food Control 2013, 31, 314–325. [Google Scholar] [CrossRef]
- Qu, X.; Simpson, L.T.; Stanfield, P. A model for quantifying the value of RFID-enabled equipment tracking in hospitals. Adv. Eng. Inform. 2011, 25, 23–31. [Google Scholar] [CrossRef]
- Mehannaoui, R.; Mouss, K.N.; Aksa, K. IoT-based food traceability system: Architecture, technologies, applications, and future trends. Food Control 2023, 145, 109409. [Google Scholar] [CrossRef]
- Bottani, E.; Rizzi, A. Economical assessment of the impact of RFID technology and epc system on the fast-moving consumer goods supply chain. Int. J. Prod. Econ. 2008, 112, 548–569. [Google Scholar] [CrossRef]
- Oztaysi, B.; Baysan, S.; Dursun, P. A novel approach for economic-justification of RFID technology in courier sector: A real-life case study. In Proceedings of the 2007 1st Annual RFID Eurasia, Istanbul, Turkey, 5–6 September 2007; IEEE: New York, NY, USA, 2007; pp. 1–5. [Google Scholar]
- Mu, G.; Dautzenberg, K.; Creusen, U.; Stromereder, C. Customer acceptance of RFID technology: Evidence from the german electronic retail sector. J. Retail. Consum. Serv. 2009, 16, 31–39. [Google Scholar]
- De Felice, F.; Petrillo, A. RFID in green supply chain: Proposal of a multicriteria decision model based on ahp. In Proceedings of the 2013 IEEE 10th International Conference on e-Business Engineering, Coventry, UK, 11–13 September 2013; IEEE: Piscataway, NJ, USA, 2013; pp. 364–369. [Google Scholar]
- Thipparate, T. Economic analysis of RFID investments for construction project management using anfis. Int. J. Inf. Technol. Manag. 2013, 12, 129–142. [Google Scholar] [CrossRef]
- Rinaldi, R.; Bandinelli, R. A model to evaluate logistics RFID-based investments economic effectiveness in the apparel field. Int. J. RF Technol. 2015, 6, 121–150. [Google Scholar] [CrossRef]
- Li, D.; Li, J.; Zhang, Y. RFID investment evaluation model for eoq inventory system with planned shortage. In Proceedings of the 2016 35th Chinese Control Conference (CCC), Chengdu, China, 27–29 July 2016; IEEE: Piscataway, NJ, USA, 2016; pp. 8340–8345. [Google Scholar]
- De Wet, P.-S. A Financial Evaluation of RFID Technology in Sheep Feedlots. Ph.D. Dissertation, University of the Free State, Bloemfontein, South Africa, 2018. [Google Scholar]
- Ferreira, P.; Rodrigues, J.; Carvalho, M.S. Economic evaluation of a radio frequency identification system for a home appliance retail business. In Proceedings of the 2021 IEEE International Conference on Industrial Engineering and Engineering Management (IEEM), Singapore, 13–16 December 2021; IEEE: Piscataway, NJ, USA, 2021; pp. 37–40. [Google Scholar]
- Baysan, S.; Ustundag, A. The cost–benefit models for RFID investments. In The Value of RFID: Benefits vs. Costs; Springer: Berlin/Heidelberg, Germany, 2012; pp. 13–22. [Google Scholar]
- Lee, I. Valuation methods for RFID investments. In Encyclopedia of e-Commerce Development, Implementation, and Management; IGI Global: Hershey, PA, USA, 2016; pp. 522–534. [Google Scholar]
- Tagmatiks Products Pricing. Available online: https://RFID4u.com/tagmatiks-RFID-software-pricing/ (accessed on 20 May 2022).
- Employee Earnings. August 2021, Australian Bureau of Statistics. Available online: https://www.abs.gov.au/statistics/labour/earnings-and-working-conditions/employee-earnings/latest-release#occupation (accessed on 18 July 2022).
- Aliasgari, J.; Karmakar, N.C. Mathematical model of chipless RFID tags for detection improvement. IEEE Trans. Microw. Theory Tech. 2020, 68, 4103–4115. [Google Scholar] [CrossRef]

| Ref. | Country of Study | Approach | Methodology | Application | Major Conclusion | The Variables of Interest |
|---|---|---|---|---|---|---|
| [32] | Australia | Qualitative | Content analysisof literature | Retailing | Benefits of RFID are found mostly in distribution and transportation | Completeness and accuracy of information, frequency of information, information collection time, persistency of information (timeliness) |
| [33] | Canada | Qualitative | Conceptual framework of the benefits analysis | - | RFID can have benefits in process automation, closed-loop tracking, and supply chain visibility. | Reduced shrinkage, reduced material handling, increased data accuracy, faster exception management, improved information sharing, production tracking, quality control, supply and production continuity, material handling, space utilisation, asset management, reduced stockouts, customer service, aftersales service, lower inventory. |
| [34] | United States and Korea | Qualitative | Survey analysis | Retailing | RFID technology adoption in retailing is still in its early years and not mature. | Data system automation (e.g., data read and write capability, data accuracy), hardware/software application (e.g., enterprise application integration, affordable hardware), inventory management (real-time inventory, improved inventory data collection, better reporting on stocking, reduced complexity in inventory, improved visibility of order), store operation (reduced space for stock in a store, faster customer checkout, less time spent on the stock), demand management (improved fashion trend forecasting, more accurate pricing), business strategic performance (promotional strategy, customer service) |
| [35] | United States | Qualitative | Survey analysis | Healthcare | There is no widespread opposition to the adoption of RFID technology. | Cell-phone RFID-based service, the way the technology is provided, and other social and demographic factors. |
| [36] | - | Qualitative | Content analysis of literature | Library | RFID can help modern libraries to accurately manage their collection and services. | Tag costs, observation cycle length, audit costs, theft fraction, value of an item, annual interest rate, expected demand, coefficient of variation demand, lead time, target fill rate, and fraction of theft that cannot be solved by using RFID. |
| [37] | United States | Qualitative | Survey analysis | Healthcare | Wider acceptance of RFID- based subcutaneous microchip is possible if the risks and benefits of it become more transparent to individuals | Data protection, health risks, ease of use, metaphysical dilemmas, monetary issues, negative social impact, medical uses, regulations, cost, and affordability. |
| Variables | Y2021 $’000 | Y2020 $’000 | Y2019 $’000 | Y2018 $’000 | Y2017 $’000 | Y2016 $’000 | Y2015 $’000 | Y2014 $’000 | Y2013 $’000 | Y2012 $’000 | Y2011 $’000 |
|---|---|---|---|---|---|---|---|---|---|---|---|
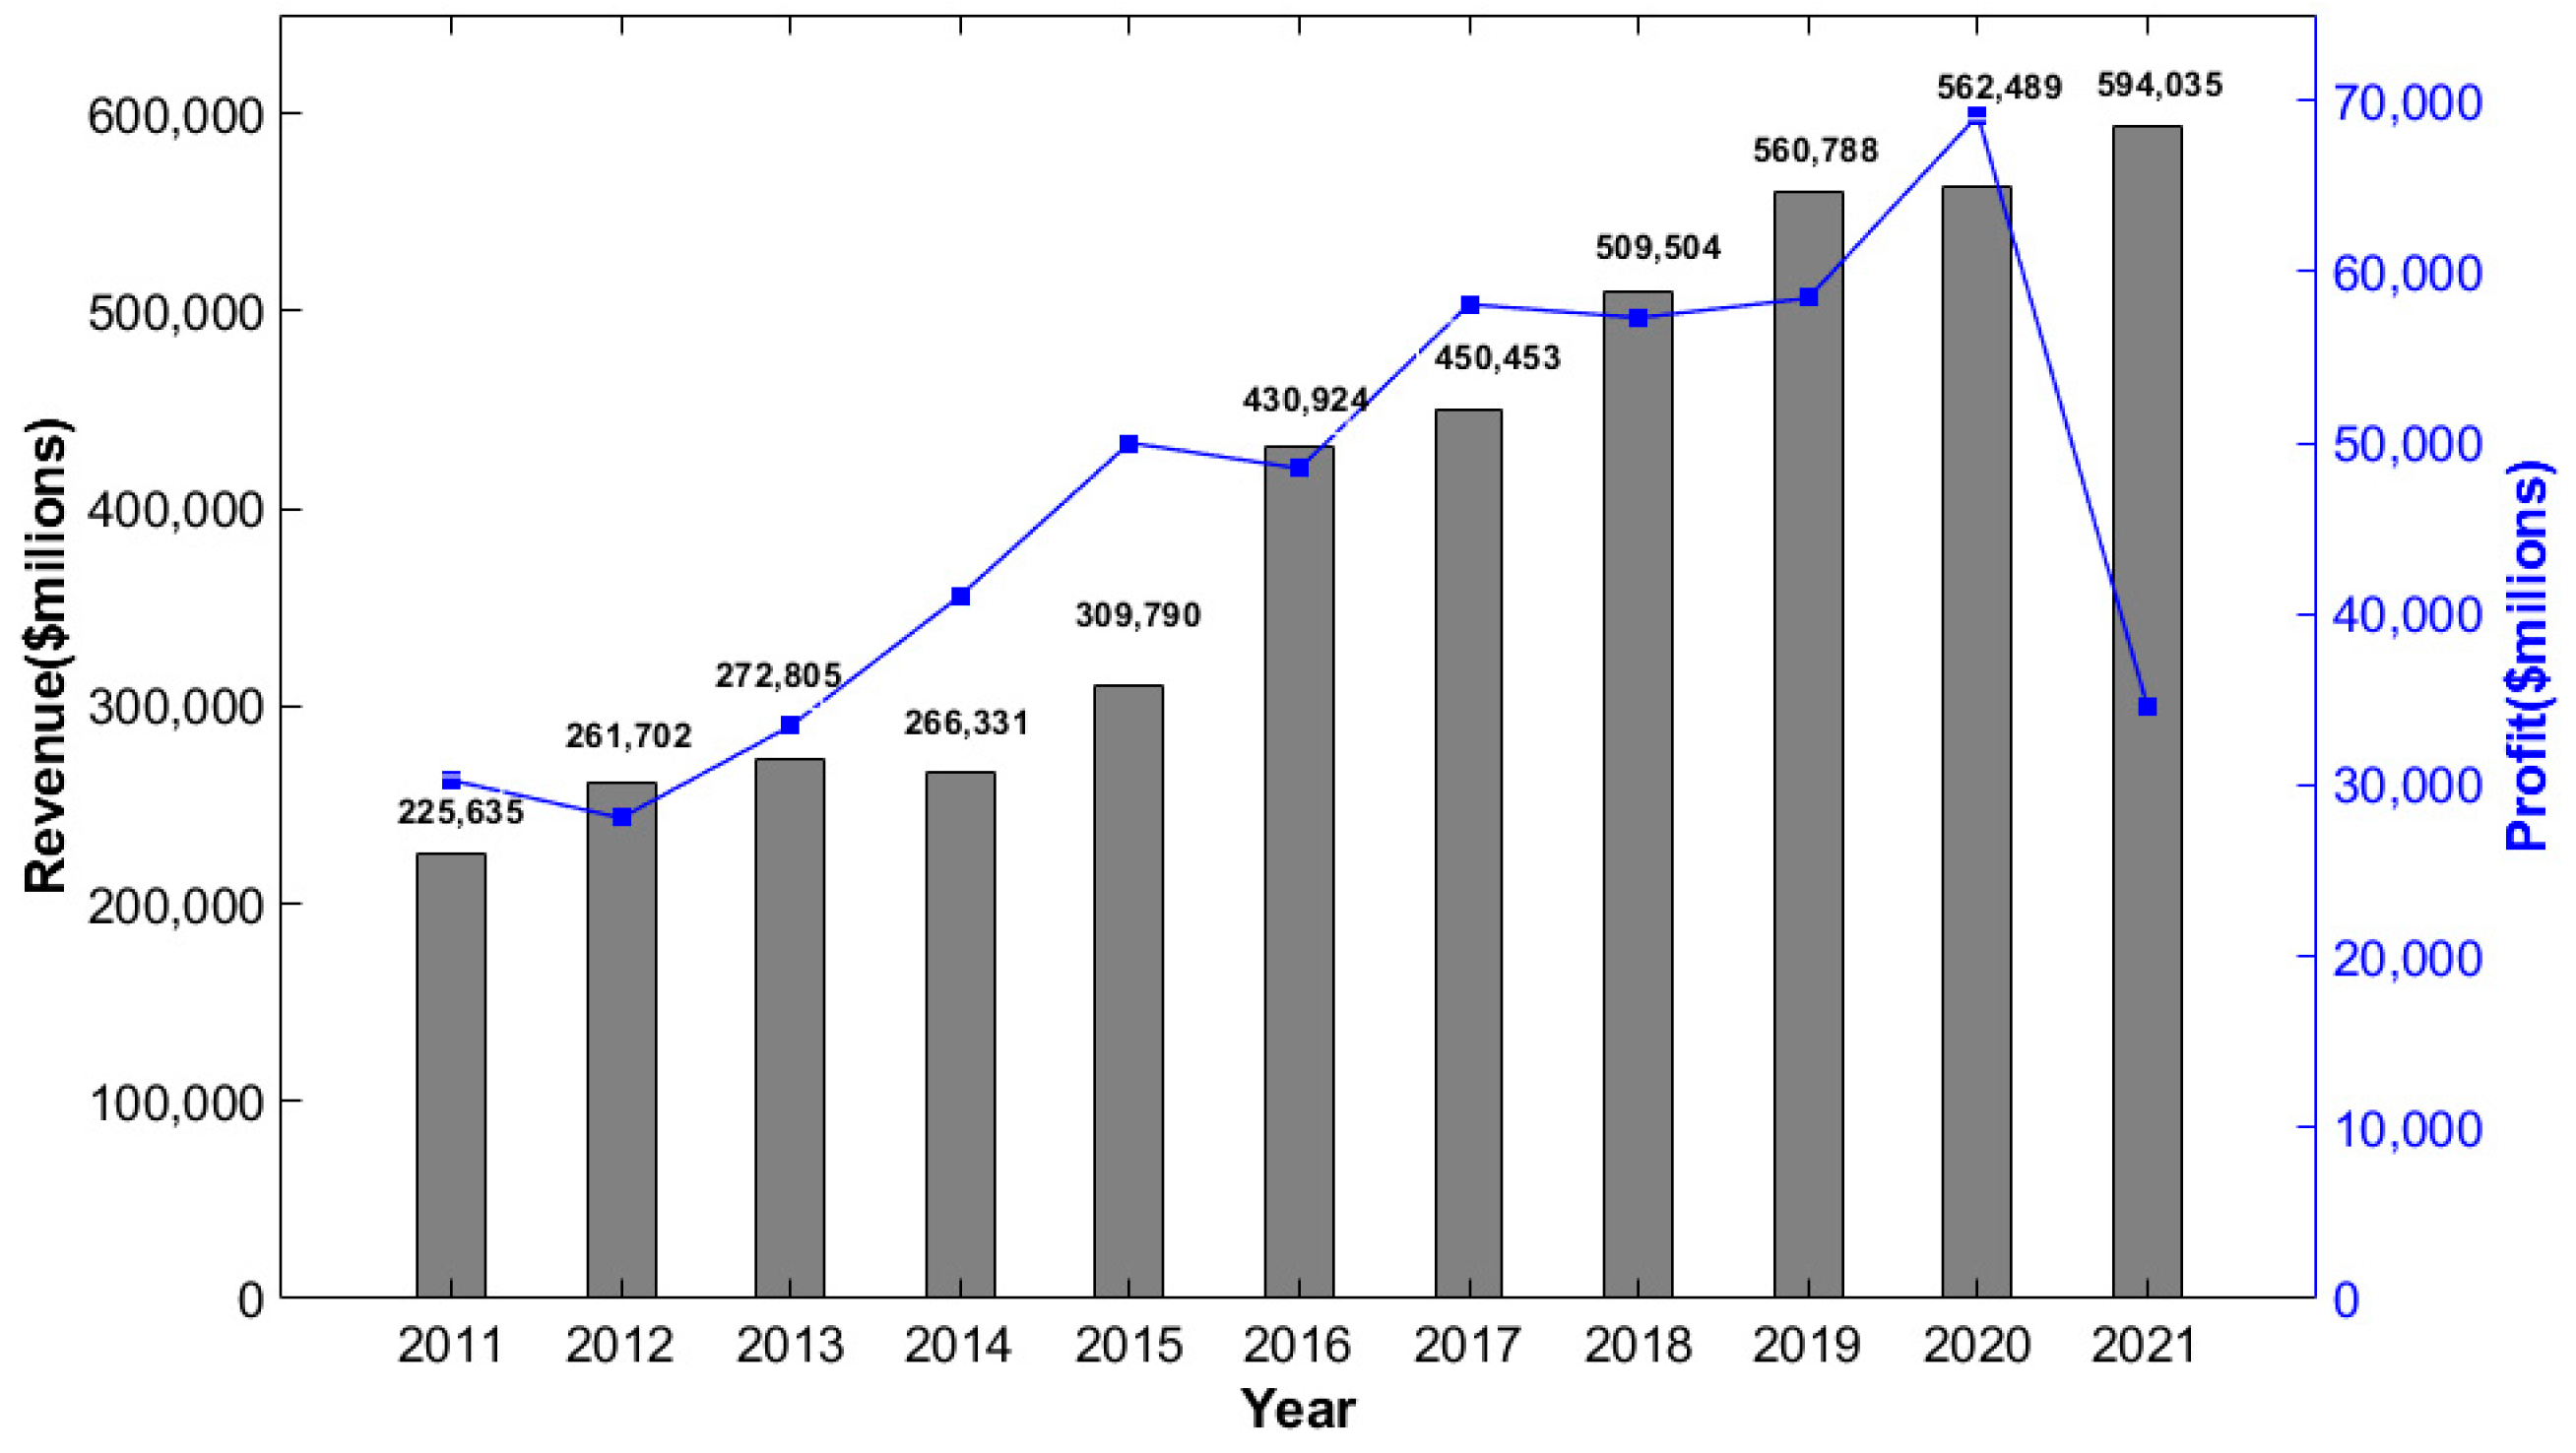
| Current revenue ($milions) | 594,035 | 562,489 | 560,788 | 509,504 | 450,453 | 430,924 | 309,790 | 266,331 | 272,805 | 261,702 | 225,635 |
| % Annual growth rate | 5.61% | 0.30% | 10.07% | 13.11% | 4.53% | 39.10% | 16.32% | −2.37% | 4.24% | 15.98% | - |
| Net profit ($milions) | 34,620 | 69,111 | 58,439 | 57,293 | 58,083 | 48,493 | 49,992 | 41,061 | 33,457 | 28,087 | 30,280 |
| % Margin Profit | 5.83% | 12.29% | 10.42% | 11.24% | 12.89% | 11.25% | 16.14% | 15.42% | 12.26% | 10.73% | 13.42% |
| Average annual growth rate | 10.69% | ||||||||||
| Average margin profit | 11.99% |
| Year 2017 | Year 2018 | Year 2019 | Year 2020 | Year 2021 | |
|---|---|---|---|---|---|
| Salmon Volume (Tonnes) | 25,432 | 30,883 | 33,036 | 34,395 | 37,509 |
| Prawn Volume (Tonnes) | _ | _ | 453 | 2460 | 3350 |
| Salmon wholesale package sizes (kg) | 100 | ||||
| Required number of salmon packages | 254,320 | 308,830 | 330,360 | 343,950 | 375,090 |
| prawn wholesale package sizes (kg) | 100 | ||||
| Required number of prawn packages | 4530 | 24,600 | 33,500 | ||
| Required number of RFID sensors on each package | 3 | ||||
| Growth in number of Salmon packages per year | 21.43% | 6.97% | 4.11% | 9.05% | |
| Average growth in the number of Salmon packages | 10.39% | ||||
| Growth in number of Prawn packages | 36.18% | ||||
| Required number of sensors for salmon packages | 762,960 | 926,490 | 991,080 | 1,031,850 | 1,125,270 |
| Required number of sensors for prawn packages | 13,590 | 73,800 | 100,500 |
| Year 1 | Year 2 | Year 3 | Year 4 | Year 5 | |
|---|---|---|---|---|---|
| One-time fixed cost | |||||
| Hardware expense (including readers) | $32,000 | $0 | $0 | $0 | $0 |
| Software expense | $5000 | $5000 | $5000 | $5000 | $5000 |
| Consulting and systems Integration | $90,000 | $92,520 | $95,111 | $97,774 | $100,511 |
| Training costs | $10,000 | $10,000 | $10,000 | $10,000 | $10,000 |
| Fixed cost of RFID sensor implementation | $137,000 | $97,520 | $95,110.56 | $102,774 | $105,511 |
| Variable cost | |||||
| Annual cost in total for the tags used for production tracking and sensing | $490,308 | $482,678 | $467,310 | $441,913 | $403,362 |
| Total annual maintenance costs | $5000 | $10,000 | $15,000 | $20,000 | $20,000 |
| Labor cost for tag/sensor installation | $49,014 | $56,688 | $65,823 | $76,787 | $90,063 |
| Total variable cost of sensor implentation | $544,322 | $549,366 | $548,133 | $538,699 | $513,425 |
| Year 1 | Year 2 | Year 3 | Year 4 | Year 5 | |
|---|---|---|---|---|---|
| Price per RFID sensor | $0.40 | $0.35 | $0.30 | $0.25 | $0.20 |
| Etimated number of required sensors for salmon packages | 1,125,270 | 1,242,221 | 1,371,326 | 1,513,849 | 1,671,185.263 |
| Etimated number of required sensors for prawn packages | 100,500 | 136,859.8 | 186,374.1 | 253,802.1 | 345,624.7715 |
| Total estimated number of sensors | 1,225,770 | 1,379,080 | 1,557,700 | 1,767,651 | 2,016,810.034 |
| Price per RFID reader | $800 | $780 | $770 | $750 | $750 |
| Etimated number of required Readers | 40 | 0 | 0 | 0 | 0 |
| Benefit Due to Automation | |
|---|---|
| Average time (in seconds) required for picking, checking, and scanning | 90 |
| Number of packages per year | 672,270 |
| Number of times item scanned in production and transport | 10 |
| Labor cost rate for personnel involved in scanning | $29 |
| total time spend for scanning (hours) | 168,068 |
| % reduction in cost due to automated scanning | 90.00% |
| Savings due to automation with RFID | $151,261 |
| Benefits Due to Automated Traceability | |||
|---|---|---|---|
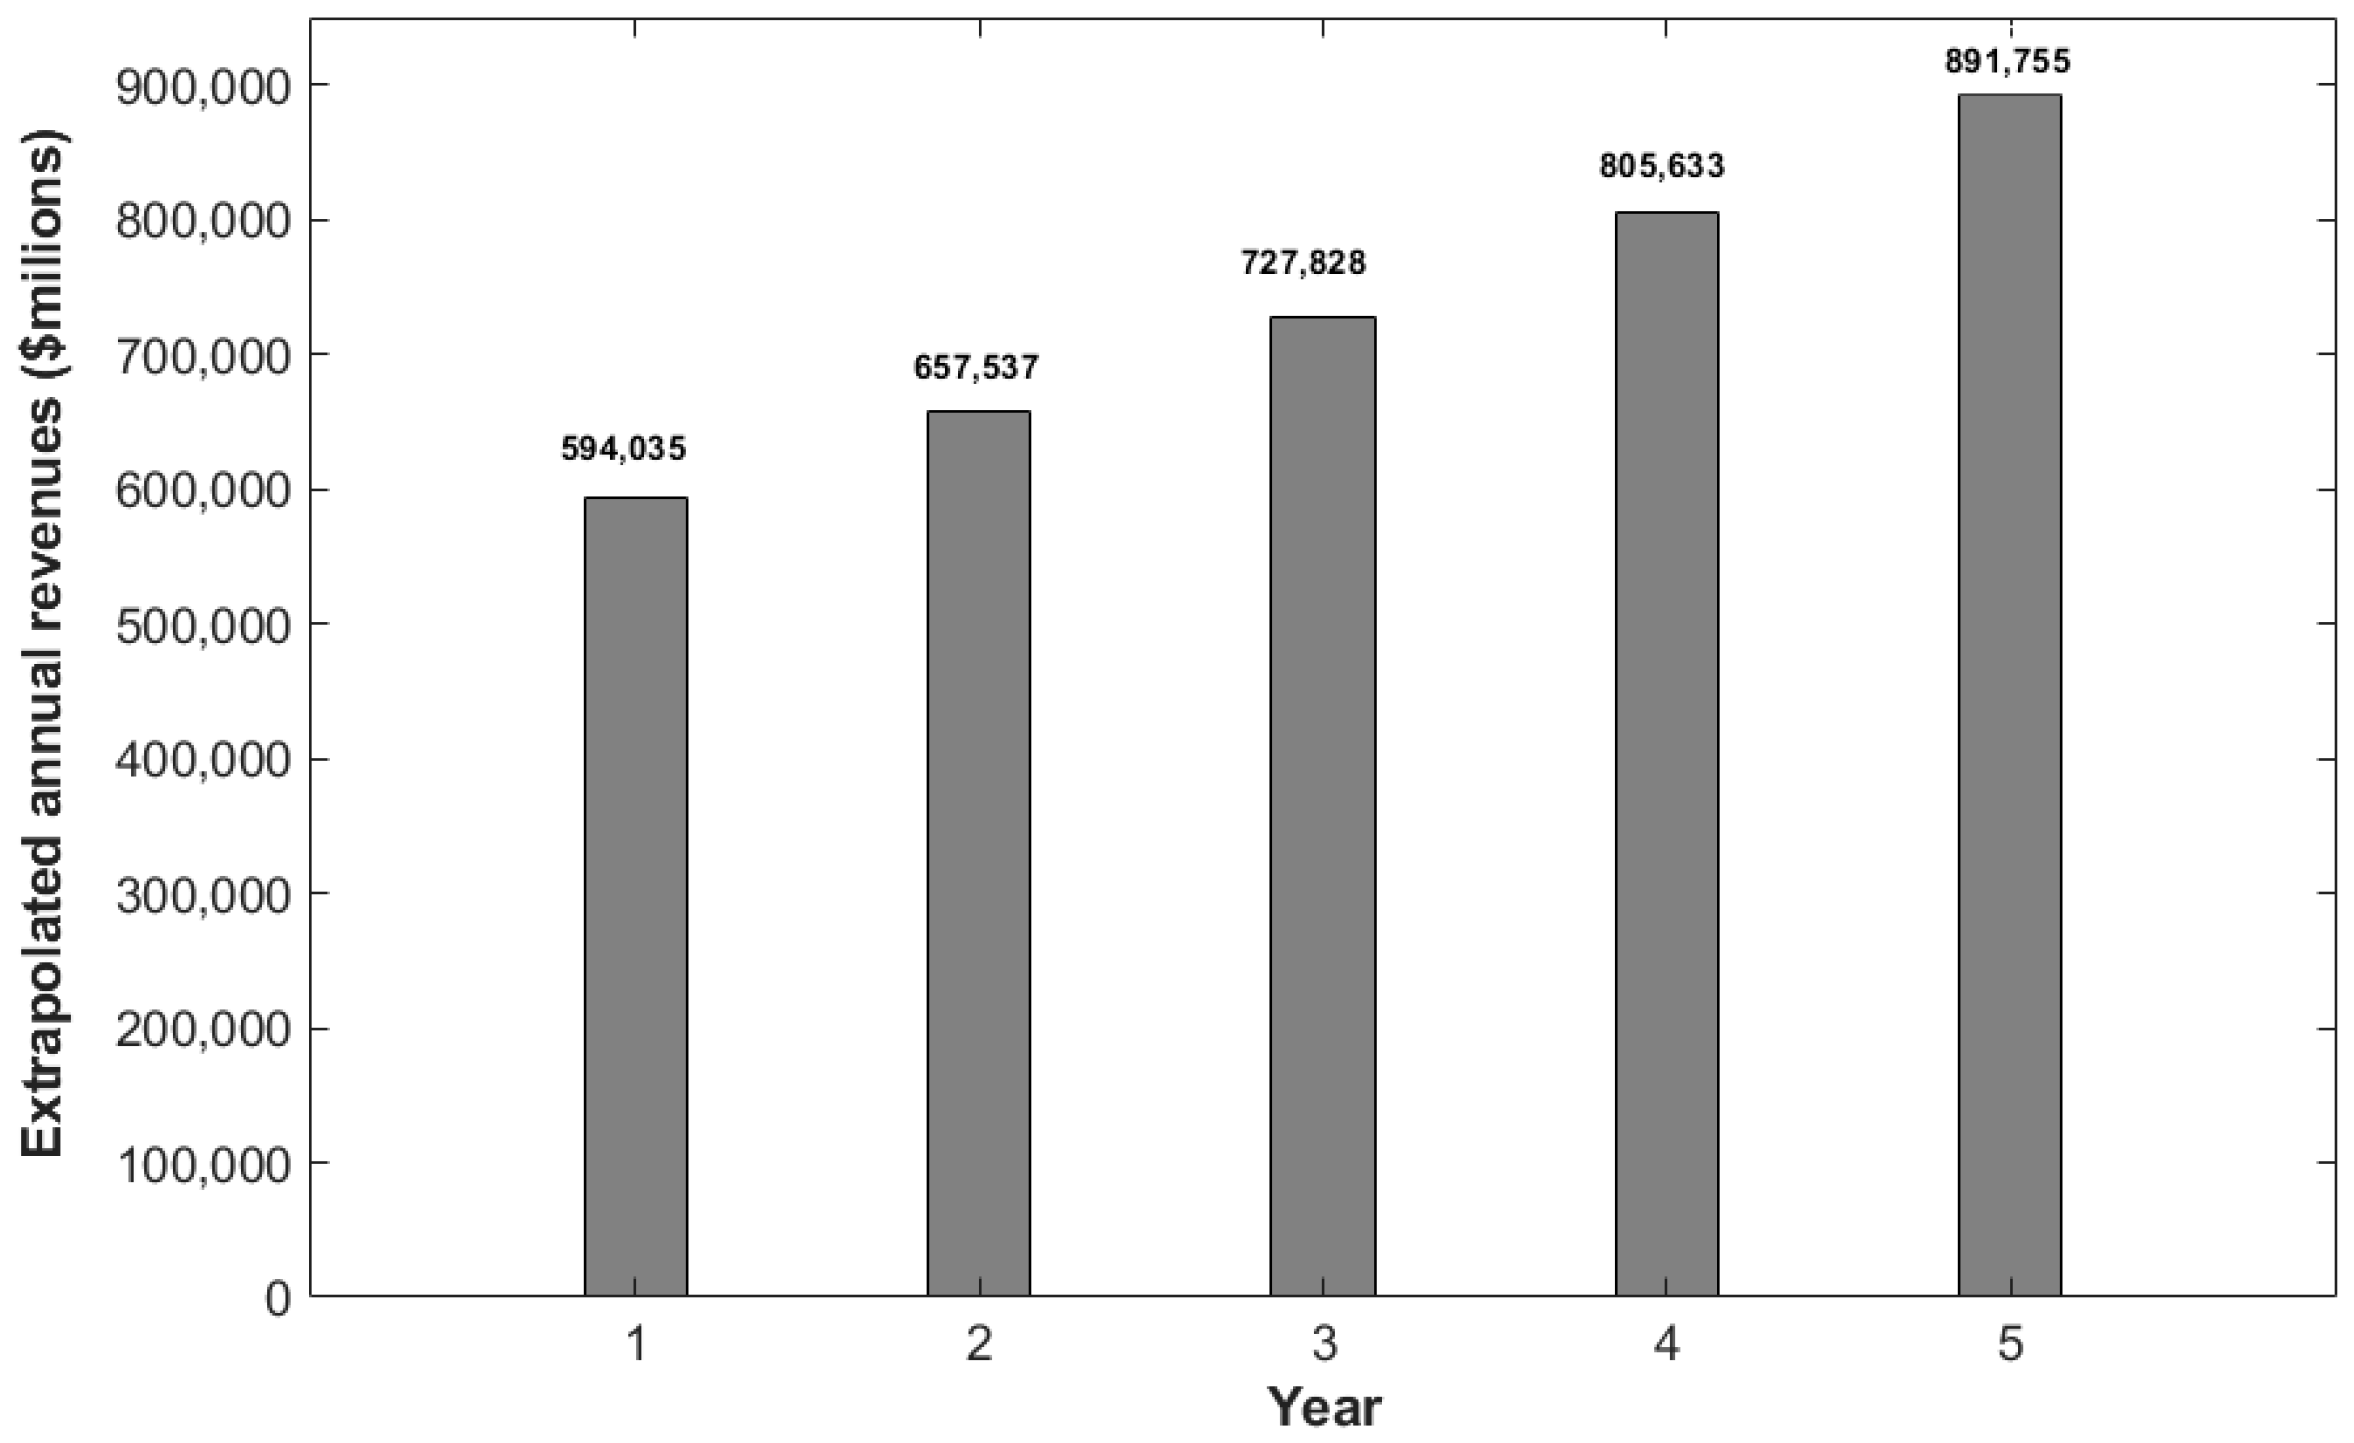
| Current annual revenue | USD 594,035,000 | ||
| Extrapolated Year 5 revenue | USD 891,755,063 | ||
| Total traceability issues at the production and transport level (as % of Year 5 revenue) | 0.01% | USD 89,176 | |
| Track and Trace | Percentage | Maximum % reduction through RFID | Reduced Costs |
| Track and Trace expenses | 100% | USD 53,505 | |
| Annual expenses to track and trace packages in the production network | USD 89,106 | 60% | USD 53,505 |
| Current annual revenue | USD 594,035,000 | ||||
| Extrapolated Year 5 revenue | USD 891,755,063 | ||||
| Total quality issues at the manufacturer’s level (as % of Year 5 revenue) | USD 891,755 | ||||
| Cause of Reduced Costs | Percentage | Maximum % Reduction Due to RFID | Expected Quality Issues after RFID | Added Revenue | |
| Quality issues | 100% | 80% | 0.02% | USD 713,404 | |
| Total 100% | 80% | 0.02% | 0.02% | USD 713,404 | |
| Annually Recurring Benefits | Added Revenue | Added Profit | Reduced Cost | ||
|---|---|---|---|---|---|
| Reduction in quality-monitoring issues | USD 713,404 | 0 | 0 | ||
| Improvements in tracking and tracing | 0 | 0 | USD 53,505 | ||
| Improvements in operational efficiency | 0 | 0 | USD 151,262 | ||
| Total year 5 benefits | USD 713,404 | 0 | USD 204,766 | ||
| Year 1 | Year 2 | Year 3 | Year 4 | Year 5 | |
| Additional annual revenue due to RFID | USD 475,228 | USD 526,030 | USD 582,262 | USD 644,506 | USD 713,404 |
| Benefit due to reduction in costs | USD 136,403 | USD 150,985 | USD 167,125 | USD 184,991 | USD 204,766 |
| RFID related costs | USD 681,322 | USD 646,866 | USD 643,244 | USD 641,473 | USD 618,936 |
| Net benefit for using RFID (cash flow) | USD 69,691 | USD 30,128 | USD 106,144 | USD 188,024 | USD 299,234 |
| Discounted benefit | USD 69,691 | USD 28,423 | USD 94,467 | USD 157,868 | USD 237,021 |
| 5-year discounted NPV | USD 448,089 | ||||
| Calculated ROI | 14% | ||||
Disclaimer/Publisher’s Note: The statements, opinions and data contained in all publications are solely those of the individual author(s) and contributor(s) and not of MDPI and/or the editor(s). MDPI and/or the editor(s) disclaim responsibility for any injury to people or property resulting from any ideas, methods, instructions or products referred to in the content. |
© 2024 by the authors. Licensee MDPI, Basel, Switzerland. This article is an open access article distributed under the terms and conditions of the Creative Commons Attribution (CC BY) license (https://creativecommons.org/licenses/by/4.0/).
Share and Cite
Fathi, P.; Bhattacharya, M.; Bhattacharya, S.; Karmakar, N. Use of Chipless Radio Frequency Identification Technology for Smart Food Packaging: An Economic Analysis for an Australian Seafood Industry. Informatics 2024, 11, 52. https://doi.org/10.3390/informatics11030052
Fathi P, Bhattacharya M, Bhattacharya S, Karmakar N. Use of Chipless Radio Frequency Identification Technology for Smart Food Packaging: An Economic Analysis for an Australian Seafood Industry. Informatics. 2024; 11(3):52. https://doi.org/10.3390/informatics11030052
Chicago/Turabian StyleFathi, Parya, Mita Bhattacharya, Sankar Bhattacharya, and Nemai Karmakar. 2024. "Use of Chipless Radio Frequency Identification Technology for Smart Food Packaging: An Economic Analysis for an Australian Seafood Industry" Informatics 11, no. 3: 52. https://doi.org/10.3390/informatics11030052
APA StyleFathi, P., Bhattacharya, M., Bhattacharya, S., & Karmakar, N. (2024). Use of Chipless Radio Frequency Identification Technology for Smart Food Packaging: An Economic Analysis for an Australian Seafood Industry. Informatics, 11(3), 52. https://doi.org/10.3390/informatics11030052