Article

Experimental Investigations of the Detachment of Different Particle Structures from a Magnetizable Fiber in the Gas Phase

Karlsruhe Institute of Technology, Institute of Mechanical Process Engineering and Mechanics, Straße am Forum 8, 76131 Karlsruhe, Germany
*
Author to whom correspondence should be addressed.
Separations 2023, 10(12), 579; https://doi.org/10.3390/separations10120579
Submission received: 21 October 2023 / Revised: 17 November 2023 / Accepted: 20 November 2023 / Published: 22 November 2023

Abstract

:
A current subject of research is the application of magnetic effects for the detachment of accumulated particles of fibrous collectors in gas particle separation. Initial studies have already shown the magnetically induced detachment behavior of a compact particle structure after a single deflection from a single fiber. In this study, the detachment behavior of particle structures with different morphologies from a single fiber is investigated as a function of the particle loading stage on the fiber, the external magnetic flux density, the inflow velocity and the number of regenerations of the fiber for a certain parameter range. Diffusive and more compact particle structures with non-magnetic properties are deposited on the magnetizable single fiber. By applying an external magnetic field, the fiber is magnetized and experiences a torsional moment. The deposited particle structures on the fiber are detached by the acceleration forces. The detachment of the particle structures is observed using a high-speed camera and the image sequences are analyzed. By determining the projection area before and after the fiber deflection, a degree of regeneration is calculated. With magnetic-induced regeneration, high degrees of regeneration close to 100% can be achieved. Repetitive fiber deflections improve the detachment of the particle structures. The magnetic-induced regeneration is suitable for applications where flow reversal is not possible and can be performed either online or offline. Due to the gentle regeneration, fewer emissions are produced on the clean gas side than, for example, with jet pulse cleaning. It makes it easier to achieve emission limits and simplifies product recovery.

1. Introduction

Magnetic separation techniques were already applied in the 19th century for the material preparation of iron ores [1,2,3]. The magnetic separators of that time were developed for the separation of high magnetic materials such as iron and magnetite [4]. High gradient magnetic separators represent a further development [5,6]. These are also able to separate weak paramagnetic particles [4,7].
In solid–liquid separation, numerous studies on separation and detachment between particles and collectors by magnetic forces are already known [8,9,10,11,12,13]. For the separation of magnetic particles in the liquid phase, magnetizable filters or grids are often used in industrial applications. Recent investigations show that non-magnetic particles in the nanoscale can also be separated from the liquid phase by agglomeration with magnetic particles using high field strength gradients [14,15].
By using magnetic forces, collectors can not only be magnetized but also set in motion. In solid–liquid separation, this has already been implemented in the field of water treatment on a membrane filter [16,17]. The membrane is magnetized and vibrated in a targeted manner.
In contrast to solid–liquid separation, only a few studies are known in the field of gas–particle separation which have investigated the use of magnetic forces. Zhou et al. [18] researched the separation of ferromagnetic particles with a diameter < 2.5 µm on a magnetized filter medium. So far, the application of magnetic forces for the regeneration of magnetized filter fibers (particle detachment) has not been considered yet and thus is the subject of this study. The application of magnetizable filter fibers allows for a targeted movement of the fibers when an external electromagnetic field is applied. Thus, the particle layers on the fibers are removed. The advantage of this new regeneration method is the gentle online regeneration and its use in applications that do not allow flow reversal. Due to the gentler regeneration compared to pulse jet cleaning, fewer particles reach the clean gas side [19,20]. This makes it easier to meet emission targets and simplifies product recovery from solid-carrying air streams.
Several studies are known from the literature which use magnetic forces for a defined movement of magnetizable materials. The field of application is very wide and ranges from medical applications [21,22] to the production of composite materials [23,24].
In this study, a single magnetizable fiber is used to perform basic investigations. The fiber, which is fixed on one side, is loaded with non-magnetic particle material. After the particle deposition, the ferromagnetic fiber is magnetized by the external magnetic field of two Helmholtz coils and experiences a torque. To achieve the highest possible detachment, the loose end of the fiber is deflected against a stop. The deflection and bending of the fiber results from the fixation at one end of the fiber. With increasing magnetic flux density, the fiber is accelerated faster, which has a corresponding effect on the detachment behavior of the particle structures from the fiber. A theoretical description of the deflection by a homogeneous external magnetic field was presented by Gerbal et al. in [25] for a ferromagnetic cantilever rod fixed at one end. In the study, the relationship between the bending and the magnetization M was balanced by the equilibrium between the bending moment of the magnetizable fiber and the torque T.
As shown in a previous study [26], the particle morphology (structure) and the particle loading stage (height of the structure) are crucial for the efficiency of particle detachment. The resulting morphology depends on the prevailing transport mechanism (diffusion, interception, inertia) of the particles to the fiber during deposition [27,28]. Thus, for example, the flow resistance, the strength or porosity of the structure can influence the efficiency of the fiber regeneration. However, these parameters are difficult to determine for the emerging particle structures and are not part of this study.
In this study, the efficiency of particle detachment from a single fiber for repetitive regeneration events was investigated as a function of particle material, particle structure, structure height, flow velocity and number of fiber deflections (number of regenerations).

2. Materials and Methods

2.1. Fiber

The fiber consists of ferritic chromium steel X6Cr17, with a material number of DIN 1.4016 or AISI 430. The fiber has a diameter of df = 95 µm and a length of lf = 3.8 cm. The steel has a density of ρ = 7700 kg∙m−3 and Young’s modulus of E = 2.2 × 10¹¹ Pa. When the axis of the fiber is oriented perpendicular to the external field, the magnetization of the fiber increases linearly in the range of the field strengths used (H = 0–30,000 A∙m−1) [26,29]. The same fiber material was already applied in previous studies [26,27].

2.2. Particulate Matter

In this study, the detachment behavior of particle structures with different morphologies from a single fiber was investigated. Diffusive and more compact particle structures were built up on the fiber. It is known from the literature that diffusive particle structures can be generated with Carbon Black and more compact particle structures with Spheriglass [28,30]. The morphology of the particle structure is determined by the transport mechanism of the particles to the fiber [30].
The transport mechanism (diffusion, interception, inertia) during fiber loading can be influenced by various parameters such as inflow velocity, particle diameter or fiber diameter. In this study, different morphologies were generated by adjusting the inflow velocity and changing the particle material and size.
Two different particle materials were used to generate particle structures in the diffusion/interception/inertia area.
The particle structures known from the literature are mostly generated from monodisperse materials. By using polydisperse instead of monodisperse particle material, more industry-oriented conditions are created. The generated particle structures of Carbon Black and Spheriglass have already been characterized in detail in a previous study [27]. In the previous study, the particle size distribution curves for the two materials are given.
To create dendritic particle structures, Pow Carbon 280 (Carbon Black) from Harold Scholz & Co. (Recklinghausen, Germany) was applied. Carbon Black has a volume-weighted diameter of x50.3 = 680 nm [27]. Because of the small particle sizes, the transport of the particles to the fiber is mainly dominated by diffusion.
Spheriglass® CB 5000 from Potters Industries Inc. (Malvern, PA, USA) was used to create much more compact structures. Due to a higher volume-weighted particle diameter of x50.3 = 6540 nm [27], on average, tenfold the size of Carbon Black, the dominating transport mechanisms of the glass spheres to the fiber are the interception effect or inertia. The material and bulk density of Spheriglass is ρmaterial = 2460 kg·m−3 and ρbulk = 1280 kg·m−3.
The resulting particle structures can be compared with known structures from the literature using the Péclet number (diffusion) or Stokes number (interception, inertia) [28,30,31].
The Péclet number is defined as follows:
P é = u · x f i b e r D
with the flow velocity u, the diameter of the fiber xfiber and the coefficient of diffusion D .
The Stokes number is defined as follows:
S t = ρ P · x 2 · u   · Ψ 18 · η F · x f i b e r
with the particle density ρ P , the particle diameter x, the flow velocity u, the correction factor for the non-Stokes area Ψ , the kinematic viscosity of the fluid η F and the fiber diameter xfiber.
The Péclet and Stokes numbers found in the literature, which are defined for monodisperse particle systems, were calculated using the number-related particle diameter x50.0. In polydisperse systems, the effect of larger particles on the volume of the particle structure is higher than the effect of smaller particles. Therefore, the Péclet and Stokes numbers were calculated by using the volume or weighted particle diameter x50.3. In several studies, the same polydisperse particle material as in this study has already been used to generate particle structures [27,28]. It has been shown that for a given Péclet or Stokes number, comparable particle structures can be formed as with monodisperse material.

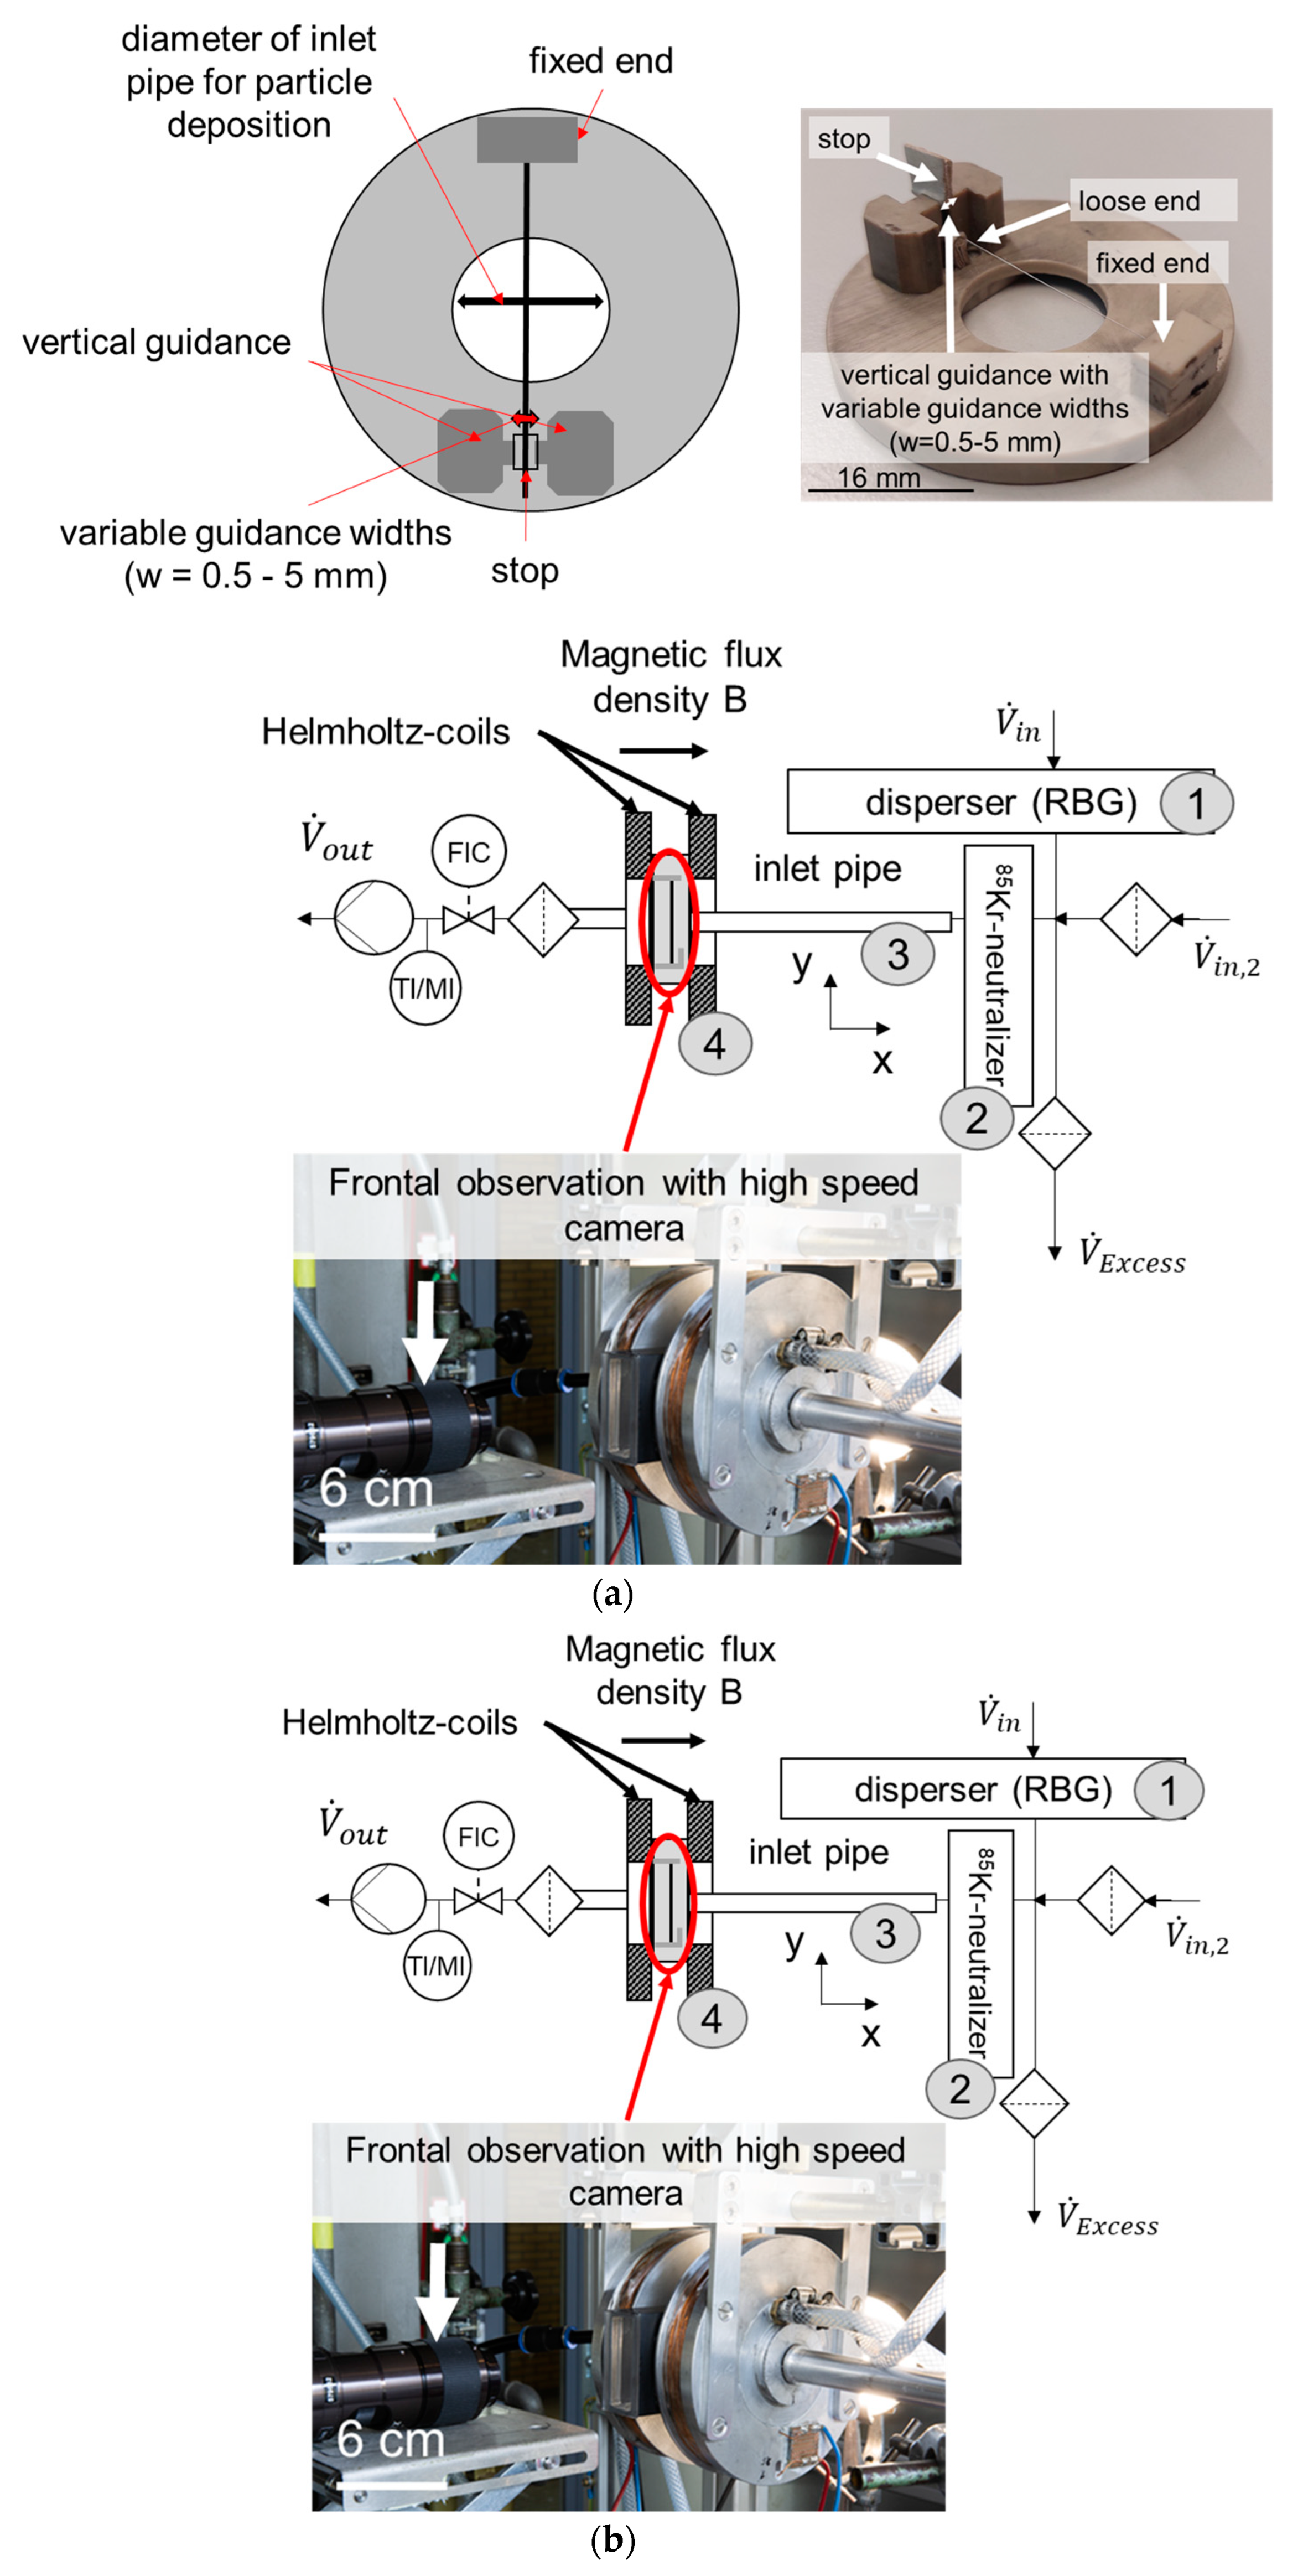
2.3. Particle Deposition and Magnetic-Induced Detachment

Figure 1 presents the same setup applied in a previous study [26] for the particle deposition and detachment.
The particle material (Carbon Black or Spheriglass) is dispersed with a feed rate of vFeed = 5 mm∙h−1 (for Carbon Black) and vFeed = 32 mm∙h−1 (for Spheriglass) into an air volume flow of V ˙ dis = 9.73 L·min−1. Both materials were dispersed with a RBG 1000 from Fa. Palas® at a dispersion pressure of p = 1 bar (1). Before entering a 85Kr-neutralizer (2), the volume flow is divided into V ˙ Excess and V ˙ in. To ensure a constant charge distribution of the particles, a 85Kr-neutralizer (2) is used. Table 1 shows the volume flow rates set in the various measurements.
Before entering the loading chamber (4), where the single fiber is located, an inlet pipe (3) with a length of l = 26 cm is installed. A flow straightener is placed in the inlet pipe to achieve a uniform flow profile.
The inlet pipe is mounted horizontally. With a prolonged loading period, wall deposits can form in the inlet pipe. The horizontal orientation of the pipe is intended to reduce possible detachment of the wall deposits and subsequent effects on the structure formed on the fiber. The distance between the inlet and outlet tube to the fiber is 16 mm.
For the deposition of the glass spheres (Spheriglass) via interception and inertia, a second volume flow V ˙ in,2 at the inlet is fed. This volume flow ensures a constant mixing ratio between the glass spheres and air in the measurement series of structure C and D.
The loading chamber is surrounded by Helmholtz coils, which are connected in series. An area with a constant magnetic flux density exists between the coils. The single fiber is positioned in this area using a fiber holder, which ensures that a constant magnetic flux density acts along the fiber axis. As shown in Figure 1, the fiber is fixed at one end and its axis is aligned parallel to the earth’s gravitational field. The inflow is perpendicular from right to left. If the fiber is magnetized by the external field, the deflection of the fiber occurs to the right (X-axis), against the inflow, and is perpendicular to gravity.
The magnetizable single fiber has a defined start position and a stop for the fiber end (see Figure 1). To support the detachment of the particle structures from the fiber, the loose end of the fiber may collide against the stop. The loose end of the fiber is guided in vertical direction and the guide width can be varied between w = 0.5 mm and w = 5 mm. In this experiment, the guide width was always w = 0.5 mm. The impact of the guidance on the fiber movement is negligible, which was investigated in a previous study [26].
Since the fiber is only fixed on one side and has a loose end, it is not possible to position it exactly perpendicular to the magnetic field. The initial angle of the fiber to the field lines varies in the range of α = 87.4–89.5°, which was determined in [26].
By applying two different current strengths, I = 2 A and I = 3 A, which correlate with magnetic flux densities of B = 27.7 mT and B = 38.5 mT, the ferromagnetic fiber is magnetized and experiences a torque. Due to the fixation at one fiber end, a deflection and bending of the fiber results. With increasing currents, the fiber is accelerated faster, which has a corresponding effect on the detachment behavior of the particle structures from the fiber. Investigations on the magnetic properties of the fiber material, the homogeneity of the generated magnetic field and the motion behavior are explained in detail in [26]. It was shown that a linear dependence between the magnetization of the fiber material and the applied external magnetic field strength (H = 0–30,000 Am−1) exists. Furthermore, it was shown that the field generated by the Helmholtz coils is homogeneous along the fiber axis. Finally, the efficiency of magnetic-induced regeneration was demonstrated in initial detachment measurements.
In this study, the efficiency of particle detachment from a single fiber was investigated as a function of particle material, particle structure, structure height, flow velocity and frequency of regenerations.
Different particle structures/morphologies were generated by varying the inflow velocity and the particle material (Table 1). The structure height was adjusted by the exposure time. A high-speed camera (X-PRI by AOS Technology lens: NAVITAR 12×) was used to temporally resolve the detachment behavior of the particle structures from the fiber. This also allowed us to observe and quantify the structure heights, the emerging particle structures during loading and the efficiency of regeneration.
The high-speed camera was placed frontal to the sight glass so that the fiber movement in the x-direction was recorded (see Figure 1). The particles were deposited only in a certain area along the fiber cross-section corresponding to the diameter of the inlet pipe (d = 16 mm). Therefore, particle detachment was mainly observed in this section of the fiber. The field of view (FOV) was 6 mm × 17.4 mm and the frame rate was f = 1654 fps. These settings were used for all experiments except the particle structures at Pe = 2.6 × 10⁴. To sufficiently resolve the particle structures at Pe = 2.6 × 10⁴, a field of view of 4 mm × 3 mm and a frame rate of f = 1000 fps were chosen. In order to achieve high contrast in the high-speed images, a diffuse backlighting was used.
The general experimental procedure was identical for all measurements.
  • The particle structure was generated on the fiber with a steady-state flow.
  • The external magnetic field was switched on and the fiber was magnetized and deflected. Regeneration was performed both with and without additional flow.
  • The magnetic field was switched off.
  • The regeneration (step 2–3) was repeated two more times.
In order to investigate the influence of an additional stationary inflow on the detachment, experiments with inflow during regeneration were carried out in addition to regeneration without inflow. In order to represent the application of online regeneration, the same inflow velocities were selected for the detachment as for the deposition (deposition). In addition, a uniform inflow velocity of v = 0.15 m∙s−1 was selected for all particle structures during detachment in order to obtain a better comparison. The velocity v = 0.15 m∙s−1 was determined empirically and corresponds to the lowest inflow velocity at which nothing detaches from the fiber.

2.4. Investigated Particle Structures on a Single Fiber

Figure 2 shows the investigated particle structures on a single fiber which are formed by different transport mechanisms during deposition. The structures were chosen to investigate the efficiency of the magnetic-induced regeneration because of their varying morphology.
Lower inflow velocities during deposition result in more dendritic particle structures, while higher inflow velocities lead to more compact particle structures [32].
For example, Carbon Black has a very dendritic structure at an inflow velocity of v = 0.012 m∙s−1 (A). If the inflow velocity is increased to v = 1.2 m∙s−1, a more compact particle structure is formed (B). The structures of Carbon Black appear more porous than the particle structures of Spheriglass (C, D).
Two particle loading stages (heights of particle structure) were generated for each structure to investigate the influence of increasing inertia. The determination of an average height of the dendritic structure (A) in the diffusion is difficult due to the strongly varying dendrite lengths. Therefore, the height reported here corresponds to the longest dendrites. The height of these particle structures differs from that of the other structures because a certain dendrite length must be reached before detachment can be observed.

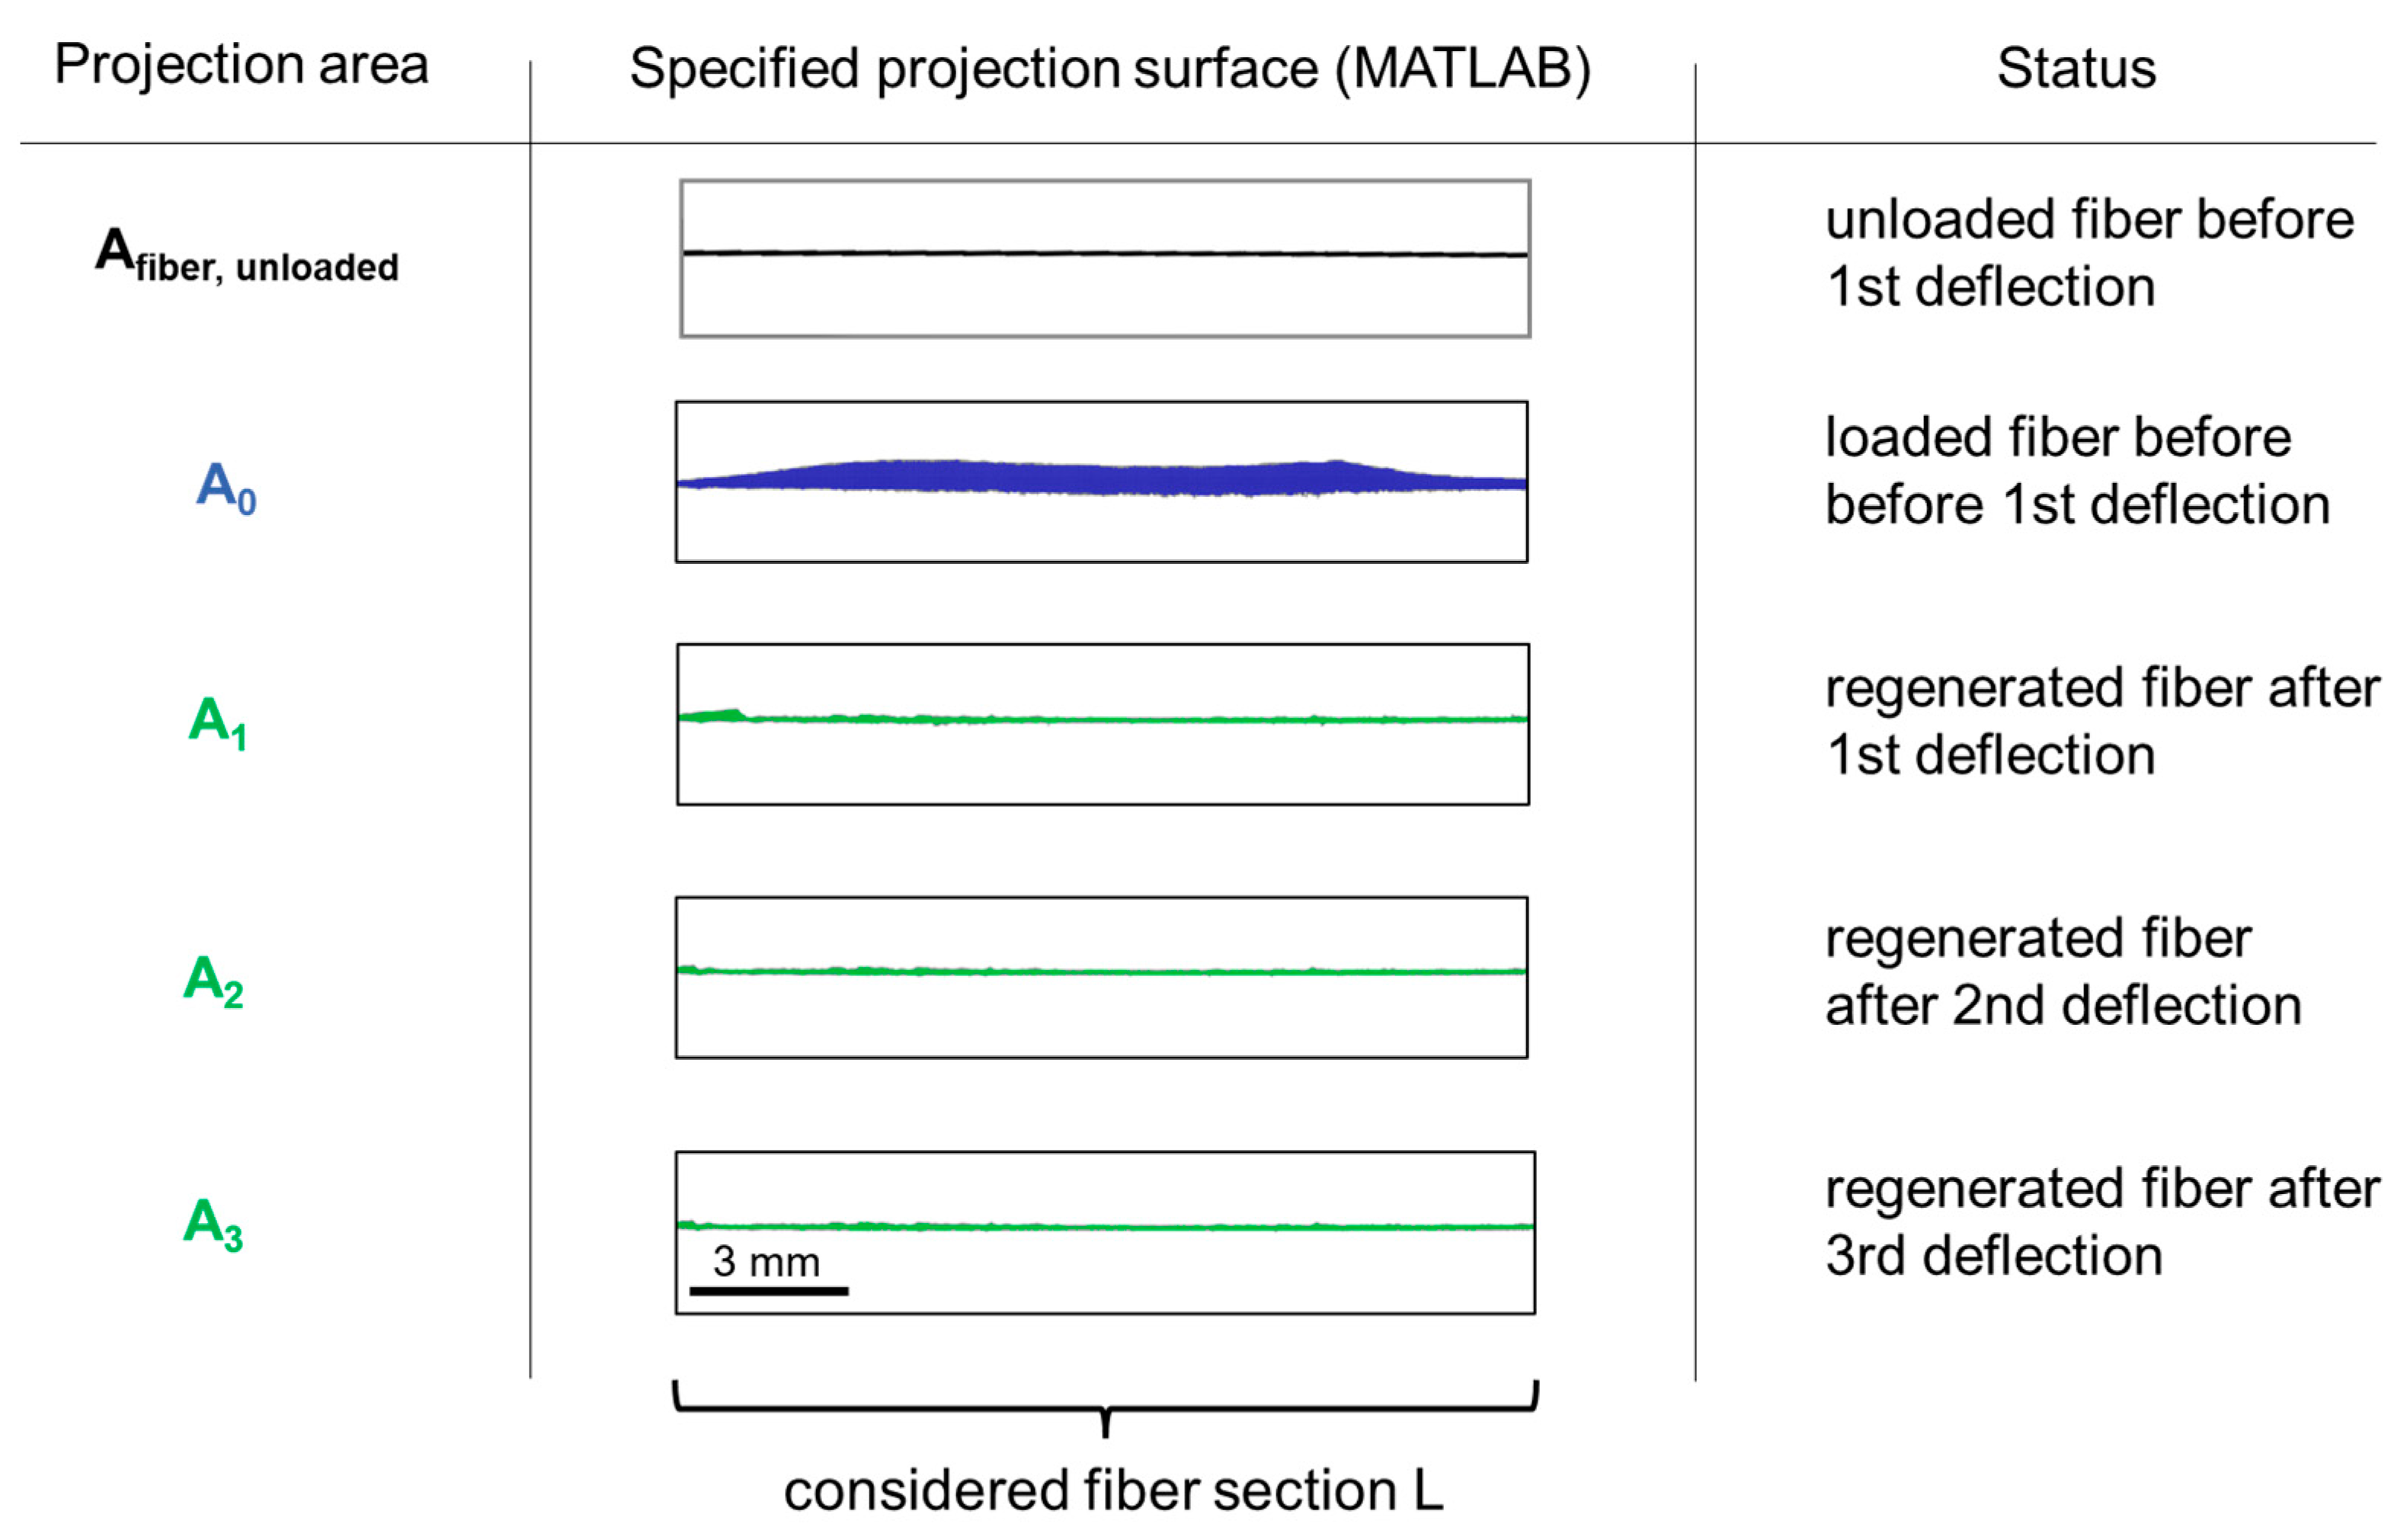
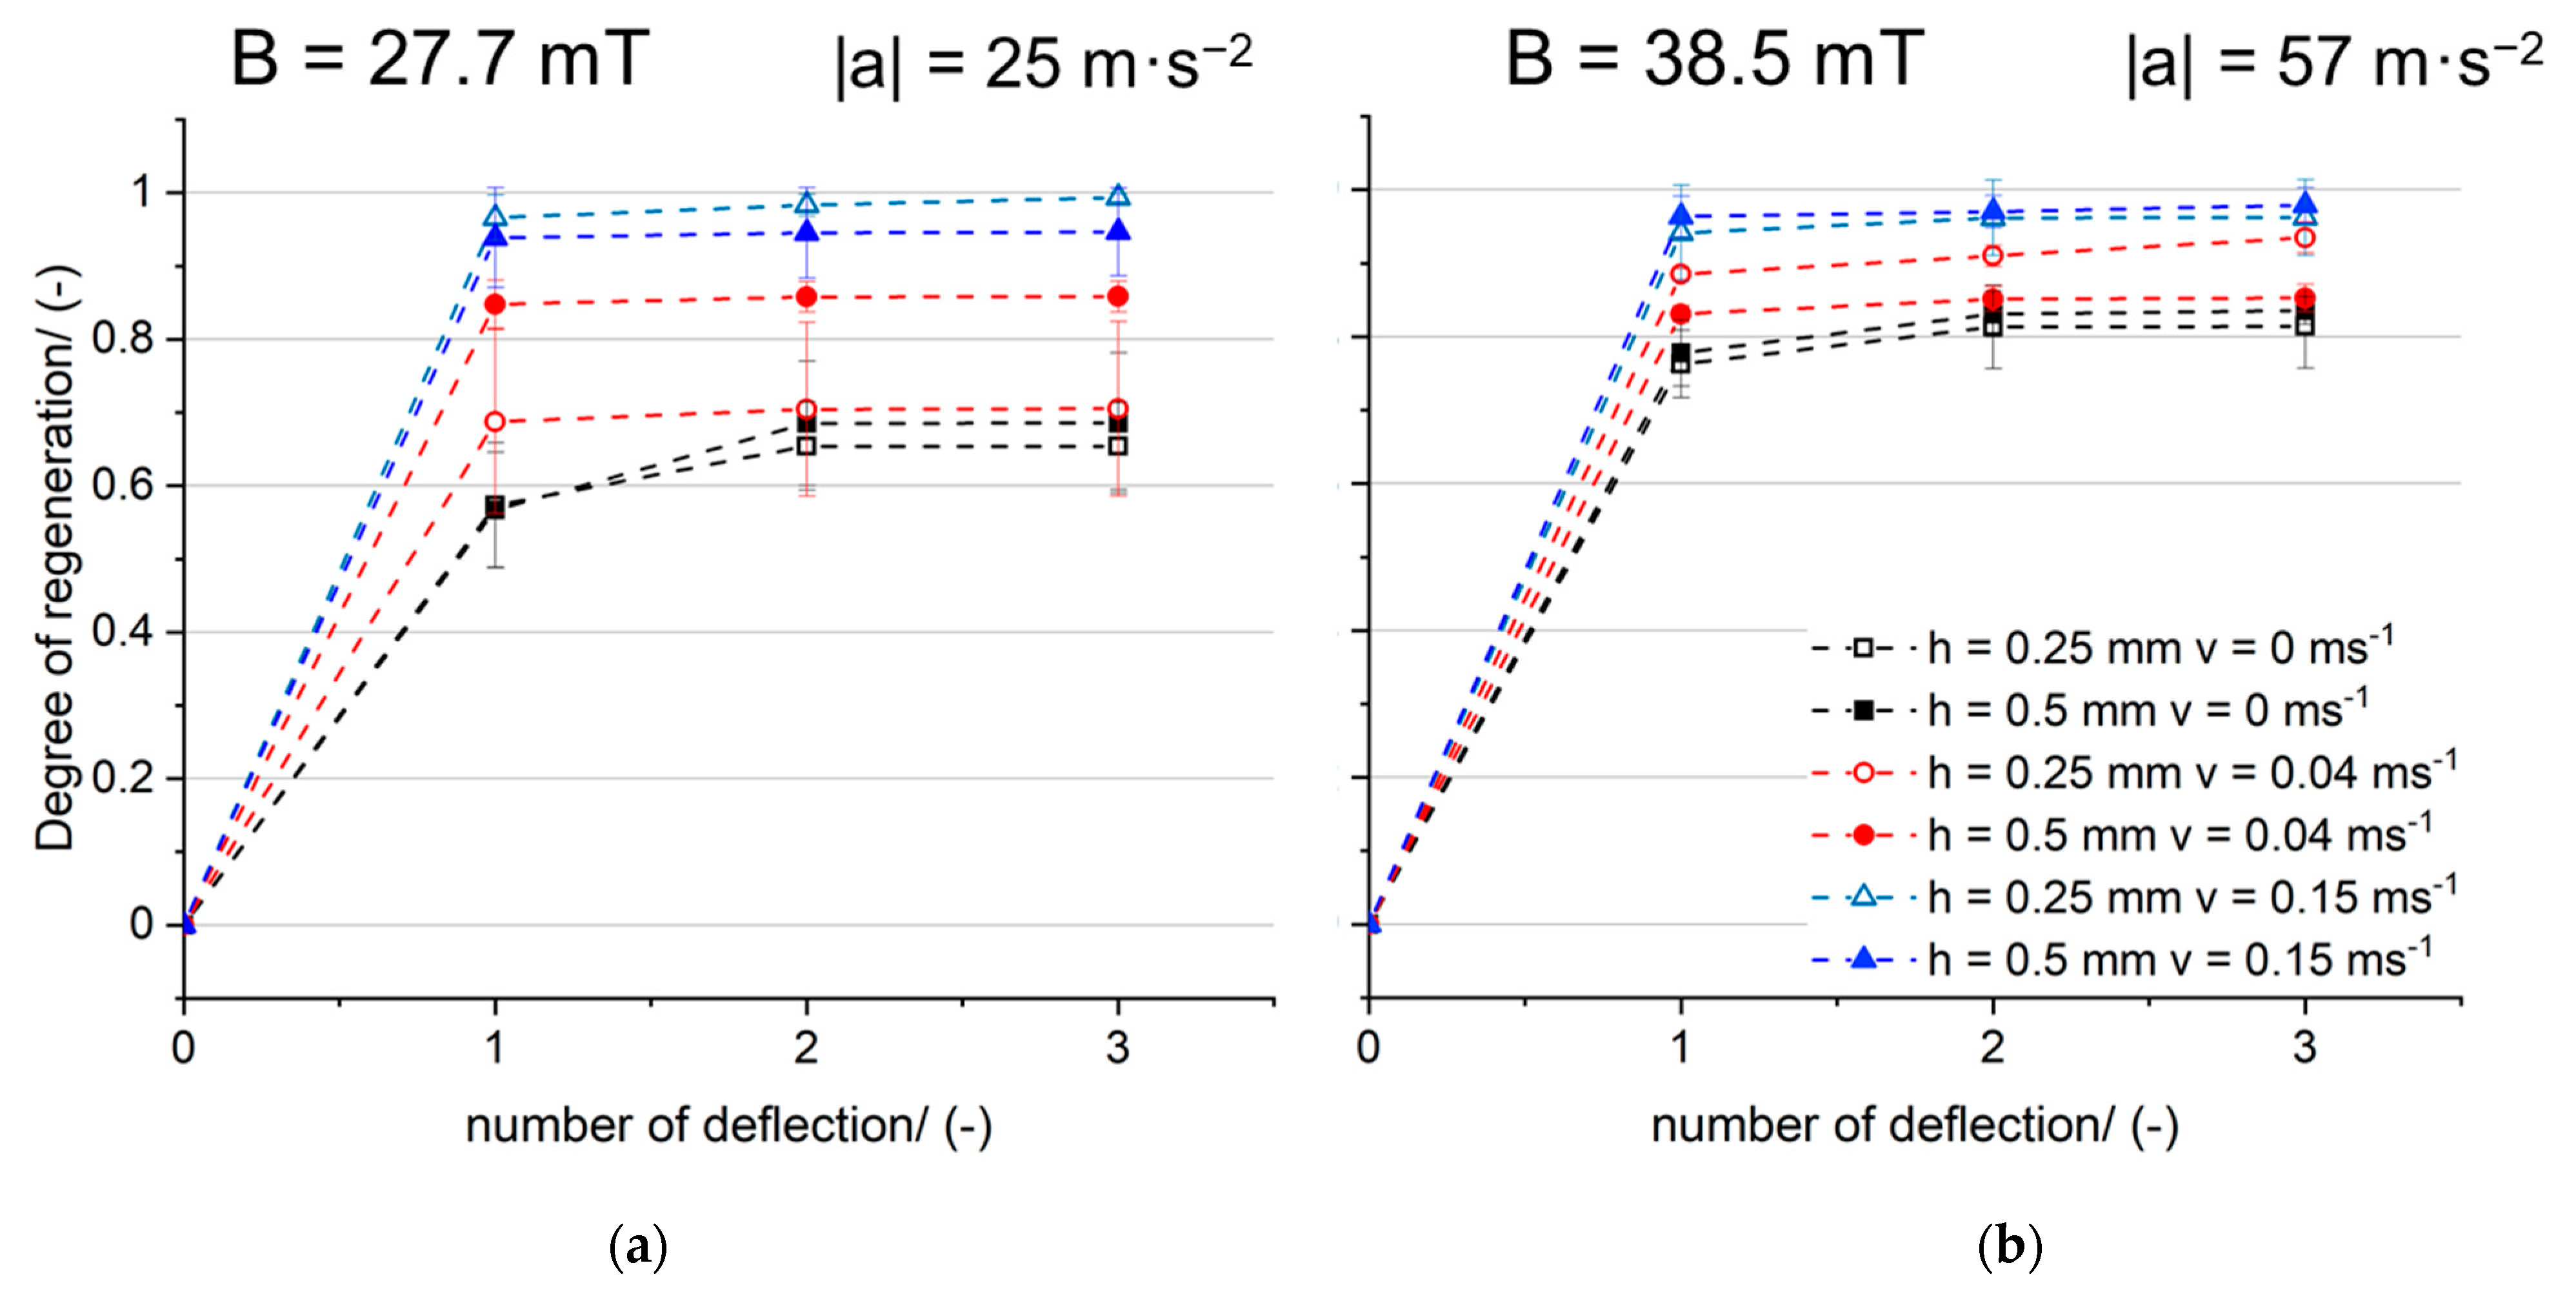
2.5. Determination of the Degree of Regeneration

The projection area of the fiber and particle structure is determined by image analysis. The analysis is based on algorithms of the Image Process Toolbox of MATLAB® R2022b. The methodology has already been used and explained in detail in previous examinations [26].
The binarization of the images is based on the method of Otsu [33]. Using a scale, the bright pixels are counted after binarization and converted to the projection area.
Before loading the fiber with particulate material, the projection area of the unloaded fiber is determined. After loading the fiber with particles, the projection area is determined again. It is composed of the fiber and the particle deposit.
The projection area is determined before and also after each deflection of the fiber.
Figure 3 illustrates the projection areas of the unloaded fiber, the loaded fiber and the regenerated fiber after the respective deflection.
The cumulative detached area is quantified by subtracting the projection area A0+n after each fiber deflection from the projection area of the initially loaded fiber A0. To consider only the projection area of the particle structure, the area of the unloaded fiber is subtracted from projection areas A0 and A0+n, respectively.
The degree of regeneration rn is calculated by relating the projection area of the cumulative detached particle structure after n fiber deflections (A0A0+n) to the initial projection area A0 of the particle structure on the fiber before the first deflection.
The degree of regeneration can be calculated for each individual fiber deflection in accordance with Equation (3). It describes the percentage of the cumulative detached projection area after each fiber deflection.
r n = ( A 0     A 0 + n ) ( A 0     A F i b e r , u n l o a d e d )

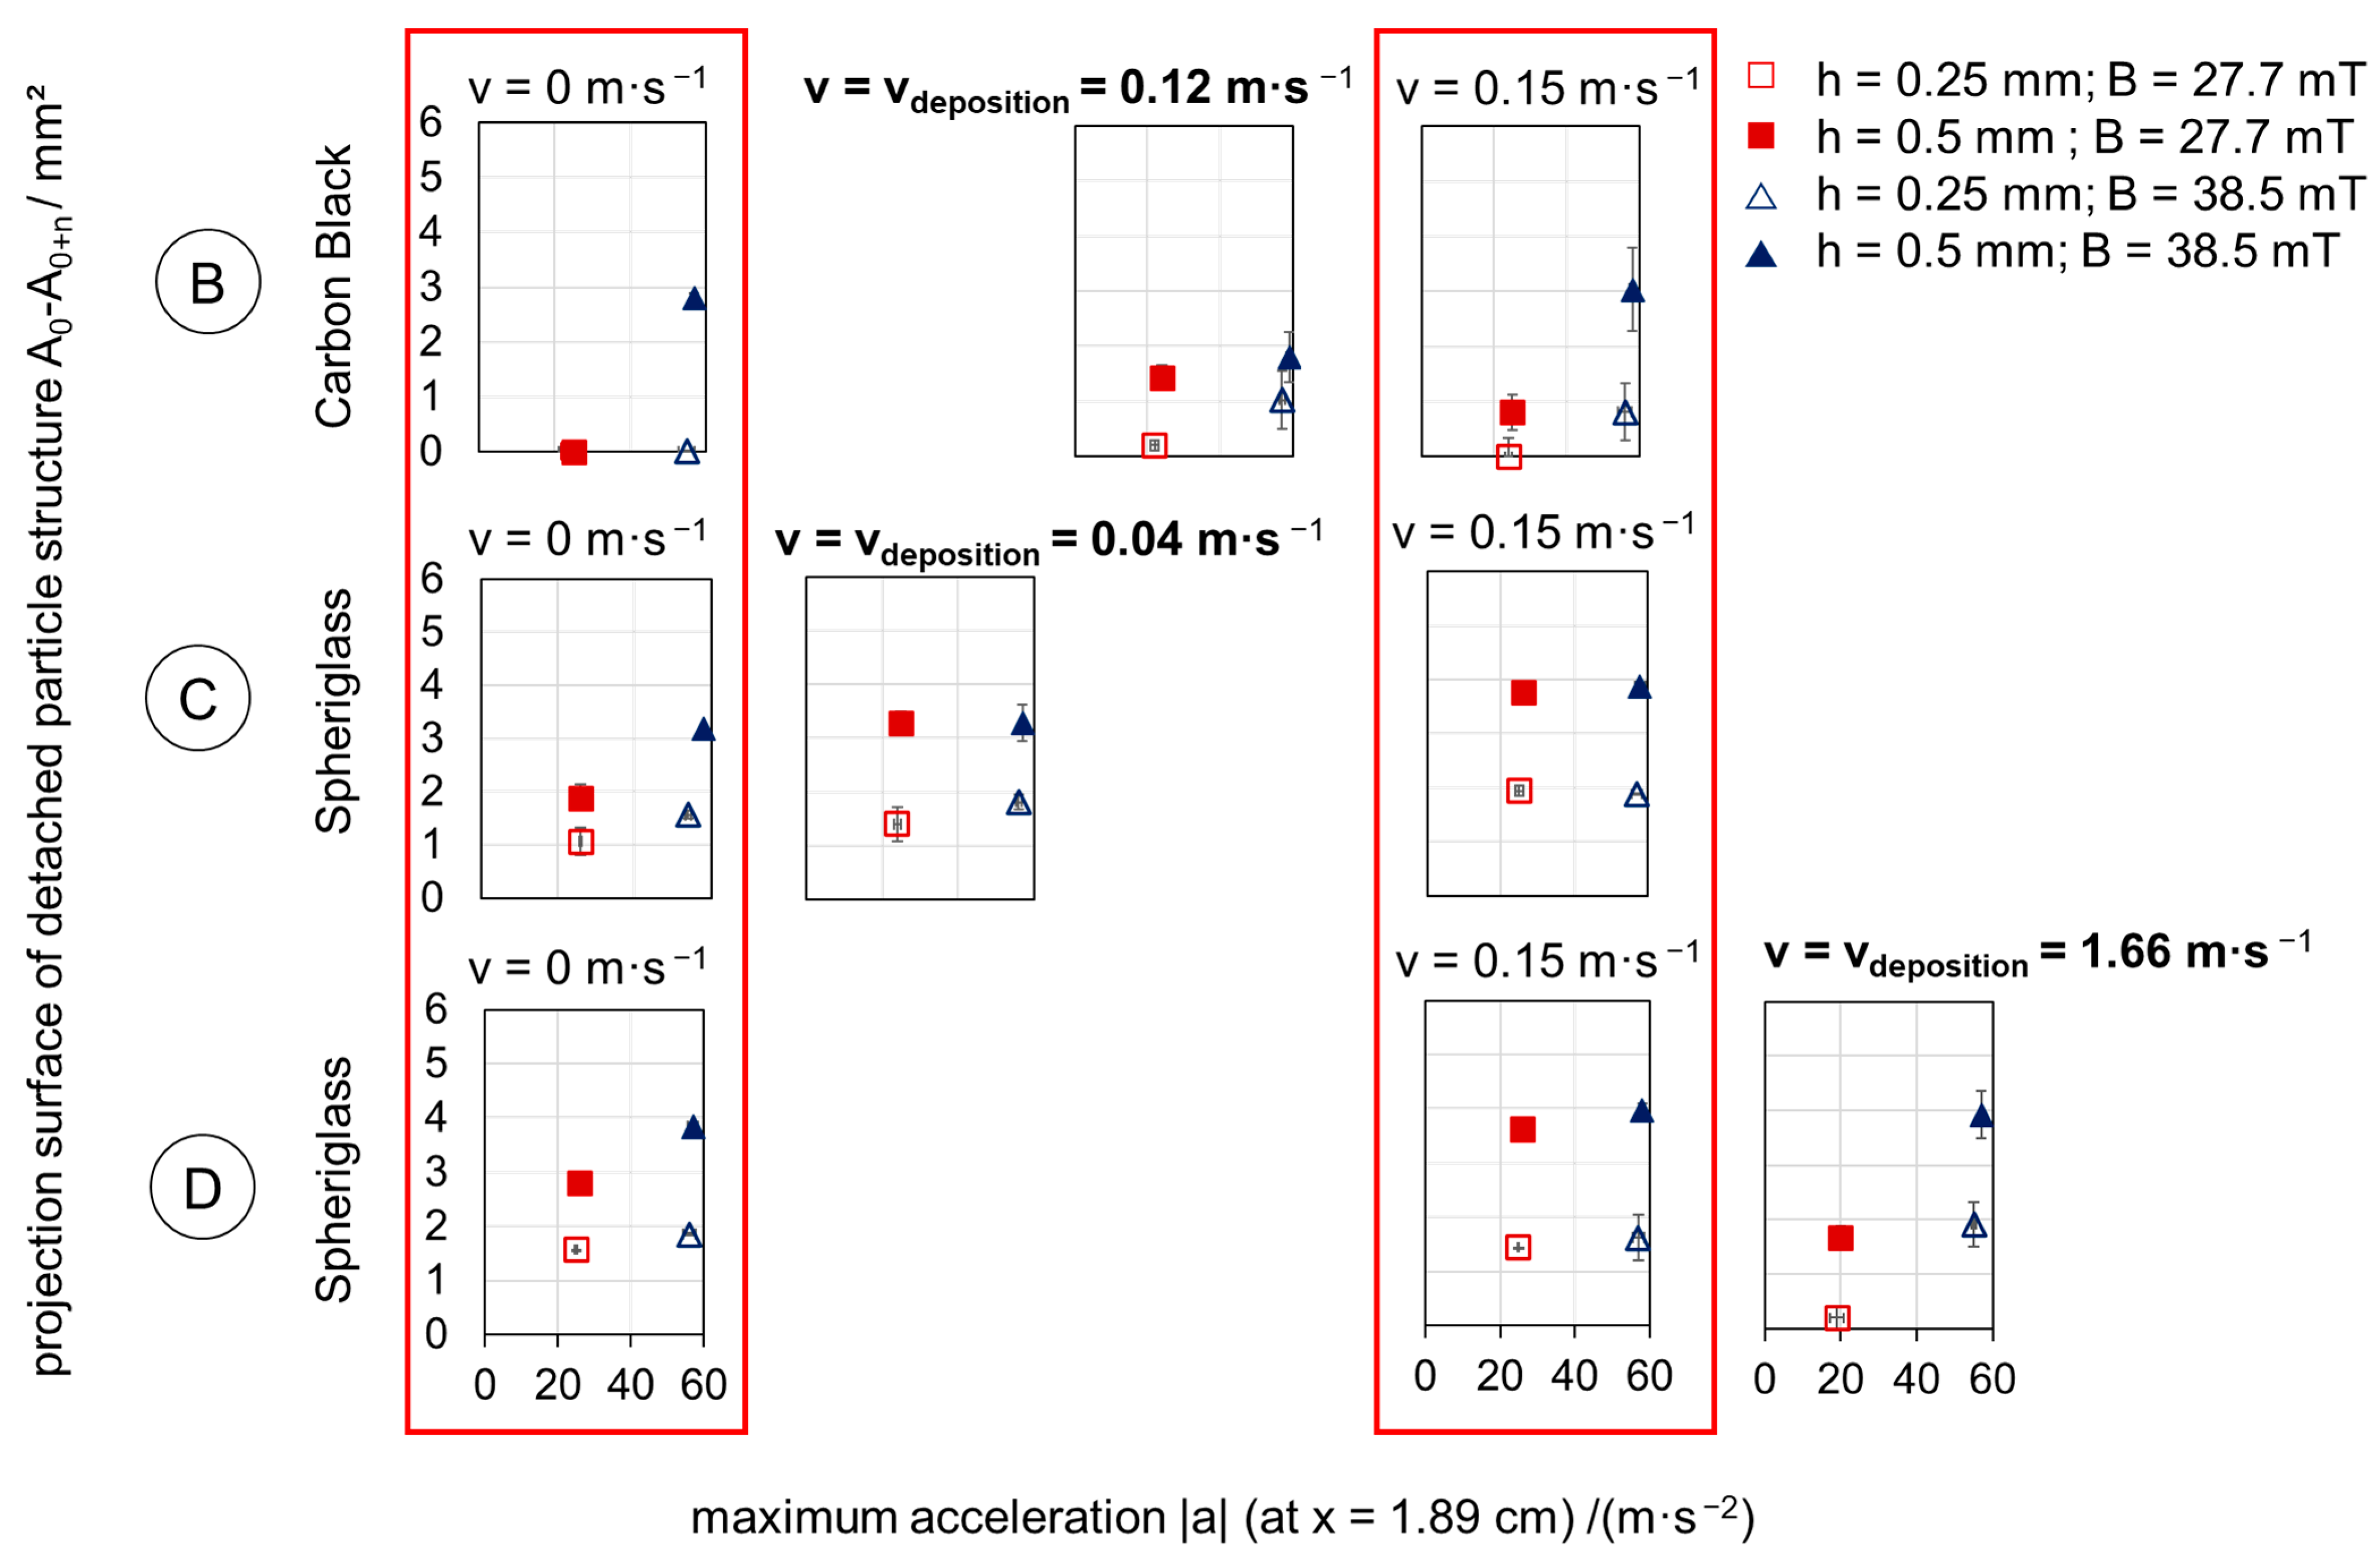
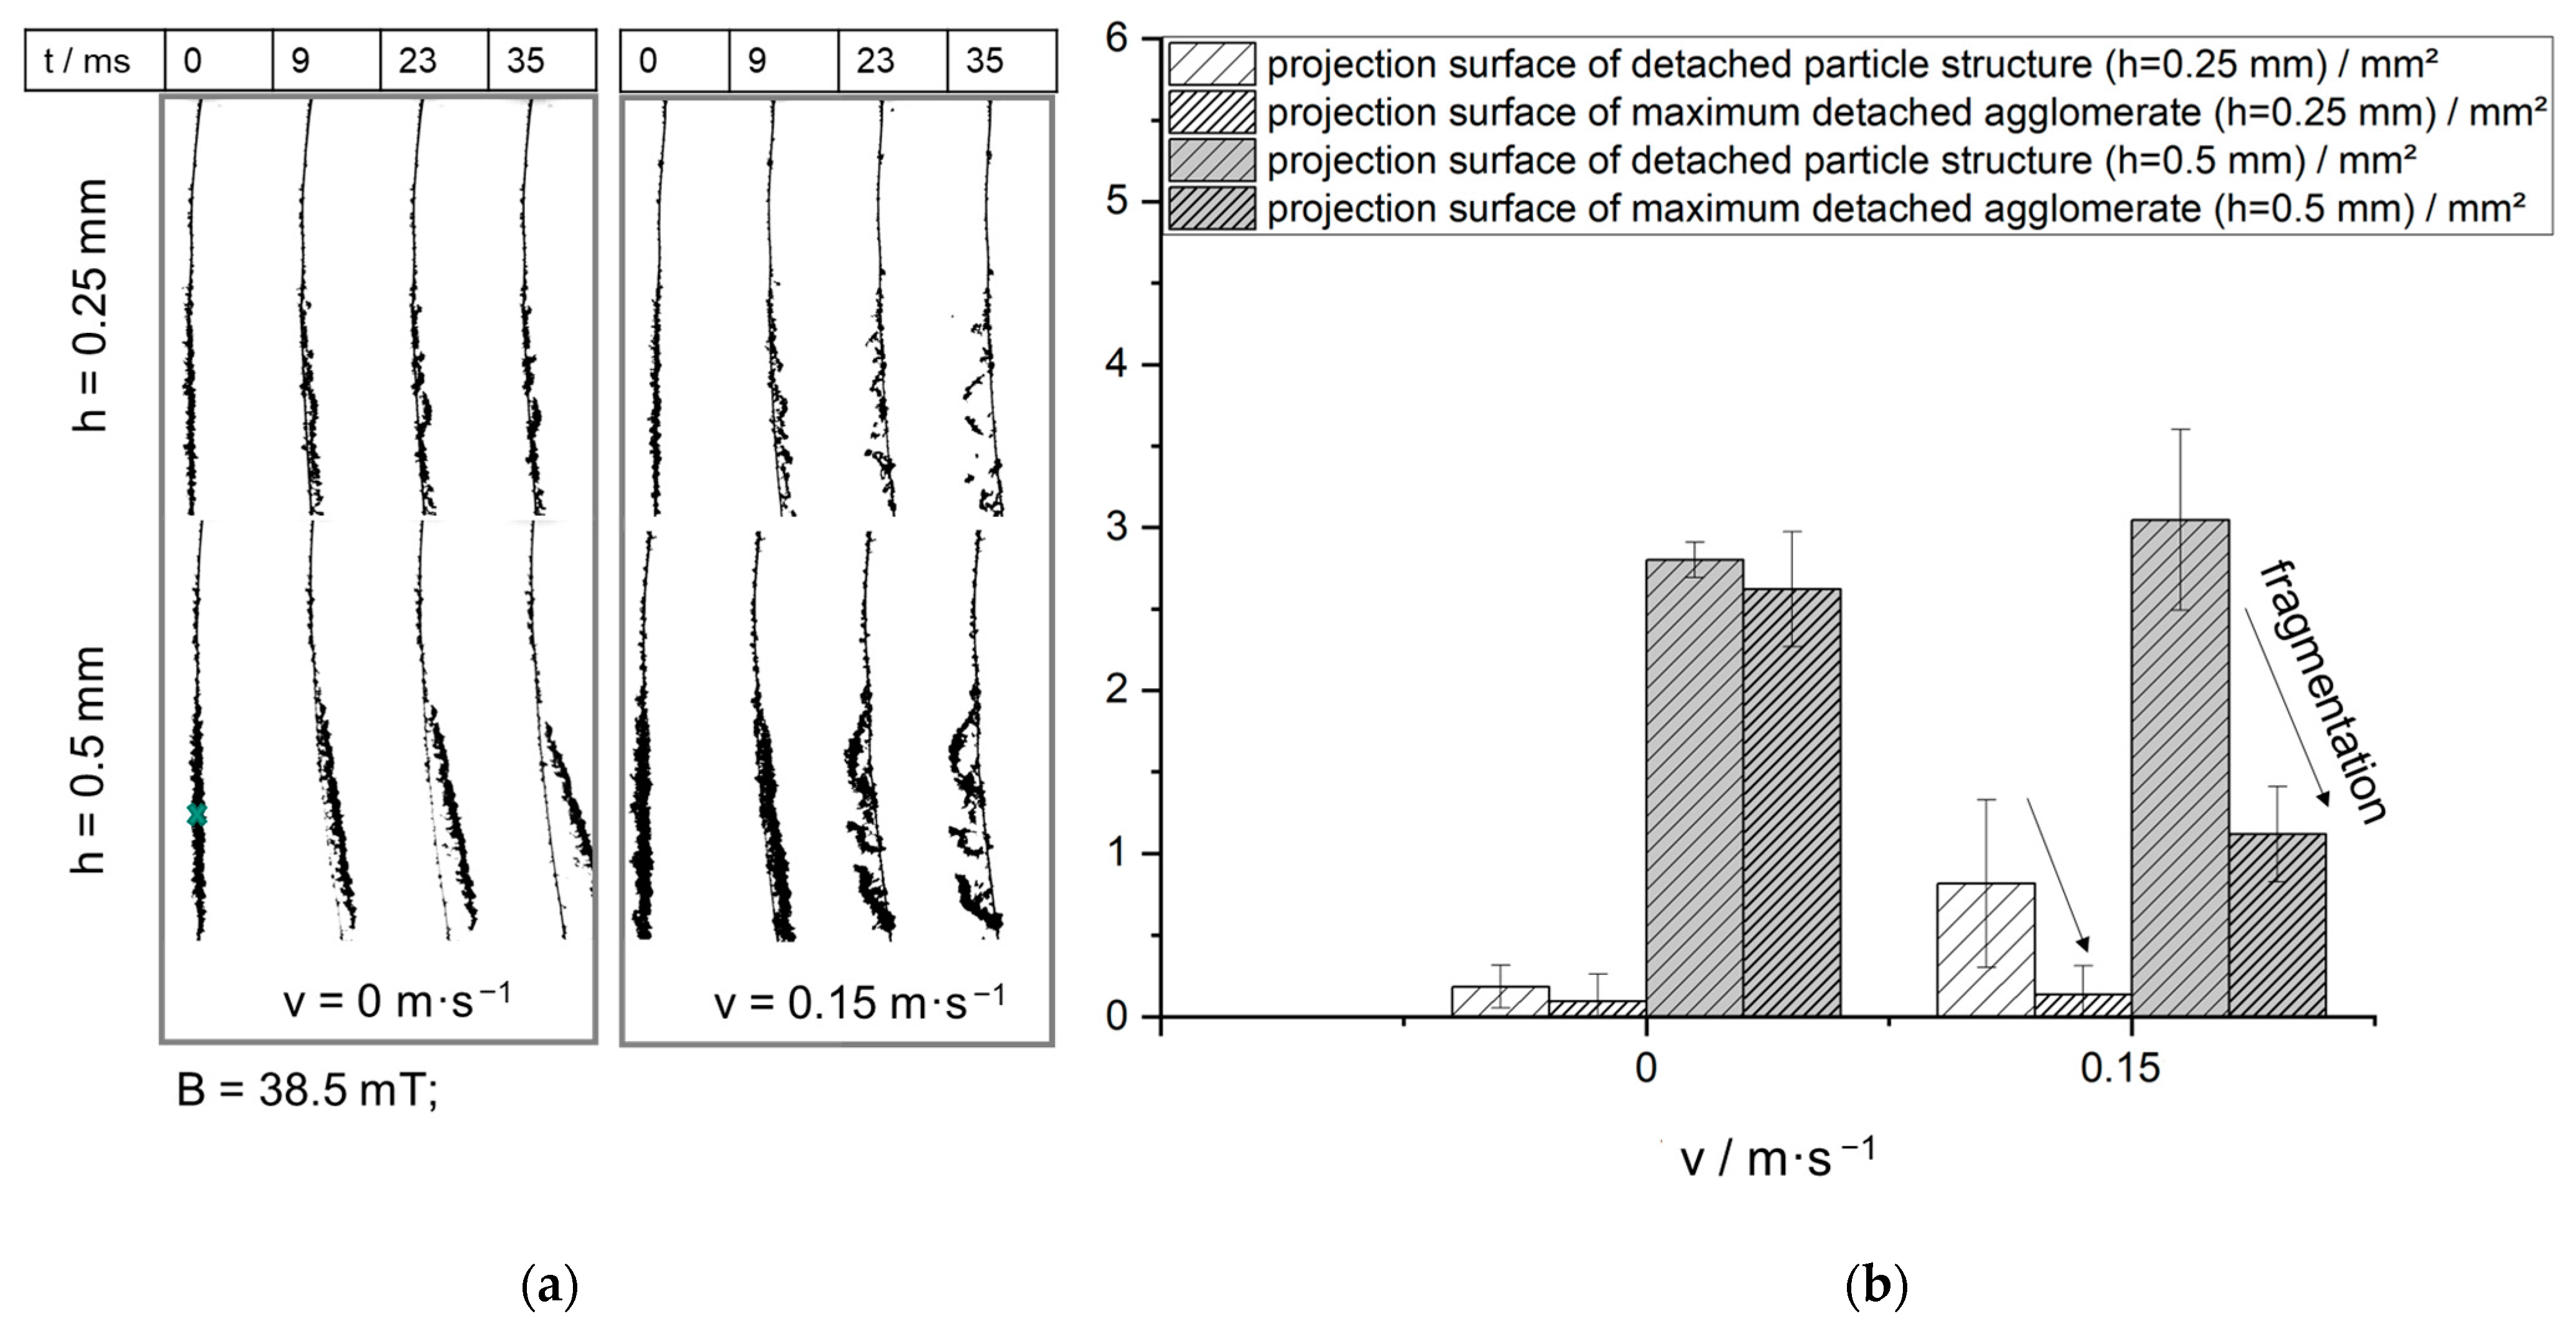
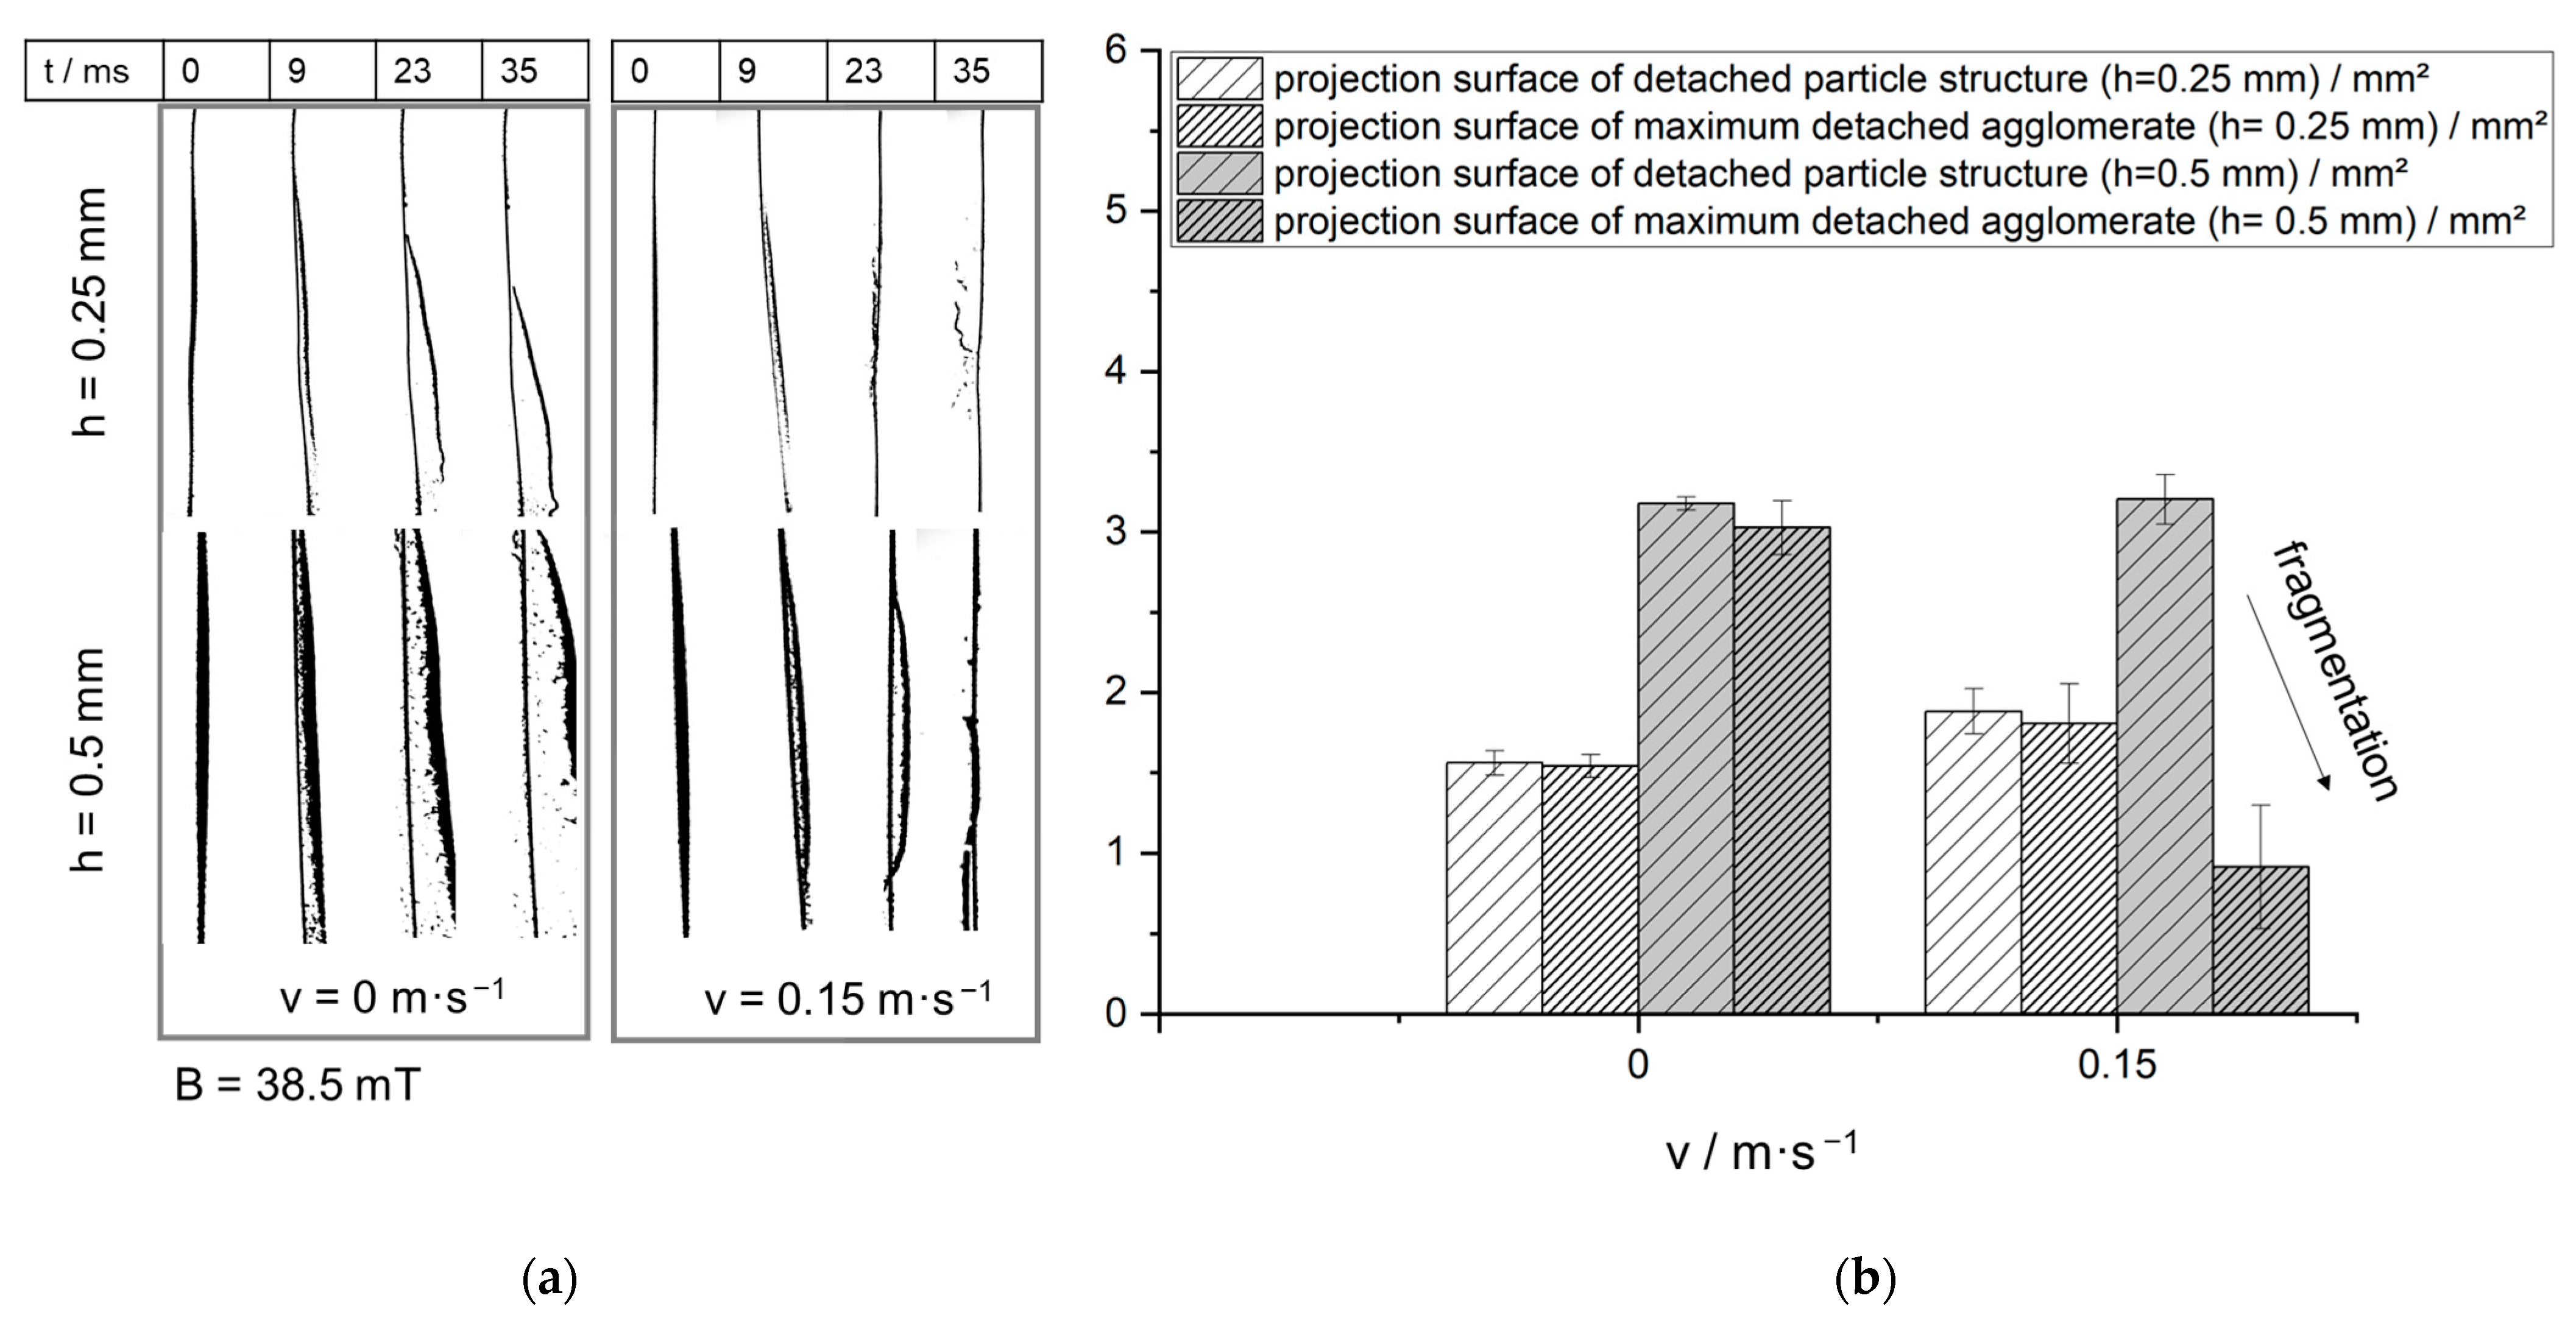
2.6. Determination of the Projection Area of Detached Agglomerates

Video analysis based on MATLAB’s® Motion-Based Multi-Object Tracking code (R2022b) [34] detects the projection area of detached particle agglomerates. Figure 4 shows two examples of agglomerate tracking at time t = 25 ms after the onset of fiber deflection. The detached and detected particle structures are marked by a yellow frame and an ID number. Agglomerates with a pixel count greater than 20 pixels are assigned an ID number and the projection area is output as a pixel count in a table. The limit of 20 pixels is necessary because mainly background noise is detected in lower size classes. Using a scale, a projection area is calculated from the pixel count. A size of 20 pixels corresponds to an equivalent sphere diameter of d = 348 µm. Since the ejected agglomerates may rotate out of the observation plane or disintegrate during the movement process, the maximum released projection area is evaluated in the first 35 ms after the start of the fiber deflection process.

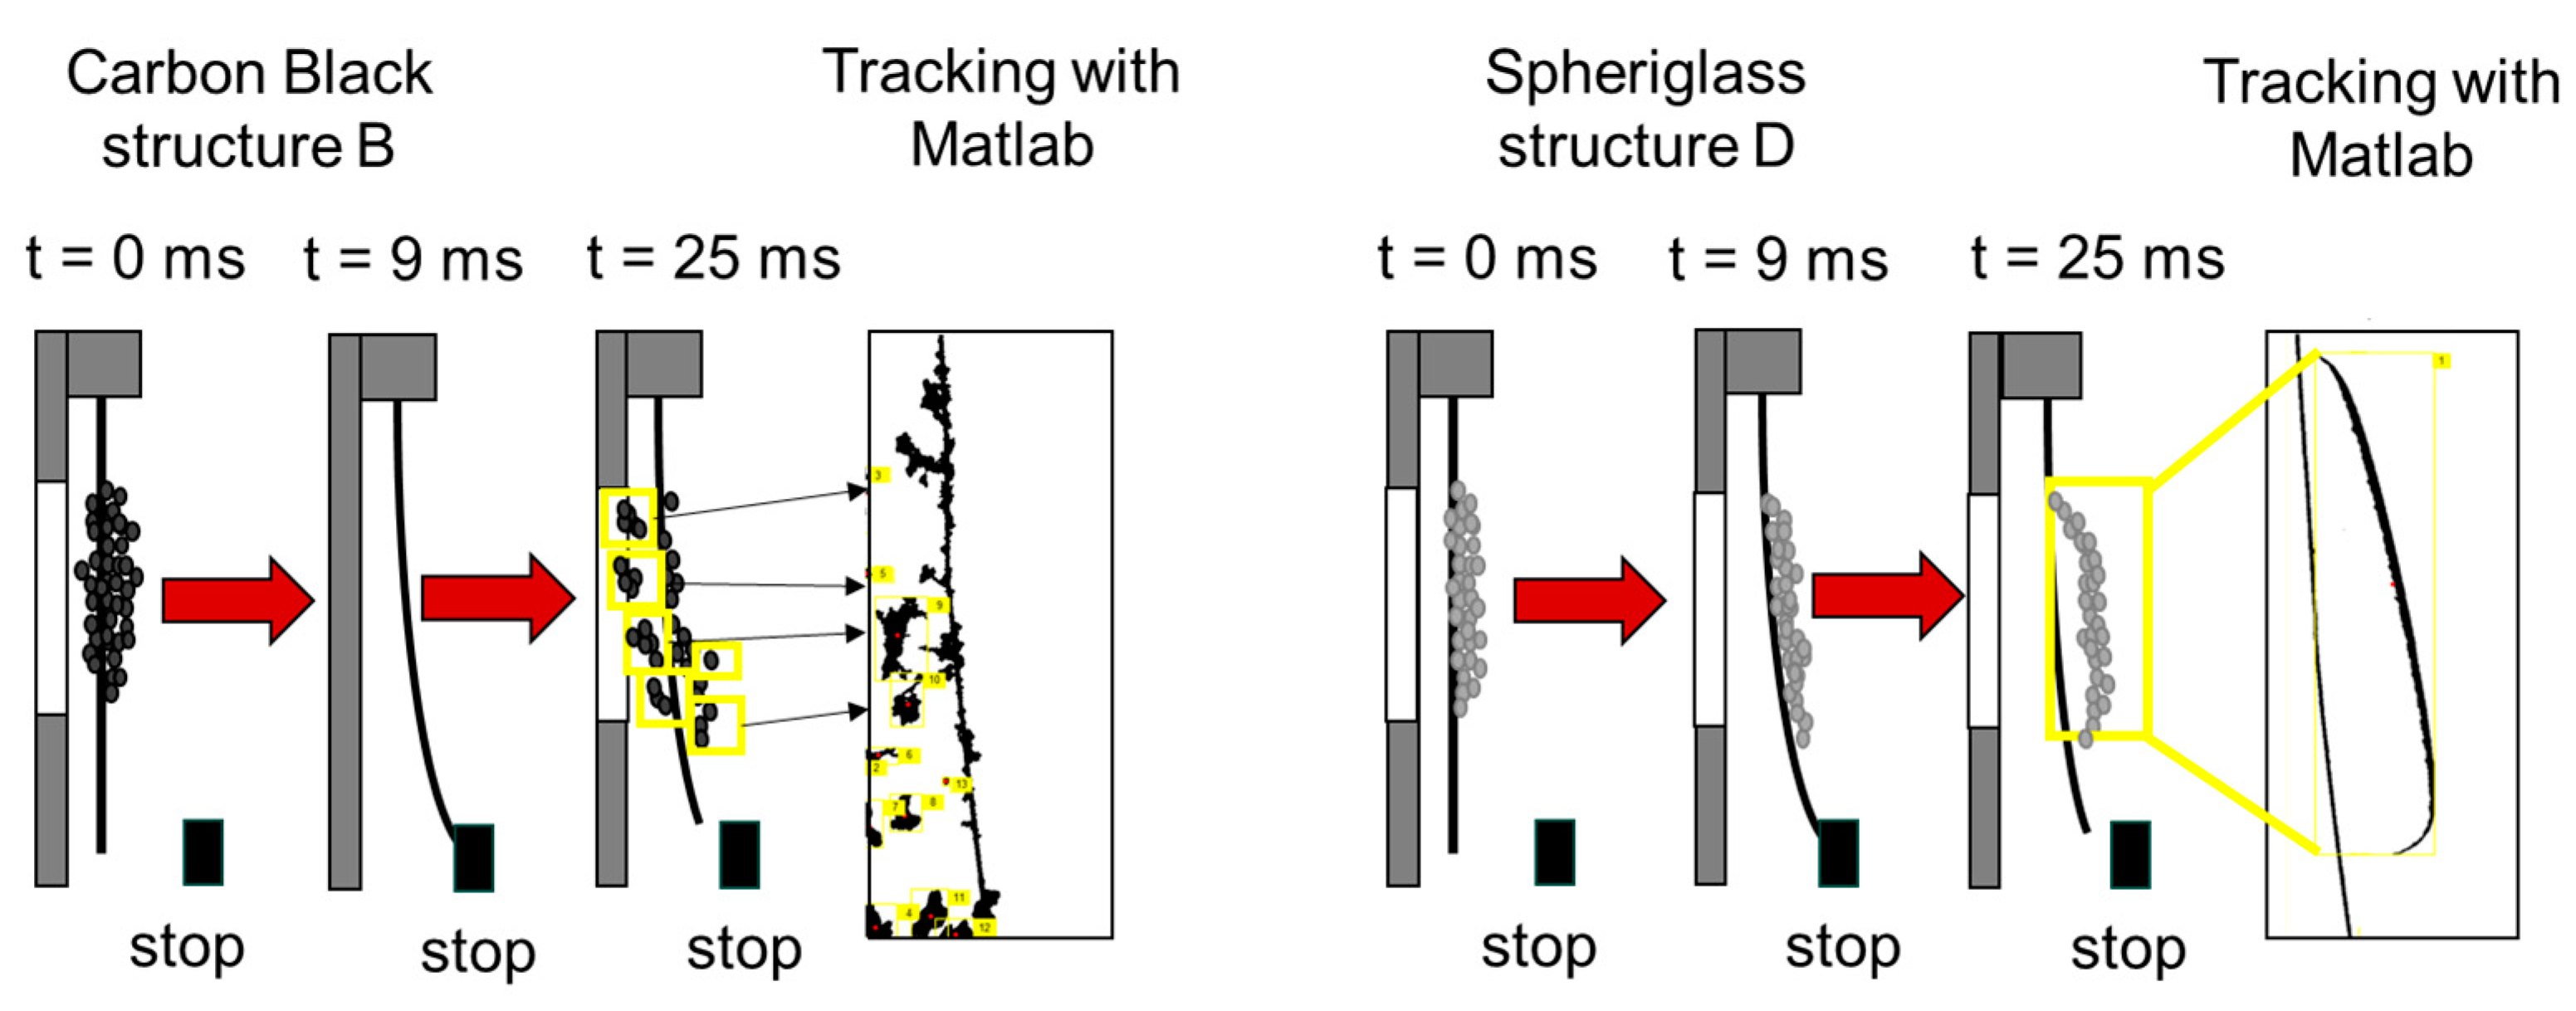
2.7. Determination of the Acceleration for Particle Detachment

A detailed description of the determination of the velocity and acceleration can be found in study [26]. The displacement, velocity and acceleration were tracked at defined positions along the fiber axis in the previous study. It was shown that in the area where the particle structure is located, the acceleration varies from approximately |a| = 30–70 ms−2 when a magnetic flux density of B = 38.5 mT is applied. In this study, the center of the area where the fiber is loaded is tracked (Figure 5). The temporal deflection y of the fiber with the initial position y0 is tracked at the defined position (x = 1.89 cm) with the open-source software Tracker 6.1.0 (Physics Java Framework), resulting in a position-time graph. The velocity curves result from the raw data of the position-time curve of the fiber deflection. Since small deviations during tracking lead to large scattering of the velocity data, these values are smoothed using a moving average over ten values. Acceleration is calculated by differentiating the smoothed velocity values.
The maximum acceleration that occurs directly at the point x = 1.89 cm on the fiber axis after the fiber hits the stop (t > tstop) serves as a reference. The maximum acceleration does not occur at the time of the hit the stop, since the fiber still bends somewhat after the impact. The acceleration is determined at different magnetic flux densities. A correlation between the degree of regeneration and the acceleration (x = 1.89 cm) of the particle structure makes it possible to draw conclusions about the effectiveness of the detachment.

3. Results

3.1. Single Deflection of the Fiber

Figure 6 shows image sequences of the single deflection for the four particle structures when a current of I = 3 A (B = 38.5 mT) is applied to the Helmholtz coil. On the left, the particle structures are shown at the lower particle loading stage and on the right at the higher loading stage. In general, it can be seen that the particle structures do not detach from the fiber during the deflection process (t < 9 ms) until the fiber hits the stop. As expected, the detachment behavior of the different particle structures varies.
Image sequence A shows the detachment of the fiber at an inflow velocity of v = 0.012 m·s−1, which corresponds to the inflow velocity during the deposition process (v = deposition). It was not possible to turn off the inflow during regeneration, as this would cause the dendrites to collapse, resulting in a different structure. This behavior of the dendrites is discussed in a previous study in [27].
The image sequences B–D show the magnetically induced particle detachment without an additional inflow.
In the case of the more dendritic particle structure A of Carbon Black, several individual dendrites detach at the lower particle loading stage on the fiber (low particle structure—A left). At the higher particle structure, the dendrites become more branched, denser and slightly longer than at the lower loading stage. In the case of the higher particle structure, larger dendrites detach sporadically (A—right). The detachment occurs due to flow forces rather than inertial forces, since only the outward projecting dendrites and not the entire particle structure is detached.
With the more compact and less dendritic particle structure, the particle structure B of Carbon Black only detaches at the larger particle loading stage (h = 0.5 mm) after the first deflection of the fiber.
The impact of inertia correlates with the particle loading stage on the fiber. This is crucial for more efficient particle detachment of the fiber. At a higher particle load on the fiber, inertia forces are higher, so the higher particle structure is more easily detached (B—right). For the slightly dendritic (C) and compact (D) particle structures of Spheriglass (interception/inertia area), the particle structures detach from the fiber at both particle loading stages. Here, the inertia of the lower particle loading stage of the structures is sufficient for detachment. In addition to the density, which is 1.4 times higher for Spheriglass than for Carbon Black, the particle structures of Spheriglass also visually appear more compact.
The efficiency of particle detachment (degree of regeneration) after repeated fiber deflections (regenerations) is shown in Section 3.2.
In the following, the total detached projection area after one regeneration for the different particle structures and with additional inflow velocities during the regeneration is presented as a function of the maximum acceleration at fiber position x = 1.89 cm (Figure 7).
The points in the diagrams represent the average value from three repeated experiments. The deviations between the experiments are shown as error bars.
Since the dendrites of the structures (A) attach to the fiber during regeneration and thus, the strongly changed projection area leads to artifacts in the image evaluation, only the results for the three remaining particle structures (B–D) are shown here.
In general, the maximum acceleration of a single fiber—measured at position x = 1.89 cm on the fiber axis—is about |a| = 25 m·s−2 at a magnetic flux density of B = 27.7 mT, while it is about |a| = 57 m·s−2 at B = 38.5 mT.
With increasing loading stage of the particle structures, the inertia rises and more particle structures detach, with the exception of structures formed by Carbon Black. At v = 0 m∙s−1 and an acceleration of approx. |a| = 25 m∙s−2, both particle loading stages of Carbon Black detach similarly poorly without additional inflow. Comparing the particle structures at v = 0 m∙s−1 (influence of the inflow on the detachment excluded), the detachment tends to improve with increasing acceleration. A higher acceleration results in 1.5 times larger detached projection areas (C, D).
An additional inflow during detachment also increases the efficiency to a certain extent. For example, increasing the inflow velocity (C) from v = 0 m∙s−1 to v = 0.04 m∙s−1 improves the detachment by approximately 20%, especially at the lower magnetic flux density. If the inflow is too high, a deterioration of or, at higher accelerations, a detachment of similar magnitude is observed (see Figure 7D—v = 1.66 m·s−1). The flow force acts against the acceleration force of the fiber, causing the particle structure to be pressed back against the fiber during the detachment process and also reduces the acceleration of the fiber (see Figure 7D). These effects rise as the incident velocity increases. Consequently, the detached projection area (D—red square dots) decreases. If the magnetically induced acceleration of the fiber is sufficiently higher, the regeneration is hardly improved by increasing the inflow velocity (D—blue triangular dots). This results in a similarly high detached projection area.
Comparing the different particle materials, Carbon Black shows poorer detachment than Spheriglass, especially at lower acceleration. It is already known from Figure 6B that the low particle structures cannot be detached at B = 38.5 mT. As expected, they also do not detach at the lower acceleration (|a| = 25 m·s−2) at B = 27.7 mT.
In the following, the size of the detached agglomerates and the degree of fragmentation are examined. Since the image analysis is limited by the pixel size, as mentioned before, it is not possible to determine the actual minimum particle size (projection area) into which the agglomerates break down. Therefore, the focus of the evaluation is on the largest detached agglomerate.
In Figure 8, Figure 9 and Figure 10, the total detached projection areas of the particle structures are compared with the area of the largest detached agglomerate after the first regeneration. An illustration of the detachment process is shown on the left. Only measurements conducted at the same velocity (v = 0 m·s−1 and v = 0.15 m·s−1) are compared. The determination of the maximum agglomerate size is always determined in the first 35 ms after the detachment process for all image evaluations. Further fragmentation is not considered. Each bar in the diagrams represents the average value from three repeated experiments. The deviations between the experiments are shown as error bars.
Generally, several behaviors are observed when the structures are detached. In most cases, the structure detaches as one large agglomerate. Occasionally, small agglomerates also detach from the structure. In addition, it was observed that after detachment, the particle structure hits the fiber again during sedimentation and then either a fraction of the agglomerates reattaches to the fiber or disintegrates into small agglomerates after impact. It is also possible that the detached structure fragments without coming into contact with the fiber.
The particle structure B of Carbon Black (Figure 8) exhibits hardly any fragmentation without an additional inflow during regeneration. At the larger loading stage, the particle structure is thrown off almost as a coherent structure. In addition, small agglomerates detach from the fiber in a few cases. With additional flow, the structure detaches again at the time of impact as approximately one large agglomerate. However, it is pressed once again against the fiber by the flow forces and disintegrates into individual agglomerates. In some cases, a reattachment of individual fragments is also observed in the experiments.
For the particle structure C of Spheriglass (Figure 9), a slight fragmentation is observed at v = 0 m·s−1, especially at the higher particle loading on the fiber. The majority of the particle structure is detached from the fiber during regeneration as a coherent agglomerate. In addition, many small agglomerates are formed with a very small fraction of the total detached area. To a smaller extent, this is also seen in the lower particle structure. The proportion of small fragments of the total detached particle structure is lower for this structure than for the larger particle structure. At v = 0.15 m·s−1, the degree of fragmentation is higher than without an inflow. This applies to both loading stages. Both particle structures are first detached against the inflow direction and subsequently pressed against the fiber by the flow forces, comparable to the particle structure B in Figure 8. Due to the renewed impact on the fiber, the particle structure disintegrates into a few large and a few small agglomerates.
The total detached projection area of the particle structure D of Spheriglass (Figure 10) is approximately equal to the largest detached agglomerate size at v = 0 m·s−1. This observation occurs at both the low and high particle loading stages. Thus, little fragmentation occurs. On the other hand, when the flow is applied during regeneration, a clear fragmentation of the particle structure is determined. Once again, the particle structure is detached as a coherent structure and is pressed against the fiber by the flow. The impact causes the structure to break up into smaller fragments. The larger the loading stage, the fewer small fragments created during detachment with additional flow.
The results indicate that the fiber acts like a kind of agglomerator. During regeneration, the structures are more likely to detach as a large coherent structure and less likely to detach as many small agglomerates. The detached structures could, for example, be deposited in a later process step.

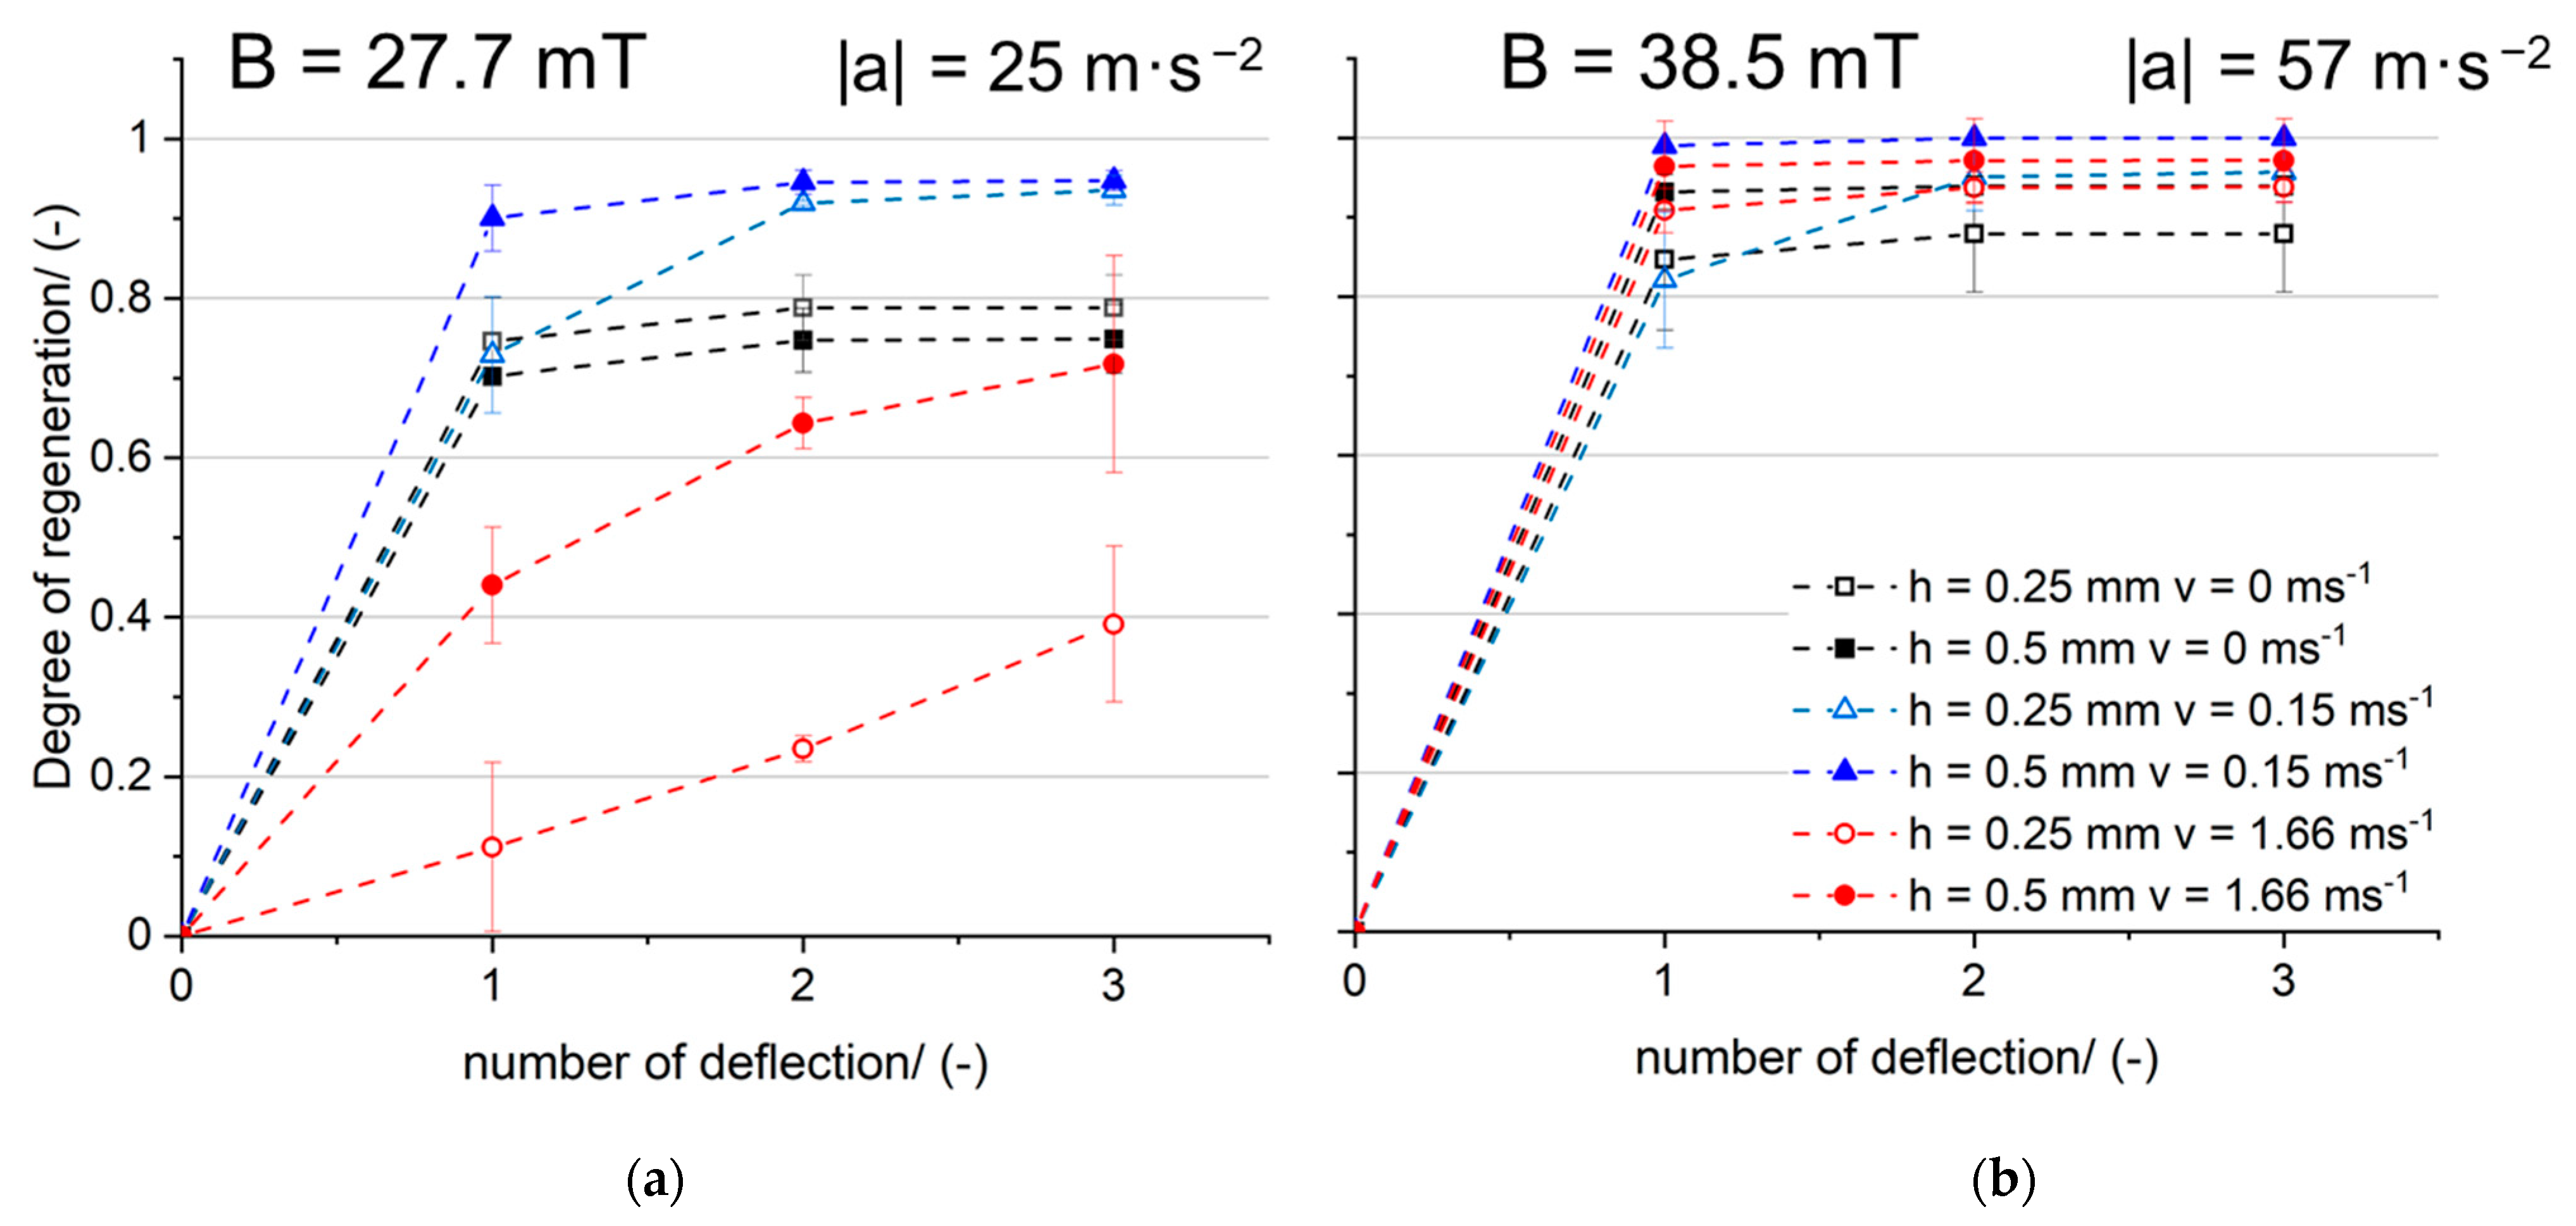
3.2. Repeated Deflections of the Single Fiber

In this section, it will be demonstrated that, by deflecting the fiber repeatedly, the degree of regeneration can be improved.
Figure 11, Figure 12 and Figure 13 illustrate the achieved cumulated degrees of regeneration for the previously considered particle structures concerning the number of regenerations. The black square symbols represent the experiments without inflow and the blue triangular symbols signify additional inflow at a velocity of v = 0.15 m·s−1. The red round symbols represent the experiments with an inflow velocity corresponding to the inflow velocity (v = vdeposition) during particle deposition on the fiber. In the diagrams on the left, the magnetically induced deflection of the fiber occurs at B = 27.7 mT and on the right at B = 38.5 mT. As mentioned above, these magnetic flux densities correspond to accelerations of about |a| = 25 m∙s−2 and |a| = 57 m∙s−2 after the time of impact at the fiber position x = 1.89 cm. Each point in the diagrams represents the average value from three repeated experiments.
When structure B of Carbon Black is regenerated (Figure 11), the results of the repetition measurements vary greatly. At a lower acceleration, without inflow, the achieved degree of regeneration after three deflections for the higher loading stage is about 30% higher than at the acceleration of |a| = 57 m∙s−2. An additional inflow during detachment (B = 27.7 mT) leads to a regeneration degree that is approximately 66% lower at the low loading stage than without inflow. At the low particle loading stage, the inertial forces are not sufficient for complete detachment of the particle structure. In addition, flow forces act against the inertial forces when additional flow is applied. However, it has been shown that the degree of regeneration can be improved by regenerating the fiber several times. This is due to the fact that rearrangement processes occur during regeneration (see Figure 8—low loading stage for t > 9 ms). In most cases, the resulting particle structures are easier to remove during subsequent regeneration.
The negative degrees of regeneration at B = 27.7 mT can be explained by the rearrangement of deposited structures. The artifact is caused by the enlarged projection surface (A0+n) as soon as a particle structure rotates out of the plane. This causes the degree of regeneration calculated according to Equation (3) to become negative.
At B = 38.5 mT, the additional inflow (v = 0.12 & 0.15 m·s−1) improves the degree of regeneration by about 30%, especially for the lower particle structure. Since the flow velocities of the red and blue curves are of a similar order of magnitude (v = 0.12 and 0.15 m∙s−1), the curves are comparable. The measurement fluctuations are due to rearrangements and the irregular detachment behavior of the particle structures.
Due to rearrangement processes during the first regeneration, similar degrees of regeneration are achieved by regenerating the fiber several times at B = 38.5 mT, as is the case of the structures made from Spheriglass (compare Figure 12b and Figure 13b).
Figure 12 shows the three regenerations for the particle structure C of Spheriglass. The results scatter less than with the particle structures made of Carbon Black. All curves show that the degree of regeneration can hardly be increased after one or two regenerations. The result is an almost horizontal curve. In all measurements, the degree of regeneration increases with increasing inflow velocity during detachment. Without a stationary inflow (black squares) at a magnetic flux density of B = 27.7 mT, the degree of regeneration is approximately 65–70%, depending on the amount of the particles on the fiber. If the inflow velocity during particle deposition is equal to the regeneration velocity (v = vdeposition), a regeneration of 88% for the higher loading stage on the fiber (red circles) is reached. Only a further increase in the inflow velocity to v = 0.15 m·s−1 leads to almost complete regeneration of the fiber.
At B = 38.5 mT, the degree of regeneration is improved by 12% absolute without inflow during detachment (black squares). Correspondingly, as the inflow increases, regeneration degrees close to 100% are achieved.
Figure 13 presents the results for particle structure D of Spheriglass.
This particle structure also achieves higher degrees of regeneration with greater acceleration. At B = 27.7 mT with no inflow, cumulative regeneration degrees of approximately 80% are achieved after three deflections. The degree of regeneration at 27.7 mT without inflow is about 15% higher for the slightly more compact particle structure D than for the particle structure C. Comparing the inflow velocities, it is obvious that with an inflow velocity of v = 0.15 m∙s−1 the regeneration degree increases to around 99%. Since the same degree of regeneration is obtained for the low and high particle loading stages with inflow, the influence of inflow outweighs that of inertia. Even for particle structure D, the degree of regeneration stays almost constant after 1-2 regenerations (except at v = 1.66 m·s−1). Accordingly, it would be sufficient to deflect the fiber twice.
As already shown in Figure 10, for an inflow velocity of v = 0.15 m·s−1, the already detached particle structure is pressed again against the fiber. This behavior increases with increasing inflow velocity. It explains the lower degree of regeneration, especially at the lower acceleration value and higher inflow velocity of v = 1.66 m∙s−1. An inflow velocity of v = 1.66 m·s−1 reduces the efficiency of particle detachment if the inertial forces are not high enough. The inertial forces on the particle structure with the lower height are smaller than those on the larger particle structure. This is reflected in a lower degree of regeneration of approximately 39% for the lower loading stage at B = 27.7 mT.
Increasing the magnetic flux density to B = 38.5 mT improves the regeneration without an inflow by 10% absolute. At an inflow velocity of v = 0.15 m·s−1, regeneration rates similar to those at B = 27.7 mT are achieved. Thus, it would not be necessary to increase the magnetic flux density to B = 38.5 mT to accomplish regeneration degrees of around 95% if the inflow is additionally applied at moderate velocities. The inertial separation is improved by increasing the magnetic flux density to B = 38.5 mT and applying an inflow velocity of v = 1.66 m·s−1. As already mentioned, higher particle loading stages (higher inertia) tend to result in higher degrees of regeneration.

4. Conclusions and Outlook

This study demonstrated the application of magnetic effects for the detachment of accumulated particles of fibrous collectors in gas particle separation. The detachment behavior of particle structures with different morphologies from a single fiber was investigated as a function of the particle loading stage on the fiber, the external magnetic flux density, the inflow velocity and the number of regenerations of the fiber for a certain parameter range.
Compared to other solid–liquid separation applications where magnetic forces are mostly used for deposition, magnetic flux densities are above 1 T. The investigated application in this study requires comparatively low magnetic flux densities for the efficient regeneration of the single fiber.
The main results of this study are as follows:
In most cases, the structure detaches as one large agglomerate. Occasionally, small agglomerates also detach from the structure. For particle structures with outwardly directed dendrites, the dendrites are detached even at low fiber acceleration (simultaneous constant inflow present). This occurs due to flow forces rather than inertial forces, since only the outward projecting dendrites and not the entire particle structure is detached.
In addition, it was observed that after detachment, the particle structure hits the fiber again during sedimentation and then either a fraction of the agglomerates reattaches to the fiber or disintegrates into small agglomerates after impact. It is also possible that the detached structure fragments without coming into contact with the fiber.
The higher the acceleration of the fiber and the greater the inertia forces, the higher the cumulative degree of regeneration. The resulting inertial forces are influenced by the particle material, the particle structure and the height of the structure, as well as the acceleration. Particle structures made of Spheriglass exhibited more consistent detachment behavior than the structures made of Carbon Black. The structures of Spheriglass were significantly easier to detach compared to structures of Carbon Black, despite comparable particle loading stages, especially after the first regeneration. It can be deduced that slightly higher inertia forces act during the detachment of the structures of Spheriglass than in the case of the structures of Carbon Black.
Repeated regenerations improve the degree of regeneration, especially in case of structures made of Carbon Black where low accelerations of approx. |a| = 25 m∙s−2 are not sufficient for efficient regeneration. Repeated deflection of the fiber/regeneration leads to rearrangement processes in the particle structure, making it easier to detach them. In addition, particle agglomerates that have been reattached are usually detached again by renewed regeneration.
In most cases, an additional inflow during fiber regeneration increases the degree of regeneration due to the additional flow forces. Since the inflow is directed against the fiber movement, an excessively high inflow velocity (here: v = 1.6 ms−1) can worsen the regeneration if the fiber acceleration is too low (here: |a| = 25 m∙s−2). The particle structure is pressed against the fiber by the inflow, and the maximum acceleration of the fiber is reduced due to the flow resistance.
Additional inflow increases the fragmentation of the particle structure. The greater the loading height, the less small fragments form during detachment with additional inflow. In summary, the fiber acts like a kind of agglomerator.
The potential of magnetically induced regeneration was investigated in this study on a single fiber and should be further researched on a fiber array. Since each fiber generates a magnetic field of its own, this can influence the movement behavior of neighboring fibers. The mutual magnetic and mechanical influence of the fibers will be studied. In addition, the collision of the fibers could improve regeneration. The formation of particle bridges could also influence the regeneration.

Author Contributions

Conceptualization, J.S.-F.; methodology, J.S.-F.; software, J.S.-F.; validation, J.S.-F., J.M. and A.D.; investigation, J.S.-F.; writing—original draft preparation, J.S.-F.; writing—review and editing, J.S.-F., J.M. and A.D.; visualization, J.S.-F.; supervision, J.M. and A.D.; project administration, A.D. All authors have read and agreed to the published version of the manuscript.

Funding

This research received no external funding.

Data Availability Statement

The data presented in this study are available on request from the corresponding author.

Acknowledgments

We acknowledge the collaboration of Raquel Bischoff for her help in conducting the experiments.

Conflicts of Interest

The authors declare no conflict of interest.

References

  1. Langguth, F. Handbuch der Elektrochemie Elektromagnetische Aufbereitung. Verlag von Wilhelm Knapp: Halle, Germany, 1903. [Google Scholar]
  2. Korda, D. La Séparation Électromagnétique et Électrostatique des Minerais; L’Eclairage Electrique; Cornell University: Ithaca, NY, USA, 1905. [Google Scholar]
  3. Gunther, C.G. Electro-Magnetic Ore Separation; McGraw-Hill Publishing Co.: New York, NY, USA, 1909. [Google Scholar]
  4. Farsi, C.; Amroune, S.; Moussaoui, M.; Mohamad, B.; Benkherbache, H. High-Gradient Magnetic Separation Method for Weakly Magnetic Particles: An Industrial Application. Metallofiz. Novejsie Tehnol. 2019, 41, 1103–1119. [Google Scholar] [CrossRef]
  5. Svoboda, J. Magnetic Techniques for the Treatment of Materials; Kluwer Academic Publishers: Dordrecht, The Netherlands, 2004. [Google Scholar]
  6. Li, Y.; Zhou, B.; Xu, F.; Jiang, H.; Zhang, W. The advantages of a superconducting magnetic intensity greater than 1T for phosphate–ferric flocs separation in HGMS. Sep. Purif. Technol. 2015, 141, 331–338. [Google Scholar] [CrossRef]
  7. Oberteuffer, J. Magnetic separation: A review of principles, devices, and applications. IEEE Trans. Magn. 1974, 10, 223–238. [Google Scholar] [CrossRef]
  8. Ge, W.; Encinas, A.; Araujo, E.; Song, S. Magnetic matrices used in high gradient magnetic separation (HGMS): A review. Results Phys. 2017, 7, 4278–4286. [Google Scholar] [CrossRef]
  9. Miltenyi, S.; Müller, W.; Weichel, W.; Radbruch, A. High gradient magnetic cell separation with MACS. Cytom. J. Int. Soc. Anal. Cytol. 1990, 11, 231–238. [Google Scholar] [CrossRef]
  10. Yavuz, C.T.; Mayo, J.T.; Yu, W.W.; Prakash, A.; Falkner, J.C.; Yean, S.; Cong, L.; Shipley, H.J.; Kan, A.; Tomson, M.; et al. Low-field magnetic separation of monodisperse Fe3O4 nanocrystals. Science 2006, 314, 964–967. [Google Scholar] [CrossRef]
  11. Hubbuch, J.J.; Matthiesen, D.B.; Hobley, T.J.; Thomas, O.R. High gradient magnetic separation versus expanded bed adsorption: A first principle comparison. Bioseparation 2001, 10, 99–112. [Google Scholar] [CrossRef]
  12. Svoboda, J.; Fujita, T. Recent developments in magnetic methods of material separation. Miner. Eng. 2003, 16, 785–792. [Google Scholar] [CrossRef]
  13. Dauer, R.R.; Dunlop, E.H. High gradient magnetic separation of yeast. Biotechnol. Bioeng. 1991, 37, 1021–1028. [Google Scholar] [CrossRef]
  14. Luo, L.; Nguyen, A.V. A review of principles and applications of magnetic flocculation to separate ultrafine magnetic particles. Sep. Purif. Technol. 2017, 172, 85–99. [Google Scholar] [CrossRef]
  15. Ebner, A.D.; Ritter, J.A.; Ploehn, H.J. Magnetic Hetero-flocculation of Paramagnetic Colloidal Particles. J. Colloid Interface Sci. 2000, 225, 39–46. [Google Scholar] [CrossRef] [PubMed]
  16. Bilad, M.R.; Mezohegyi, G.; Declerck, P.; Vankelecom, I.F.J. Novel magnetically induced membrane vibration (MMV) for fouling control in membrane bioreactors. Water Res. 2012, 46, 63–72. [Google Scholar] [CrossRef]
  17. Yang, F.-R.; Chen, Y.-F.; Lin, S.-A. Vibration Filter. U.S. Patent #20060138037, 29 June 2006. Available online: https://patents.justia.com/patent/20060138037 (accessed on 19 November 2023).
  18. Zhou, F.; Diao, Y.; Wang, R.; Yang, B.; Zhang, T. Experimental study on PM2.5 removal by magnetic polyimide loaded with cobalt ferrate. Energy Built Environ. 2020, 1, 404–409. [Google Scholar] [CrossRef]
  19. Binnig, J.; Meyer, J.; Kasper, G. Origin and mechanisms of dust emission from pulse-jet cleaned filter media. Powder Technol. 2009, 189, 108–114. [Google Scholar] [CrossRef]
  20. Simon, X.; Bémer, D.; Chazelet, S.; Thomas, D.; Régnier, R. Consequences of high transitory airflows generated by segmented pulse-jet cleaning of dust collector filter bags. Powder Technol. 2010, 201, 37–48. [Google Scholar] [CrossRef]
  21. Levy, G.K.; Birch, M.A.; Brooks, R.A.; Neelakantan, S.; Markaki, A.E. Stimulation of Human Osteoblast Differentiation in Magneto-Mechanically Actuated Ferromagnetic Fiber Networks. J. Clin. Med. 2019, 8, 1522. [Google Scholar] [CrossRef]
  22. Iranmanesh, M.; Hulliger, J. Magnetic separation: Its application in mining, waste purification, medicine, biochemistry and chemistry. Chem. Soc. Rev. 2017, 46, 5925–5934. [Google Scholar] [CrossRef]
  23. Chung, C.Y.; Chen, S.C.; Lin, K.J. Effect of Magnetic Field on the Fiber Orientation during the Filling Process in Injection Molding, Part 1: Simulation and Mold Design. Mater. Sci. Forum 2018, 936, 126–135. [Google Scholar] [CrossRef]
  24. Künzel, K.; Papež, V.; Carrera, K.; Konrád, P.; Mára, M.; Kheml, P.; Sovják, R. Electromagnetic Properties of Steel Fibres for Use in Cementitious Composites, Fibre Detection and Non-Destructive Testing. Materials 2021, 14, 2131. [Google Scholar] [CrossRef]
  25. Gerbal, F.; Wang, Y.; Lyonnet, F.; Bacri, J.-C.; Hocquet, T.; Devaud, M. A refined theory of magnetoelastic buckling matches experiments with ferromagnetic and superparamagnetic rods. Proc. Natl. Acad. Sci. USA 2015, 112, 7135–7140. [Google Scholar] [CrossRef]
  26. Szabadi, J.; Meyer, J.; Dittler, A. Particulate Matter Detachment from a Magnetizable Single Fiber Applying Magnetic Forces in Ambient Air. Separations 2023, 10, 297. [Google Scholar] [CrossRef]
  27. Szabadi, J.; Meyer, J.; Dittler, A. In situ characterization of particle structures generated at different flow velocities on a single fiber in the gas phase. J. Aerosol Sci. 2023, 173, 106197. [Google Scholar] [CrossRef]
  28. Zoller, J.; Zargaran, A.; Braschke, K.; Meyer, J.; Janoske, U.; Dittler, A. Morphology of particulate deposits formed on a single filter fibre by exposure to mixed aerosol flow. J. Aerosol Sci. 2021, 152, 105718. [Google Scholar] [CrossRef]
  29. Franzreb, M. Magnettechnologie in der Verfahrenstechnik Wässriger Medien; University of Karlsruhe: Karlsruhe, Germany, 2003. [Google Scholar]
  30. Kanaoka, C.; Emi, G.; Hiragi, S.; Myojo, T. Morphology of particulate agglomerates on a cylindrical fiber and a collection efficiency of a dust loaded fiber. In Proceedings of the Second International Aerosol Conference, Berlin, Germany, 22–26 September 1986; pp. 674–677. [Google Scholar]
  31. Löffler, F. Abblasen von an Filterfasern Abgeschiedenen Feststoffteilchen. Verfahrenstechnik 1972, 6, 3–7. [Google Scholar]
  32. Kasper, G.; Schollmeier, S.; Meyer, J. Structure and density of deposits formed on filter fibers by inertial particle deposition and bounce. J. Aerosol Sci. 2010, 41, 1167–1182. [Google Scholar] [CrossRef]
  33. Otsu, N. A Threshold Selection Method from Gray-Level Histograms. IEEE Trans. Syst. Man Cybern. 1979, 9, 62–66. [Google Scholar] [CrossRef]
  34. Mathworks. Motion-Based Multiple Object Tracking. Available online: https://de.mathworks.com/help/vision/ug/motion-based-multiple-object-tracking.html (accessed on 4 November 2023).
Figure 1. Fiber holder (a); experimental setup for the particle deposition and detachment (b).
Separations 10 00579 g001
Figure 2. Investigated particle structures from the diffusion area (A,B) to the interception and inertia area (C,D).
Separations 10 00579 g002
Figure 3. Determination of the degree of regeneration.
Separations 10 00579 g003
Figure 4. Two examples for agglomerate tracking of particle structures B (Carbon Black) and D (Spheriglass).
Separations 10 00579 g004
Figure 5. Tracked position along the fiber axis.
Separations 10 00579 g005
Figure 6. Image sequence of the one-time regeneration of a single fiber loaded for the different particle structures A–D at the low loading stage (a) and higher loading stage (b).
Separations 10 00579 g006
Figure 7. Detached projection surface of particle structure in correlation to the maximum acceleration of the fiber.
Separations 10 00579 g007
Figure 8. Exemplary image sequence of the first regeneration of the single fiber (a); comparison of the total detached projection area with the projection size of the largest detached agglomerate at two loading heights of the particle structure B of Carbon Black and two inflow velocities (b).
Separations 10 00579 g008
Figure 9. Exemplary image sequence of the first regeneration of the single fiber (a); comparison of the total detached projection area with the projection size of the largest detached agglomerate at two loading heights of the particle structure C of Spheriglass and two inflow velocities (b).
Separations 10 00579 g009
Figure 10. Exemplary image sequence of the first regeneration of the single fiber (a); comparison of the total detached projection area with the projection size of the largest detached agglomerate at two loading heights of the particle structure D of Spheriglass and two inflow velocities (b).
Separations 10 00579 g010
Figure 11. Degree of regeneration of particle structure B of Carbon Black at B = 27.7 mT (a) and B = 38.5 mT (b).
Separations 10 00579 g011
Figure 12. Degree of regeneration of particle structure C of Spheriglass at B = 27.7 mT (a) and B = 38.5 mT (b).
Separations 10 00579 g012
Figure 13. Degree of regeneration of particle structure D of Spheriglass at B = 27.7 mT (a) and B = 38.5 mT (b).
Separations 10 00579 g013
Table 1. Experimental parameters of the particle deposition.
Carbon Black
A
Carbon Black
B
Spheriglass
C
Spheriglass
D
Péclet number, Stokes number/-Pe = 2.6 × 10⁴Pe = 2.6 × 10⁵St = 0.15St = 6.5
Loading heights/mmh1 = 0.3 ± 0.02
h2 = 0.6 ± 0.05
h1 = 0.25 ± 0.05
h2 = 0.5 ± 0.07
h1 = 0.25 ± 0.03
h2 = 0.5 ± 0.04
h1 = 0.25 ± 0.01
h2 = 0.5 ± 0.02
V ˙ i n /L·min−19.739.73 9.739.73
V ˙ i n , 2 /L·min−1--15.1715.17
V ˙ E x c e s s /L·min−19.588.2324.414.9
V ˙ o u t /L·min−10.151.50.520
M ˙ o u t /mg∙h−12.4824.814566
v l o a d i n g /m·s−10.0120.120.041.66
Disclaimer/Publisher’s Note: The statements, opinions and data contained in all publications are solely those of the individual author(s) and contributor(s) and not of MDPI and/or the editor(s). MDPI and/or the editor(s) disclaim responsibility for any injury to people or property resulting from any ideas, methods, instructions or products referred to in the content.

