Abstract
In this study, the enhanced photodegradation of a high-concentration phenol red (PR) using very fine TiO2 nanocrystals by adding a KBrO3 electron acceptor was reported for the first time. The structural study on TiO2 nanocrystals using HRTEM, XRD, Raman, and EDX was performed and it confirmed the anatase phase of TiO2 nanocrystals. UV–Vis absorbance of 20 mg.L−1 PR was measured and the photodegradation was extracted. The KBrO3 concentration effects exhibited an important enhancement in the degradation of PR dye. The efficiency of PR was increased during 110 min from 75% of pure TiO2 to 92% and 98% of TiO2 with 1 mg and 5 mg KBrO3, respectively. For different samples, a first-order kinetic of dye degradation is confirmed. The instantaneous amount of degraded dye increased from 150 to 180 and 197 mg/g TiO2 with 1 mg and 5 mg KBrO3, respectively. The mechanism of the photodegradation reaction confirms the effect of OH- radicals on increasing the photocatalytic activities. The addition of electron acceptors KBrO3 improved the photocatalysis rate, where it prevented e-h recombination through conduction band electron capture, which increases the concentration of hydroxyl radicals. The proposed mechanism and results were supported by photocurrent measurements and a Raman spectra analysis of the final photodegraded products. The photocurrent of TiO2 was observed at 1.2 µA, which was significantly improved up to 13.2, and 21.3 µA with the addition of 1 mg and 5 mg of KBrO3. The Raman spectra of the final products confirmed that and carbons are byproducts of PR degradation.
1. Introduction
The increasing demand for pharmaceutical, textile, and printing products containing colored dyes has led to negative impacts on the environment [1,2,3]. Based on different studies, the amount of wastewater released by the textile industry ranks among the highest in the world [4]. According to the United States “Color Index” commodity dyes have reached tens of thousands. About 60,000 tons of dyes are discharged into the environment in the form of waste each year worldwide [4], 80% of which are azo dyes. Dyes belong to organic pollutants. One of the most harmful dye-contaminated clean water is phenol red (PR). PR is particularly used in different industries such as pharmaceutical, coal processing, petroleum refineries, dye industries, and chemical, etc. PR is very harmful and hazardous for animals and plants living in water because it has carcinogenic and mutagenic effects [5]. That is why there is more demand to remove it from wastewater. The permissible limit of phenol is 1 mg/L for industrial effluents to be discharged into inland surface waters and 5 mgL−1 for discharge into public sewers [6]. Organizations are providing more funding to develop cost-effective and environmental techniques to treat wastewater from dyes. The advanced oxidation process (AOP) is very promising to effectively treat the pollutants in wastewater by photodegradation.
Over the past decades, TiO2 semiconductors have attracted enormous attention due to their interesting physical and chemical properties [7,8,9,10,11]. TiO2 is a chemically stable and non-toxic material used in a wide range of applications such as dye-sensitized-based solar cells, batteries’ electrodes, photoanodes, catalysis, and gas reduction [12,13,14,15,16,17]. In most applications, scientists have tried different approaches to improve the electronic and optical properties of TiO2, e.g., by tuning its optical band gap, slowing the recombination rate of hole–electron pair, controlling its phase, etc. These properties’ improvements were performed by decreasing the size of nanoparticles, changing the geometries, doping with metal/transition metal, adding a donor-acceptor, etc. Although adding/doping metal/transition metal to TiO2 nanocrystals can increase its photocatalytic activities by extending its absorbed wavelength range. There are still major challenges related to the secondary pollution caused by the presence of metal with TiO2 and the formation of complexes, especially for large-scale applications [18,19,20]. On the other hand, the affordability of new cutting-edge UV laser technologies such as UV laser diodes pushed the industry to use them easily in photodegradation applications. Another factor is the wider band gap of TiO2 that can be photo-excited when using a UV laser. An alternative way is using an electron acceptor to avoid the formation of secondary pollutants. It is very known that adding donors/acceptors to TiO2 increased the oxide-reduction reaction of photodegradation for dyes [4,19,21,22]. Wahab et al. studied the effect of H2O2 as an electron acceptor in enhancing the photodegradation efficiency of PR using TiO2 nanoparticles [23]. In their study, it took 300 min to degrade 94% of PR. Asiri et al. fabricated TiO2 nanocrystals with an average size of 77 nm that showed lower degradation time than 5 nm commercialized nanoparticles, which exhibited a higher photodegradation percentage of 95.2% during 100 min [24]. Other photocatalysts such as La-substituted bismuth ferrite (Bi1-xLaxFeO3) and oxyhydroxide of Fe (III) (Goethite) have been used in the photodegradation of PR [25,26]. Ahlawat et al. synthesized a cerium oxide–titanium oxide nanocomposite (CeO2-TiO2 NC) for PR degradation and adsorption applications simultaneously; in their study, the photodegradation with the adsorption lasted 80 min with a 99.8% degradation rate [27]. In our previous work, a 95% degradation rate of PR was obtained using KBrO3 as an acceptor with Nb-TiO2 nanocomposites. The degradation percentage is increased by more than 3% using KBrO3 pure TiO2 nanoparticles. Although, the higher degradation rate and short duration in some studies, such as (CeO2-TiO2 NC), used half the concentration of PR and 5–10 times more concentrated photocatalysts compared to this work. The reported studies confirm that no one has reported the effect of KBrO3 on the photodegradation of higher concentrations for phenol red using a very small size TiO2 nanocrystals. The objective of this study is to explore the effect of KBrO3 with different concentrations on the degradation efficiency of highly concentrated PR using very low concentrations of TiO2 nanoparticles.
In this work, we performed a photodegradation study of highly concentrated phenol red of 20 mgL−1 using very fine TiO2 nanoparticles with an average size of 5 nm supported with two different concentrations of KBrO3 as an electron acceptor. HRTEM and EDX mapping were carried out into the samples for the structural study. The degradation efficiency, the concentration decay, and the degraded quantity under the UV–Vis lamp were measured. The photo-induced current of TiO2 was examined to demonstrate the effect of KBrO3 in the recombination of the electron–hole. A detailed photocatalysis mechanism was proposed to understand the processes. The final products of PR degradation were investigated by Raman spectra with two modes of sampling, before and after stirring.
2. Materials and Methods
2.1. Materials Preparation
TiO2 nanopowders were purchased from Skyspring Nanomaterials (product ID: 7930DL, Houston, TX, USA) with an average size of 5 nm. KBrO3, ACS, 99.9% min, was ordered from Alfa Aesar (CAS number 40013), Kandel, Germany. A total of 1 mg and 5 mg of KBrO3 were added to two solutions containing 5 mg of the photocatalysts (TiO2), denoted by 20% and 100%, respectively. In this work, we used three samples: pure TiO2, TiO2 with 20 wt.% KBrO3, and TiO2 with 100 wt.% KBrO3.
2.2. Experimental Method
High transmission electronic microscopy (HRTEM) and EDX measurement were carried out using the equipment (JEOL, JEM-2100F, Tokyo, Japan) working at 200 kV. A solution of 5 µL of nanoparticles was covered in a carbon-coated copper grid after sonication for 10 min. X-ray diffractometer (Philips Type PW 1710, Amsterdam, The Netherlands) with CuKα radiation was used to measure the crystal structure of the prepared samples. XRD patterns were obtained within the range of 10°–90° with a frequency of scanning 2°/min. Raman spectra were recorded at room temperature using a confocal Raman microscope (HORIBA; LabRAM HR800, France SAS) with a He-Ne wavelength laser of 632.8 nm and an output power of 20 mW.
We performed the photocatalysis measurement using a solution containing 20 mg.L−1 PR with 5.0 mg of nanopowders in 50 mL of PR solution. A spectrophotometer with a scanning frequency of 5.0 nm/s was employed to measure the UV–Vis absorbance spectra of phenol red. To perform an effective photodegradation of PR, a UV lamp with a spectral range (315–400 nm) (UV 400 HL230 Fe Clear-A, UV Light Technology Limited, Birmingham, UK) with a power density of 100 mW/cm2. The maximum absorbance peak located at 450 nm was used to measure the photodegradation of PR. The photocurrent measurement was carried out using a quartz cell attached with two electrodes coated with gold. Three aqueous samples were prepared for photocurrent measurements by dissolving 5 mg of TiO2, TiO2/1 mg-KBrO3, and TiO2/5 mg-KBrO3 in 10 mL of DI water. The electrodes were connected to a DC power supply and Keithley multimeter (7.5 digits 2010 Series Low Noise Multimeter) for current measurements. The cell was irradiated with the same light source used for photocatalysis measurements (UV lamp with a spectral range (315–400 nm)).
3. Results
3.1. Structural Study
TEM images confirm the presence of 5 nm as an average size of TiO2 nanocrystals (Figure 1a,b). TEM shows that TiO2 nanoparticles are dispersed in agglomerated groups. Different crystal orientations were noticed in the HRTEM images (Figure 1a). A 0.33 nm interplane distance between (101) planes was observed (Figure 1c,d). Selected area electron diffraction (SAED) confirms the presence of different rings that correspond to (101), (004), (200), (211), and (204) planes, as shown in Figure 1e,f [28,29]. In Figure 2a–e, we can see the mapping of the element’s distribution using EDX techniques. Ti and O atoms are distributed with the quantities 69.88 and 30.12, and the weight ratio % of Ti and O is measured to be 43.66 and 56.34, respectively.
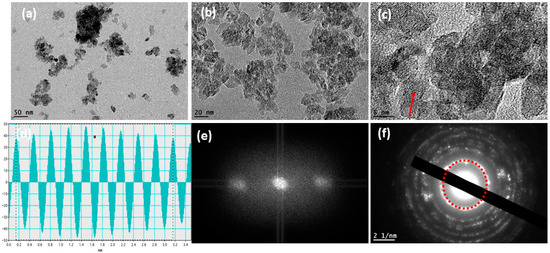
Figure 1.
(a,b) TEM images, (c) HRTEM image, red arrow represents the direction of (101) crystal plane, and (d–f) SAED pattern of the 5 nm TiO2 nanoparticles.
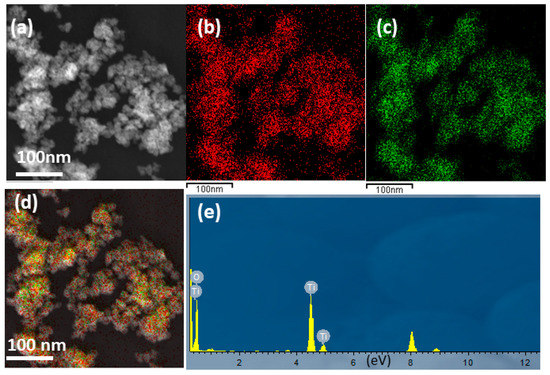
Figure 2.
(a) TEM scanning image, (b) distribution of O, (c) distribution of Ti, (d) elemental scanning of Ti and O, and (e) EDX spectrum of 5 nm TiO2 nanoparticles with 69.88 and 30.12 as the percentages of O and Ti, respectively.
The XRD measurement was performed on the sample to study the structure and phase composition of TiO2. Figure 3 shows clearly the XRD patterns related to pure TiO2. Different diffraction peaks at 2θ angles 25.3, 37.9, 48.05, 53.9, 55.06, 62.4, 68.76, 70.3, and 75.06 attributed to the crystal planes of the anatase phase TiO2 ((101), (004), (200), (105), (211), (204), (116), (220), and (215)), as reported in JCPDS card no. 21–1272. The sharpness of the observed peaks confirmed the higher crystallinity and purity of the anatase phase of the TiO2 nanoparticles.
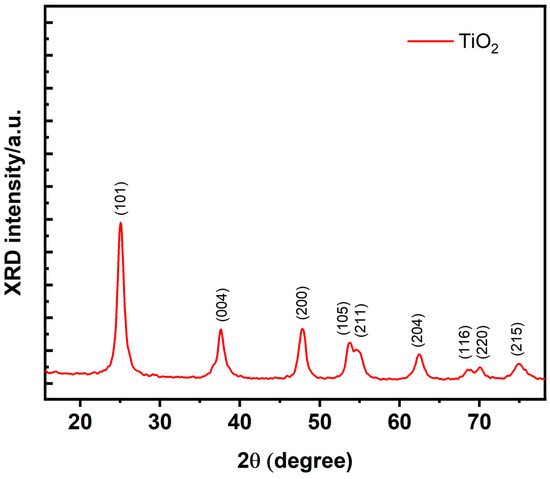
Figure 3.
XRD patterns of TiO2 nanopowders. ((101), (004), (200), (105), (211), (204), (116), (220), and (215)) represent the crystal planes of the anatase phase of TiO2.
Raman spectra were measured on pure TiO2, TiO2/1 mg-KBrO3, and TiO2/5 mg-KBrO3. KBrO3 was mixed with TiO2 nanoparticles and then milled. Afterward, a drop of water was added to dissolve KBrO3 to form a gel. After 1 h of drying, we put a small quantity into glass slides to perform a Raman measurement. Figure 4a shows the Raman spectra of pure TiO2, TiO2/1 mg-KBrO3, and TiO2/5 mg-KBrO3. The six basic Raman active modes that belong to (Eg), 196 (Eg), 396 (B1g), 515 (A1g), 519 (B1g), and 638 (Eg) are observed [30,31]. The sharp peak located at 148 cm−1 assigned to the Eg mode is shifted relative to the bulk located at 144 cm−1, the origin of the shift is the size confinement effect of the very small nanoparticles [27]. The very low blue shift of the Eg mode 148 cm−1 relative to the bulk mode is due to the effect of the small size on the phonon confinement [32]. In addition, new bands related to the KBrO3 vibrational modes located at 360 cm−1 and 793 cm−1 are observed (Figure 4a) [33,34]. A blue shift is observed with the increase in KBrO3 quantity with a zoom-in on the band located at 793 cm−1, which reflects the compressive stress due to the increasing number of KBrO3 or the increasing of electrostatic force between the ions (K+ and BrO3-) and TiO2 nanoparticles (Figure 4b). To confirm the interaction effect of KBrO3 on TiO2, a Lorentzian function was used to adjust the peak position of the Eg mode (148 cm−1), and a small red shift of 0.5 cm−1 is observed by increasing the KBrO3 quantity (Figure 4c,d). This shift is due to the coulomb force between the ions of KBrO3 and TiO2 nanoparticles.
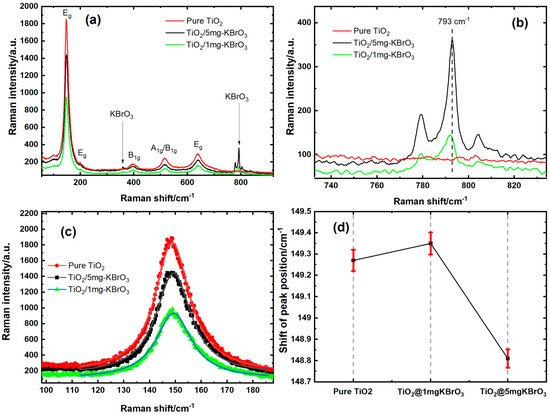
Figure 4.
(a) Room-temperature Raman spectra of pure TiO2, TiO2/1 mg-KBrO3, and TiO2/5 mg-KBrO3 (b) zoom in the spectral range of KBrO3 vibrational modes. (c) Fitting of the Eg mode with a Lorentzian function of Pure TiO2, TiO2/1 mg-KBrO3, and TiO2/5 mg-KBrO3. (d) Variation of the Eg mode position versus the KBrO3 mass fraction.
3.2. Phenol Red Photodegradation
The photocatalytic study of the three samples (pure TiO2, TiO2/1 mg-KBrO3, and TiO2/5 mg-KBrO3) was performed by measuring the photo absorption in the range between 350 and 550 nm. The initial concentration of phenol red was 20 mg/L before the catalyst was placed. The absorption spectrum of phenol red was measured before the catalyst was placed; then, the catalyst was placed and the solution was placed directly in the dark for two hours to ensure that the dye degradation process was due to the photocatalyst effect. Figure 5 shows the absorption spectrum as a function of a wavelength when the solution is exposed to light rays. It appears from the absorption spectra that the adsorption that occurred after 2.0 h in the dark can be ignored, as shown by the red curve with an irradiation time equal to zero. It appears clearly that the red phenol dye decays in the presence of pure TiO2, but it quickly decays on its surface in the presence of the KBrO3 electron acceptor. However, the largest decomposition as a result of photocatalysis was observed when using an amount of 5.0 mg of electron acceptors, where the absorption spectrum almost reached zero, as shown in Figure 5c. In addition to the three samples, another experiment was carried out for phenol red in the presence of KBrO3 only. The experiment was performed with different irradiation times. Figure 5d shows three curves measured between 0 and 70 min of irradiation. The result indicated that the photodegradation phenomenon is not available for the bare KBrO3, which cannot stand alone to photodegrade the phenol red dye, as shown in Figure 5d. The result observed in this figure confirmed that the photodegradation properties of TiO2 are fostered by the existence of KBrO3, not vice versa.
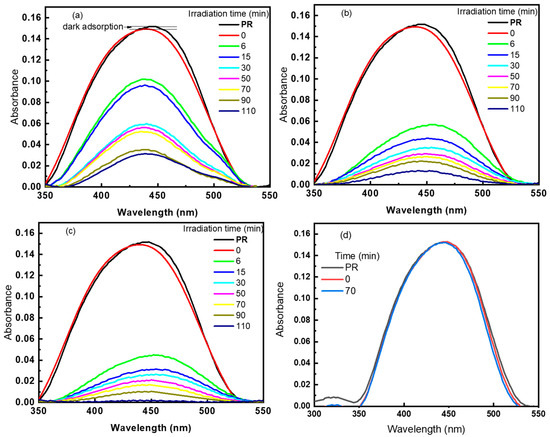
Figure 5.
The photo absorbance spectra of phenol red in the presence of (a) TiO2, (b) TiO2/1 mg-KBrO3, (c) TiO2/5 mg-KBrO3, and (d) KBrO3 samples.
The reported unique result observed in Figure 5 is reflected in Figure 6 for the decomposition of phenol red, by calculating the photodegradation efficiency of these three samples, as follows.
where and are the initial and instantaneous concentration of the dye at irradiation time, t. Since the absorbance peak seems to show a slight shift, the highest absorbance value was considered in each absorbance spectrum for any further calculations. Figure 6a shows the efficiencies in the dark after two hours and in light of the three samples during the photodegradation of phenol red between 0 and 110 min of irradiation time. At 0 min, the adsorption efficiencies on the semiconductor surface during the dark time were 3.0%, 3.2%, and 3.2% for TiO2, TiO2/1 mg-KBrO3, and TiO2/5 mg-KBrO3, respectively. We considered the dye concentration after the dark adsorption as the initial concentration for the photocatalysis effect. Thus, after 5 min of irradiation, phenol red has been decomposed on the surface of TiO2, TiO2/1 mg-KBrO3, and TiO2/5 mg-KBrO3, with the values of 33, 63, and 71%, respectively. It is clear from this that the presence of the KBrO3 compound increased the decomposition process by a large difference from the pure sample. After 20 min of irradiation, the decomposition rate became slow in the two samples containing the electron acceptor KBrO3 compared to the bare samples of TiO2. However, the efficiency of the bare sample reached 33%, while the efficiency of TiO2/1 mg-KBrO3 reached 71%, and the efficiency of TiO2/5 mg-KBrO3 reached 79%. Therefore, the concentration of red phenol decreased significantly in the presence of the electron acceptor within only 20 min, which led to a slow process of adsorption of red phenol molecules on the surface of the catalyst to complete the photodegradation process. This behavior is reflected in Figure 6b, which shows a decrease in the concentration of phenol red in the solution with an increasing irradiation time. This is the case with any behavior of the decomposition processes, the decomposition process slows down with time as the decomposing material approaches its end. However, we find that after 110 min of irradiation, the decomposition efficiency of the pure sample reached 75%, while it reached 92 and 98% for the two samples, TiO2/1 mg-KBrO3 and TiO2/5 mg-KBrO3, respectively. The dye concentration decreased close to 0.2 mg/L for the highest active materials, as shown in Figure 6b.
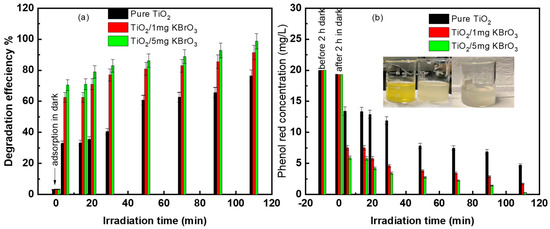
Figure 6.
(a) Photocatalytic efficiencies, and (b) phenol red concentration of TiO2, TiO2@ 1 mg-KBrO3, and TiO2@5 mg KBrO3 samples.
Since the concentration of phenol decreases with time due to ultraviolet radiation, the linear relationship of ln(C/Co) versus irradiation time, t, can be calculated using the following equation [35,36]:
where is the initial dye concentration and is the remaining dye concentration after the irradiation time (t), k is the first-order reaction rate constant, and K is the decomposition equilibrium constant. The semi-logarithmic relationship of phenol red concentration as a function of radiation time is shown in Figure 7. The decomposition rate constant and the degradation equilibrium constant can be calculated from Equation (2). The constants k and K were calculated and are listed in Table 1. It was found that k decreased from 0.75 to 0.28 accompanied with an increasing KBrO3 in the solution, while K increased from 0.013 to 0.057 s−1 due to the addition of the presence of an electron acceptor. A first-order reaction in photocatalysis depends on the reaction rate linearly on the concentration of dye, so the rate varies according to changes in the concentration of the dye.
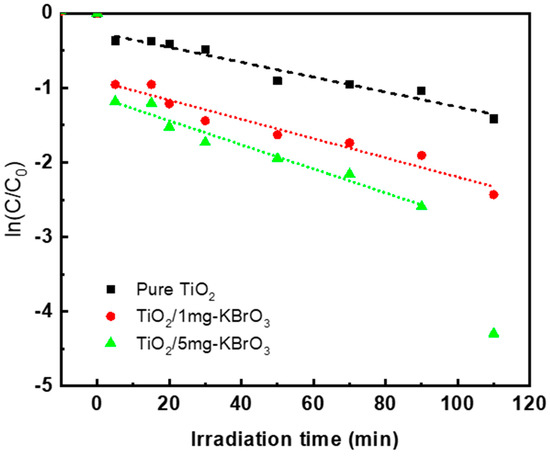
Figure 7.
Semi-logarithmic relationship of the dye concentration change vs. the irradiation time for TiO2, TiO2/1 mg-KBrO3, and TiO2/5 mg-KBrO3 samples.

Table 1.
First-order reaction rate constants (k) and the degradation equilibrium constant (K) for the 20 mg/L of PR for TiO2, TiO2/1 mg-KBrO3, and TiO2/5 mg-KBrO3 samples at 303 K.
The higher results show that KBrO3 has a significant effect on photodegradation when added to TiO2. This effect is reflected by calculating the amount of instantaneous dye () degraded per gram of metal oxide, as follows:
where m is the mass of the adsorbed oxide measured in grams, and V is the volume of the solution used in L. Figure 8 shows the instantaneous amount of phenol red decayed on only one gram of the substance as a function of irradiation time. It was observed that the instantaneous amount increased with the irradiation time. The figure shows the ability of TiO2 by adding KBrO3 to decompose a larger amount of phenol red on its surface. The instantaneous amount of degraded dye increased from 150 mg/g for TiO2 to 197 mg/g with the KBrO3 electron acceptor at 110 min.
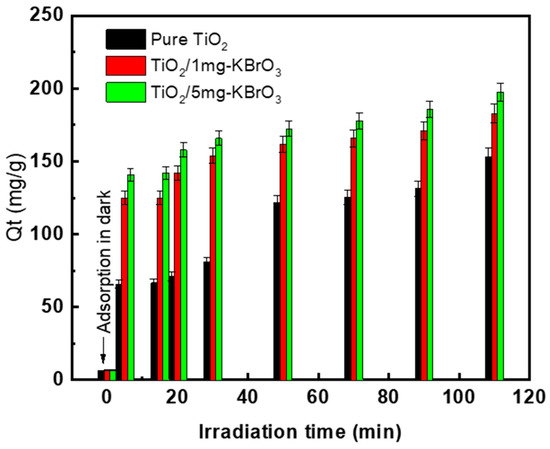
Figure 8.
The degradation quantity of phenol red in mg/g (PR in mg for each g of TiO2) for pure TiO2, TiO2/1 mg-KBrO3, and TiO2/5 mg-KBrO3 samples.
3.3. Photocatalysis Reactions and KBrO3 Mechanism
The mechanism of degradation of phenol red on the surface of TiO2 due to photocatalysis can be explained by comparing it with the presence of KBrO3 in solution. Hence, it can show how the presence of KBrO3 fostered the degradation of phenol red. Based on the advanced oxidation process, the phenomenon of phenol red degradation because of photocatalysis has been defined in some literature [24,37]. When the TiO2 compound is photoexcited, forming a pair of electron holes , the photolysis of the dye in water begins, as follows:
Direct oxidation reactions occur due to the oxidizing potential of the .
The decomposition of water molecules or the reactions of with the exited holes enables the formation of hydroxyl radicals (), which are photolysis responsible.
Another way is the formation of peroxide anions by reacting the oxygen molecules with the exited electrons. These peroxide anions are in charge of obtaining hydroxyl radicals ().
The effect of KBrO3 could be clarified based on the previous report [22]. The addition of electron acceptors improves the decomposition rate in several ways, as it prevents electron–hole recombination by picking up the conduction band electron, thus increasing the concentration of hydroxyl radicals. KBrO3 is an ionic compound that dissolves in polar solvents like water. Thus, KBrO3 undergoes ionization to form and ions in water.
The enhancement of the removal rate is due to the reaction between the ion and conduction band electron, which reduces the recombination of electron–hole [22].
With adding KBrO3 with 1 mg to 5 mg of TiO2, a high improvement in the photodegradation properties of TiO2 was observed. On the further increase in the KBrO3 addition, a slight enhancement was observed.
Based on the above formation of radicals, the organic dye decays, where radicals are high oxidizers with 2.8 V in potential. There is no mechanism equation for PR in photocatalysis degradation. However, we have proposed that the mechanism and reactions pathways analysis may reveal that PR dye is first converted into different intermediate products and then completely mineralized into .
The most important factor for obtaining a high photocatalytic efficiency is the reduction in the recombination rate of the electron–hole that is excited in the electronic structure. Reducing this rate reduces the waste of optical energy and increases the yield. Thus, increasing the yield of red phenol decomposition in water. This required efficiency or higher yield can be achieved by adding a KBrO3 electron acceptor. The addition of the electron acceptor KBrO3 in the current study prevented the e-h recombination in the valence band of the oxide. Hence, it leads to an increase in the OH concentration and hence, a rapid degradation of the dye. The Tauc plot to determine the TiO2 bandgap and the scheme of the photocatalysis mechanism is proposed in Figure 9a,b, respectively. The scheme demonstrated the reactions of KBrO3 with the excited e-h to prevent their recombination.
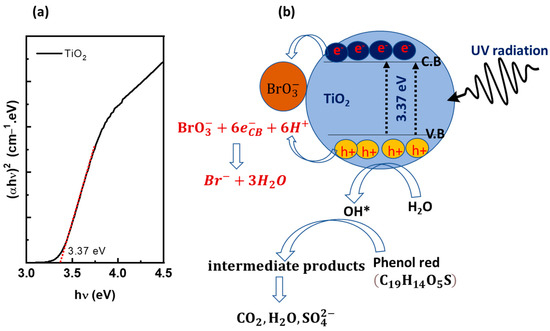
Figure 9.
(a) Tauc plot for energy gap determination, and (b) the scheme of the phenol red photodegradation on the surface of the semiconductor in the presence of KBrO3 electron acceptor.
The results obtained in the present study are supported by the photocurrent measurements for pure TiO2, TiO2/1 mg-KBrO3, and TiO2/5 mg-KBrO3, as shown in Figure 10. The photocurrent measurements were carried out at a bias voltage of 0.2 V for all samples. The sample solution was placed in an electrochemical cell containing two electrodes. The cell containing the sample solution was irradiated by the same source of UV used for the photocatalysis measurements. From Figure 10, when pure TiO2 was irradiated, the photocurrent signal reached the steady state value within 40 s. The sample shows a basic current of 35.2 µA. This current increased by 1.2 µA due to UV radiation. After switching off the UV light, the sample takes about 40 s for full recovery, returning to the basic current. With the addition of 1 mg and 5 mg of KBrO3, the basic current increased up to 43 and 66 µA, respectively. Samples TiO2/1 mg-KbrO3 and TiO2/5 mg-KbrO3 required a longer time, about 250 s, to reach the steady state, accompanied by a significant increase in the photo-induced current compared to the pristine TiO2 sample. The photo-induced current or photocurrent was 13.2 µA and 21.3 µA for TiO2/1 mg-KBrO3 and TiO2/5 mg-KBrO3, respectively. The decay time of TiO2/1 mg-KBrO3 and TiO2/5 mg-KBrO3 was found to be 486 and 893 s, respectively. This is considered a significant improvement in the photocurrent in the presence of KBrO3, indicating that the e-h recombination process for these two samples is very slow, which greatly improves the photocatalytic degradation of phenol red. In the Raman spectra, a small order of magnitude 0.5 cm−1 corresponds to ~0.1 meV, which consists of more of an electrostatic interaction between the ions of KBrO3 and the surface of TiO2 nanoparticles. The latter confirms how KbrO3 interacts with the surface of semiconductors and how it could capture electrons from the conduction band of TiO2 during the photodegradation process and consequently, slow the recombination rate of hole–electron in the valence band of TiO2.
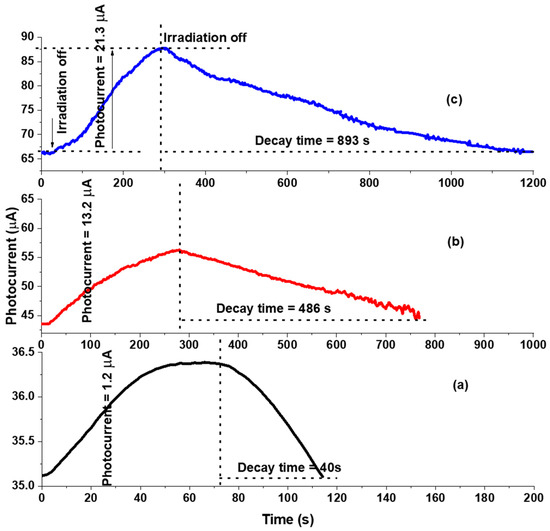
Figure 10.
The photocurrent signals of (a) TiO2, (b) TiO2/1 mg-KBrO3, and (c) TiO2/5 mg-KBrO3 samples were measured at a voltage bias of 0.2 V.
A comparative study between this work and some reported results on the photodegradation of phenol red using TiO2 nanocomposites and other photocatalysts with the effect of acceptors is presented in Table 2. We concluded that despite the higher degradation rate and short duration for some studies, such as (CeO2-TiO2 NC), in most of them, they used half the concentration of PR in this work and 5–10 times more concentrated photocatalysts. The latter makes KBrO3 an excellent acceptor when simply mixing without a complex method of fabrication with very small nanosized-pure TiO2 to degrade high concentrated solutions of PR.
Table 2.
Comparison of the current work and some previous work for PR degradation using different photocatalysts.
3.4. Analysis of Photodecomposition Products
The photodecomposition of PR products was analyzed using Raman spectroscopy. The sample of a solution of 50 mL with 20 mg/L of PR containing TiO2/5 mg-KBrO3, which was irradiated for 110 min, was chosen for this study. Two samples were withdrawn from the solution carefully, before (top solution) and after stirring the solution. The solution samples were placed dropwise into glass slides and left to dry at room temperature. The Raman spectra were recorded into different points and then summed up, as shown in Figure 11. A comparison study with the two samples in addition to the KBrO3 sample was performed to reveal more details on the photodecomposition products of PR. The three bands that appeared in the spectra of the sample before stirring, located at 793 cm−1, 1346 cm−1, and 1590 cm−1, are attributed to KBrO3 and carbon. The Raman peak of the KBrO3 band coincides well with those observed in the Raman spectrum of KBrO3. However, after stirring, the Raman spectra showed that the carbon band disappeared, KBrO3 decreased, and that its band became wide; in addition, new five bands located at 148 cm−1, 393.8 cm−1, 547.4 cm−1, 633.4 cm−1, and 1091 cm−1, attributed to TiO2 and , were observed [39,40]. The observation confirms that SO4 components precipitated during the photodegradation process and carbon flitted in the solution due to its small weight compared to the SO4 complexes. The Raman results observed here confirmed the proposed mechanism in Section 3.3.
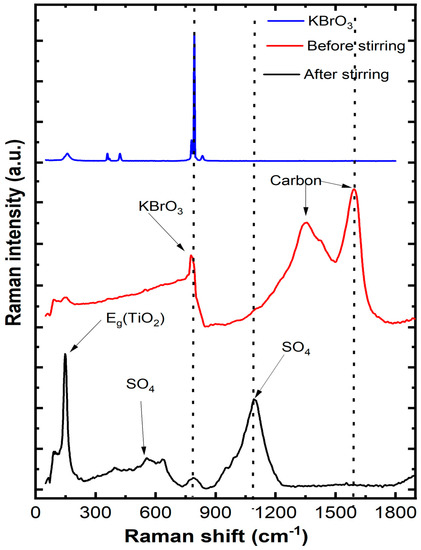
Figure 11.
Raman spectra of KBrO3, and final products of TiO2/5 mg-KBrO3 in PR solution irradiated for 110 min. Note: The samples were withdrawn from the final solution before and after stirring.
4. Conclusions
In summary, we show that TiO2 becomes more reactive in the degradation of phenol red in the presence of KBrO3, whether in a small amount of about 1 mg or 5 mg. The results showed that KBrO3 fosters the yield of the photoactive reactions and thus enhances the decay efficiency of phenol red on the oxide surface. In addition, increasing the concentration of KBrO3 enhanced photodegradation. A good adjustment with the first-order kinetics for all the samples was concluded. The efficiency of PR was increased during 110 min from 75% of pure TiO2 to 92% and 98% of TiO2 with 1 mg and 5 mg KBrO3, respectively. The instantaneous amount of degraded dye increased from 150 to 180 and 197 mg/g TiO2 with 1 mg and 5 mg KBrO3, respectively. The increase in hydroxyl radicals leads to a significant improvement in the photocatalytic activity. The electron acceptors significantly enhanced the photodegradation rate. It prevented electron–hole recombination through conduction band electron capture, which increases the concentration of hydroxyl radicals. The photocurrent measurements were performed to support the claims of the current study. The photo-induced current showed that the existence of KBrO3 in the solution supported the reduction in the e-h recombination. The high photo-induced current of TiO2 was observed by adding 1 mg and 5 mg of KBrO3. The Raman spectra of the final products exhibited that PR was completely mineralized into .
Author Contributions
Conceptualization, N.K.A., C.A. and N.M.S.; methodology, N.K.A., C.A. and N.M.S.; software, N.K.A., C.A. and N.M.S.; validation, N.K.A., C.A. and N.M.S.; formal analysis, N.K.A., C.A. and N.M.S.; investigation, N.K.A., C.A. and N.M.S.; resources, N.K.A., C.A. and N.M.S.; data curation, N.K.A., C.A. and N.M.S.; writing—original draft preparation, C.A. and N.M.S.; writing—review and editing, N.K.A., C.A. and N.M.S.; visualization, N.K.A., C.A. and N.M.S.; supervision, N.K.A.; project administration, N.K.A.; funding acquisition, N.K.A. All authors have read and agreed to the published version of the manuscript.
Funding
The authors extend their appreciation to the Deputyship for Research and Innovation, from the Ministry of Education in Saudi Arabia for funding this research work through the project number INST071.
Data Availability Statement
Not applicable.
Acknowledgments
The authors extend their appreciation to the Deputyship for Research and Innovation, from the Ministry of Education in Saudi Arabia for funding this research work through the project number INST071.
Conflicts of Interest
The authors declare no conflict of interest.
References
- Yaseen, D.A.; Scholz, M. Textile dye wastewater characteristics and constituents of synthetic effluents: A critical review. Int. J. Environ. Sci. Technol. 2019, 16, 1193–1226. [Google Scholar] [CrossRef]
- Al-Tohamy, R.; Ali, S.S.; Li, F.; Okasha, K.M.; Mahmoud, Y.A.-G.; Elsamahy, T.; Jiao, H.; Fu, Y.; Sun, J. A critical review on the treatment of dye-containing wastewater: Ecotoxicological and health concerns of textile dyes and possible remediation approaches for environmental safety. Ecotoxicol. Environ. Saf. 2022, 231, 113160. [Google Scholar] [CrossRef] [PubMed]
- Carney Almroth, B.; Cartine, J.; Jönander, C.; Karlsson, M.; Langlois, J.; Lindström, M.; Lundin, J.; Melander, N.; Pesqueda, A.; Rahmqvist, I.; et al. Assessing the effects of textile leachates in fish using multiple testing methods: From gene expression to behavior. Ecotoxicol. Environ. Saf. 2021, 207, 111523. [Google Scholar] [CrossRef] [PubMed]
- Liu, Q. Pollution and Treatment of Dye Waste-Water. IOP Conf. Ser. Earth Environ. Sci. 2020, 514, 52001. [Google Scholar] [CrossRef]
- Gautam, A.; Rawat, S.; Verma, L.; Singh, J.; Sikarwar, S.; Yadav, B.C.; Kalamdhad, A.S. Green synthesis of iron nanoparticle from extract of waste tea: An application for phenol red removal from aqueous solution. Environ. Nanotechnol. Monit. Manag. 2018, 10, 377–387. [Google Scholar] [CrossRef]
- Hussain, A.; Dubey, S.K.; Kumar, V. Kinetic study for aerobic treatment of phenolic wastewater. Water Resour. Ind. 2015, 11, 81–90. [Google Scholar] [CrossRef]
- Anpo, M.; Takeuchi, M. The design and development of highly reactive titanium oxide photocatalysts operating under visible light irradiation. J. Catal. 2003, 216, 505–516. [Google Scholar] [CrossRef]
- Madhusudan Reddy, K.; Manorama, S.V.; Ramachandra Reddy, A. Bandgap studies on anatase titanium dioxide nanoparticles. Mater. Chem. Phys. 2003, 78, 239–245. [Google Scholar] [CrossRef]
- Pallotti, D.K.; Passoni, L.; Maddalena, P.; Di Fonzo, F.; Lettieri, S. Photoluminescence Mechanisms in Anatase and Rutile TiO 2. J. Phys. Chem. C 2017, 121, 9011–9021. [Google Scholar] [CrossRef]
- Dharmale, N.; Chaudhury, S.; Mahamune, R.; Dash, D. Comparative study on structural, electronic, optical and mechanical properties of normal and high pressure phases titanium dioxide using {DFT}. Mater. Res. Express 2020, 7, 54004. [Google Scholar] [CrossRef]
- Ahmed, F.; Kanoun, M.B.; Awada, C.; Jonin, C.; Brevet, P.-F. An Experimental and Theoretical Study on the Effect of Silver Nanoparticles Concentration on the Structural, Morphological, Optical, and Electronic Properties of TiO2 Nanocrystals. Crystals 2021, 11, 1488. [Google Scholar] [CrossRef]
- Dues, C.; Schmidt, W.G.; Sanna, S. Water Splitting Reaction at Polar Lithium Niobate Surfaces. ACS Omega 2019, 4, 3850–3859. [Google Scholar] [CrossRef] [PubMed]
- Lee, D.; Rho, Y.; Allen, F.I.; Minor, A.M.; Ko, S.H.; Grigoropoulos, C.P. Synthesis of hierarchical TiO2 nanowires with densely-packed and omnidirectional branches. Nanoscale 2013, 5, 11147–11152. [Google Scholar] [CrossRef] [PubMed]
- Saranya, K.S.; Vellora Thekkae Padil, V.; Senan, C.; Pilankatta, R.; Saranya, K.; George, B.; Wacławek, S.; Černík, M. Green Synthesis of High Temperature Stable Anatase Titanium Dioxide Nanoparticles Using Gum Kondagogu: Characterization and Solar Driven Photocatalytic Degradation of Organic Dye. Nanomaterials 2018, 8, 1002. [Google Scholar] [CrossRef]
- Wei, Z.; Li, R.; Huang, T.; Yu, A. Fabrication of morphology controllable rutile TiO2 nanowire arrays by solvothermal route for dye-sensitized solar cells. Electrochim. Acta 2011, 56, 7696–7702. [Google Scholar] [CrossRef]
- Etacheri, V.; Di Valentin, C.; Schneider, J.; Bahnemann, D.; Pillai, S.C. Visible-light activation of TiO2 photocatalysts: Advances in theory and experiments. J. Photochem. Photobiol. C Photochem. Rev. 2015, 25, 1–29. [Google Scholar] [CrossRef]
- Qi, H.-P.; Wang, H.-L.; Zhao, D.-Y.; Jiang, W.-F. Preparation and photocatalytic activity of Ag-modified GO-TiO2 mesocrystals under visible light irradiation. Appl. Surf. Sci. 2019, 480, 105–114. [Google Scholar] [CrossRef]
- Chandanshive, V.; Kadam, S.; Rane, N.; Jeon, B.-H.; Jadhav, J.; Govindwar, S. In situ textile wastewater treatment in high rate transpiration system furrows planted with aquatic macrophytes and floating phytobeds. Chemosphere 2020, 252, 126513. [Google Scholar] [CrossRef]
- Zhang, X.; Song, L.; Zeng, X.; Li, M. Effects of Electron Donors on the TiO2 Photocatalytic Reduction of Heavy Metal Ions under Visible Light. Energy Procedia 2012, 17, 422–428. [Google Scholar] [CrossRef]
- Jeevanandam, J.; Manchala, S.; Danquah, M.K. Wastewater Treatment by Photocatalytic Biosynthesized Nanoparticles. In Handbook of Nanomaterials and Nanocomposites for Energy and Environmental Applications; Kharissova, O.V., Torres-Martínez, L.M., Kharisov, B.I., Eds.; Springer International Publishing: Cham, Switzerland, 2021; pp. 3135–3157. ISBN 978-3-030-36268-3. [Google Scholar]
- Almohammed, S.; Fularz, A.; Kanoun, M.B.; Goumri-Said, S.; Aljaafari, A.; Rodriguez, B.J.; Rice, J.H. Structural Transition-Induced Raman Enhancement in Bioinspired Diphenylalanine Peptide Nanotubes. ACS Appl. Mater. Interfaces 2022, 14, 12504–12514. [Google Scholar] [CrossRef]
- Rajamanickam, D.; Shanthi, M. Photocatalytic degradation of an organic pollutant by zinc oxide—Solar process. Arab. J. Chem. 2016, 9, S1858–S1868. [Google Scholar] [CrossRef]
- Wahab, H.S.; Hussain, A.A. Photocatalytic oxidation of phenol red onto nanocrystalline TiO2 particles. J. Nanostruct. Chem. 2016, 6, 261–274. [Google Scholar] [CrossRef]
- Asiri, A.M.; Al-Amoudi, M.S.; Al-Talhi, T.A.; Al-Talhi, A.D. Photodegradation of Rhodamine 6G and phenol red by nanosized TiO2 under solar irradiation. J. Saudi Chem. Soc. 2011, 15, 121–128. [Google Scholar] [CrossRef]
- Belattar, S.; Debbache, N.; Ghoul, I.; Sehili, T.; Abdessemed, A. Photodegradation of phenol red in the presence of oxyhydroxide of Fe(III) (Goethite) under artificial and a natural light. Water Environ. J. 2018, 32, 358–365. [Google Scholar] [CrossRef]
- Dhanalakshmi, R.; Muneeswaran, M.; Shalini, K.; Giridharan, N. V Enhanced photocatalytic activity of La-substituted BiFeO3 nanostructures on the degradation of phenol red. Mater. Lett. 2016, 165, 205–209. [Google Scholar] [CrossRef]
- Ahlawat, A.; Dhiman, T.K.; Solanki, P.R.; Rana, P.S. Enhanced Photocatalytic Degradation of p-Nitrophenol and Phenol Red Through Synergistic Effects of a CeO2-TiO2 Nanocomposite. Catal. Res. 2022, 2, 39. [Google Scholar] [CrossRef]
- Li, Y.; Qin, Z.; Guo, H.; Yang, H.; Zhang, G.; Ji, S.; Zeng, T. Low-temperature synthesis of anatase TiO2 nanoparticles with tunable surface charges for enhancing photocatalytic activity. PLoS ONE 2014, 9, e114638. [Google Scholar] [CrossRef]
- Victoria Dimas, B.; Hernández Pérez, I.; Garibay Febles, V.; Díaz Barriga Arceo, L.; Suárez Parra, R.; Rivera Olvera, J.N.; Luna Paz, R.; Melo Máximo, D.V.; González Reyes, L. Atomic-Scale Investigation on the Evolution of Tio(2)-Anatase Prepared by a Sonochemical Route and Treated with NaOH. Materials 2020, 13, 685. [Google Scholar] [CrossRef]
- Orendorz, A.; Brodyanski, A.; Lösch, J.; Bai, L.H.; Chen, Z.H.; Le, Y.K.; Ziegler, C.; Gnaser, H. Phase transformation and particle growth in nanocrystalline anatase TiO2 films analyzed by X-ray diffraction and Raman spectroscopy. Surf. Sci. 2007, 601, 4390–4394. [Google Scholar] [CrossRef]
- Cheng, G.; Akhtar, M.S.; Yang, O.-B.; Stadler, F.J. Structure modification of anatase TiO2 nanomaterials-based photoanodes for efficient dye-sensitized solar cells. Electrochim. Acta 2013, 113, 527–535. [Google Scholar] [CrossRef]
- Zhang, W.F.; He, Y.L.; Zhang, M.S.; Yin, Z.; Chen, Q. Raman scattering study on anatase TiO2 nanocrystals. J. Phys. D Appl. Phys. 2000, 33, 912–916. [Google Scholar] [CrossRef]
- Radhakrishna, S.; Karguppikar, A.M. Raman Spectra of Irradiated Alkali Bromate Crystals. J. Phys. Soc. Jpn. 1973, 35, 578–581. [Google Scholar] [CrossRef]
- Bates, J.B.; Stidham, H.D. Isotope effects in Raman spectra of crystalline alkali-metal chlorates and bromates. J. Phys. Chem. Solids 1976, 37, 183–188. [Google Scholar] [CrossRef]
- Yan, H.; Hou, J.; Fu, Z.; Yang, B.; Yang, P.; Liu, K.; Wen, M.; Chen, Y.; Fu, S.; Li, F. Growth and photocatalytic properties of one-dimensional ZnO nanostructures prepared by thermal evaporation. Mater. Res. Bull. 2009, 44, 1954–1958. [Google Scholar] [CrossRef]
- Rashad, M.; Shaalan, N.M.; Abd-Elnaiem, A.M. Degradation enhancement of methylene blue on ZnO nanocombs synthesized by thermal evaporation technique. Desalin. Water Treat. 2016, 57, 26267–26273. [Google Scholar] [CrossRef]
- Daneshvar, N.; Salari, D.; Khataee, A.R. Photocatalytic degradation of azo dye acid red 14 in water on ZnO as an alternative catalyst to TiO2. J. Photochem. Photobiol. A Chem. 2004, 162, 317–322. [Google Scholar] [CrossRef]
- Almulhem, N.K.; Awada, C.; Alnaim, N.M.; Al Taisan, N.; Alshoaibi, A.A.; Shaalan, N.M. Synergistic Effect of the KBrO3 Electron Acceptor on the Photocatalytic Performance of the Nb-TiO2 Nanocomposite for Polluted Phenol Red Wastewater Treatment. Crystals 2022, 12, 1758. [Google Scholar] [CrossRef]
- Ben Mabrouk, K.; Kauffmann, T.H.; Aroui, H.; Fontana, M.D. Raman study of cation effect on sulfate vibration modes in solid state and in aqueous solutions. J. Raman Spectrosc. 2013, 44, 1603–1608. [Google Scholar] [CrossRef]
- Du, Z.; Chen, J.; Ye, W.; Guo, J.; Zhang, X.; Zheng, R. Investigation of two novel approaches for detection of sulfate ion and methane dissolved in sediment pore water using Raman spectroscopy. Sensors 2015, 15, 12377–12388. [Google Scholar] [CrossRef]


Disclaimer/Publisher’s Note: The statements, opinions and data contained in all publications are solely those of the individual author(s) and contributor(s) and not of MDPI and/or the editor(s). MDPI and/or the editor(s) disclaim responsibility for any injury to people or property resulting from any ideas, methods, instructions or products referred to in the content. |
© 2023 by the authors. Licensee MDPI, Basel, Switzerland. This article is an open access article distributed under the terms and conditions of the Creative Commons Attribution (CC BY) license (https://creativecommons.org/licenses/by/4.0/).