1. Introduction
Pharmaceutical contaminants are considered emerging pollutants in environmental water bodies (e.g., lakes, rivers, ponds, lagoons, stormwater, and wastewater) [
1]. The occurrence, as well as the quantification of nanogram levels of targeted pharmaceutical contaminants, are challenging due to the complexity of their matrices. The coupling of an appropriate chromatographic technique with “mass spectrometry” (MS), such as GC/MS, LC/MS, and LC/MS/MS, is the generally employed approach for trace level detection of pharmaceutical contaminants in the aqueous environmental samples [
2,
3,
4,
5]. In addition, efficient extraction methods and multiple cleanup techniques are also typically required to obtain a clean sample before analysis. For this numerous sample pre-treatment techniques, including “liquid-liquid extraction” (LLE) [
6,
7,
8], “stir bar sorptive extraction” (SBSE) [
9], “solid-phase microextraction” (SPME) [
10], “supercritical fluid extraction” [
11], “microwave-assisted extraction” [
12], “accelerated solvent extraction” [
13], and “solid phase extraction” (SPE) [
14], have been developed over time in the literature. Among them, SPE has emerged as an efficient process and is being frequently endorsed for use owing to its inherent advantages, such as short analysis time, reduced usage of toxic and volatile organic solvents, high “enrichment factor”, excellent recovery, and broad scope depending on diverse adsorbents exhibiting distinctive characteristics.
Being the chief component of SPE, synthesis of a novel adsorbent and its characterization, testing, and application has been a hot topic in recent years. As a result, much effort has been put into preparing and characterizing novel, cutting-edge adsorbent materials. Numerous classes of adsorbents (which are made up of various starting materials and different processing techniques) including magnetic adsorbents, polymeric adsorbents, such as polypyrrole–polyethyleneimine nanocomposites, molecularly imprinted adsorbents, nanomaterials, titanium dioxide nanotubes, continuous flow systems, etc., are prepared and reported in the literature [
15,
16,
17,
18,
19,
20]. In the framework of environmental safety and remediation, green analytical chemistry (GAC) has an important role to play in terms of the detection of environmental contaminants and provides protocols for remediation. Therefore, this positive impact must go hand in hand with the reduction in procedure-related pollution [
21]. The latter criterion [
22] is satisfied by microextraction methods, which are among the most environmentally friendly sample preparation methods [
23].
During the last decade, thanks to some important approaches, microextraction techniques have evolved immensely. Among them, developing new extraction phases is one of the most important. In this context, the tenth principle of GAC, i.e., the use of renewable resources, is especially relevant [
24]. A significant contribution of analytical chemistry to changing the industrial model is using surplus natural products as raw materials to create new solid phases. An important technique utilizing biomaterial called biosorption has a number of benefits over the more established ones, including the fact that it removes contaminants from highly diluted solutions with great efficiency and without creating any chemical sludge. Additionally, with appropriate design as well as coupling with numerous systems, it can be used in situ [
25]. Moreover, wastes from agriculture and forestry can be employed as biosorbents, making biosorption a potentially environmentally friendly method [
26,
27]. Because they are wastes or by-products of agricultural or forestry activities and are already in vast quantities, agricultural and forestry byproducts are advantageous as biosorbents [
28]. When examining the studies published during the last decade, the utilization of biomass as a substitute ‘green’ sorbent for the extraction/elimination of both charged and neutral pollutants has gained prominence. Natural agricultural and domestic waste products, such as fruit peel or biomass left after extraction of juice from fruits and their treated forms, were the materials of choice for the removal/extraction of pollutants from water/wastewater [
29].
The aim of this work was to establish an economical, effective, and ‘green’ biosorbent for the identification as well as quantification of pharmaceutical contaminants in water samples. For this, waste coffee husk powder was collected, prepared, characterized, and utilized as an SPE sorbent to extract pantoprazole from wastewater samples. SPE cartridges packed with coffee husk powder performed well for pantoprazole, which is incorporated in the latest Watch List of EU Decision 2020/11615. It is also aimed in the present study to further broaden the applications of carbon-based materials in environmental remediation by developing CH-based SPE cartridges for the extraction of a broad range of pollutants. An “ultra-performance liquid chromatography/tandem mass spectrometry” (UPLC/MS/MS) determination was preferred for this investigation since it has the facility to considerably lessen the noises associated with the selective identification of the intended molecule.
2. Materials and Methods
2.1. Materials
The study’s supply of pantoprazole, with a purity percentage of 98.0, came from Sigma-Aldrich. HPLC grades of methanol, acetonitrile, ethanol, and ethyl acetate were purchased from Panreac Química (Barcelona, Spain). Analytical grade NaOH, formic acid, and HCl were procured from Qualikemes Fine Chem. Pvt. Ltd., Vadodara, India. Water used throughout the study was acquired from a “Milli-QR Gradient A10R” (Millipore, Moscheim, France) water system.
2.2. Preparation of “Stock Solution” and “Working Solution”
The “stock solution” of pantoprazole (1 mg/mL) was formulated in a 10 mL “volumetric flask” by balancing precisely its “reference standard”. The powder was transferred into the volumetric flask and the volume was brought to 10 mL using methanol. The working solution was formulated by additional dilution of stock solutions with 50% methanol as the diluent. All standard solutions were kept at 4 °C in a pharmaceutical refrigerator.
2.3. Biosorbent Preparation
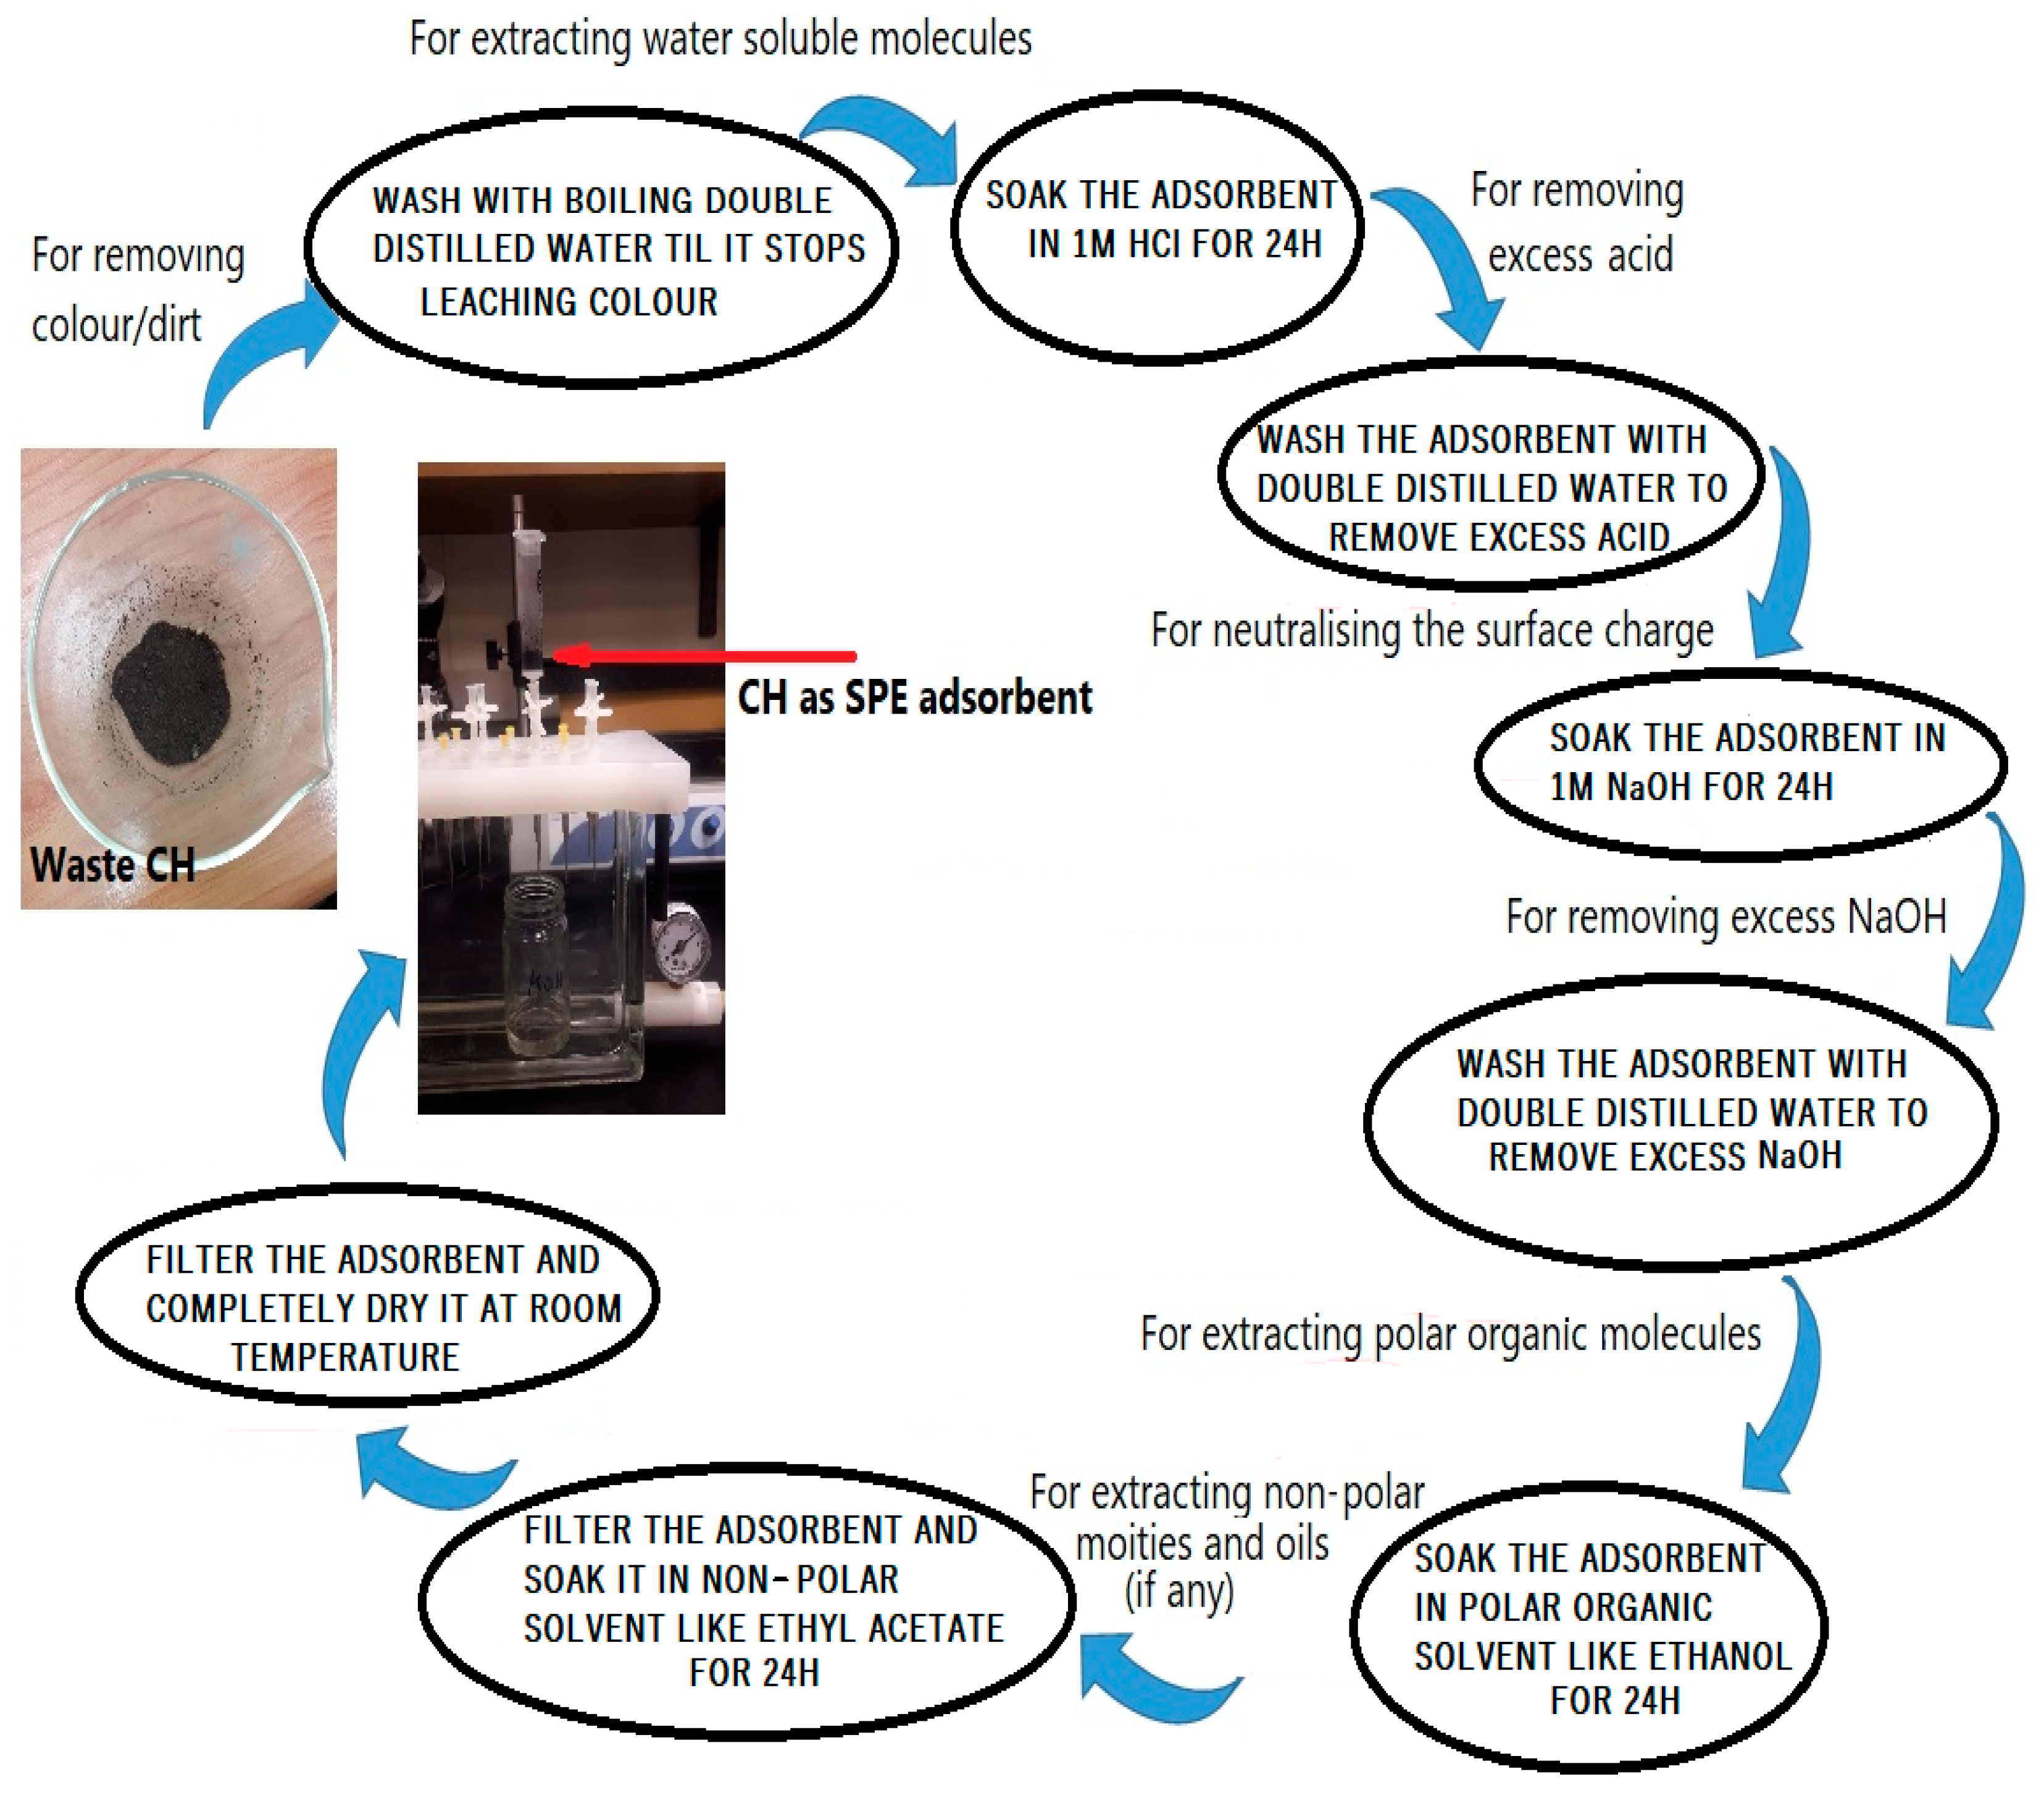
Used CH was collected from the main cafeteria at “King Saud University”, “Riyadh”, KSA. Initially, 25 g of CH was taken for the entire experiment including characterization and application. To get rid of any dirt, impurities, and color associated with the coffee husk, it was washed numerous times with distilled water. To extract as many phytochemicals/colors as possible from the CH, washings with double distilled water were continued until no color leached from the CH. This process was required to rule out the role of dirt attached to the CH in the adsorption of the drug and also to prevent any interference by color/other organic constituents leaching from the biosorbent during drug determinations. After washing, CH was dehydrated in a hot air oven for 5 h at 105 °C [
30]. After complete drying, the CH was soaked in 1 M HCl overnight, followed by washing with double distilled water to remove any excess HCl. In order to keep the surface charge, neutral CH was soaked in 1 M NaOH overnight. Thus, obtained CH was further washed with distilled water to remove excess NaOH. Afterward, the CH was soaked successively first in absolute ethanol followed by ethyl acetate, every time for a 24 h period. The purpose of keeping the surface charge neutral is that most of the drugs are hydrophobic in nature and a neutral surface may improve the chances of hydrophobic interactions between the surface of the adsorbent and drug molecules. Then, the obtained CH was dried in the oven again, kept in a closed container, and used for further experiments (
Figure 1).
2.4. Characterization of the Adsorbent
The surface morphology of the biosorbent was observed using SEM (“JEOL JSM-6360LA, Tokyo, Japan”) at 15 kV accompanied by a thin layer of gold under a vacuum. Functional groups present on the biosorbent exterior were recognized using FTIR spectroscopy employing the KBr disc method (“1000 FTIR instrument, Perkin-Elmer, Waltham, MA, USA”). A micromeritics ASAP 2010 instrument (“Micrometrics, Norcross, GA, USA”) was employed to study nitrogen adsorption at 77 K (liquid nitrogen) for obtaining the adsorption isotherm of every sample. Isotherms obtained from the micromeritic study and the accompanying t-plot analysis software were used to calculate the BET surface area, micropore volume, and micropore area. The samples were degassed for 1 h at 150 °C before running the analysis. A “Fison EA 1108 C, H, N, O analyzer” was used for elemental analyses of the prepared biosorbent. A “Zetasizer Nano-Series” (“Nano-ZS90, Malvern Instruments, Malvern, England”) at 25 °C at a scattering angle of 90° was employed to record the zeta potential of the developed adsorbent for the optimum possible detection. The CH particles were properly suspended and diluted with Milli-Q water before moving onto zeta potential estimation. All measurements were performed in triplicate.
2.5. SPE Set-Up and Extraction of the Real Samples
The SPE set-up process includes numerous consecutive phases, namely (i) an SPE cartridge (6 mL), which was emptied, and a “polyethylene frit” (20 µm), which was placed on the base of it; (ii) the cartridge was then filled with a designated quantity of a biosorbent; (iii) on the upper end of the CH bed height, another frit was placed to protect the adsorbent; and (iv) a slender amount of compressive force was applied to give the CH a specific bed height. Briefly, 0.1 mL of the conditioning solvent (methanol) was passed through the SPE cartridge per minute for conditioning. Sample loading (200 mL) of blank (i.e., not including the target drug or amended with 0.1 ng/L of the target analyte) aqueous samples was executed at a persistent flow rate of 1 mL/min, and in the washing procedure, 4 mL of distilled water were used. After dehydration under a vacuum (45 min), the adsorbent was collected in a vial and vortexed with 1 mL of methanol. After vortexing for 1 min, the vial was centrifuged to separate methanol from the CH, and the supernatant was collected in a separate vial. From the collected supernatant, 120 µL was assigned to an inert glass tube that was prepared to inject a 5 µL sample for UPLC-MS/MS analysis [
31].
2.6. “Mass Spectrometry”, “Instrumentation”, and “Chromatographic Conditions”
An Acquity UPLC system (H-class) attached to a “triple quadrupole (TQD) mass detector” (“Waters Corp., Milford, MA, USA”) was exploited for detection and quantification of the analyte. The analyte was separated into an Acquity C18 BEH column (2.1 × 100; 1.7 μm) by maintaining oven heat at 42 °C. The eluent phase encompassing water (A) and acetonitrile (B), both containing 0.1% formic acid, were eluted at a flow rate of 0.25 mL/min in gradient mode. The gradient condition of the mobile phase used for sample separation is presented in
Table 1.
The auto-sampler temperature was fixed to 15 °C and 5 µL of the sample was injected for analysis. “Electrospray ionization” (ESI) was used for sample ionization, which was operated in positive mode, and for the identification and quantification of the target analyte, “multiple reaction monitoring” (MRM) was used. The precursor to product ion transition of m/z 384.02→1380.05 and 384.02→200.05 was used as qualifier and quantifier ions, respectively. Nitrogen gas (600 L/h) was used for sample nebulization and the desolvation process by maintaining the source temperature of 150 °C and the “desolvation” temperature of 350 °C. The capillary voltage (3.40 kV) and extractor voltage (3.0 V) were optimized to achieve maximum ionization. Argon gas was used for fragmentation at a 0.18 mL/min flow rate. MassLynx software was exploited to operate the (UPLC-MS/MS) system while the generated data was processed by the Target LynxTM program (Version 4.1).
2.7. Evaluation of “Enrichment Factor” (EF), “Extraction Recovery” (ER), and “Relative Recovery” (RR)
The extraction efficacy of the developed adsorbent was assessed by evaluating the EF and ER% of the analyte.
The EF was expressed as the proportion of concentration of analyte reconstituted in methanol after passing through an adsorbent (C
a) to the target analyte’s original strength in the aqueous solution (C
0):
The percent ER was defined as the percent quantity of the analyte transferred into the adsorbent solution medium by the projected extraction process:
where Va and V
0 were the volume of the adsorbent reconstituted and the sample solution, respectively.
The percent RR was computed as the percent amount of the analyte regained from the matrix (actual samples) with respect to the extracted standard (standard amended into the same matrix).
(Cfound is the concentration of the analyte following amending a certain quantity of working standard to the actual sample; Creal is the concentration of the analyte in real samples; and Cadded signifies the known amount of working standard that was used to spike the real samples.)
2.8. Evaluation of Matrix Effects
Matrix effects (ME) is the alteration of ionization efficiency by the presence of co-eluting substances in a real matrix which is produced either in the form of ion suppression or enhancement. Both the “post-column infusion” (quantitative) and the “pre-column infusion” (qualitative) methods can be used to evaluate it. The ME was determined in this study using the “pre-column infusion” approach, which compared the responses of the analyte ionization in the real sample matrix and the response in regular deionized water.
2.9. A Comparison of the CH-Based Column with Respect to and the Commercially Available C18 Column
To be sure about the real-time applicability of the developed adsorbent for the extraction of pollutants, the efficacy of the CH-based column was compared with that of the commercially available silica-based 6 mL C18 column. One C18 cartridge was emptied and the amount of adsorbent in the column was collected on butter paper and weighed. The same amount of treated CH was filled in an empty column in a previously described manner. A total of 500 mL of 0.1 ng/mL pantoprazole solution at a rate of 0.6 mL/min was passed separately through the C18 column, as well as through the CH-based column. Both columns were then washed with 5 mL of MeOH at a rate of 0.5 mL/min, and the collected MeOH was concentrated to 1 mL, and then 5 µL of the concentrate was analyzed for drug content.
2.10. Relevance in Actual Samples
For ensuring the consistency of the adsorbent for the removal of analytes from wastewater samples, the process was operated for the identification of pantoprazole in raw wastewater samples procured from influents of the “WWTP of the King Saud University, Riyadh, Saudi Arabia”. Unfortunately, the target analyte (pantoprazole) was not even detected in traces in the samples that were collected, suggesting that either the analyte was below the detection limit for this test or the samples do not have the desired molecule altogether. Further, the samples were amended with various concentrations (0.3, 1, 15, and 45 ng/mL) of the QC samples and the analyte was taken out by the proposed extraction technique. All samples were analyzed in triplicate and the recoveries were determined as the “percentage relative recoveries” calculated as mentioned in Equation (3).
3. Results and Discussion
3.1. Characterization of CH
3.1.1. FTIR
As per Sasmal et al. [
32], the occurrence of varying concentrations of hemicellulose, cellulose, and lignin in the biomass were the foremost characteristics of biomass FTIR spectra.
Figure 2 demonstrates the acquired spectrum for CH represented by the key in the following ranges: 3000, 2800, 1800, and 700 cm
−1. The peaks at 2919 and 2852 cm
−1 were credited to the stretching of C-H bonds of the methyl (-CH
3) moiety of the caffeine molecule. It is evident that the CH spectrum showed higher absorbance values between 1700 and 1500 cm
−1. The peaks in this range may be attributed to the “axial deformation” of C=C and C=N bonds of the aromatic ring of trigonelline [
33]. The bands between 1400 and 900 cm
−1 are illustrated by vibrations of numerous kinds of bonds, such as C-H, C-O, C-N, and P-O. These bands indicate the presence of chlorogenic acids, which are a cluster of esters formed among quinic acid and either of the three residues of caffeic, p-coumaric, and ferulic acids, which present a clear-cut absorption in the zone of 1450 and 1000 cm
−1. Absorption bands in the range of 1500 and 700 cm
−1 exhibit the presence of carbohydrates. The strength of the signals will become enhanced with such a group of compounds. Additionally, the “skeletal vibration” manners of the “glycosidic linkages” in starch were detected in wave numbers 950 and 700 cm
−1.
The “stretching vibrations” of -O–H and C–O–C associated with cellulose as well as lignin in the CH were represented by the peaks near 3310 cm
−1 and 1152 cm
−1. The distinctive peak for the C-H bond “bending vibration” was well-represented by the distinctive peak at 1376 cm
−1. The “stretching vibrations” of aldehydes and ketones were ascribed to the peaks positioned at 1739 and 1648 cm
−1. In FTIR spectroscopic identification, as well as quantification of caffeine in coffee extract samples, the spectroscopic response at 1648 cm
−1 has been regularly referred to as the “chemical descriptor” of caffeine [
34]. Carboxyl group C-O bond “stretching vibration” could be held responsible for a peak at 1445 cm
−1. The peak at 1238 cm
−1 relates to the C–N “stretching vibration” of the amine group [
35,
36,
37,
38,
39,
40]. A fragile signal at around 1800 cm
−1 is credited to the “carbonyl (CO) vibration” of esters, specifying that this signal could be correlated to the concentration of lipids [
41]. Numerous bands were visible in the spectra on the scale of 1700–700 cm
−1. It is apparent from the FTIR spectra that a number of biomolecules were present naturally in coffee, which were epitomized by characteristic peaks in this range. I ‘double bond region’ was categorized to be in agreement with the spectra segmentation described by Stuart [
42].
The surface chemistry of treated CH was found to be different as compared to untreated CH, as few of the characteristic functional groups vanished as a result of the activation procedure, which demonstrates that these functional groups were thermally labile. It is quite evident from observing and comparing the FTIR spectra of the treated and untreated CH that there is a decrease in the absorption band intensities of the aromatic group from CH due to the oxidative degradation of aromatic rings following the treatment [
43]. Similar spectra were obtained both for the untreated and the treated one but with reduced intensities of the peaks in the latter, clearly indicating the presence of leachables in the untreated CH, which were removed by chemical treatment [
44]. Additionally, the emergence of some new bands points toward the modifications brought in the raw CH.
3.1.2. SEM
Numerous investigations described the exploitation of the “SEM” examination for presenting the alterations on the surface of the developed biosorbents. The SEM images of unprocessed CH and cured CH at 5 K magnifications were given in
Figure 3, divulging the morphological structures. These SEM micrographs deliver valuable information on the alterations brought in by the pretreatment of the external characteristics of CH. According to
Figure 3a, the surface of unprocessed CH is even and compact. Untreated biomass exhibited relatively fewer irregular structures and pores.
The adhesion of dirt/impurities on the surface of CH, which ultimately blocked the pores or reduced their size, was the possible cause of such a smooth surface. Nevertheless,
Figure 3b makes it clear that treated CH was sufficiently rough, showing ridges, porous cavities, and heterogeneous surfaces. This may be attributed to the removal of dirt/impurities from the surface and also possibly due to the taking away of impurities and the breakdown of some biopolymers associated with the CH biomass. Treatment by NaOH affected lignin and holocellulose compounds, as well as enhanced unevenness by inducing cracking in the biomass. The elimination of hydrophilic molecules by the treatment of HCl and NaOH also had an influence on increasing surface coarseness and porosity. All this treatment resulted in a heterogeneous complexion of the surface of the sorbent, providing an additional surface area with great probabilities of APIs being trapped and attached to the surface [
45].
3.1.3. BET
CH was also characterized by its surface properties, which included surface area and pore size. This is a very important fundamental feature of any powdered and/or porous substance that can throw light on some very important information regarding their sorption characteristics. For imparting a considerable sorption capacity, a significant big “specific surface area” is required. The raw CH has a “BET surface area” of 0.163 m
2/g, which is amplified as a combined result of all chemical treatments thirteen times (2.1 m
2/g) higher than raw CH. This increase is the result of a substantial rise in the external surface area. This enlightens how biosorption ability amplified after treatments provided the biosorbent’s large surface area and the abundance of binding sites, therein assuring higher biosorption capacity. Additionally, the average pore diameter and the total pore volume were also calculated. Results indicate that the treatment protocol increased the total pore volume from 5.012 × 10
−4 cm
3/g (for the untreated CH) to 2.846 × 10
−3 cm
3/g (for the treated CH). It denotes the extra porous surface and augmented BET surface area of CH following this treatment. The enhancement of the sorption capability of raw CH after it is chemically treated can be due to the modifications of the surface area by augmenting the translation of mesopores (>5 nm pore diameter) to micropores (1.9867 nm pore diameter). (
Figure 4 and
Figure 5)
3.1.4. Elemental Analysis
To gauge the samples’ aromaticity and polarity, respectively, the elemental ratios of H/C and (O + N)/C were employed. CH had high aromaticity (H/C = 0.11) and non-polarity (O + N)/C = 0.55). Therefore, the π–π complex was fashioned by the aromatic ring of pantoprazole in order to promote the interaction between the π-electrons of the benzene ring and the active sites on the CH surface, resulting in the enhancement of the adsorption capacity [
46] (
Table 1).
3.1.5. Surface Charge
Adsorbents with zeta potential values ranging from −10 to +10 mV are considered neutral [
47]. CH is a hydrophobic material, as is evident from the almost neutral zeta potential (−0.947 mV for treated CH and −1.64 mV for untreated CH) and also supported by the fact that it floats immediately when dispersed in pure water, which means that it is hydrophobic in nature. APIs mainly possess hydrophobic territories. In an aqueous environment, hydrophobic moieties of APIs try to avoid interaction with aqueous domains, e.g., by conformational change. When hydrophobic moieties associate with the hydrophobic CH exterior, they are promptly adsorbed. Adsorption takes place through non-covalent interactions, i.e., the chemical bond formation does not take place. These are weak attachments (which pave the way for easy elution, i.e., recovery/identification with washing solvent) but the ultimate bonding strength rests on various factors, which in turn were governed by the magnitude, amount, and site of the hydrophobic territories on the exterior of the molecule. The neutral zeta potential suggests that neutral ions (hydrophobic) may adsorb in the electric double layer on the surface of CH, even though zeta potential cannot be used as a straightforward indicator of the degree of adsorption. However, the degree of adsorption is not directly proportional to the zeta potential.
3.2. Separation Conditions Optimization
Any analyte must be detected and accurately quantified under ideal experimental circumstances. Optimizing all experimental conditions is the key to obtaining the most sensitive chromatographic peaks and detecting the precursor ions. In order to obtain such a peak for pantoprazole, various eluents such as MeOH-water, “acetonitrile-water”, “acetonitrile-formic acid” (of varying concentrations), and “ammonium acetate-acetonitrile” were tried taking the “Acquity BEH, CSH C18” column of different lengths. The result of acetonitrile water with formic acid was encouraging with an “Acquity BEH C18” column (2.1 × 100; 1.7 μm). After determining peak shape and area, to exploit the chromatographic advantage, a gradient mobile phase comprising (A) water with 0.1% formic acid and (B) “acetonitrile” with 0.1% “formic acid” were dispensed at a flow rate of 0.25 mL/min, which was programmed as follows: 0–0.25 min, from A→B (10 to 90, v/v), 0.26→0.5 min (90 to 10 v/v), 0.5→1 min (10 to 90, v/v). Then, continue up to 2 min to 10 to 90 v/v and resume original situation until 4 min before the next injection. The use of a gradient system resulted in the appropriate peak with respect to the peak shape and sensitivity.
3.3. Preparation and Optimization of the SPE Conditions
The CH of three different particle sizes was selected as the extracting adsorbent. All three particle-sized CH adsorbents were prepared by passing them through various mesh sizes and they were subjected to several studies to examine the sorption potentials for pantoprazole.
3.4. The Effect of the Amount of Adsorbent on %ER
The EF and ER of the analyte from the aqueous matrix by the prepared adsorbent were initially guided by mass transfer from the aqueous matrix to the adsorbent. Therefore, the influence of the amount of adsorbent on the ER was evaluated.
To find a suitable amount of adsorbent in the ER, different amounts of adsorbent (100 mg, 150 mg, 200 mg, and 250 mg) were tried after forming a bed inside the cartridge. It was observed that the ER of the analyte increased when increasing the amount of adsorbent from 100 mg to 150 mg, and it almost became saturated after this amount. Finally, 150 mg of the adsorbent was selected for further validation experiments (
Figure 6). Owing to its larger surface area, the smallest mesh-sized adsorbent was observed to be the best adsorbent. On the basis of initial adsorption trails, solid-phase extraction studies of CH particles that were able to pass through the 250 µm mesh size were chosen. In order to achieve the most efficient adsorption of pantoprazole, the role of extraction time is very significant. It has been observed that if the drug solution or the real sample solution remains in contact with the sorbent for a longer duration, extraction efficiency increases. If the rate at which 200 mL of the drug solution being dispensed is decreased from 5 mL/min to 1 mL/min, the extraction efficiency increased by decreasing the flow rate, and the finest recovery was obtained at 1 mL/min and thereafter. Thus, the standard sample was dispensed through the SPE cartridge at a flow rate of 1 mL/min.
Quantitative aspects: The “calibration curves” (CCs) made by amending the selected analyte (pantoprazole) in distilled water samples were on a scale of 0.05–50 ng/mL. Linearity was observed in the constructed CCs (214.26 * x + 485.15), with a correlation coefficient (r
2) of ≥0.995. The LOD and LOQ were found to be 0.02 and 0.05 ng/mL.
Figure 7 showed the representative chromatogram of pantoprazole achieved after extraction by the developed adsorbent (A) and commercially available cartridges (B). The mean EF and % ER value calculated according to Equations (1) and (2) were 280-fold and 66.3%, respectively. The %ME assessed by the “pre-column infusion” technique neither showed any noteworthy “ion-suppression” nor “enhancement effects”, as computed by Equation (4).
3.5. Comparison of a CH-Based Column with Respect to a Commercially Available C18 Column
Comparing the efficiency of CH-based columns with commercially available C18 columns, it was found that the CH-based column was able to separate the drug pantoprazole from the wastewater with about 50% efficiency compared to the C18 column.
3.6. Application in Real Samples
To ensure the reliability of the adsorbent for the abstraction of analytes from wastewater samples, the method was applied to determine pantoprazole in raw wastewater samples acquired from influents of the “WWTP of the King Saud University, Riyadh, Saudi Arabia”. Unfortunately, no target analyte (pantoprazole) was detected in the obtained sample, demonstrating that possibly the analyte was below the LOD for this assay or the sample was devoid of this drug. Further, the samples were amended with varying concentrations (0.3, 1, 15, and 45 ng/mL) of the QC samples and the analyte was removed by the previously mentioned extraction process. All samples were analyzed in triplicate and the recoveries were determined as the “percentage relative recoveries”, computed as stated in Equation (3). According to
Table 2, the recoveries of the analyte were in the range of 93.0 to 102.0%, with a %RSD of 3.72 to 12.7%.
When the result of the present study was compared with one previously published study dealing with the extraction of some active pharmaceutical ingredients, it was found that the natural adsorbent used as solid-phase extraction material (treated CH) performed better than the cork [
48]. The mean EF and %ER value for CH was 280-fold and 66.3%, respectively, whereas cork EF was in the range of (38–62)-fold and %ER was found to be (3–5). Another comparison was made in a similar type of work in which natural adsorbent waste corncob was used for the solid-phase extraction of tartrazine [
49]. Recovery of tartrazine from the soft drinks spiked at four different concentration levels of 0.1 ng/mL, 2.0 ng/mL, 7.5 ng/mL, and 10 ng/mL were found in the range of (97.78–98.4). An almost equal % of the recovery of pantoprazole was found in the present study (
Table 3) when the real-time wastewater was spiked with the drug, indicating the usability of the adsorbent.


 ,
, 


