Article

CO2 Capture and H2 Recovery Using a Hollow Fiber Membrane Contactor

1
Industrial Gas Research TF Team, Particulate Matter Research Center, Research Institute of Industrial Science & Technology (RIST), 187-12, Geumho-ro, Gwangyang-si 57801, Jeollanam-do, Republic of Korea
2
Department of Chemistry, College of Natural Sciences, Yeungnam University, Gyeongsan 38541, Gyeongsangbuk-do, Republic of Korea
3
Separation and Purification Sciences Division, 3M, Hwaseong-si 18449, Gyeonggi-do, Republic of Korea
4
Department of Chemical and Biological Engineering, Sookmyung Women’s University, 100 Cheongpa-ro 47-gil, Yongsan-gu, Seoul 04310, Republic of Korea
*
Authors to whom correspondence should be addressed.
Separations 2023, 10(7), 367; https://doi.org/10.3390/separations10070367
Submission received: 9 June 2023 / Revised: 19 June 2023 / Accepted: 20 June 2023 / Published: 22 June 2023
(This article belongs to the Section Materials in Separation Science)

Abstract

:
In this study, hydrogen was recovered and purified by using a membrane contactor unit from CO2-rich gas without the use of any basic chemicals such as amines. The membrane operational parameters were adjusted to achieve high CO2 removal and H2 recovery. The effects of gas flow rate, pressure, gas composition (CO2/H2 ratio), pressure difference between liquid and gas, and gas/liquid ratio on CO2 removal and H2 recovery were investigated. Depending on the gas flow rate, the contact time between gas and liquid could be controlled, changing the absorption amounts of CO2 and H2. Regarding gas composition, an increase in the CO2/H2 ratio from 0.25 to 1 boosted H2 recovery. Furthermore, increasing the CO2/H2 ratio above 1 (from 1 to 3) generally reduced H2 recovery from 98.7% to 83%. Additionally, supplementation with the optimal amount of additive enhanced CO2 removal and H2 recovery. Thus, using a membrane contactor system results in high CO2 removal (82.7–93.5%) and H2 recovery (91.5–98.7%). Moreover, H2 production and separation can be performed in one system, implying that CO2 removal can be performed more efficiently by the membrane contactor. This study offers a new and promising route for producing high-purity H2 while removing CO2.

Graphical Abstract

1. Introduction

Given that fossil fuels will become scarce in the coming decades, the hydrogen (H2) economy has recently garnered considerable attention [1,2,3,4]. As an energy source, H2 has the advantages of being a sustainable fuel resource (such as biomass or water) that contains no air pollutants and could potentially reduce our dependency on fossil fuels [5,6]. Currently, the demand for H2 in the chemical process industry is growing. It is especially effective for hydrotreating petroleum-derived feedstock to remove sulfur, nitrogen, and metals to generate clean-burning fuels. Furthermore, unlike wind and solar energy, H2 is an easy-to-store and transportable energy source; thus, it is considered the most viable future energy carrier. This growing demand increases the economic need for further improvements in H2 production and recovery. H2 can be produced by several reactions, such as a steam methane reaction (SMR), water–gas shift (WGS), a dry reforming reaction (DRM), the partial oxidation of methane (POM), autothermal reforming, and methane decomposition [7]. A SMR is usually conducted in 700–1000 °C and involves methane and steam, leading to the production of hydrogen and CO (with CO2 being the main byproduct) [7]. In order to produce more H2, WGS is coupled with the SMR process because CO and steam are converted into CO2 and H2 [7]. Through these processes, the resulting stream contains not only hydrogen but also CO2. In order to use hydrogen as a energy source for fuel cells or as a raw material for chemical reactions, the byproduct gas (CO2) needs to be removed or separated. CO2 can be captured by several processes, including absorption processes using sorbents, adsorption processes using adsorbents, cryogenic distillation in low temperature, and membrane-based processes [8].
In recent years, membrane-based technology has been widely recognized as an effective technology for various separation processes. A membrane-based process unit is compact, provides high performance, is low maintenance, uses low energy, requires low capital expenditure, and provides ease of servicing [9,10,11,12]. Membrane technology can be more advantageous than other separation methods, including adsorption, absorption, and cryogenic distillation. In 1980, a large-scale industrial plant installed Monsanto’s first H2/N2 membrane separation unit for ammonia purge gas [13,14]. Compared to spiral wound and plate and frame units, hollow fiber membranes have the highest surface area density among membrane configurations [15,16,17]. The separation of CO2 using membrane technologies has been widely studied. For selective CO2 separation in dry basis, the development of membrane materials is important due to permeability and selectivity [18]. Polymer-based membranes such as acrylonitrile-butadiene-styrene and polyethylene glycol-based membranes, as well as acrylonitrile-butadiene-styrene and poly vinyl acetate, were studied for CO2 separation [9,10].
The use of gas/liquid (G/L) hollow fiber membrane contactors is recommended since they combine the advantages of both hollow fiber membrane and G/L contactors. They have a high surface area, which makes them ideal for scaling up and scaling down. The use of membrane separation technology is attractive because it does not induce a phase change, and this leads to low energy consumption along with control operation parameters such as pressure, G/L ratio, G/L flow pattern, and operation temperature [19,20]. A CO2 absorption model was studied in a hollow fiber membrane contactor and compared with experimental and calculated data with respect to the effects of pressure, concentration, liquid velocity, and temperature, which can be used to inform design processes [20]. System design and process optimization are important for the successful operation of a membrane contactor. Although these parameters could enhance the performance of a membrane contactor system, some hurdles still remain in practice, like membrane wetting and membrane fouling [21,22]. Absorption on amino acid salts or highly viscous liquid such as glycerol solution in membrane contactors has been studied, leading to the creation of a numerical model of absorption with wetting characteristics such as surface tension and breakthrough pressure and the mass transfer phenomena [21,22]. Recently, a theoretical model of CO2 absorption on acid–base equilibrium was calculated depending on pH swing and compared with the experimental and calculated results of a membrane contactor system coupled with an absorption, desorption, and loop system [23].
This study aimed to develop an efficient and selective method for the removal of CO2 from gas streams containing high CO2 levels. Deionized (DI) water was used as the absorption medium, and hollow fiber hydrophobic membranes acted as the contactor. Various operating conditions were employed to investigate the effects of selective CO2 removal and H2 recovery. The effects of gas flow rate, pressure, gas composition (CO2/H2), G/L pressure differences, and G/L ratios on H2 outlet concentrations and CO2 removal percentages were examined. After screening the membrane contactor, we utilized it to help facilitate CO2 removal and hydrogen recovery. A water–gas shift reaction is capable of producing hydrogen, and it makes one mole of CO2 when one mole of hydrogen is synthesized. Thus, we chose this reaction as the model, as it allowed for hydrogen production and CO2 removal via water–gas shift reaction using CO and a membrane contactor, respectively.

2. Experimental Section

2.1. Hollow Fiber Membranes and Modules

LIQUI-CEL® 2.5 × 8 membrane contactor G453 (USA) provided polypropylene (PP) hollow fiber membrane modules for absorption and desorption. An overview of the membrane and module specifications is provided in Table 1.

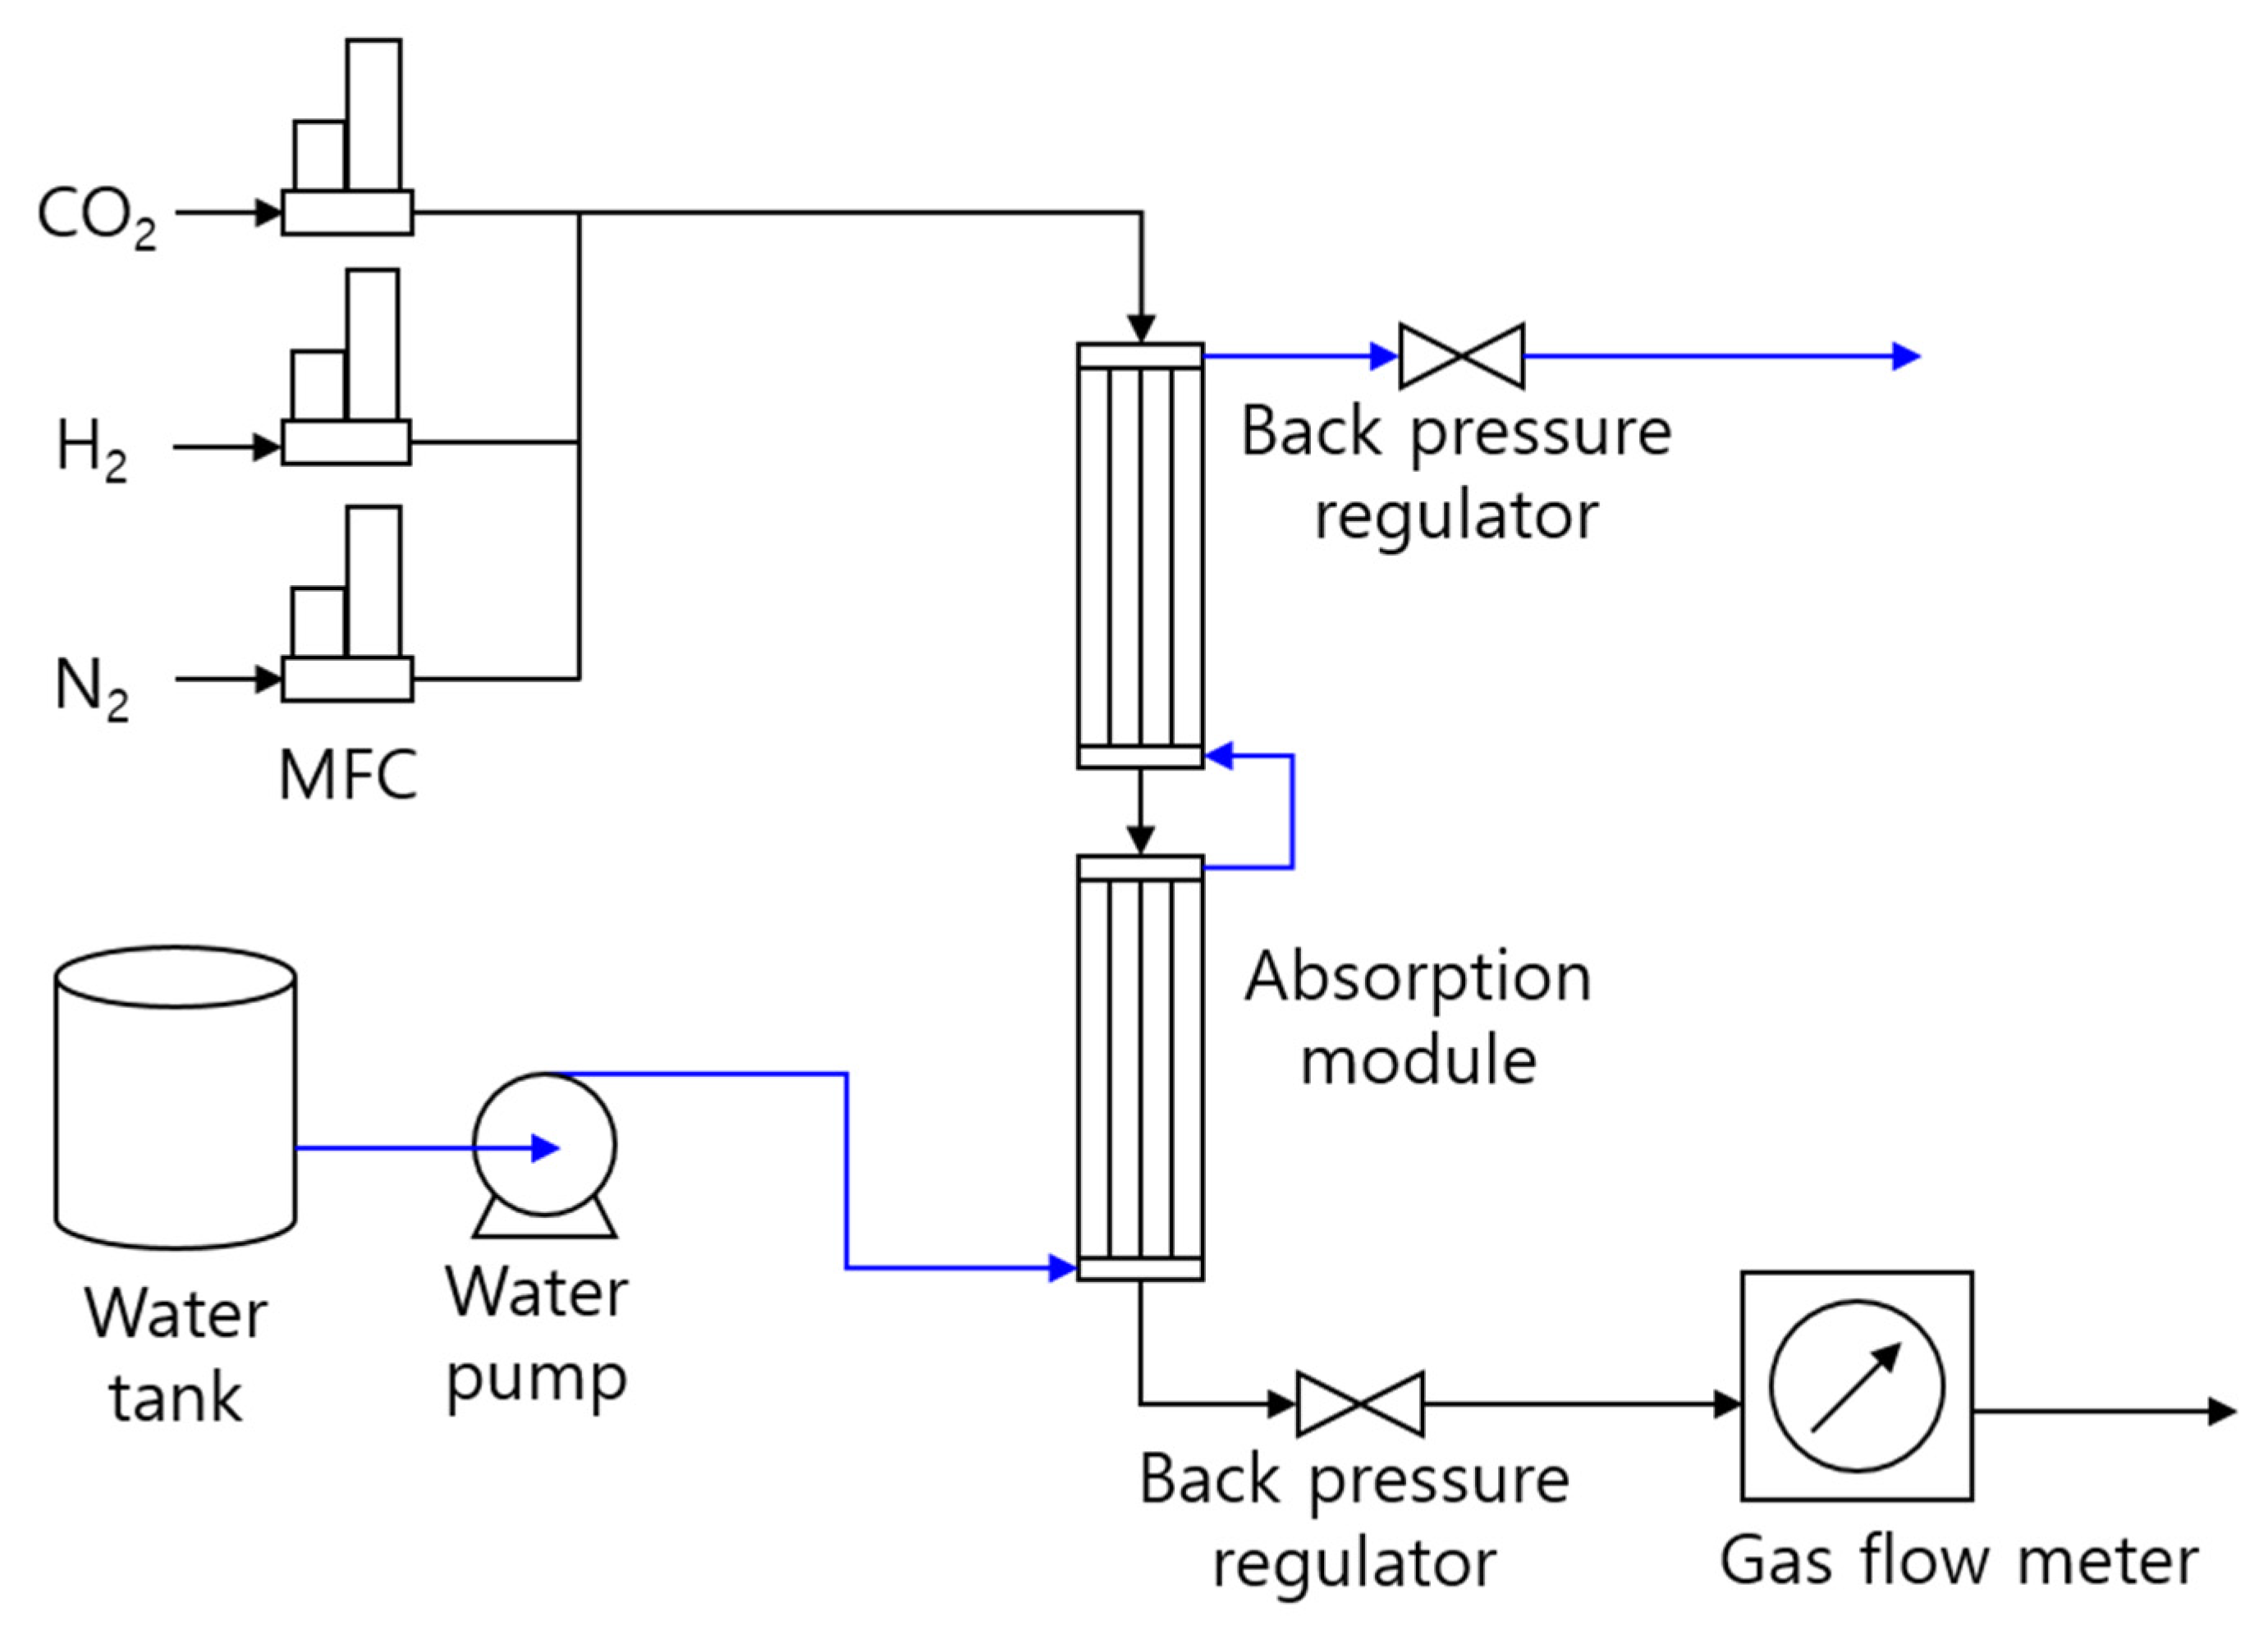
2.2. Experimental Setup

To prepare feed gas mixtures, mass flow controller-adjusted pure gas streams of various concentrations (43.6% H2, 12.8% N2, and 43.6% CO2) were mixed. High purity CO (99.95%), CO2 (99.999%), and N2 (99.999%) gases were purchased from Sinil Gas, Gwangju city (South Korea). Subsequently, the feed stream was passed through two modules of hollow fibers in a series from the lumen side to screen the operating conditions between the low and high boundaries and test the feasibility of the CO2 removal process on a relatively large scale. Deionized water was supplied from Samchun Chemicals in pyeongtaek city (South Korea) and used as an absorbent. Flow meters were used to control the liquid pumps, which fed into the shell side of the membrane modules in a countercurrent direction. The experiment was conducted at 22 °C, with the modules set at a constant temperature. The pressure at which liquids operated was consistently 1.5 bar greater than that at which the gases operated. A scheme of the experimental setup is shown below (Scheme 1).
Gas concentration was measured by using a gas chromatography (GC) system equipped with a TCD (thermal conductivity detector) (Agilent 7890A GC System, Agilent Technologies, Santa Clara, CA, USA). The gas was injected into the fixed volume loop (1 mL) and transferred into packed column (Supelco Carboxen 1000) via a 6-port switching valve. The temperature of the oven was kept the same (140 °C), and the flow rate of the carrier gas (99.999% Ar, Sinil gas, Gwangju city, Republic of Korea) was set at 30 mL/min. The gas composition was calculated after the calibration using standard gas, which is mixture of H2, N2, CO, and CO2.
C O 2   R e m o v a l % = A m o u n t   o f   C O 2 q C O 2 , i n l e t A m o u n t   o f   C O 2 q C O 2 , o u t l e t A m o u n t   o f   C O 2 q C O 2 , i n l e t
H 2   R e c o v e r y ( % ) = A m o u n t   o f   H 2 q H 2 , o u t l e t A m o u n t   o f   H 2 ( q H 2 , i n l e t )
q C O 2 , i n l e t = C C O 2 , i n l e t × q t o t a l , i n l e t
where C represents concentration (%), measured by GC, and q denotes gas flow rate (L/min), measured by a gas meter.

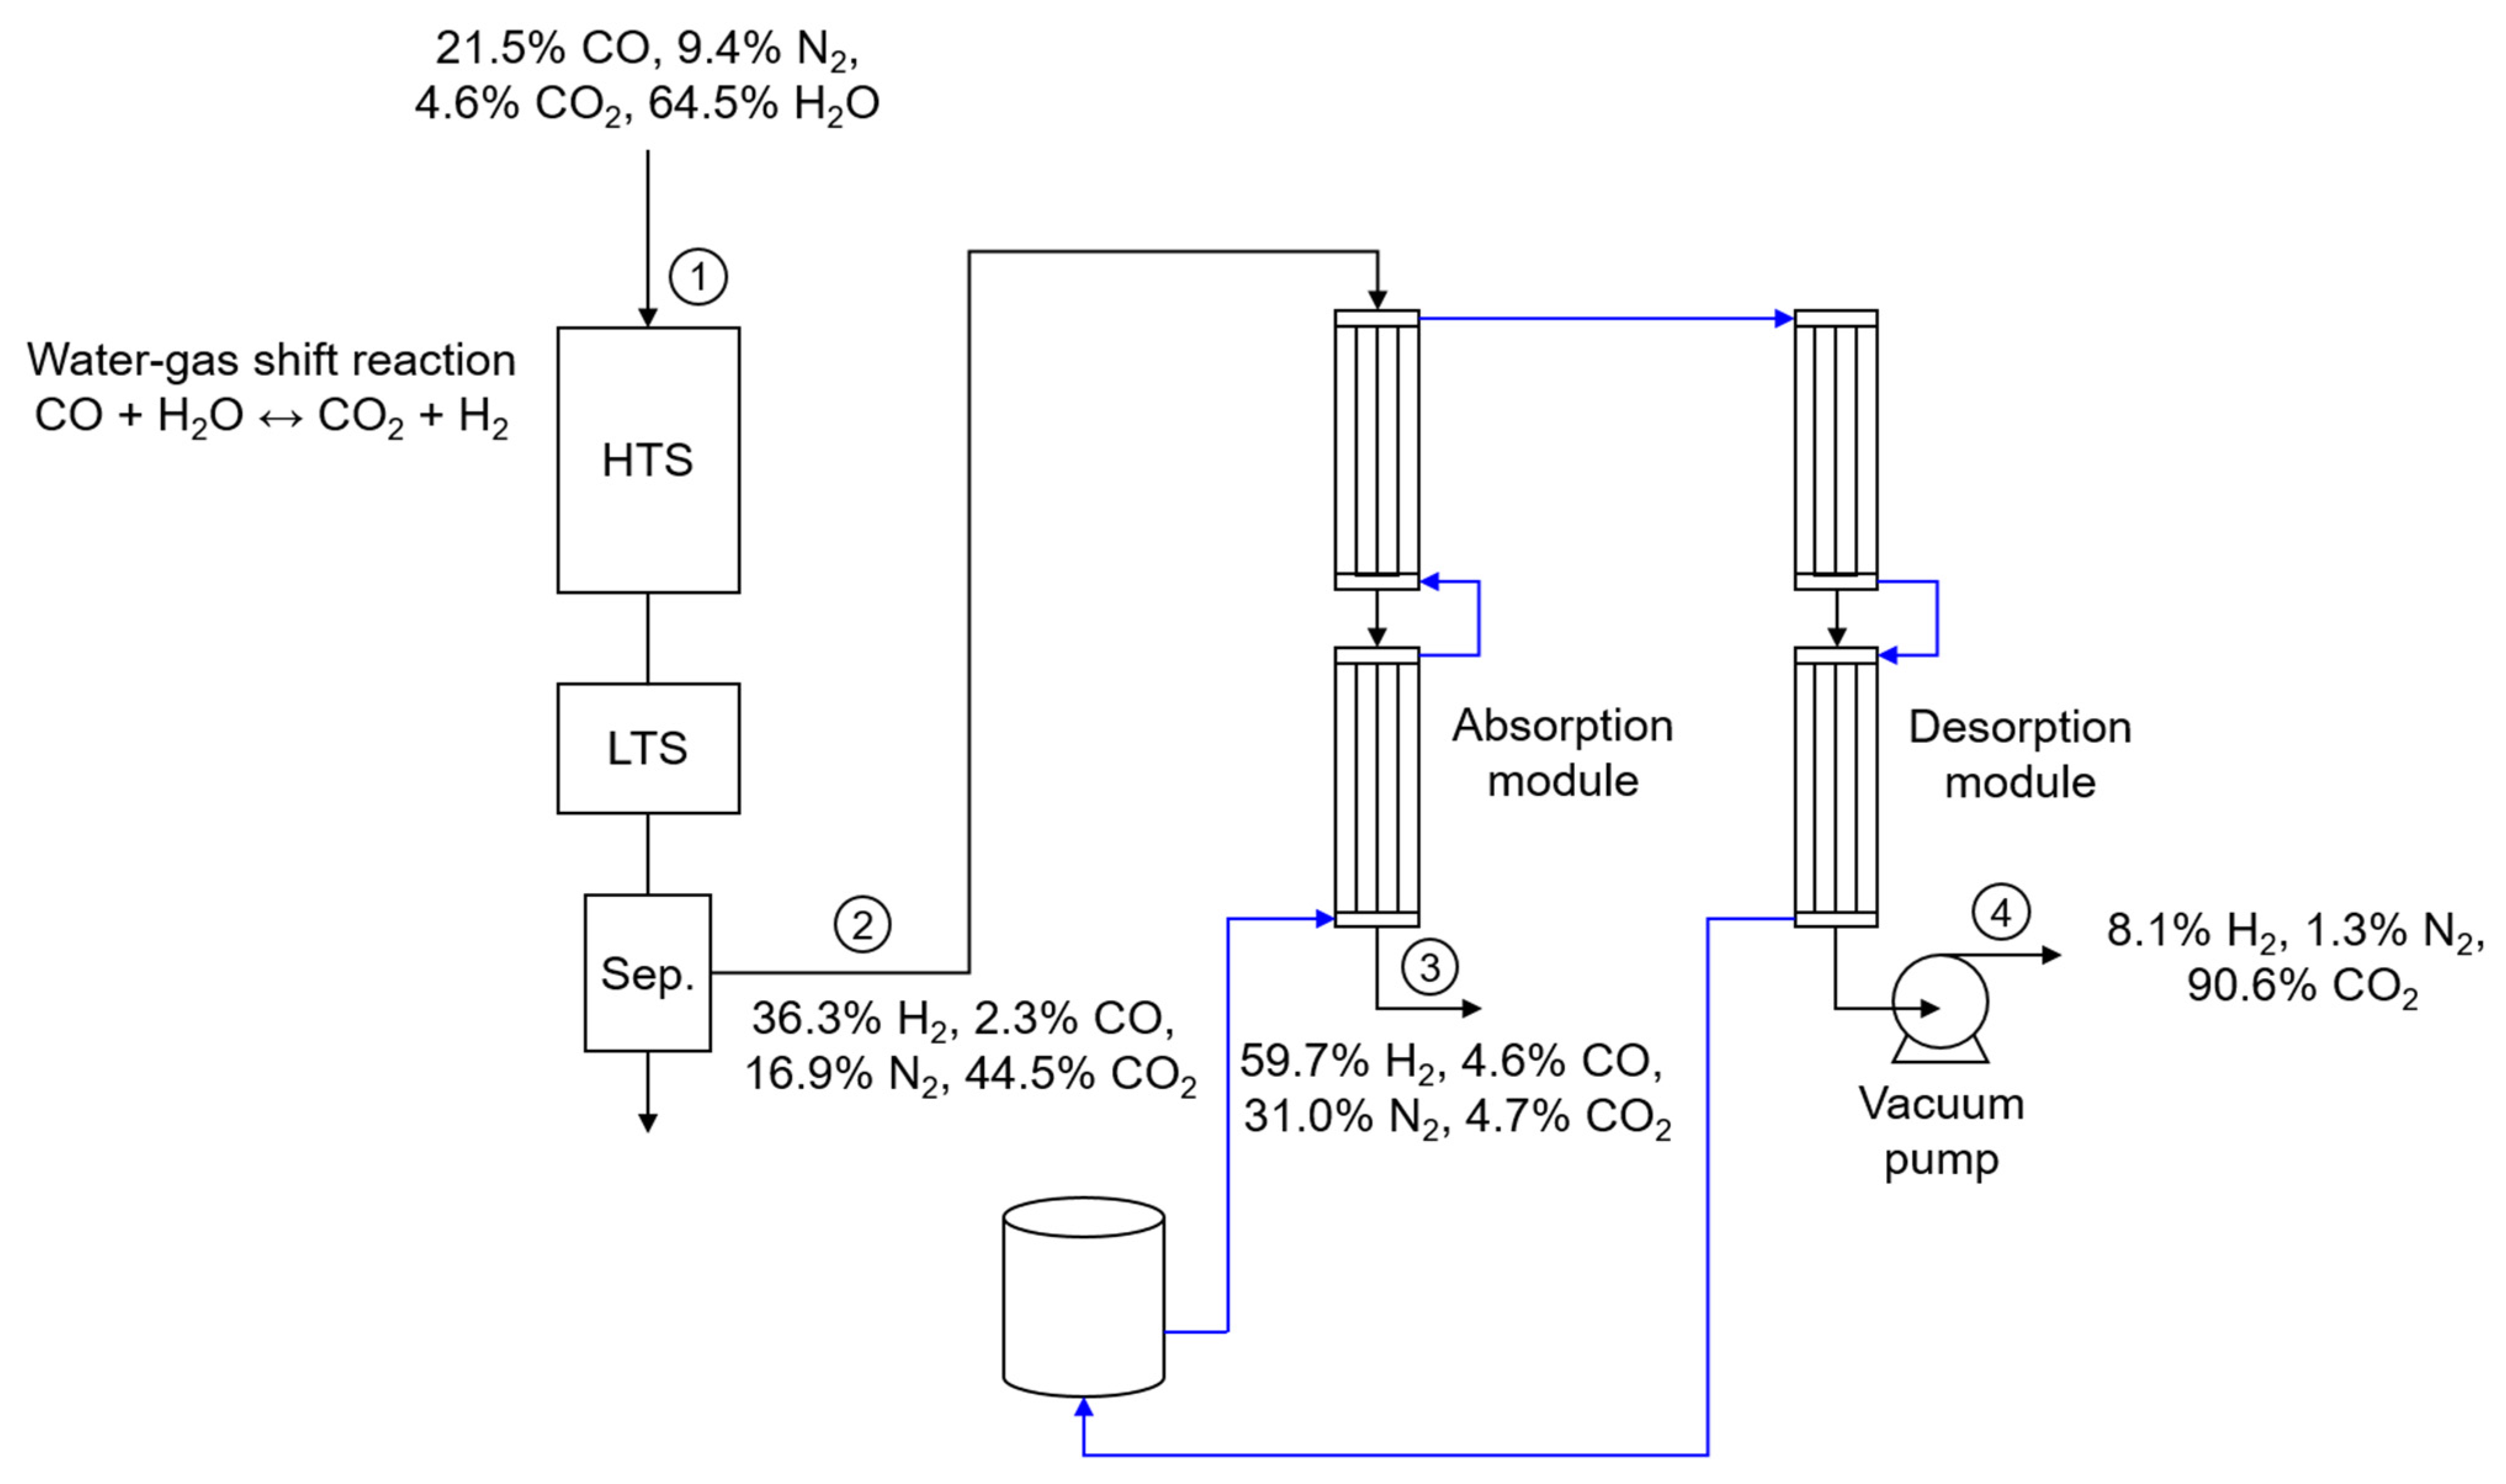
2.3. Water—Gas Shift Reaction Coupled with Membrane Contactor

The water—gas shift reaction was conducted in two different catalytic reactors, one packed in a commercial high-temperature shift (HTS) catalyst and one packed in a commercial low-temperature shift (LTS) catalyst. Next, 100 mL of Fe-Cr based HTS and 50 mL of Cu-Zn based LTS were added. The gas composition was 21.5% CO, 9.4% N2, 4.6% CO2, 64.5% H2O, and total gas flow rate was 20 L/min. In order to make a mixture gas, the dry based gas was controlled via a mass flow controller using pure gases, and water was supplied via a HPLC pump and preheated at 150 °C to make vapor. The reaction pressure was 7 barg, and the steam to CO (S/C) ratio was 3. HTS and LTS were conducted at 450 and 250 °C, respectively. In the membrane contactor system, the pressure was the same as that in the water–gas shift reaction. Water was injected into the membrane at a rate of 6 L/min, and the pressure difference between gas and liquid was 1.5 bar. The effluent gas was also analyzed using GC. In addition, the gas flow rate was measured by using a gas flow meter (Shinagawa, Japan).

3. Results and Discussion

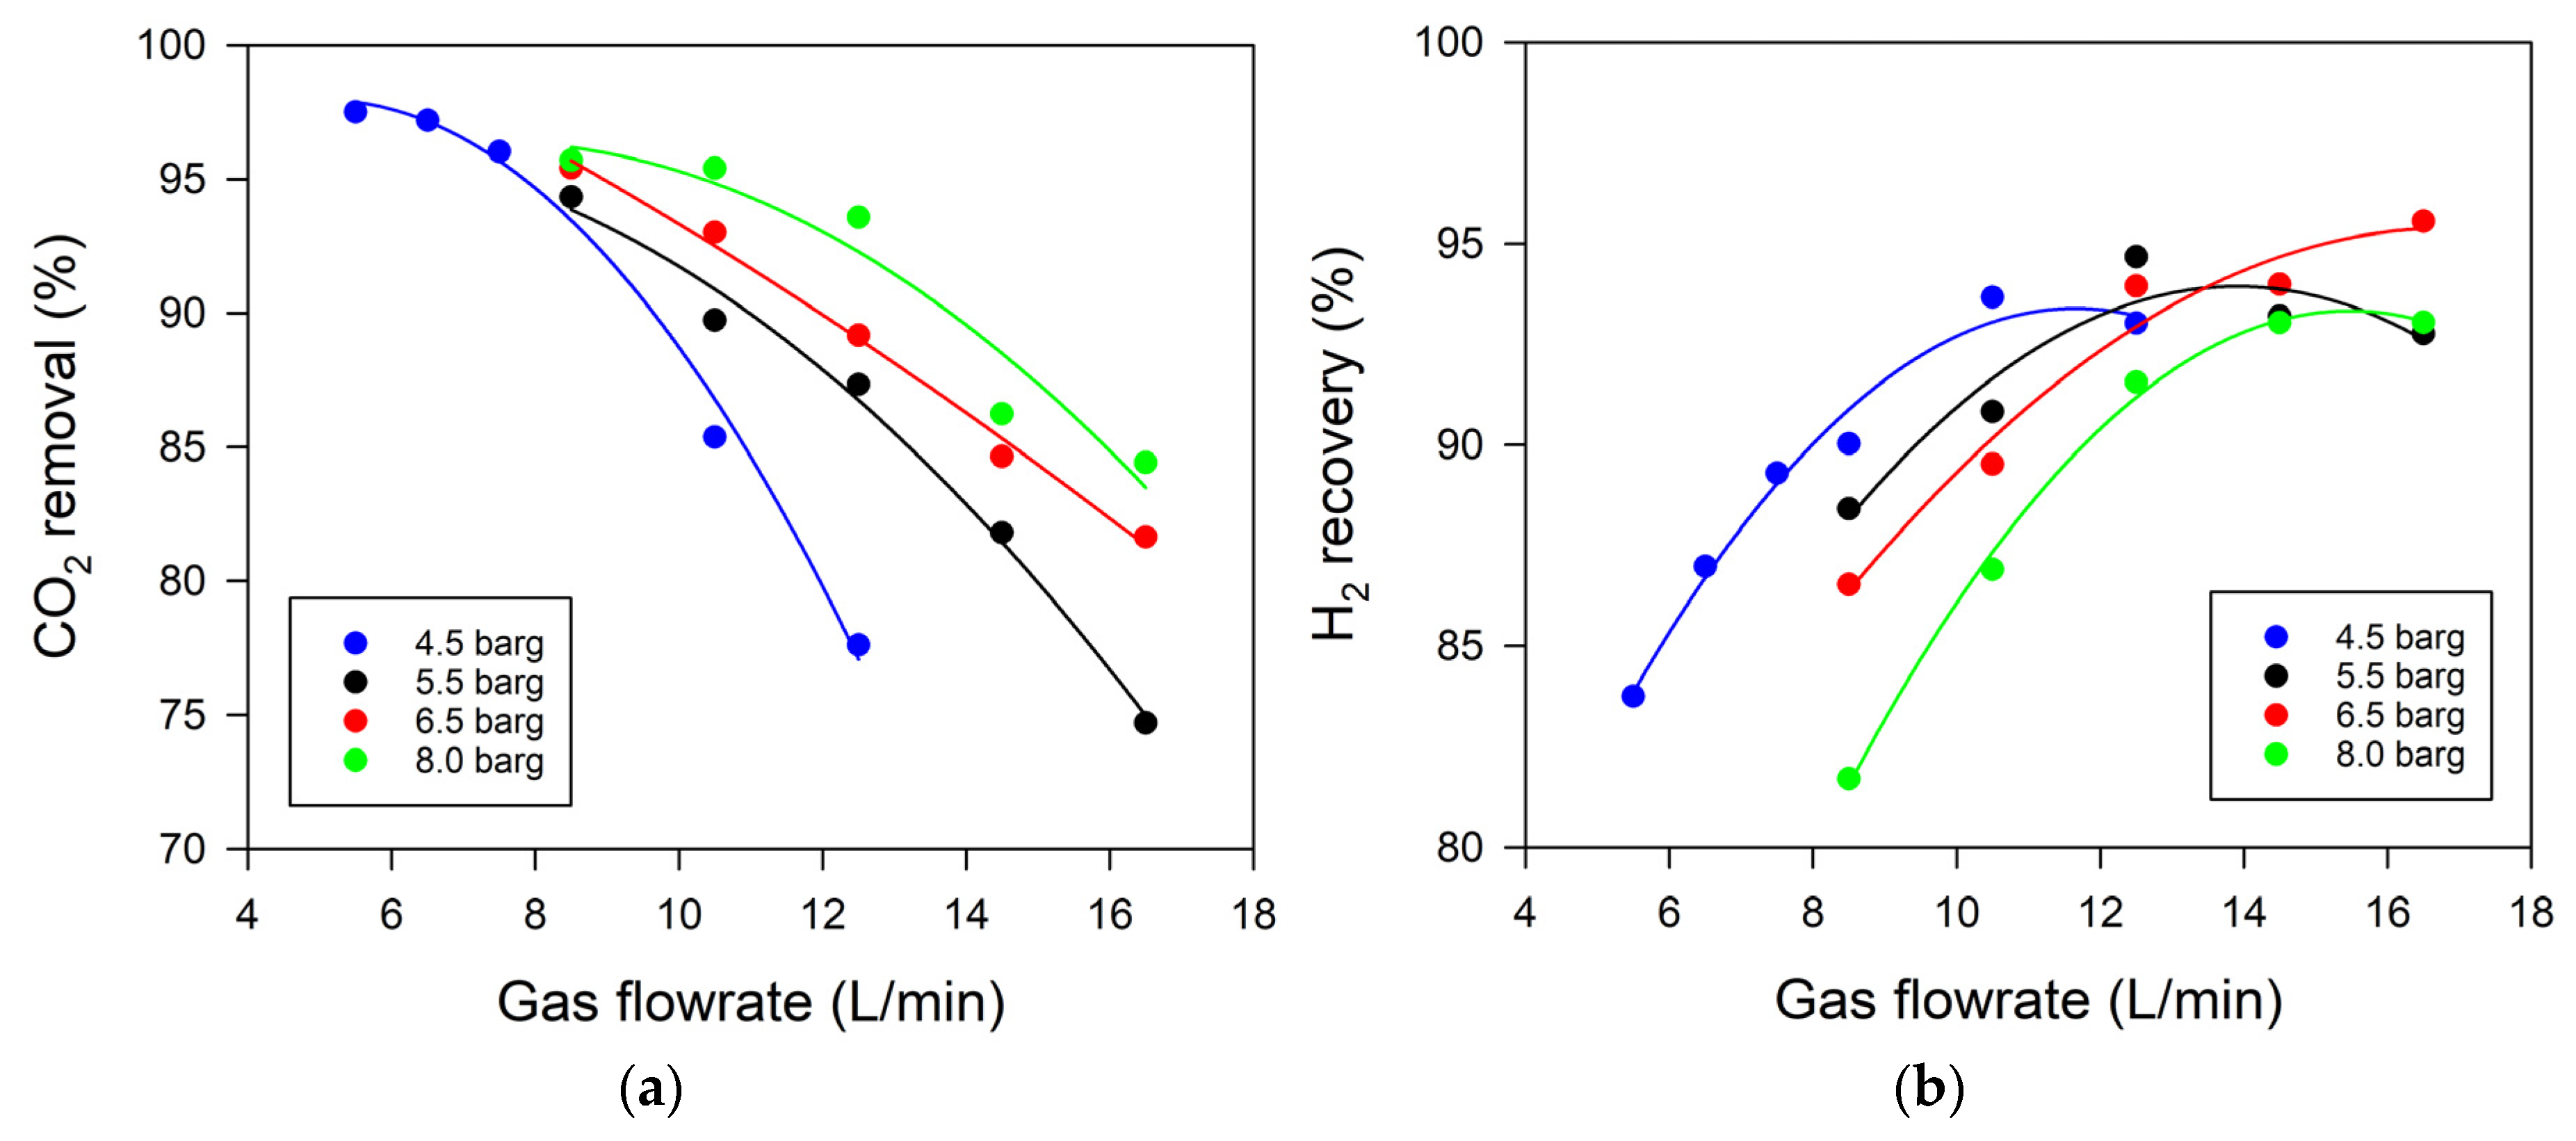
3.1. Effect of Gas Flow Rate and Pressure

It is known that pressure plays a vital role in the equilibrium between liquids and gases [24]. Here, a series of experiments were conducted to observe the effects of gas flow rate (5.5–16.5 L/min) and pressure (4.5–8 barg) simultaneously while keeping the following parameters constant: gas concentration (43.6% H2, 12.8% N2, and 43.6% CO2), liquid flow rate (3 L/min), and the pressure difference between gas and liquid (ΔP) 1.5 bar. Gases with different flow rates in the range of 5.5–16.5 L/min were consecutively fed into the system operated with two contactors in series. The pressure was progressively increased, as shown in Figure 1a,b. As shown in Figure 1a, at the same gas flow rate of 10.5 L/min, CO2 removal increased from 85.4% to 95.4% as the pressure increased from 4.5 to 8 barg. This trend was also confirmed in the series of experiments with a gas flow rate of 12.5 L/min, in which CO2 removal increased from 77.6% to 93.6%. These results indicate that more CO2 was dissolved at a higher pressure using the same amount of water in the membrane contactor. These results are attributable to Henry’s law, which states that the amount of dissolved gas is proportional to the partial gas pressure.
The effect of gas flow rate on CO2 removal is also shown in Figure 1a. At a pressure of 4.5 barg, increasing the gas flow rate from 5.5 to 12.5 L/min decreased CO2 removal from 97.5% to 77.6%. This trend was also observed in the 4.5–8.0 barg range. Injecting more mixture gas into the membrane contactor module decreased the contact time between gas and liquid. Reaching equilibrium between gas and liquid requires enough time for the amount of gas dissolved in water and the amount of gas evaporated from water to be equal to solubility. Therefore, given that reducing contact time increases the gas flow rate, these results lead to a decrease in CO2 removal.
Figure 1b shows the membrane contactor performance in terms of H2 recovery. At a gas flow rate of 8.5 L/min, H2 recovery was reduced from 90.0% to 81.7% as the pressure was increased from 4.5 to 8.0 barg. This trend was also found at a gas flow rate of 10.5 L/min, indicating that H2 can also be dissolved in water, and based on Henry’s law, its solubility is proportional to pressure. When the gas flow rate was increased at the same pressure (6.5 and 8 barg), H2 recovery was enhanced. The short contact time, which involved injecting more gas, indicated that H2 equilibrium between gas and liquid was not reached, leading to reduced H2 loss. However, the H2 recovery in the range of 12.5–16.5 L/min showed similar performance (increasing from 91.6% to 95.6%). This could be because some H2 may have moved through the porous membrane contactor before being dissolved in water, resulting in H2 recovery being saturated at about 95%.

3.2. Effect of Gas Composition (CO2/H2 Ratio)

As shown in Figure 2, the effect of gas composition (CO2/H2) on CO2 removal and H2 recovery was investigated. All operating conditions were kept constant, as in the previous experiment (i.e., gas concentration: 12.8% N2, gas flow rate: 12.5 L/min, liquid flow rate: 3 L/min, pressure: 5.5 barg, pressure difference between gas and liquid phase: 1.5 bar). In an experiment in which the CO2/H2 ratio was increased from 0.25 to 3 by controlling the gas flow rate of CO2 and H2, the results showed that CO2 removal steadily increased from 78.0% to 94.0%. The CO2 concentration was controlled based on the CO2/H2 ratio, while N2 was fixed at 12.8%. Thus, when CO2 was high, indicating that more CO2 was injected into the membrane contact module, CO2 removal increased due to the high CO2 partial pressure.
An increase in the CO2/H2 ratio from 0.25 to 1 resulted in an increase in H2 recovery from 92.8% to 96.9%. Increasing the CO2/H2 ratio above 1 (i.e., from 1 to 3) reduced H2 recovery from 98.7% to 83.5%. Thus, it can be assumed that the higher H2 partial pressure in the CO2/H2 range of 0.25 to 1 led to more H2 being moved to the water side through the membrane contactor because of the partial pressure factor of Henry’s law. Above a CO2/H2 ratio of 1, H2 recovery gradually declined from 96.9% to 83.5%. When the CO2 ratio was high in the mixture gas, CO2 could be easily dissolved in water due to the partial pressure at the inlet part of the membrane contactor. Subsequently, the mixture gas flow rate was reduced, resulting in increased contact time, which meant that more H2 could be moved into the water. This CO2/H2 ratio trend is quite similar to that of the gas flow rate in Figure 1, which shows a tradeoff relationship between CO2 removal and H2 recovery.
As more CO2 was dissolved or removed through the membrane contactor, the total mixture gas flow rate decreased, extending the contact time. Thereafter, in a near-equilibrium environment, H2 was dissolved in water, resulting in low H2 recovery. Conversely, less CO2 was removed in the specific experimental condition, indicating that its concentration change was minimized and more H2 was recovered.

3.3. Effect of G/L Ratio

The flow patterns of gas and liquid have an important impact on membrane contactor absorption performance. Our experiment examined the effects of G/L ratios ranging from 2 to 13. Figure 3 depicts the performance of the membrane contactor system in terms of CO2 removal and H2 recovery. For all the conditions examined, the experimental results reveal that better system performance was achieved at a lower G/L ratio (=2) for CO2 removal, while for H2 recovery, a higher G/L ratio (=13) yielded better system performance. In the G/L range of 1.3–2.7, CO2 removal showed a similar performance (94.1–96.7%), and H2 recovery was about 76.1–85.1%. As the G/L ratio increased further from 3.3 to 12.5, CO2 removal gradually decreased from 89% to 48.3%, except at the G/L ratio of 5, and H2 recovery increased from 90.5% to 95.5%. At a low G/L ratio, the liquid flow rate was sufficiently higher than the gas flow rate and high enough to dissolve the gas. This means that more gas could be moved into the water, resulting in high CO2 removal and low H2 recovery. Meanwhile, at a high G/L ratio, the gas flow rate was significantly higher than the liquid flow rate, indicating a low contact time. This resulted in less gas absorption in water and, as a result, low CO2 removal and high H2 recovery. This trend is also consistent with that of the gas flow rate and the CO2/H2 ratio experiments.

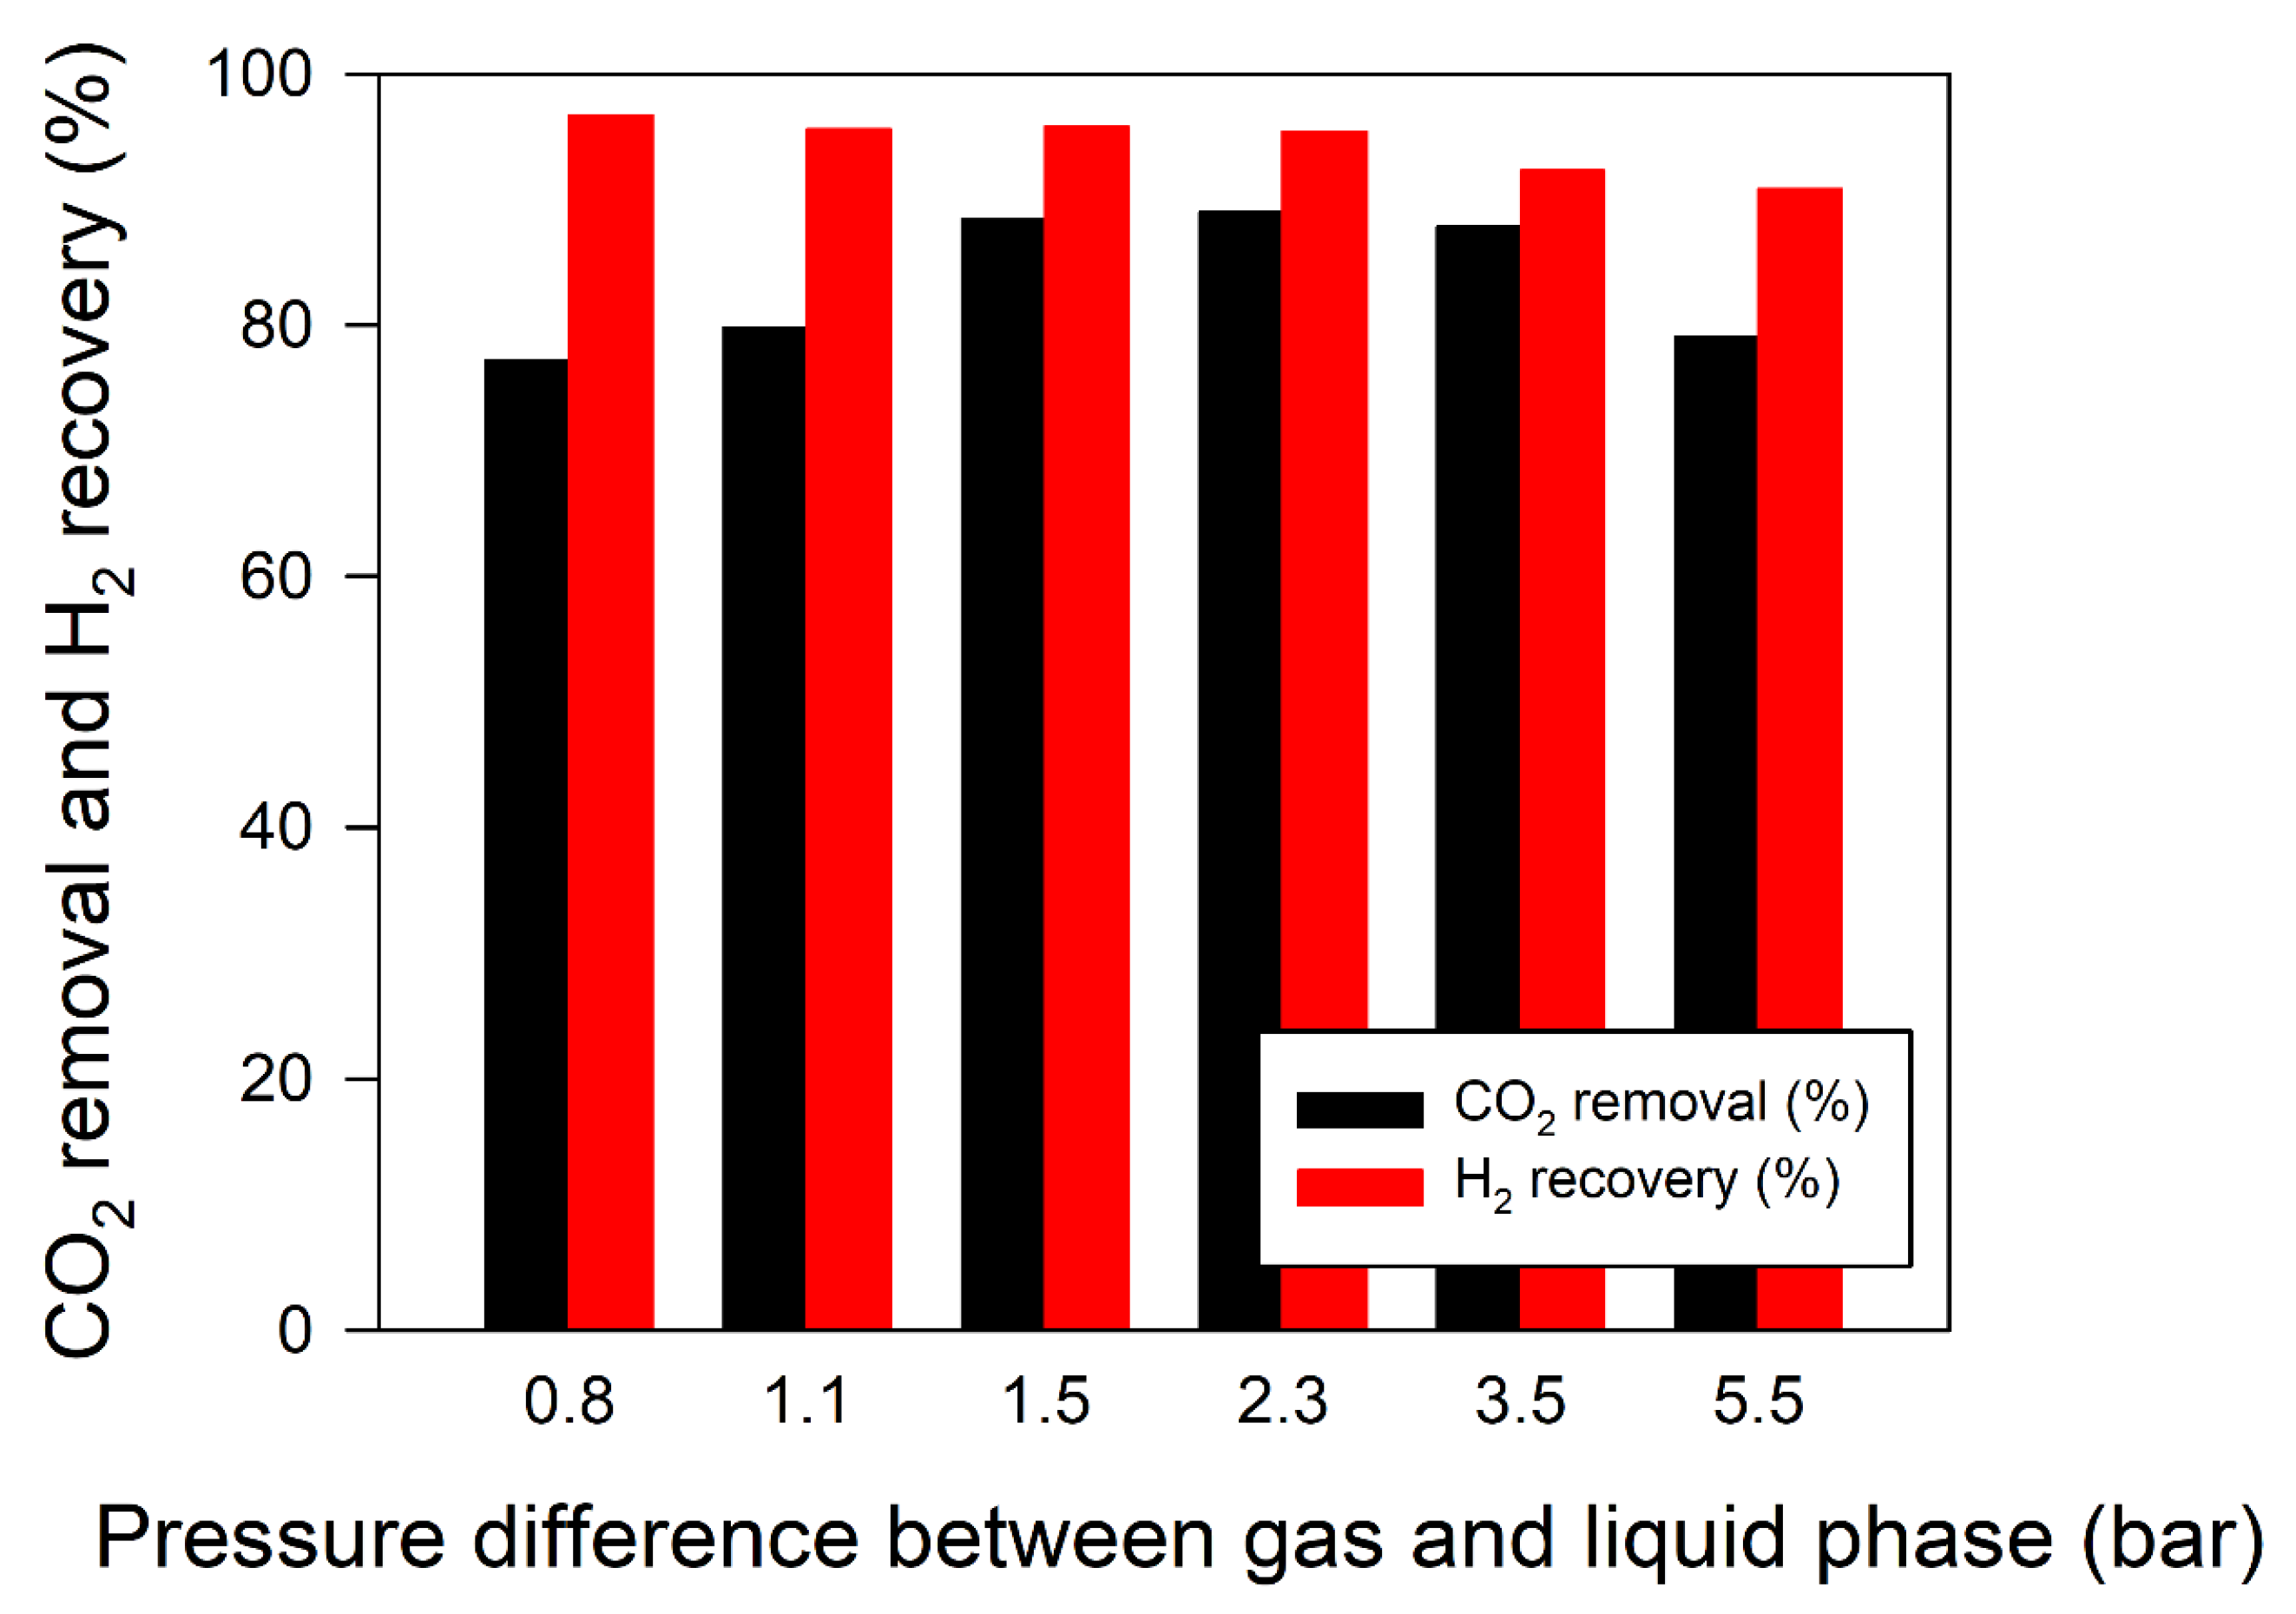
3.4. Effect of the Pressure Difference between Gas and Liquid

The effect of the pressure difference between gas and liquid on CO2 removal and H2 recovery was investigated, and the results are shown in Figure 4. It was found that CO2 removal increased from 77.3% to 89.0% when the pressure difference increased from 0.8 to 2.3 bar. Furthermore, CO2 removal gradually decreased to 79.1% (at 5.5 bar). H2 recovery slightly declined from 96.7% at 0.8 bar to 90.8% at 5.5 bar, indicating that more H2 was dissolved as the pressure difference increased.
At a low-pressure difference, the contact between gas and liquid is not favorable for CO2 and H2 dissolution. This suggests that the surface between gas and liquid is biased to the liquid part. If the gas does not reach the liquid surface through the membrane, gas dissolution is unfavorable. Thus, CO2 removal and H2 recovery would decrease and increase, respectively. When the pressure difference is quite high (i.e., above 2.3 bar), more water penetrates the membrane, and the surface is located near the gas part. If this surface is developed in the middle of the porous membrane, the contact surface can be maximized, leading to increased gas dissolution. Because of the high pressure difference, the surface is located near the gas part, which makes contact between gas and liquid unfavorable. Therefore, the optimum pressure difference was in the range of 1.5–2.3 bar.

3.5. H2 Production Using Water—Gas Shift Reaction Coupled with the Membrane Contactor

The water—gas shift reaction is known as a exothermic and equilibrium reaction. Thus, it is favorable in lower temperature; meanwhile, it also requires energy to react CO and H2O into H2 and CO2. This reaction is commercially operated in high temperatures, while it is sometimes conducted in low temperature to convert unreacted CO [24]. In this study, two different commercial catalysts, one Fe-Cr based and one Cu-Zn based, were applied in a tubular reactor. The reaction temperature for HTS and LTS was set by referring to several previous studies [25]. The water–gas shift reaction equation is as follows: CO + H2O ↔ CO2 + H2. When one molecule of H2 is produced, CO2 is converted from CO in equal stoichiometry. If all the CO reacts with H2O in a water–gas shift reaction, the H2 concentration is about half in the product. To use H2 in different applications, such as fuel and chemical reactions, CO2 needs to be removed from the product gas. Here, a membrane contactor can be applied. Thus, we prepared an HTS and LTS reactor system and connected it to the membrane contactor system in series, as displayed in Figure 5.
The product composition is summarized in Table 2. The flow rate of each component was calculated based on the total flow rate and gas composition (measured by GC). Its mass balance error was less than 5%. In the reaction part of this system, 4.3 L/min CO, 1.88 L/min N2, 0.92 L/min CO2 mixture gas, and 12.9 L/min vaporized H2O (liquid-based; 10.4 mL/min) were injected to HTS and LTS reactors in series. As a result, 94% CO conversion was achieved by the HTS and LTS reactions. After the water–gas shift reaction, the gas was cooled down to an ambient temperature using the circulator, and condensed water was removed by separator before the use of the membrane contactor. Through a catalytic reaction, CO2 concentration increased from 4.6% to 44.5%, and H2 increased to 36.3%. Normally, H2 is separated by using pressure swing adsorption (PSA) or cryogenic distillation [26,27]. This process needs to remove impurities such as CO2, CO, and N2 and increase H2 concentration using two different types of adsorbents: active carbon and zeolite types [26]. Specifically, zeolite type one is usually used to remove CO2 [26]. However, if the CO2 concentration is low enough to use only active carbon, adsorbent tower volume can be reduced, increasing the efficiency of the process. Thus, we applied the membrane contactor after completing the catalytic reaction. Consequently, the CO2 concentration decreased from 44.5% to 4.7% and the H2 concentration increased from 36.3% to 59.7%, which means that CO2 removal was 94.5% and H2 recovery was 85.2%. Using this membrane contactor system, H2 purity was increased from 36.3% to 59.7% (86.5% without N2). N2 was injected as internal standard gas to calculate gas composition in GC. This purity is insufficient for direct use in different applications; however, this system makes it easier to separate high-purity H2 compared to low-H2 concentration streams. This configuration could make the H2 production process more efficient and feasible compared to the usual one consisting of H2 production and PSA. In addition, CO2-absorbed water can be regenerated via a desorption module, which is the same membrane contactor module in a vacuum condition. In an absorption module, CO2 is mainly removed from feed stream; thus, the desorbed gas is also supposed to be mainly composed of CO2. The composition of the desorbed gas was analyzed and determined to be 90.6% CO2, 8.1% H2, and 1.3% N2. This gas can be used in raw materials to make dry ice or for carbon capture sequestration (CCS) coupled with mineral carbonation of Mg-, Ca- or Na-based materials [28].

4. Conclusions

This study analyzed the performance of PP hollow fiber membrane contactors under simultaneous CO2 and H2 absorption. Key operational parameters (e.g., gas flow rate, gas pressure, CO2/H2 ratio, G/L ratio, and the pressure difference between gas and liquid) were evaluated in terms of their effect on CO2 removal and H2 recovery. CO2 removal and H2 recovery reached 98.9% and 96.7%, respectively. This membrane contactor system is ruled by gas partial pressure and the degree of equilibrium, i.e., Henry’s law. Therefore, to remove more CO2, some H2 loss is inevitable. This was confirmed in our study, as a tradeoff trend was found between CO2 removal and H2 recovery in all operational parameters. Thus, these parameters can be determined depending on the purpose of the process (whether one intends to remove CO2 or recover H2) and inlet environment (composition and pressure). Moreover, we demonstrated that combining the water–gas shift reaction and membrane contactor could facilitate CO2 removal. Finally, a commercial membrane contactor gas separation process can be applied to other soluble gas separations from a mixed-gas system without high pressure (e.g., pressure swing adsorption) or a low-temperature system (e.g., cryogenic and chemical processes).

Author Contributions

Conceptualization, J.K. and C.J.; methodology, D.L.; validation, J.K., C.J., J.H.B. and S.P. (Sanghyeon Park); writing—original draft preparation, C.J.; writing—review and editing, S.P. (Sadanand Pandey), S.P. (Sanghyeon Park), J.H.B. and D.L.; visualization, C.J.; supervision, C.J. and J.K.; project administration, J.K.; funding acquisition, J.K. All authors have read and agreed to the published version of the manuscript.

Funding

This work was supported by the Korea Institute of Energy Technology Evaluation and Planning (KETEP) and grant-funded by the Ministry of Trade, Industry, & Energy, Republic of Korea (No. 20213030030240).

Conflicts of Interest

The authors declare no conflict of interest.

References

  1. Barreto, L.; Makihira, A.; Riahi, K. The hydrogen energy economy in the 21st century: A sustainable development scenario. Int. J. Hydrogen Energy 2003, 28, 267–284. [Google Scholar] [CrossRef] [Green Version]
  2. McDowall, M.; Eames, M. Forecasts, scenarios, visions, backcasts and roadmaps to the hydrogen economy: A review of the hydrogen futures literature. Energy Policy 2006, 34, 1236–1250. [Google Scholar] [CrossRef] [Green Version]
  3. Hinrichs, R.A.; Kleinbach, M. Energy: Its Use and the Environment; Harcourt: Orlando, FL, USA, 2006. [Google Scholar]
  4. Chen, W.H.; Chen, J.C.; Tsai, C.D.; Jiang, T.L. Transient gasification and syngas formation for coal particles in a fixed-bed reactor. Int. J. Energy Res. 2007, 31, 895–911. [Google Scholar] [CrossRef]
  5. US Department of Energy (DOE). A National Vision of America’s Transition to a Hydrogen Economy—To 2030 and Beyond; US Department of Energy (DOE): Springfield, VA, USA, 2002.
  6. Sadiq Al-Baghdadi, M.A.; Shahad Al-Janabi, H.A. A prediction study of a spark ignition supercharged hydrogen engine. Energy Convers. Manag. 2003, 44, 3143–3150. [Google Scholar] [CrossRef]
  7. Chen, L.; Qi, Z.; Zhang, S.; Su, J.; Somorjai, G.A. Catalytic Hydrogen Production from Methane: A Review on Recent Progress and Prospect. Catalysts 2020, 10, 858. [Google Scholar] [CrossRef]
  8. Mondal, M.K.; Balsora, H.K.; Varshney, P. Progress and trends in CO2 capture/separation technologies: A review. Energy 2012, 46, 431–441. [Google Scholar] [CrossRef]
  9. Ebadi Amooghin, A.; Sanaeepur, H.; Moghadassi, A.; Kargari, A.; Ghanbari, D.; Sheikhi Mehrabadi, Z. Modification of ABS membrane by PEG for capturing carbon dioxide from CO2/N2 streams. Sep. Sci. Technol. 2010, 45, 1385–1394. [Google Scholar] [CrossRef]
  10. Sanaeepur, H.; Ebadi Amooghin, A.; Moghadassi, A.; Kargari, A. Preparation and characterization of acrylonitrile–butadiene–styrene/poly (vinyl acetate) membrane for CO2 removal. Sep. Purif. Technol. 2011, 80, 499–508. [Google Scholar] [CrossRef]
  11. Kargari, A.; Sanaeepur, H. Application of membrane gas separation processes in petroleum industry. In Advances in Petroleum Engineering I Refining; Pant, K.K., Sinha, S., Bajpai, S., Eds.; Studium Press LLC: Houston, TX, USA, 2015; pp. 592–622. [Google Scholar]
  12. Bandehali, S.; Kargari, A.; Moghadassi, A.; Saneepur, H.; Ghanbari, D. Acrylonitrile–butadiene–styrene/poly (vinyl acetate)/nanosilica mixed matrix membrane for He/CH4 separation. Asia Pac. J. Chem. Eng. 2014, 9, 638–644. [Google Scholar] [CrossRef]
  13. Baker, R.W. Membrane Technology and Applications, 3rd ed.; John Wiley and Sons Ltd.: West Sussex, UK, 2012. [Google Scholar]
  14. Sanaeepur, H.; Kargari, A.; Nasernejad, B.; Ebadi Amooghin, A.; Omidkhah, M. A novel Co2+ exchanged zeolite Y/cellulose acetate mixed matrix membrane for CO2/N2 separation. J. Taiwan Inst. Chem. Eng. 2016, 60, 403–413. [Google Scholar] [CrossRef]
  15. Baker, R.W. Future directions of membrane gas separation technology. Ind. Eng. Chem. Res. 2002, 41, 1393–1411. [Google Scholar] [CrossRef]
  16. Xu, L.; Zhang, C.; Rungta, M.; Qiu, W.; Liu, J.; Koros, W.J. Formation of defect free 6FDA-DAM asymmetric hollow fiber membranes for gas separations. J. Membr. Sci. 2014, 459, 223–232. [Google Scholar] [CrossRef]
  17. Schrotter, J.C.; Bozkaya-Schrotter, B. Current and emerging membrane processes for water treatment. In Membrane Technology, Vol. 4: Membranes for Water Treatment; Peinemann, K.V., Nunes, S.P., Eds.; John Wiley & Sons Ltd.: New York, NY, USA, 2010; pp. 53–88. [Google Scholar]
  18. Shekhawat, D.; Luebke, D.R.; Pennline, H.W. A Review of Carbon Dioxide Selective Membranes, DOE/NETL-2003-1200; US Department of Energy: Washington, DC, USA, 2003.
  19. Gaylor, J.D.S. Membrane oxygenators: Current developments in design and application. J. Biomed. Eng. 1988, 10, 541–547. [Google Scholar] [CrossRef]
  20. Afza, K.N.; Hashemifard, S.A.; Abbasi, M. Modelling of CO2 absorption via hollow fiber membrane contactors: Comparison of pore gas diffusivity models. Chem. Eng. Sci. 2018, 190, 110–121. [Google Scholar] [CrossRef]
  21. Kumar, P.S.; Hogendoorn, J.A.; Feron, P.H.M.; Versteeg, G.F. New absorption liquids for the removal of CO2 from dilute gas streams using membrane contactors. Chem. Eng. Sci. 2002, 57, 1639–1651. [Google Scholar] [CrossRef] [Green Version]
  22. Kreulen, H.; Smolders, C.A.; Versteeg, G.F.; Van Swaaij, W.P.M. Microporous hollow fibre membrane modules as gas–liquid contractors. Part 1. Physical mass transfer processes. A specific application: Mass transfer in highly viscous liquids. J. Membr. Sci. 1993, 78, 197–216. [Google Scholar] [CrossRef] [Green Version]
  23. Chavan, S.R.; Perré, P.; Pozzobon, V.; Lemaire, J. CO2 Absorption Using Hollow Fiber Membrane Contactors: Introducing pH Swing Absorption (pHSA) to Overcome Purity Limitation. Membranes 2021, 11, 496. [Google Scholar] [CrossRef]
  24. Ghasem, N.; Al-Marzouqi, M.; Sheta, N. Effect of pressure on the separation of ethylene from ethylene/ethane gas mixture using hollow fiber membrane. Am. J. Polym. Sci. 2017, 7, 30–37. [Google Scholar]
  25. Pal, D.B.; Chand, R.; Upadhyay, S.N.; Mishra, P.K. Performance of water gas shift reaction catalysts: A review. Renew. Sustain. Energy Rev. 2018, 93, 549–565. [Google Scholar] [CrossRef]
  26. Sircar, S.; Golden, T.C. Purification of Hydrogen by Pressure Swing Adsorption. Sep. Sci. Technol. 2000, 35, 667–687. [Google Scholar] [CrossRef]
  27. Aasadnia, M.; Mehrpooya, M.; Ghorbani, B. A novel integrated structure for hydrogen purification using the cryogenic method. J. Clean. Prod. 2021, 278, 123872. [Google Scholar] [CrossRef]
  28. Sanna, A.; Uibu, M.; Caramanna, G.; Kuusik, R.; Maroto-Valer, M.M. A review of mineral carbonation technologies to sequester CO2. Chem. Soc. Rev. 2014, 43, 8049–8080. [Google Scholar] [CrossRef] [PubMed] [Green Version]
Scheme 1. Experimental setup of membrane contactor. Gas flow rate of mixture gas was controlled by mass flow meter and its effluent gas was measured by gas flow meter. Gas pressure was controlled via a back pressure regulator. Water was injected via a water pump, and liquid pressure was also controlled by a back pressure regulator.
Separations 10 00367 sch001
Figure 1. Effect of gas flow rate and pressure on (a) CO2 removal and (b) H2 recovery using DI water as the absorbent while keeping other parameters constant. [Experimental conditions: gas concentration (43.6% H2, 12.8% N2, and 43.6% CO2), liquid flow rate (3 L/min), and pressure between gas and liquid (ΔP) 1.5 bar].
Separations 10 00367 g001
Figure 2. Effect of gas composition (CO2/H2 ratio) on CO2 removal and H2 recovery using DI water as the absorbent while keeping other parameters constant. [Experimental conditions: gas flow rate 12.5 L/min, gas concentration (CO2 and H2 concentrations were calculated based on the ratio keeping N2 at 12.8%), liquid flow rate (3 L/min), pressure 5.5 barg, and pressure between gas and liquid (ΔP) 1.5 bar].
Separations 10 00367 g002
Figure 3. Effect of G/L ratio on CO2 removal and H2 recovery while keeping other parameters constant. [Experimental conditions: gas concentration (43.6% H2, 12.8% N2, and 43.6% CO2), gas flow rate (4–12.5 L/min), liquid flow rate (1 and 3 L/min), pressure (4.5–8.0 barg), and pressure difference between gas and liquid phase (i.e., ΔP) 1.5 bar].
Separations 10 00367 g003
Figure 4. Effect of pressure difference between gas and liquid on CO2 removal and H2 recovery using DI water as the absorbent while keeping other parameters constant. [Experimental conditions: gas concentration: 43.6% H2, 12.8% N2, and 43.6% CO2; gas flow rate: 12.5 L/min; liquid flow rate: 3 L/min; gas pressure: 5.5 barg; liquid pressure: 6.3–11.0 barg]. The pressure difference was calculated as (liquid pressure–gas pressure), and its unit was used as bar.
Separations 10 00367 g004
Figure 5. Schematic of hydrogen production from CO by water–gas shift reaction and CO2 removal and regeneration process by a membrane contactor module consisting of both absorption and desorption modules. Sep. represents separator for water in stream. Black and blue lines represent gas and liquid stream, respectively. The concentration and flow rate of circled number stream are summarized in Table 2.
Separations 10 00367 g005
Table 1. Specifications and properties of the PP hollow fiber membrane and module.
Specification
Outer diameter (μm)300
Inner diameter (μm)220
Module size (inch)Top and bottom cover diameter 3.1 (77 mm),
center (middle of module) diameter 2.6 (67 mm)
Module length (inch)10 (254 mm)
Mean pore size (μm)0.03
Overall porosity (%)40
Surface area: (m2)1.4
ModelLIQUI-CEL® 2.5 × 8 MEMBRANE CONTACTOR G453
MaterialPP/Hollow fiber membrane
Table 2. The mass balance of water–gas shift reaction and membrane contactor displayed in Figure 5. Stream 2 to 4 is calculated in dry basis because condensed water was removed after the reaction part.
UnitStream 1Stream 2Stream 3Stream 4
H2L/min0.004.043.440.44
N2L/min1.881.881.790.07
COL/min4.300.260.260.00
CO2L/min0.924.950.274.92
H2OL/min12.900.000.000.00
TotalL/min20.0011.125.765.43
UnitStream 1Stream 2Stream 3Stream 4
H2%0.0036.3059.708.10
N2%9.4016.9031.001.30
CO%21.502.304.600.00
CO2%4.6044.504.7090.60
H2O%64.500.000.000.00
Total%100.00100.00100.00100.00
Disclaimer/Publisher’s Note: The statements, opinions and data contained in all publications are solely those of the individual author(s) and contributor(s) and not of MDPI and/or the editor(s). MDPI and/or the editor(s) disclaim responsibility for any injury to people or property resulting from any ideas, methods, instructions or products referred to in the content.

