Article

Determination of β2-Agonist Residues in Meat Samples by Gas Chromatography-Mass Spectrometry with N-Doped Carbon Dots in Molecular Sieves

1
Faculty of Material Science and Chemical Engineering, Ningbo University, Ningbo 315211, China
2
College of Food and Pharmaceutical Science, Ningbo University, Ningbo 315211, China
3
Business School, Ningbo City College of Vocational Technology, Ningbo 315199, China
4
The Research Institute of Advanced Technologies, Ningbo University, Ningbo 315211, China
5
Ningbo Customs Technology Center, Ningbo 315048, China
*
Authors to whom correspondence should be addressed.
Separations 2023, 10(8), 429; https://doi.org/10.3390/separations10080429
Submission received: 25 June 2023 / Revised: 13 July 2023 / Accepted: 24 July 2023 / Published: 28 July 2023

Abstract

:
A simple, effective, and highly sensitive analytical approach was created and applied in this study for the accurate measurement of three β2-agonist residues (clenbuterol, salbutamol, and ractopamine) in meat samples. In the course of the experiment, new adsorbent molecular sieves (ZMS)@nitrogen-doped carbon quantum dots (N-CQDs) composite materials were synthesized with the aid of hydrothermal synthesis. The composite adsorbent materials were prepared and characterized through scanning electron microscopy, transmission electron microscope, X-ray photoelectron spectroscopy, fluorescence, and zeta potential. Four determinants affecting the extraction and elution’s efficiency, such as the amount of adsorbent, the extraction time, desorption time, and the amount of extraction salt, were substantially optimized. The analytes were quantified by gas chromatography–mass spectrometry. Final results of the methodological validation reflected that the ZMS@N-CQDs composite materials were able to adsorb three β2-agonist residues well and had good reproducibility. In the meantime, all analytes indicated good linearity with coefficient of determination R2 ≥ 0.9908. The limit of detection was 0.7–2.0 ng·g−1, the limit of quantification varied from 2.4 to 5.0 ng·g−1, the precision was lower than 11.9%, and the spiked recoveries were in the range of 79.5–97.8%. To sum up, the proposed approach was quite effective, reliable, and convenient for the simultaneous analysis of multiple β2-agonist residues. Consequently, this kind of approach was successfully applied for the analysis of such compounds in meat samples.

1. Introduction

The effects of β2-agonists, namely clenbuterol, salbutamol, and ractopamine (Figure S1), include the growth of muscular tissue and reduction in body fat, and these kinds of compounds have also been applied as growth stimulants for cattle, sheep, and pigs, which actually formed the β2-agonist residues in products of animal origin [1,2,3]. However, it has been verified that acute intoxication, including headache, tachycardia nausea, dizziness, and other symptoms, may occur when people eat meats made from animals fed by β2-agonists; therefore, the use of these kinds of stimulants was banned by the World Health Organization (WHO) and many countries [4,5,6]. Meanwhile, in recent years, the abuse of these compounds has formed severe food safety risks [7]. Even if the concentration is extremely low in animal products, β2-agonists will still pose potential and substantial threats to the health of humans. Thus, it will be particularly necessary to create a rapid and highly-sensitive approach for the detection of β2-agonist residues.
So far, various assay approaches, such as high-performance liquid chromatography (HPLC) [8,9], liquid chromatography-mass spectrometry (LC-MS), liquid chromatography-tandem mass spectrometry (LC-MS/MS) [10,11], gas chromatography-mass spectrometry (GC-MS) [12,13], electrochemical detection (EC) [14,15], colorimetric ELISA [16,17], and other analytical methods [18,19], have been well applied in detecting β2-agonists [1], and it should be quite evident that GC-MS has the comparative advantages of high sensitivity, strong separation ability, and fast real-time analysis among these approaches [20].
In the process of pre-treatment, the meat samples were usually dealt with by enzymatic or strong acid digestion processes in order to extract the residues of β2-agonists, and then the liquefied samples were further purified by solid phase extraction (SPE), liquid-liquid extraction (LLE), or solid-phase microextraction (SPME) [7]. This time-consuming process also needs more reagents and drugs than ever. With increasing interests in the sophisticated composition of matrices and the trace amounts of analytes, it will be essential for us to develop an effective extraction/purification approach prior to final analysis, which acts as an important prerequisite for measurement of β2-agonists [21]. In recent years, various pretreatment techniques for the extraction have been rapidly developed, and this fast, simple, economical, effective, rugged, and safe (QuEChERS) approach simplifies the extraction and purification process and reduces related duration [22]. However, octadecyl-bonded silica (C18) sorbent, N-propylethylenediamine-bonded silica gel (PSA) sorbent, enhanced matrix removal-lipid kit, magnesium sulfate (MgSO4), and other reagents are still needed to eliminate the matrix and are often applied in the purification process, which will be costly and time-consuming [18]. As is well known, SPE is an effective method for simultaneous extraction and concentration. SPE is the most frequently used approach because it has the following advantages: high recovery rate and enrichment ratio, more effective separation of analytes from interfering components, easy collection of analytes, high sensitivity, ability to handle small volume samples, high recovery rate, low consumption of organic reagents, simple operation, strong simplicity of operation, ruggedness, high safety, easy automation, and use with other analytical instruments [23,24,25]. The performance of the SPE technology mainly relies on both the adsorption capacity and adsorption/desorption kinetics, while SPE adsorbent directly affects extracting efficiency and analytical sensitivity [21]. The non-covalent interaction need to be considered when changing the interaction between the analyte and the adsorbent material to make the target component be adsorbed on the surface of the adsorbent material. Thus, a facile and efficient SPE adsorbent material should be used for adsorption of β2-agonists.
Molecular sieves are often referred to as zeolite or zeolite molecular sieve (ZMS), which is a synthetic aluminosilicate with a microporous cubic lattice, and its spatial network structure is formed by staggered arrangement of silicon oxide tetrahedral units [SiO4] and aluminum oxide tetrahedral units [AlO4]. The pore size in molecular sieves is very small, allowing only certain sized molecules to pass through, while other molecules are prevented from entering. Its structure and properties are influenced by various factors, such as its manufacturing method, material type, and pore size. In addition, due to the continuous pores inside occupying half of the material volume, the ZMS texture is not firm [26]. For adsorption materials, the pore size of their surface limits the shape and size of the molecules that can be adsorbed [27]. Recently, research interest in these porous materials has significantly increased due to their potential as adsorption materials, catalyst carriers, energy-saving materials, separation materials, energy storage materials, and their application prospects and market demand in SPE adsorption, drugs, sensing, and other fields [27]. According to Liu’s group [28], a novel composite material based on graphene oxide/molecular sieve 4A (GO/4A) are promising for the dye wastewater that is difficult to remove/degrade by molecular sieving. As is well known, doping carbon quantum dots with heteroatoms can effectively improve their fluorescence quantum yield, fluorescence emission wavelength, and intensity properties. Nitrogen-doped carbon quantum dots (N-CQDs) have attracted great attention due to their unique optical properties and excellent biocompatibility, which combines the organic properties of carbon nanomaterials (low toxicity and low cost) with the unique optical properties of quantum dots (strong and intense luminescence) [29]. In this way, Ahmad’ group showed that the N-CQDs using a plant as a carbon source can treat efficiently domestic wastewater and has great prospects in biosensing applications [30]. Meanwhile, it can strongly interact with the benzene ring in β2-agonists in π-π stacking for its large off-domain π-electron system. Apparently, the ZMS@N-CQDs with nanoporous structures were demonstrated to be an ideal adsorbent for specific adsorption of β2-agonists. Meanwhile, it has been found that the selection of the ZMS@N-CQDs as adsorbent can achieve a fast and sensitive adsorption of β2-agonists.
In this work, the ZMS@N-CQD compound materials were prepared through a hydrothermal synthesis method and exploited as novel adsorbents for the SPE of β2-agonist residues in meat samples. With the high adsorption capacity and adsorption rate of the ZMS@N-CQDs, prior to GC-MS analysis, three β2-agonist residues in practical meat samples were confidently identified by using the prepared adsorbent for the SPE processing.

2. Materials and Methods

2.1. Reagents and Materials

Molecular sieve 4A (MS 4A), ethylenediamine, trimethylchlorosilane (TMCS), bis (trimethylsilyl) trifluoroacetamide (BSTFA) were bought from Shanghai Macklin Biochemical Technology Co., Ltd. (Shanghai, China). L-Glutamic acid was purchased from Shanghai Zhengxiang Chemical Reagent Research Co., Ltd. (Shanghai, China). Anhydrous magnesium sulfate (MgSO4) and sodium chloride (NaCl) were obtained from Sinopharm Chemical Reagents Co., Ltd. (Shanghai, China). Acetonitrile (≥99.9%) was bought from Sigma Co. (Berlin, Germany). PSA and C18 was obtained from Shimadzu Company (Kyoto, Japan).
β2-agonist standards were purchased from Beijing Tanmo Quality Inspection Technology Co., Ltd. (Beijing, China) and 3 β2-agonists were dissolved in methanol at 1 mg·mL−1, respectively. The original β2-agonist solution was prepared in acetonitrile (0.1 mg·mL−1, stored at 4 °C). The working solution was diluted in acetonitrile.

2.2. Apparatus

The following were utilized in the research: Analytical balance (BS 210S, Beijing Saiduoli Balance Co., Ltd. (Beijing, China)), Natural agate mortar (Inner diameter 30 mm, Shanghai Lichen Instrument Technology Co., Ltd. (Shanghai, China)), muffle furnace (SSXF-12-10, Hangzhou Lantian Laboratory Instrument Co. (Hangzhou, China)), lyophilizer (FD-250101 GT, Hangzhou Furuijie Technology Co., Ltd. (Hangzhou, China)), Vortex mixer (VORTEX GENIUS 3, IKA Group (Staufen, Germany)), oscillator (VIBRAX VXR basic, IKA Group (Staufen, Germany)), Centrifuge (3K15, SIGMA (Duesseldorf, Germany)), masher (Jiuyang Co., Ltd. (Jinan China)), scanning electron microscopy (SEM, Sigma 300, ZEISS (Oberkochen, Germany)), X-ray photoelectron spectroscopy (XPS) with a Scientifific K-Alpha (Thermo (New York, NY, USA)).
For the GC-MS system (QP 2010 SE, Shimadzu (Kyoto, Japan)) with autosampler, high purity helium (≥99.999%) was used as the carrier gas, and the flow rate was 5 mL·min−1. The ion source temperature was 230 °C, the interface temperature was 300 °C, and the sample inlet temperature was 300 °C. The chromatographic column was a capillary column (30 m × 0.25 mm × 0.25 μm, DB-5ms). The solvent delay time was 3 min (bypassing the solvent peak). The initial column temperature was 70 °C, maintained for 2 min, then 25 °C min−1 to 200 °C, and then 20 °C min−1 to 280 °C, and finally 10 °C min−1 to 300 °C; after each program heating step, conditions were maintained for 6 min, 5 min, and 2 min, respectively.
The β2-agonist standard solutions and sample solutions were then quantified by selective ion detection mode (SIM). The setting parameters for the three β2-agonists are shown in Table S1.

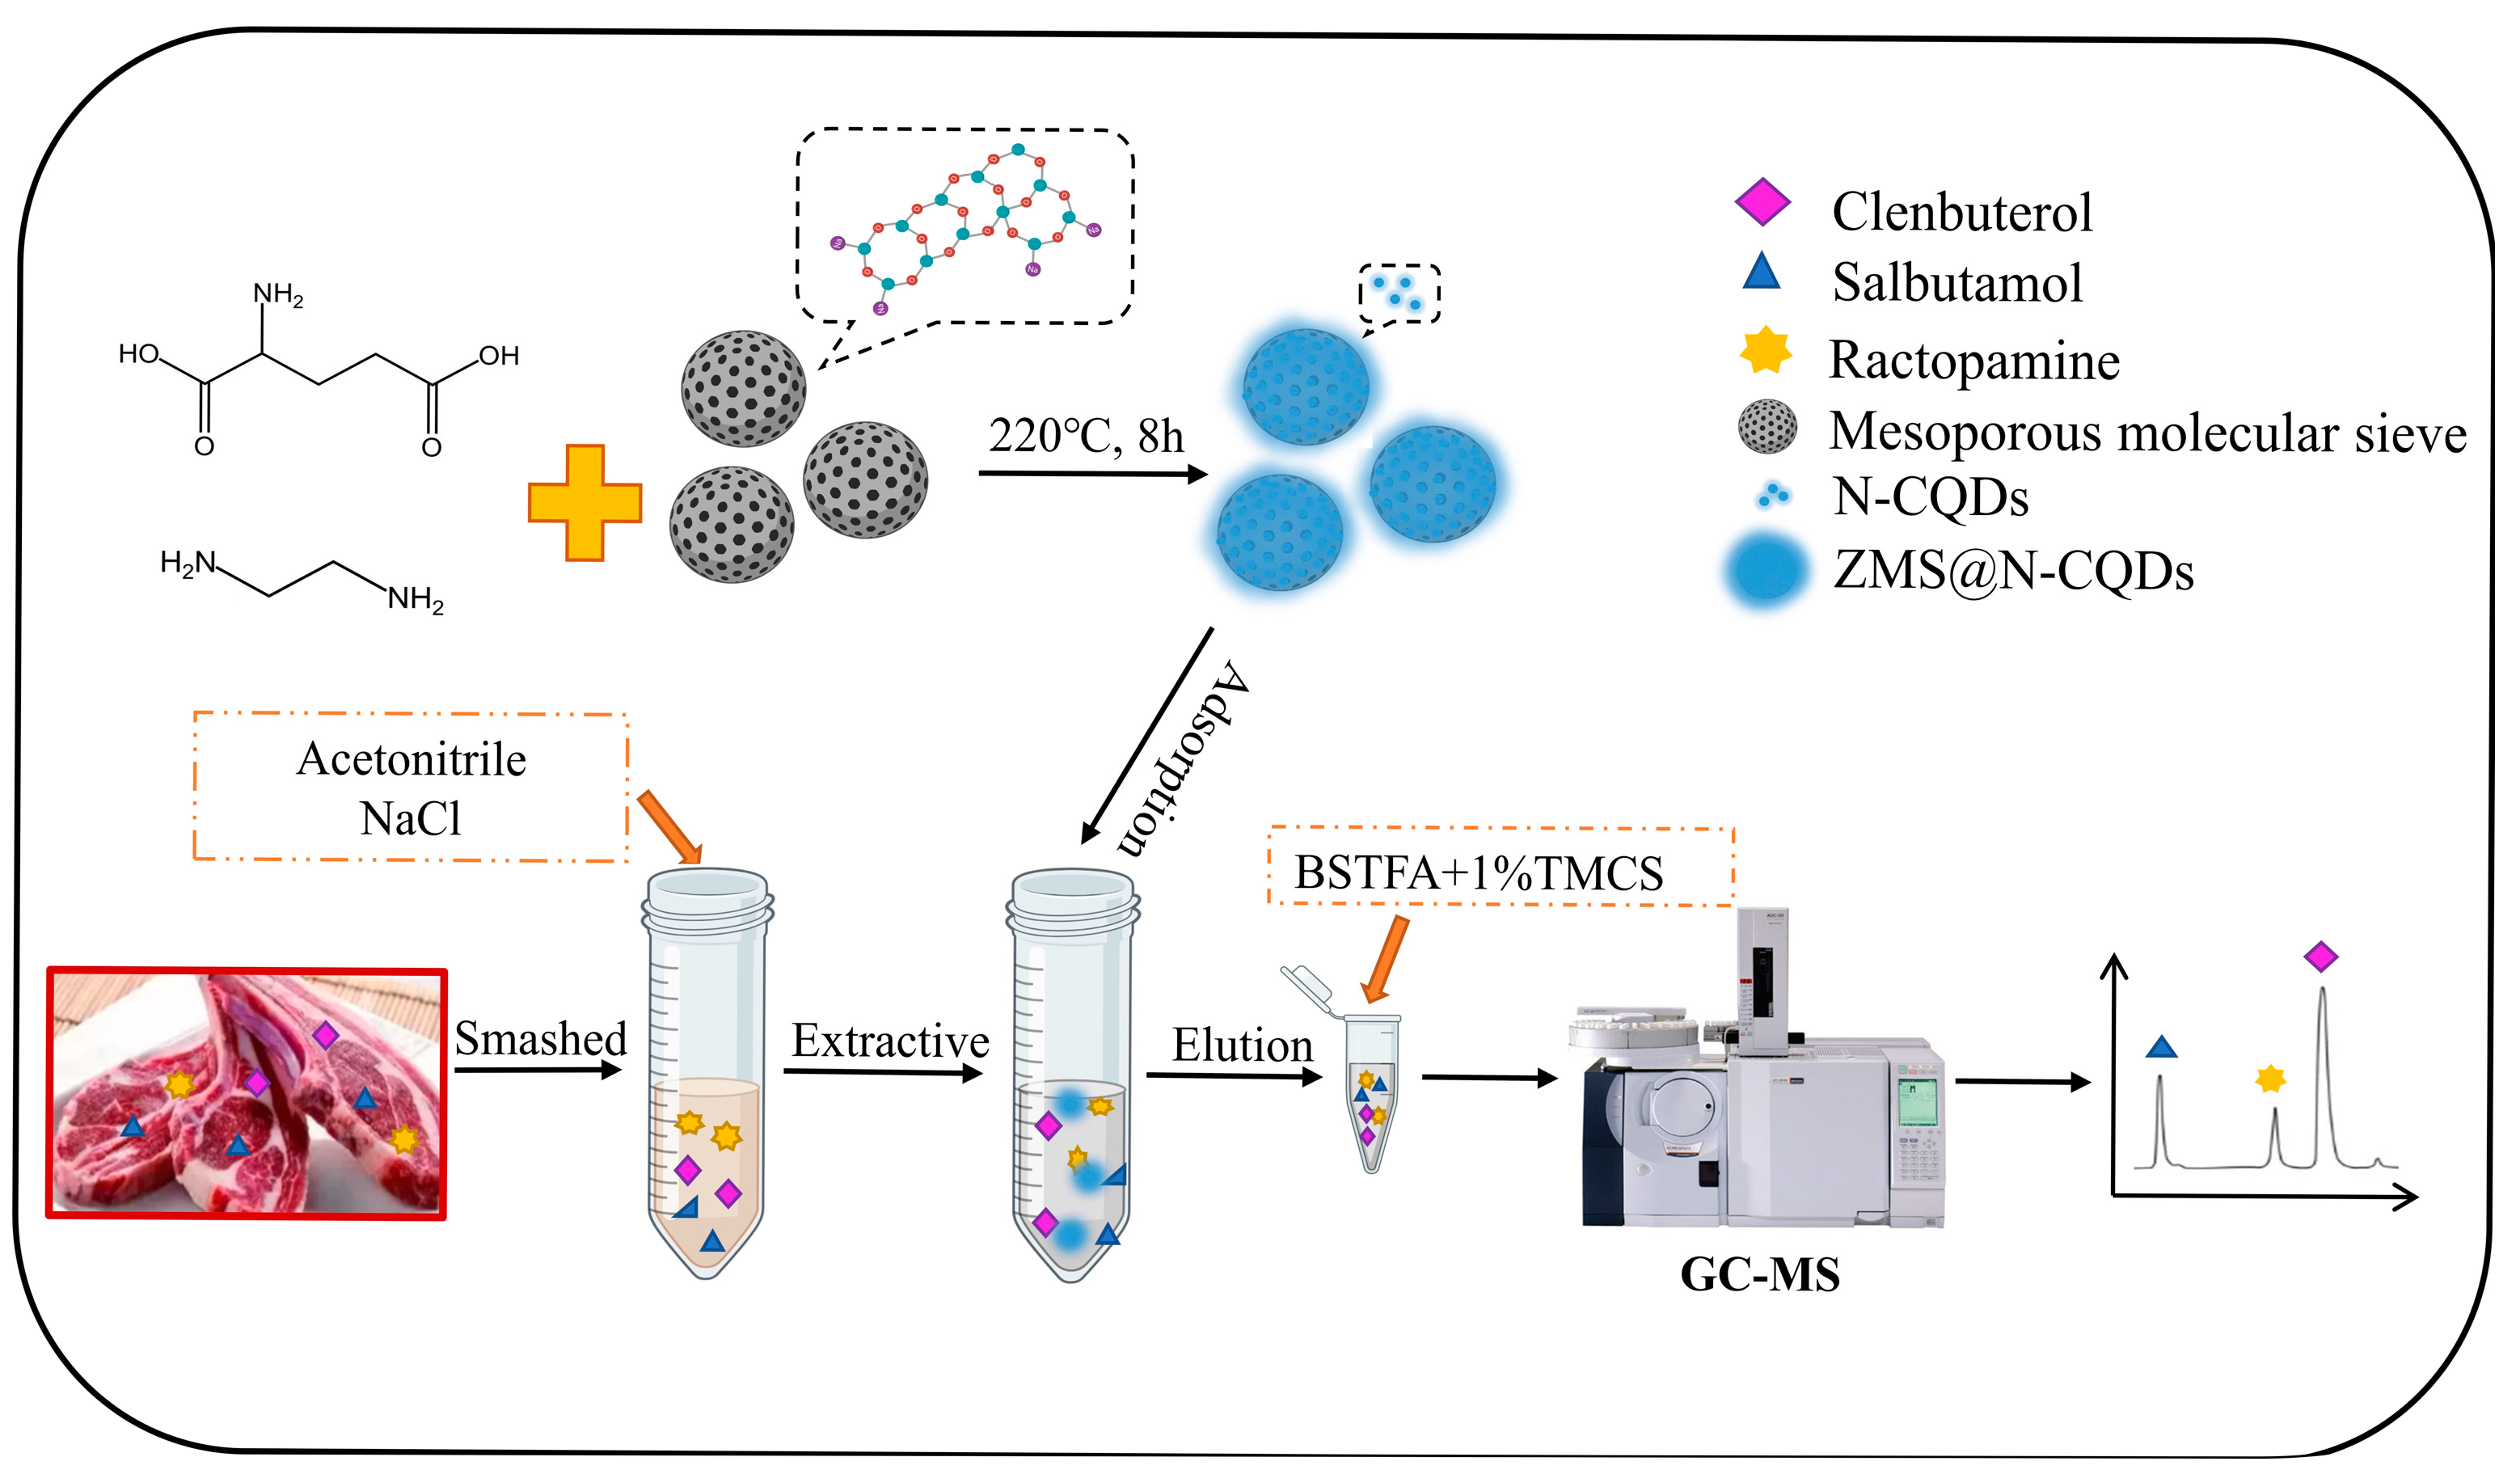
2.3. Preparation of the ZMS@N-CQDs

The ZMS@N-CQDs composite was synthesized via a principle of hydrothermal synthesis [31]. Briefly, 2 g of grinded solid powder of molecular sieves and 1 g of L-glutamic acid was added to 100 mL of water. After sonication for 5 min, then 2 mL of ethylenediamine was added to the reaction liquid conducted above, with subsequent heating at 220 °C for 8 h. Finally, the synthetic composite materials were washed three times with water and then dried under freezing for 12 h to obtain the ZMS@N-CQDs.

2.4. Sample Preparation Procedure

As shown in Figure 1, three meat samples (pork, beef, and mutton) were stirred into mud; weighed to 5 g; added with 10 mL of acetonitrile, 2 g of MgSO4, and 4 g of NaCl; and extracted by vortex for 1 min, then the extracts were centrifuged at 5000 rpm for 5 min at room temperature, and then the supernatant was collected.

2.5. Extraction and Elution Procedures

Briefly, 2 mL of supernatant is taken as prepared above; 300 mg of the ZMS@N-CQDs were added, extracted by vortex for 3 min, and then centrifuged at 13,000 rpm for 5 min at room temperature, and then the supernatant was removed; 1 mL of acetonitrile was added to elute the β2-agonists adsorbed on the ZMS@N-CQDs by vortex for 3 min, and the supernatant was collected by centrifuge. The elution step was repeated once, and 200 μL of derivatization reagent (0.25 g of TMCS in 25 mL of BSTFA) was added to the eluent prepared above, and then the reaction system prepared above was put in an oven at 60 °C for 1 h, and then the resulting elution solution was filtered with a 0.22 μm PTFE membrane syringe filter after cooling and analyzed by GC-MS.

2.6. Adsorption Experiment

The adsorption kinetics were determined by adding 100 mg the ZMS@N-CQDs to the acetonitrile (10 mL) and adding 10 μg/mL clenbuterol (50 μL) to obtain clenbuterol concentrations of 50 ng/mL, and the measurement time was 0.5–30 min. After solid-liquid separation by centrifugation, the liquid supernatant was collected and measured by GC-MS after derivation.
To measure the adsorption isotherm, 100 mg the ZMS@N-CQDs were added to 10 mL of a clenbuterol standard solution with concentrations of 5, 10, 20, 50, 100, 1000, 4000, and 9000 ng/mL, respectively. Solid-liquid separation by centrifugation was performed after adsorption experiments, and the liquid supernatant was collected and measured by GC-MS after derivation.

3. Results and Discussion

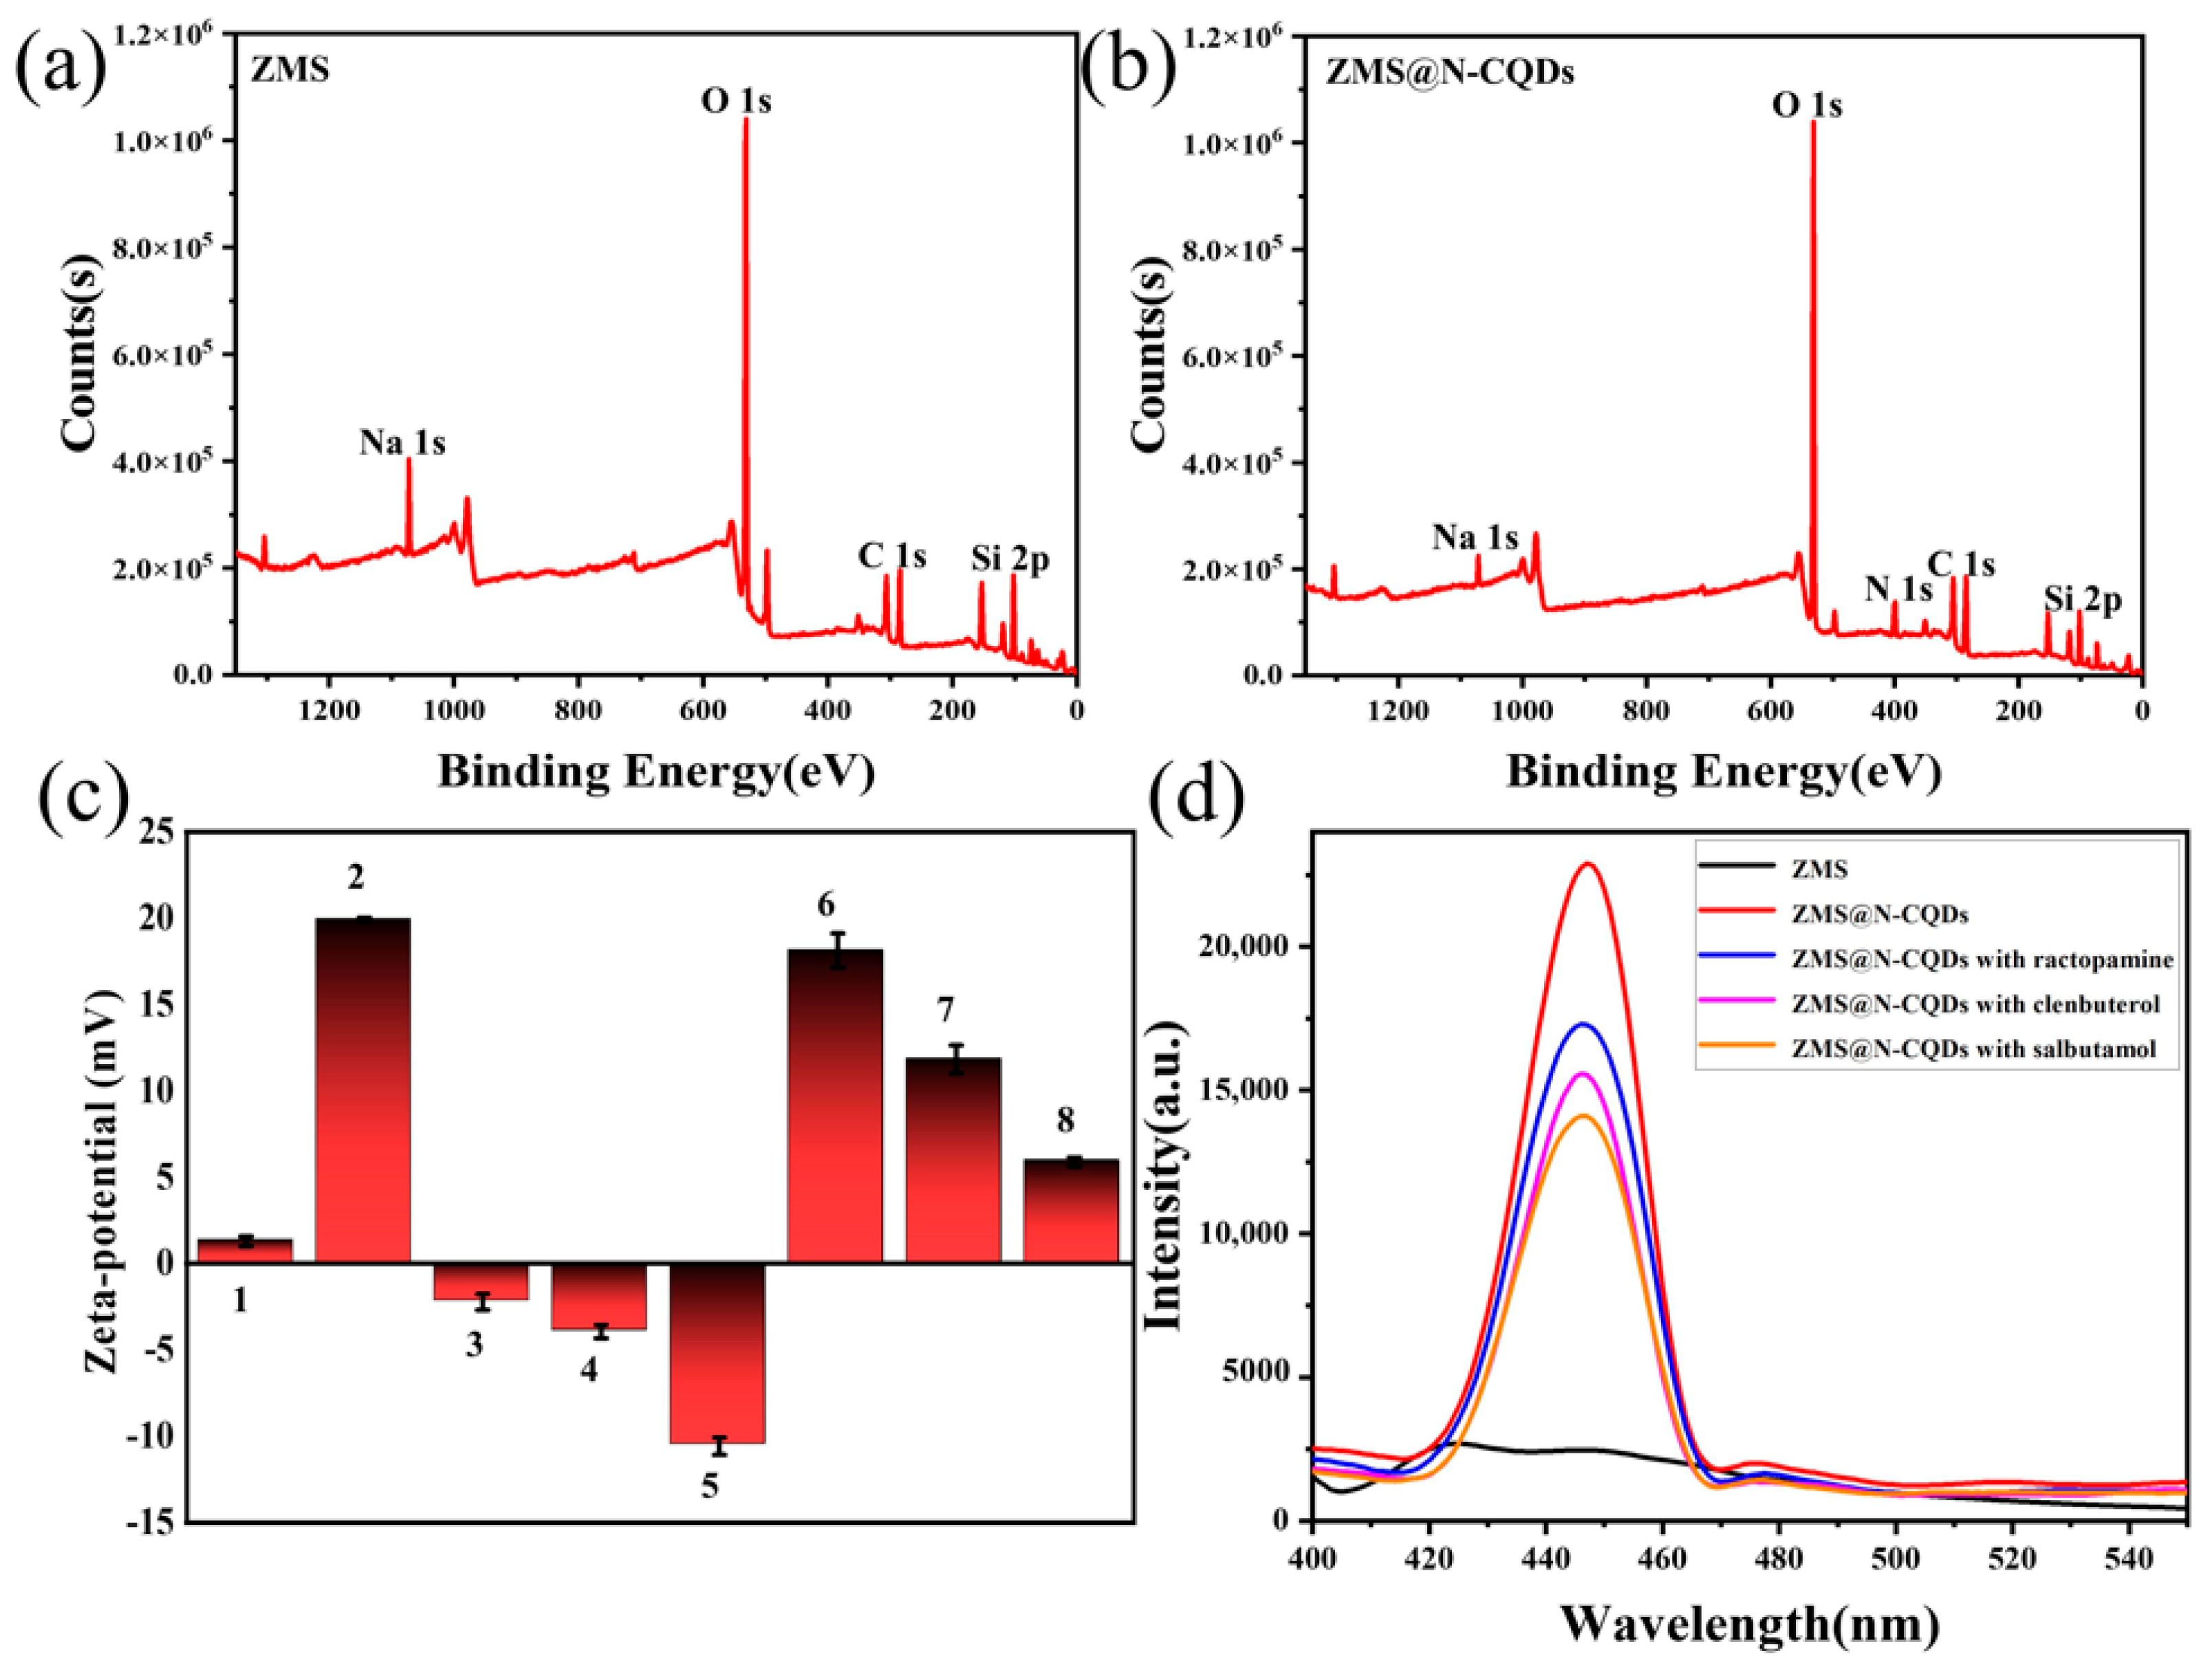
3.1. Characterization

In order to evaluate the modified molecular sieves, the synthesized adsorbents were characterized by SEM, TEM, XPS, zeta potential, and fluorescence. The morphological structure and characteristics of the prepared adsorbents were observed with SEM and TEM. The SEM and TEM images of molecular sieves and the ZMS@N-CQDs are shown in Figure 2. As shown in Figure 2a, the molecular sieves exhibit smooth surfaces with an average particle size of approximately 2–3 μm. The molecular sieves are evenly assembled on the surface of N-CQDs (Figure 2b). It can be seen that there is a filamentous structure embedded on its surface, which is because many carbon quantum dots are embedded in the pores on its surface. The TEM image shows that there is almost no significant change in the particle size of the modified molecular sieve, but N-CQDs with a diameter of about 2 nm can be observed on the molecular sieve surface (Figure 2c,d), indicating that N-CQDs have been successfully coupled with molecular sieves at the nanoscale.
As shown in Figure 3a,b, the elemental and chemical valence states of the molecular sieves and the ZMS@N-CQDs were analyzed by XPS. After the modification of molecular sieves, there were significant changes in element combination and content. The most prominent one is that the peaks in the N 1s spectrum appear at 400.21 eV for the ZMS@N-CQDs composites.
Zeta potentials for ZMS and the ZMS@N-CQDs were determined by phase analysis light scattering instrument (Figure 3c). The suspensions of both materials exhibited significantly different zeta potentials. the ZMS@N-CQDs composites resulted in a positively charged species and confirmed that quantum dots bear a strong positive zeta potential. However, with the addition of negatively charged targets (clenbuterol, salbutamol, and ractopamine), the potential of the suspension decreased. Changes in potential confirmed adsorption between the ZMS@N-CQDs composites and the targets.
In the fluorescence spectrum of the ZMS@N-CQDs containing the three β2-agonists at 50 ng·g−1 (Figure 3d) compared with the ZMS and the ZMS@N-CQDs showed a strong fluorescence signal. The results show the successful synthesis of the ZMS@N-CQD composites. The fluorescence spectrum of the ZMS@N-CQDs containing analytes demonstrates the fluorescence intensity of the ZMS@N-CQDs was partly quenched by combining the target analytes. Therefore, the three β2-agonists can be adsorbed with the ZMS@N-CQDs, inhibiting the fluorescence intensity of the ZMS@N-CQDs.
The above characteristics results clearly proves the successful preparation of the ZMS@N-CQD composites.

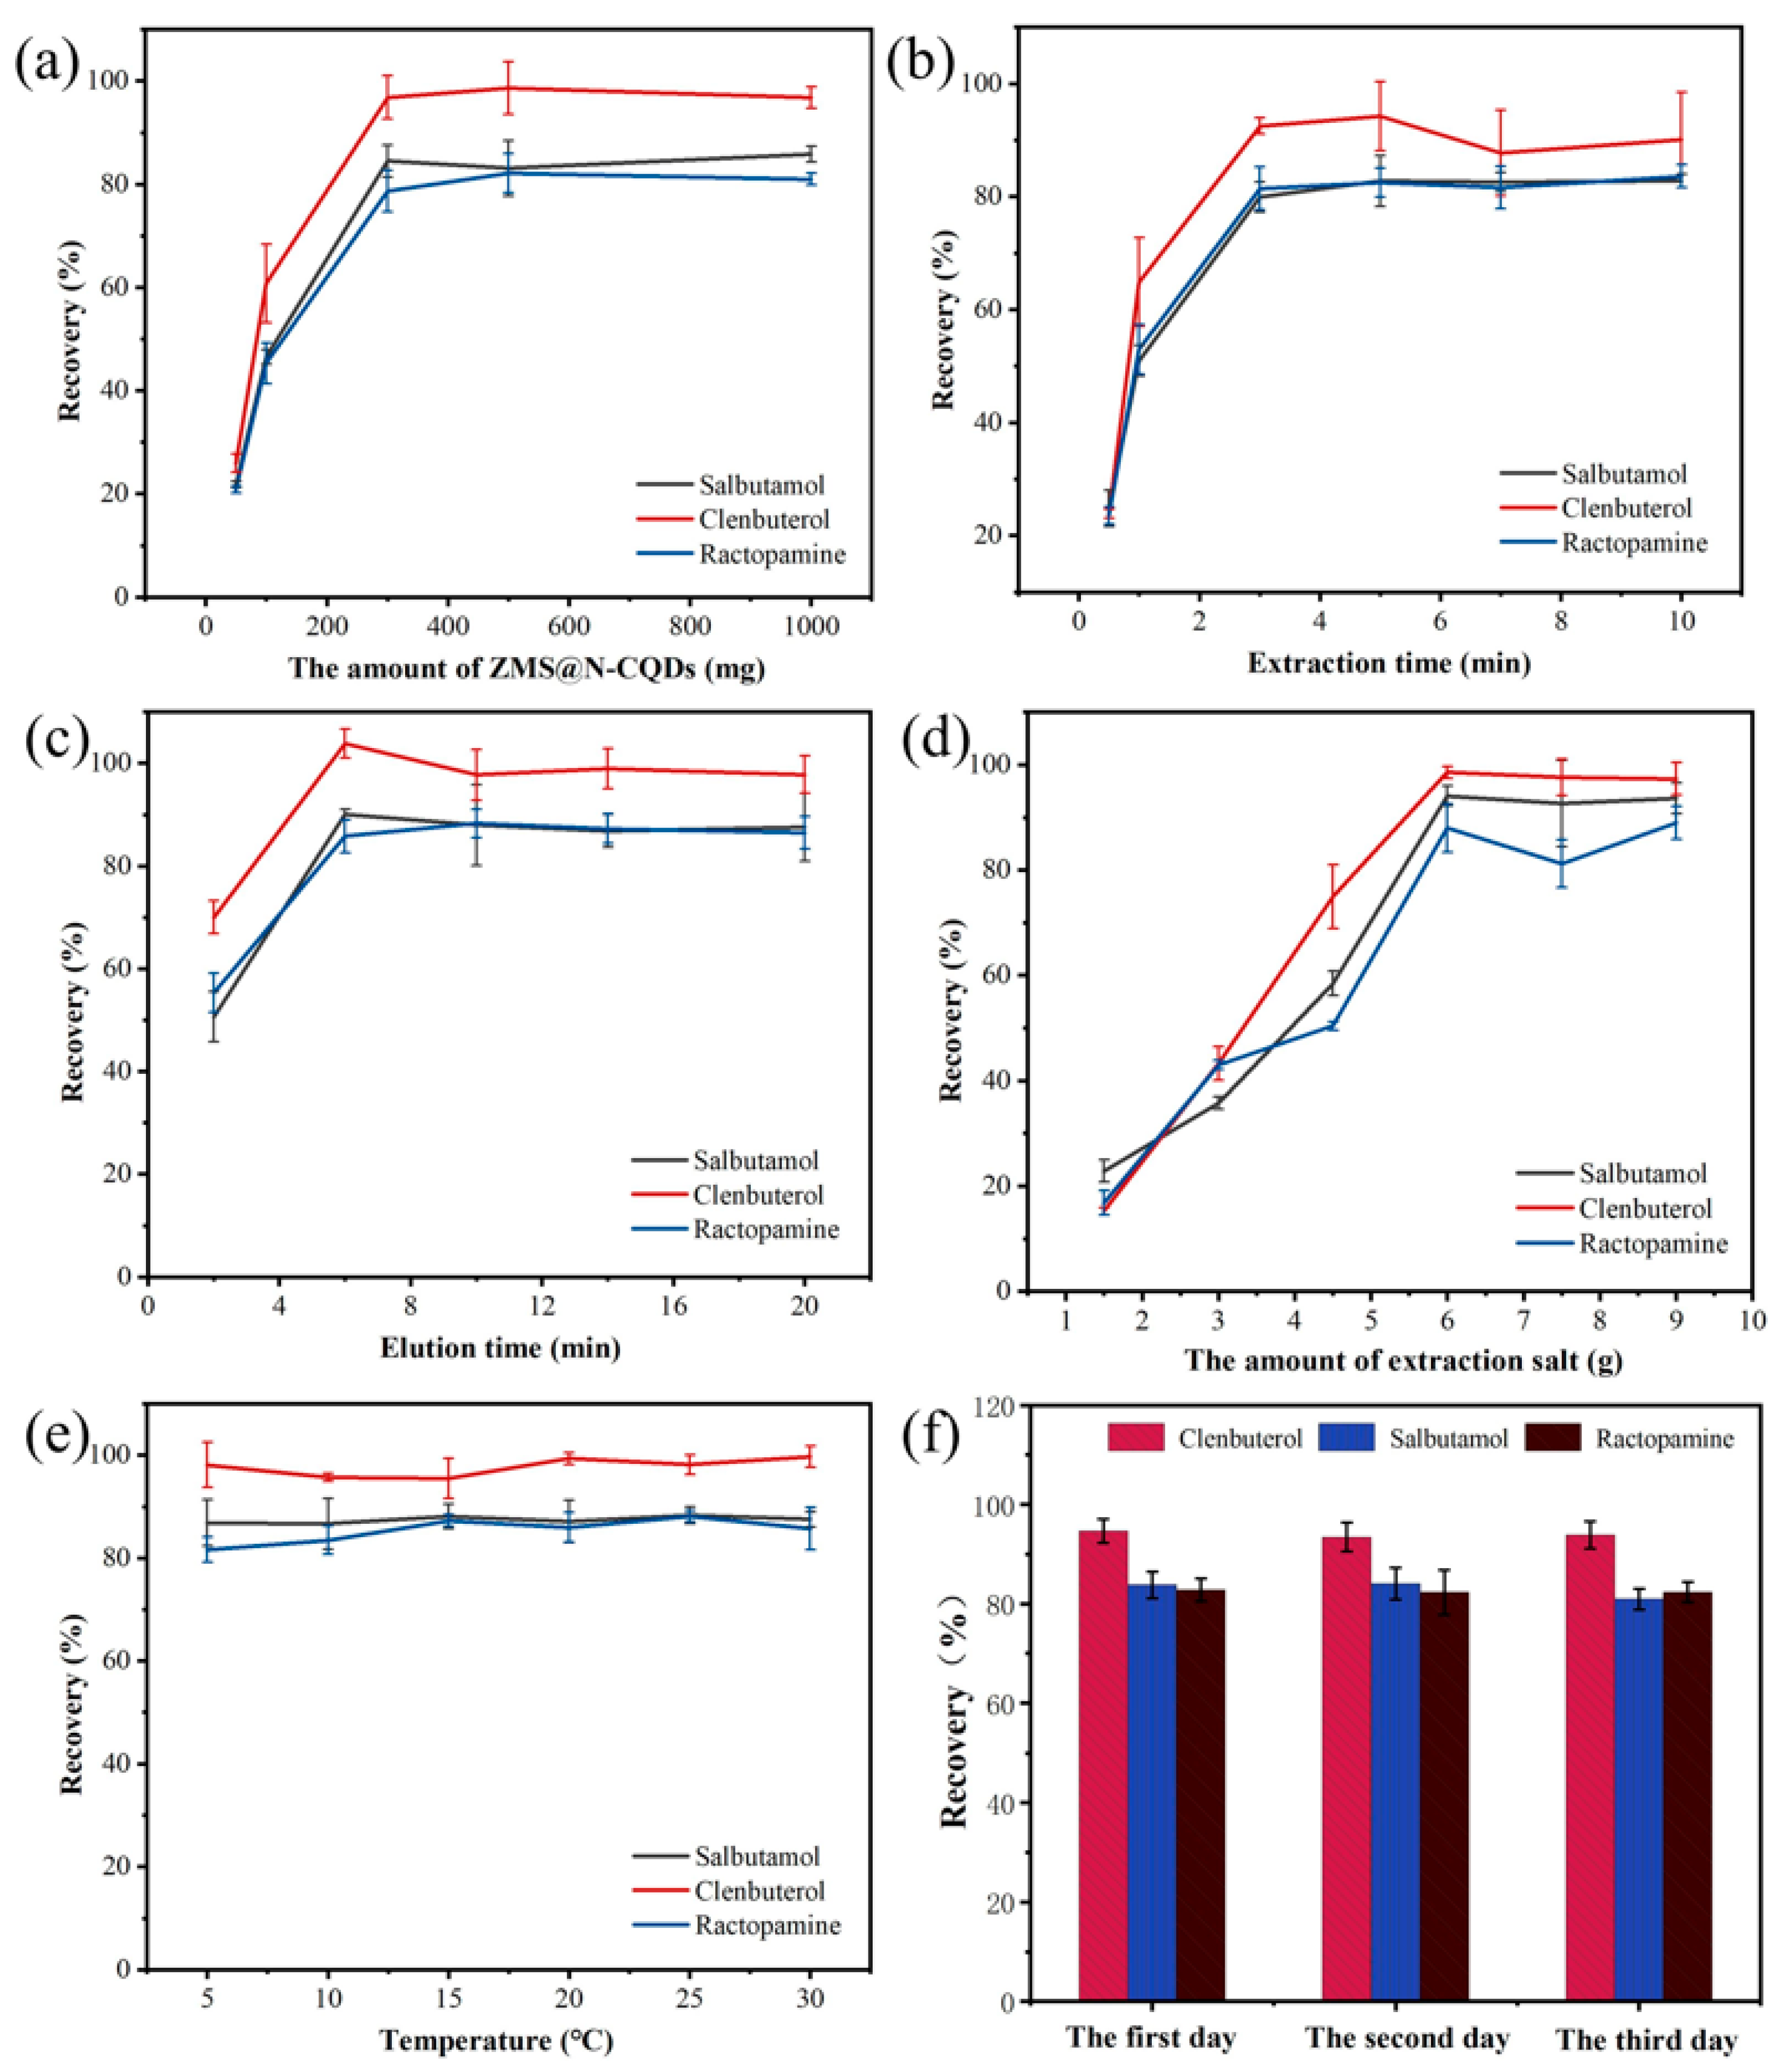
3.2. Optimization of Extraction and Elution Conditions

To explore the impact on its detection efficiency in the extraction and elution conditions, the experiment optimized four conditions: the amount of sorbent, the extraction time, the elution time, and the amount of extraction salt. The recovery rate was used to represent the experimental efficiency, and the optimized experiments were all conducted on a spiked sample of 50 ng·g−1.
To evaluate its impact on extraction efficiency, 50 mg to 1000 mg of the ZMS@N-CQDs were selected. As the amount of adsorbent increased, the recovery rate of the targets changed significantly (Figure 4a). 300 mg of adsorbent was sufficient to completely adsorb the β2-agonists, and adequate and sufficient adsorbent could reduce the experimental costs.
The effect of extracting and eluting time is shown in Figure 4b,c, respectively. It can be seen that the maximum recovery rate was achieved at 3 min for extraction time, in Figure 4b, and the maximum recovery rate was achieved at 6 min (3 min each time, 2 times in total) for elution time, in Figure 4c. It was shown that 3 min was sufficient for the ZMS@N-CQDs to adsorb the β2-agonists; however, 6 min was needed for the ZMS@N-CQDs to elute the β2-agonists from the system. Therefore, the extraction time of 3 min and the elution time of 6 min were chosen.
Additionally, the amount of extraction salt during pre-processing for the extraction efficiency was evaluated (Figure 4d). It was shown that 2 g of MgSO4 and 4 g of NaCl provided the highest extraction efficiency towards the β2-agonists. Therefore, the amount of extraction salt of 2 g of MgSO4 and 4 g of NaCl was selected to obtain the optimal extraction efficiency of the analytes for further experiments.
As shown in Figure 4e, experimental temperature has no effect on extraction efficiency. Therefore, the optimal extraction and elution conditions were as follows: the amount of the ZMS@N-CQDs was 300 mg, the extraction time was 3 min, the elution time was 6 min, and the amount of extraction salt was 2 g of MgSO4 and 4 g of NaCl.
We conducted the reproducibility experiments of the adsorption and elution efficiency of three different batches of the ZMS@N-CQDs to evaluate the adsorption stability of the ZMS@N-CQDs under the optimal conditions. From Figure 4f, there was no significant difference in the recovery rate of the three different batches of 3 β2-agonists by using the ZMS@N-CQDs, and the deviations were between 1.88% and 6.42%, indicating that the ZMS@N-CQDs had good stability.

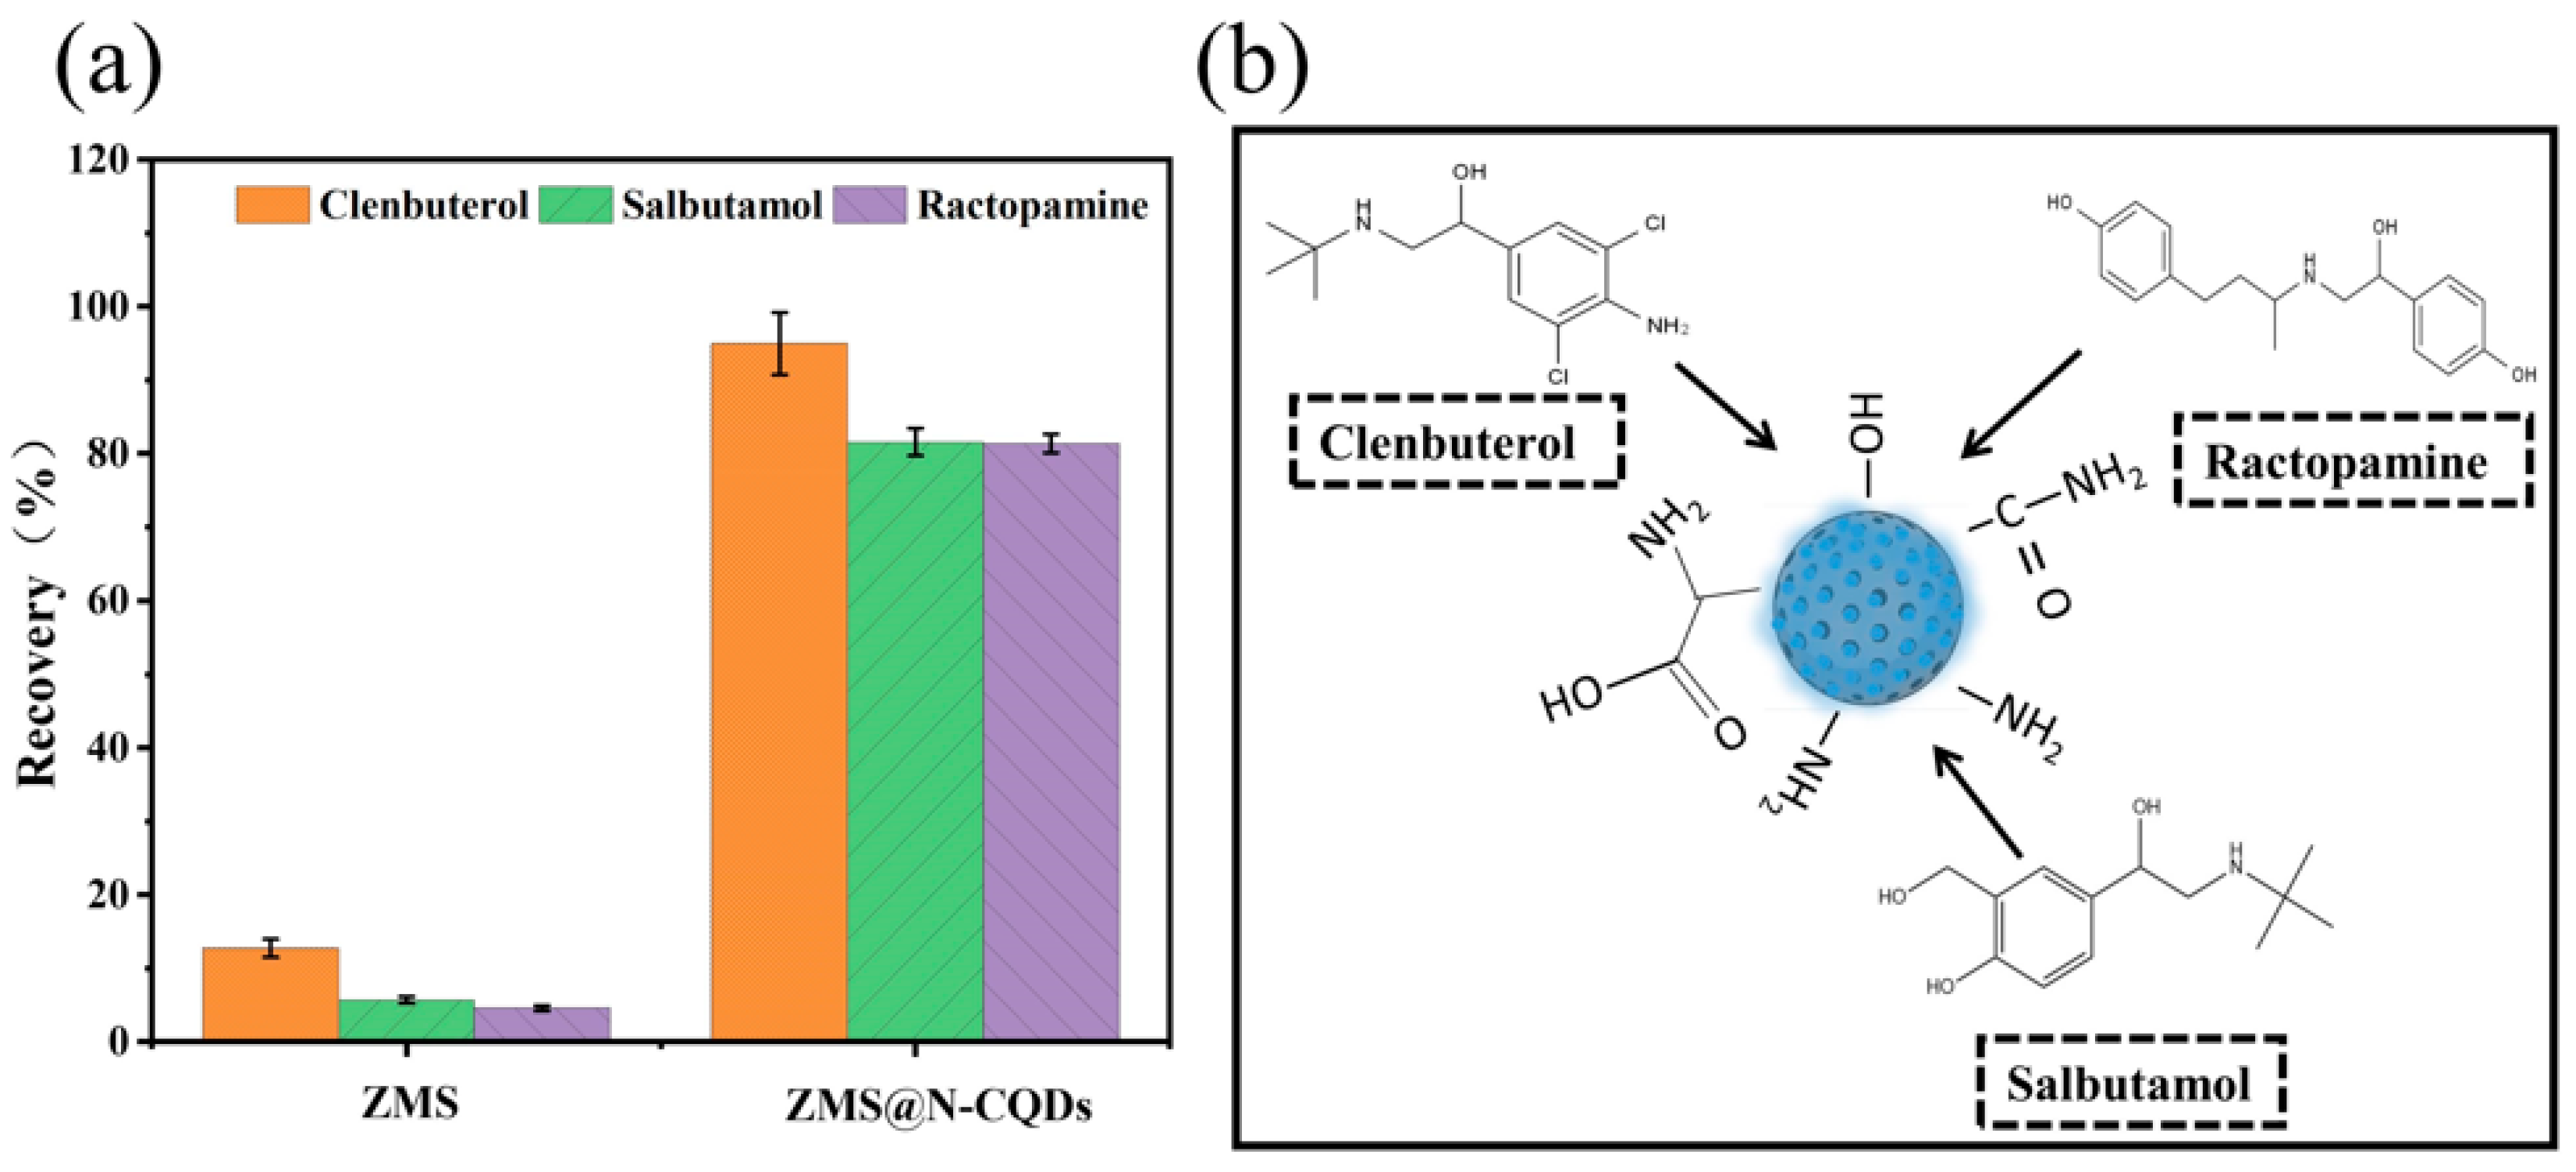
3.3. Comparison of Adsorption Capacity

To verify the adsorption mechanism of materials, the adsorption capacities of ZMS and the ZMS@N-CQDs for three β2-agonists were compared in this work. Briefly, 300 mg of the adsorbent materials were dispersed in a spiked (50 ng·g−1 β2-agonists) solution, and after sufficient extraction, elution and derivation, then 1 mL of the derived solvent was injected into GC-MS. The results are shown in Figure 5a, and it can be seen that the ZMS@N-CQDs has significantly stronger adsorption capacity for β2-agonists. As shown in Figure 3b, the molecular sieves exhibited neutral charges, while the ZMS@N-CQDs showed positive charges. This may be due to the a lot of -NH2 groups on the surface of the ZMS@N-CQDs, which can be hydrolyzed to -NH3+ groups. Therefore, they exist in a positively charged form in a neutral pH environment. Moreover, all three β2-agonists exhibited negative charges. As a result, the positively charged ZMS@N-CQDs can attract the negatively charged β2-agonists by electrostatic forces. The above factors can contribute to the stronger adsorption ability of the ZMS@N-CQDs towards the three β2-agonists (Figure 5b).

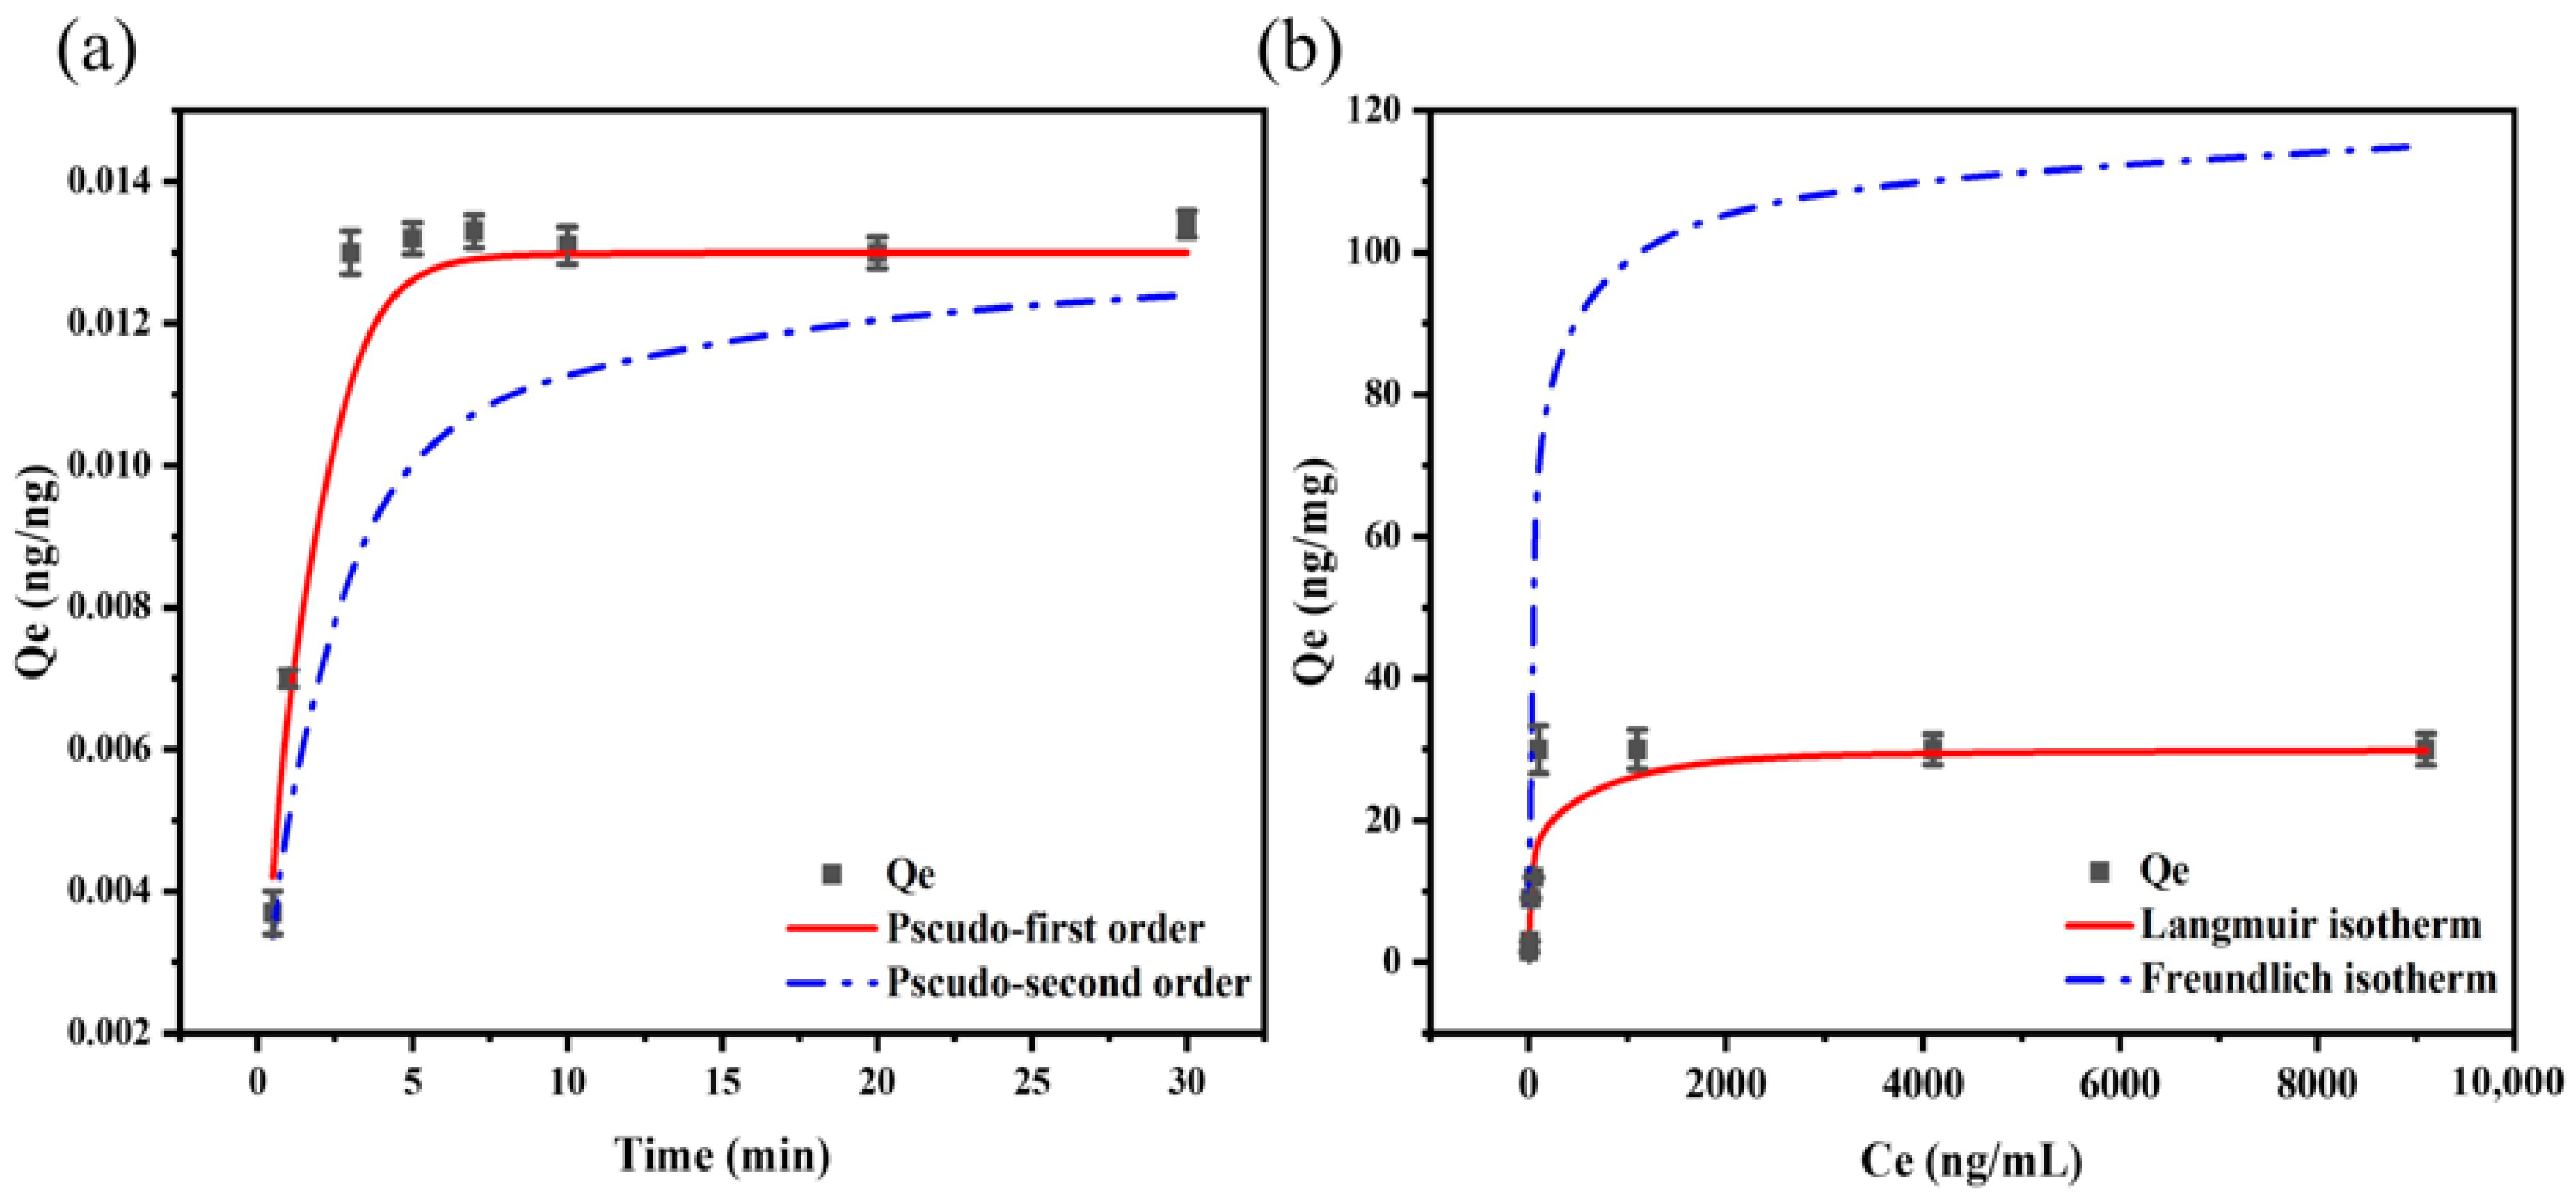
3.4. The kinetic and Isothermal Adsorption

3.4.1. Adsorption Kinetics

The study of adsorption kinetics is used to describe the rate of adsorption of analytes by adsorbents, and the data are fitted using kinetic models to explore the adsorption mechanism. To further research the adsorption kinetics of the ZMS@N-CQDs, the effect of contact time on the adsorption of clenbuterol was investigated at the initial concentration of 50 ng·mL−1. From Figure 6a, the adsorption quantity increases rapidly within a short contact time and reaches equilibrium at 3 min and indicates that the material with high adsorption capacity and efficiency is suitable for β2-agonists. The relevant data were fitted by pseudo-first-order and pseudo-second-order Equations (1) and (2) [32].
Pseudo-first-order kinetic:
ln ( q e q t ) = ln q e k 1
Pseudo-second-order kinetic:
t / q t = 1 / ( k 2 × q e 2 ) + t / q e
where qe and qt represent the amounts of clenbuterol adsorbed at equilibrium and at time t, respectively; k1 represents the pseudo-first-order kinetic constant; k2 represents the pseudo-second order kinetic; and t represents the adsorption time.
By calculation, the correlation coefficient of pseudo-first-order kinetics (R2 = 0.9909) for the ZMS@N-CQDs adsorption of clenbuterol is greater than that of pseudo-second-order kinetics (R2 = 0.9863), and theoretical equilibrium adsorption quantity calculated by pseudo-first-order kinetics (12.9 μg·mg−1) is closer to the experimental value (13.3 μg·mg−1) (Table S2). Therefore, the adsorption of clenbuterol with the ZMS@N-CQDs is more likely match with pseudo-first-order kinetics equation. It indicates that the attachment of clenbuterol to the adsorbent surface is controlled by diffusion steps, and the interaction between the adsorbent and clenbuterol is a physical force. The adsorption sites on the adsorbent surface are limited, and there is only one binding site.

3.4.2. Adsorption Isotherms

Isothermal adsorption research can determine the performance of adsorbents, and important parameters such as adsorption capacity, saturation time, and adsorption rate can be determined through experiments. These parameters can further analyze the adsorption mechanism and properties of the adsorbent. Adsorption properties were demonstrated by using 100 mg of the ZMS@N-CQDs as the adsorbent and clenbuterol as model analyte. Figure 6b shows the adsorption isotherms of clenbuterol, the adsorption quantity of clenbuterol increased with increasing concentrations from 5 to 9000 ng·mL−1. The initial sharp increase indicates that as more active sites become available, a large amount of analytes are adsorbed at lower concentration. As the analytes concentration increases, it is difficult for β2-agonists to find adsorption vacant sites, with saturated adsorption achieved [21]. The analysis results were fitted to the Langmuir and Freundlich isothermal adsorption models according to Equations (3) and (4), respectively [33].
Langmuir:
C e / q e = 1 / ( k L × q m ) + C e / q m
Freundlich:
ln q e = ln k F + ln C e / n
Among them, kL represents the Langmuir constant; qe and qm represent the equilibrium adsorption amount and maximum adsorption amount, respectively; Ce represents the equilibrium concentration; and n and kF represent the Freundlich constants.
By calculation, theoretical maximum adsorption quantities and the correlation coefficients were obtained by fitting to the above two models. The results indicated that the adsorption of clenbuterol tended to the Langmuir adsorption curve with a correlation coefficient of 0.9999, which is higher than that fitted to the Freundlich adsorption curve (0.9642). The theoretical maximum adsorption value (29.83 ng·mg−1) is closer to the experimental value (30.00 ng·mg−1) (Table S3).
In the isothermal adsorption experiment, only Langmuir and Freundlich models were used for fitting. As is well known, commonly used isothermal adsorption models include Langmuir, Freundlich, and Temkin. The Langmuir model is one of the most basic isothermal adsorption models, which describes the monolayer adsorption process of substances on the surface of adsorbent. The Freundlich model is suitable for situations where the adsorption process does not fully satisfy the Langmuir model, describing the multi-layer adsorption process of substances on the surface. The Temkin model is an improved isothermal adsorption model based on the Freundlich model, which also describes the multi-layer adsorption process of substances on the surface. Through calculation, the adsorption model of clenbuterol is more compatible with the Langmuir model, indicating that it belongs to single-layer adsorption. Therefore, the experiment only uses the Langmuir and Freundlich models for fitting.

3.5. Method Validation

A series of experiments were conducted to verify the linear range and correlation coefficient of determination, limit of detection (LOD), limit of quantification (LOQ), and relative standard deviation (RSDs) of the method. The working curves were plotted by spiking (5–1000 ng·g−1 of clenbuterol, 2–1000 ng·g−1 of salbutamol and ractopamine) into pork samples and using the ZMS@N-CQDs as the SPE adsorbent. There was a good linear response for the three β2-agonists, with R values ranging from 0.9908 to 0.9936 for LODs of 0.7 to 2.0 ng·g−1 and LOQs of 2.4 to 5.0 ng·g−1, indicating that the method has high sensitivity (Table 1). The RSDs were 2.7–11.9%, with good precision, indicating that this method has good reproducibility.

3.6. Comparison with Other Methods

The method was compared with other methods in the literature, comparing the parameters (Table 2). Considering enzymatic hydrolysis methods SPE-UHPLC-MS/MS [7], MCXSPE-LC-MS/MS [34], micro-extraction-UHPLC-Q ExactiveTM Plus Orbitrap MS [35], and MMIPSPE-HPLC [36], the LOD and recovery of the current SPE-GC-MS method based on the ZMS@N-CQDs are comparable, but the pre-treatment procedure of other methods is relatively complex and the linear range is relatively narrow, which is not suitable for rapid, wide spectrum detection. Therefore, the current developed method is a simple, sensitive, and wide-spectrum method for the analysis of β2-agonist residues in meat.
Furthermore, there are many current standards for the detection of β2-agonists residues in meat samples; GB/T 22286-2008 is the standard designated by the national food safety supervision and sampling implementation rules. In this standard method, the sample was enzymatically digested, cleaned up by cation exchange column, quantified by internal standard method, and finally determined by LC-MS/MS with a detection limit of 0.5 μg·kg−1. Compared with this standard method, the time required for this work is shorter with an acceptable sensitivity. Overall, this method is an effective method for detecting β2-agonist residues in meat.

3.7. Matrix Effects

Matrix is a component in a sample other than the analyte, which often significantly interferes with the analysis process of the analyte and affects the accuracy of the analysis results. For example, the ionic strength in the solution will affect the activity coefficient of analyte, and these effects and interferences can be called matrix effects (ME). An important feature of the SPE method is the reduction in matrix effects by specific adsorption of targets in complex matrices. To investigate the ability of the ZMS@N-CQDs to reduce matrix impact, six sets of calibration curves were constructed (Table 3). The ME can be calculated by using Equation (5) [37].
M E = ( 1 A B ) × 100 %
where A represents the slope of the calibration curve in matrix, and B represents the slope of the calibration curve in solvent.
The ME of the three β2-agonists were relatively high (47.2–79.1%) in the untreated samples. After pre-treatment with the ZMS@N-CQDs, the ME ranged from 19.2% to 26.3%, and compared with other adsorption materials (C18 from 33.3% to 44.5%, PSA from 36.9% to 53.6%, NCD from 28.7–34.9%), the ZMS@N-CQDs reduced the ME in the detection of three β2-agonists more. From Table 3, it can be seen that with the use of N-CQDs as the adsorption material, matrix effects were relatively low, which may be due to the π-π stacking effect of N-CQDs on the target substance. However, the recovery rate of the material has not yet met the requirements; thus, a composite material is made by combining porous materials (zeolite molecular sieves) with N-CQDs, which not only has the physical adsorption of porous materials but also has the selective adsorption of N-CQDs. Therefore, the ZMS@N-CQDs is a promising adsorbent for SPE and the pre-treatment of complex samples.

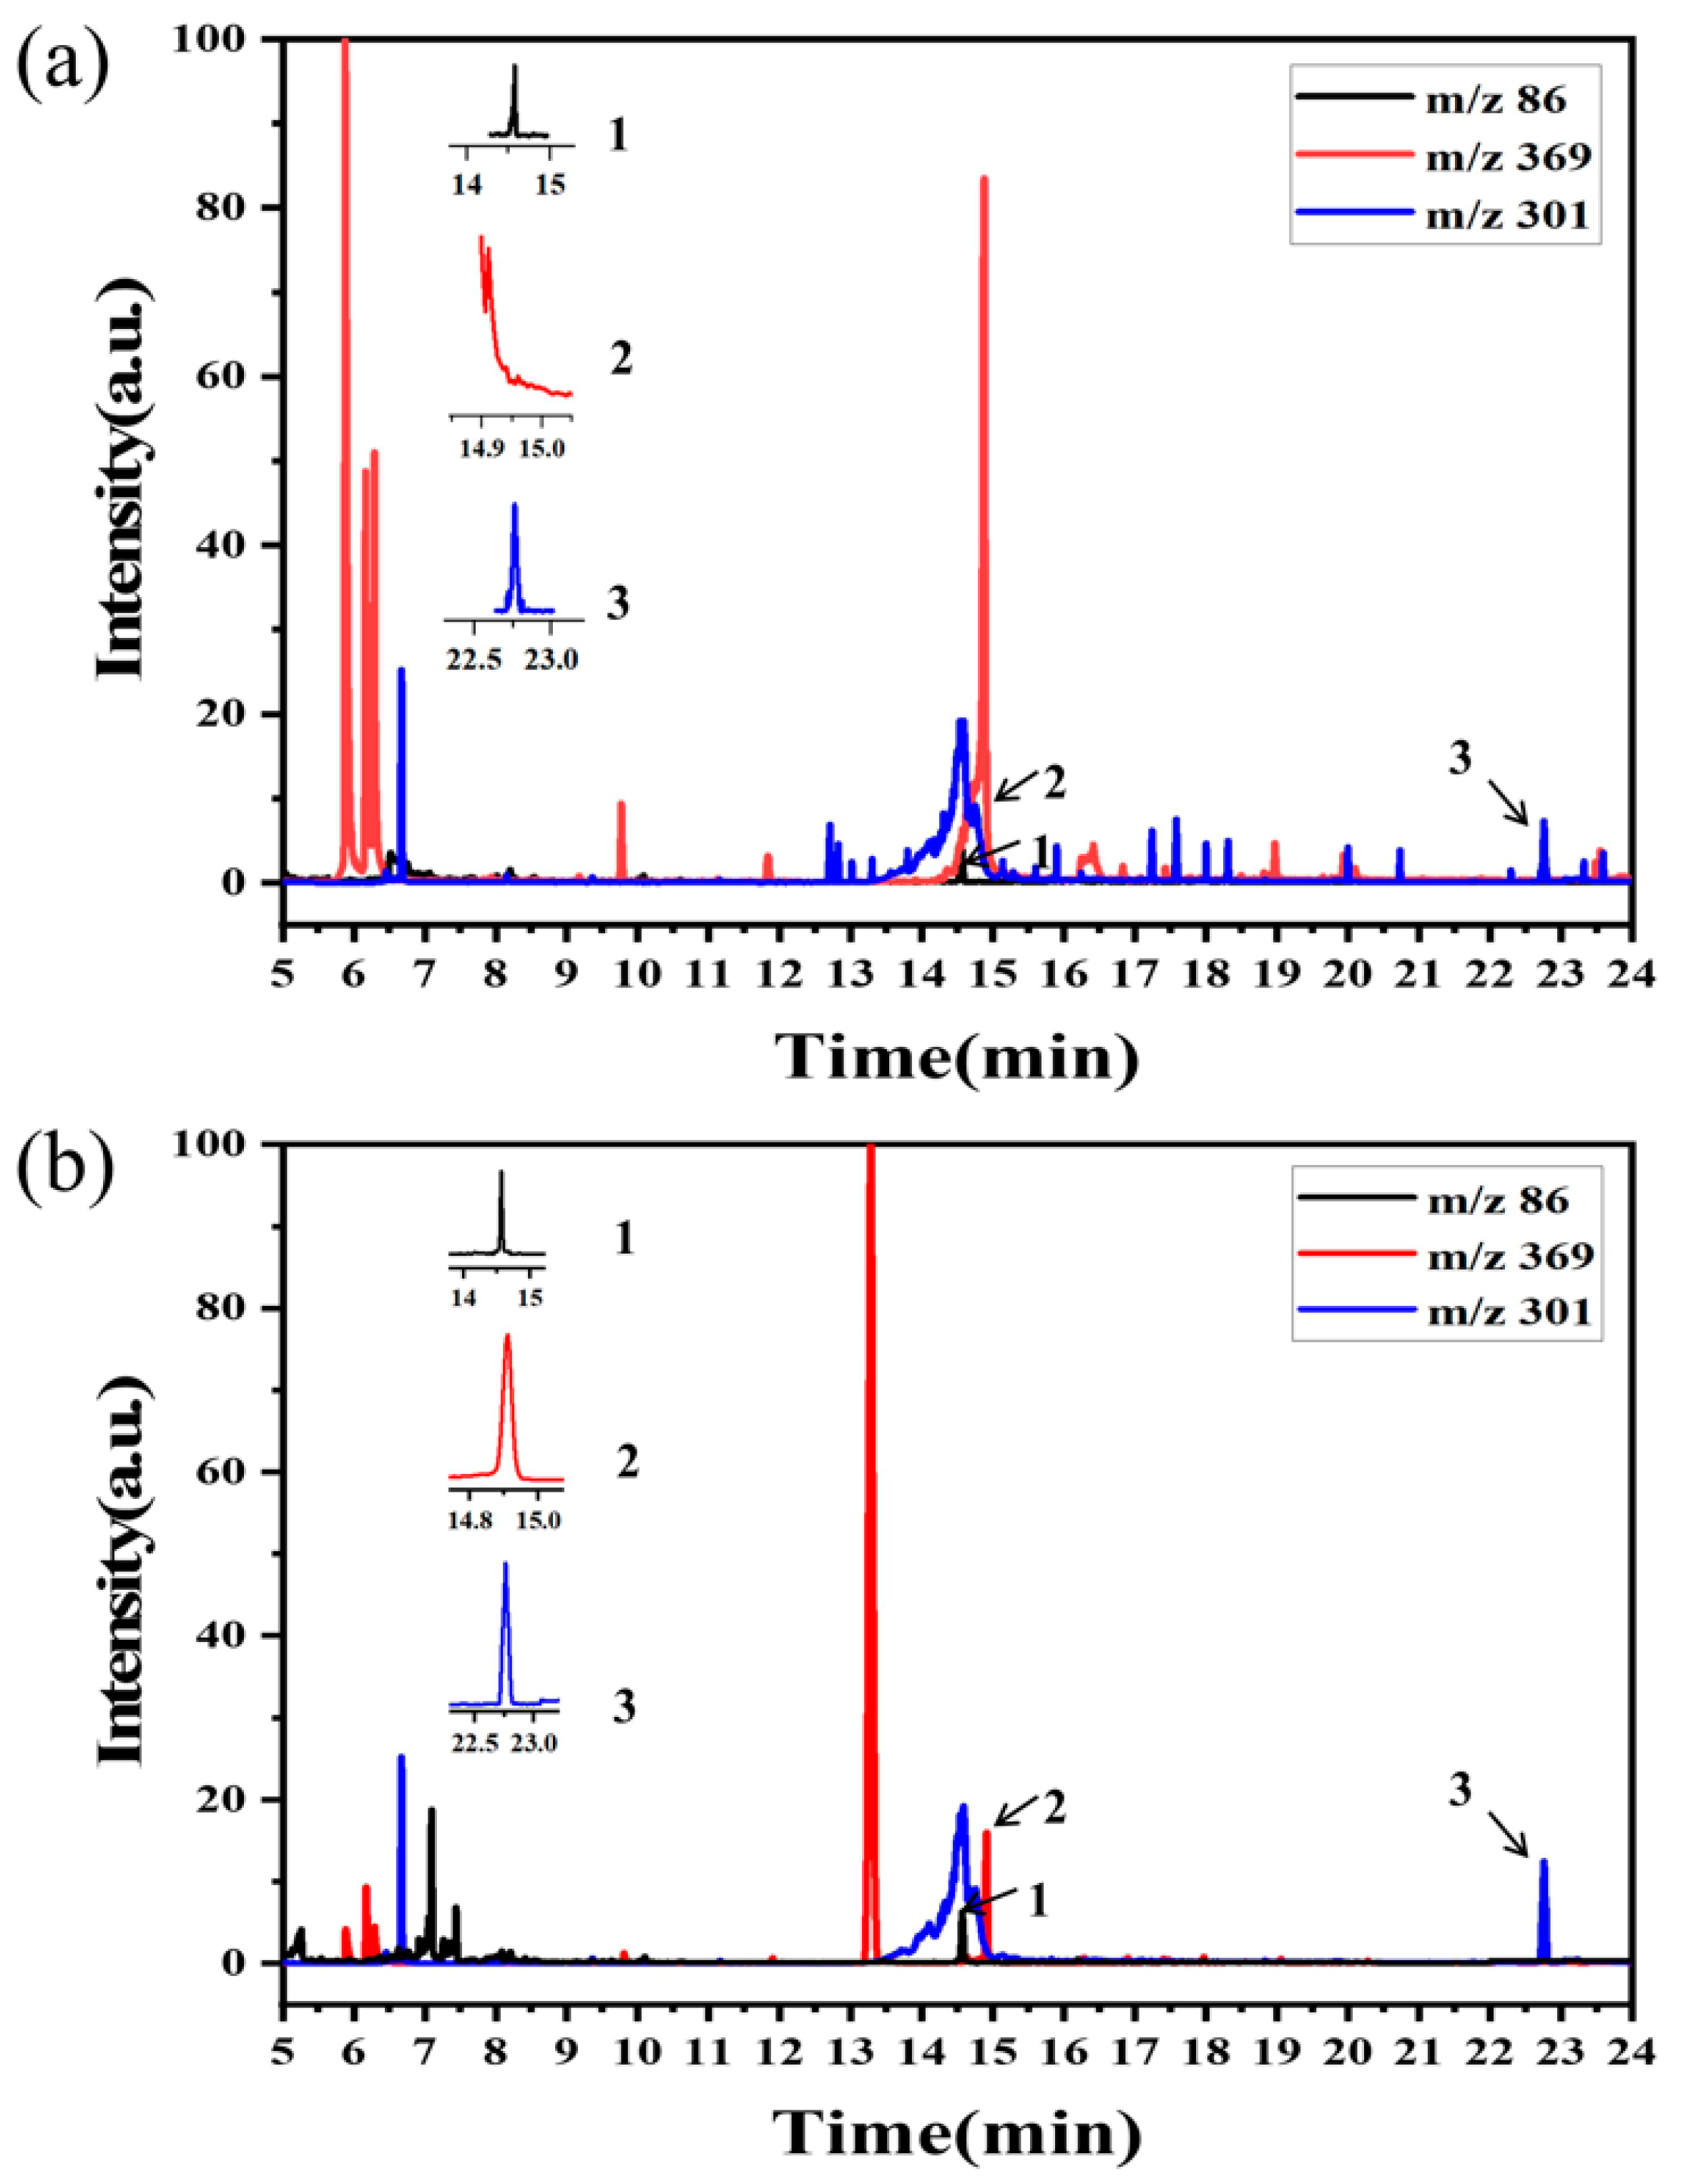
3.8. Practical Sample Analysis

The established method was used to detect the three β2-agonists in pork, beef, and mutton samples to verify the detection significance of this method in actual samples. It involved a series of steps: pre-extraction, adsorbent adsorption, analyte elution, derivatization, and final GC-MS for detection. The results are listed in Table 4. Clenbuterol and salbutamol were detected only in the pork sample. Therefore, it is necessary to conduct recovery rate tests. The accuracy of the method was verified by the recovery rate tests of two different spiked concentration levels. The recoveries were 80.8–97.8%, 80.5–96.7%, and 79.5–92.3% for spiked pork, beef, and mutton, respectively, which confirmed the satisfactory extraction effect and certain selectivity of the method. The chromatogram and mass spectra of the pork samples spiked with 50 ng·g−1 were detected on the GC-MS, as shown in Figure 7 and Figure S2. From Figure 7, many interfering peaks (curve (a)) in the untreated meat samples were observed, and the peaks of impurity were very high, which can adversely impact the accuracy of β2-agonist detection. This result justifies the necessity of sample pre-treatment. The accuracy of β2-agonist detection was significantly higher (curve (b)), indicating a higher recovery rate of the analytes. In contrast, most of the interference was effectively removed by the ZMS@N-CQDs, indicating the ZMS@N-CQDs as an SPE material that has strong specific adsorption ability and anti-interference ability.

4. Conclusions

In the experiment, a molecular-sieves-modified N-CQDs adsorbent (ZMS@N-CQDs) was prepared by hydrothermal synthesis with high adsorption efficiency and selectivity and used for SPE adsorption material of three β2-agonists in meat samples. The results indicated that the ZMS@N-CQDs have the advantages of strong adsorption efficiency, good reproducibility, and high stability. The method of SPE combined with GC-MS has a wide linear range, fast analysis, high accuracy and precision, and high sensitivity, which can be used for the practical meat samples. Furthermore, it is of practical significance for the analysis and detection of β2-agonists in other samples.

Supplementary Materials

The following supporting information can be downloaded at: https://www.mdpi.com/article/10.3390/separations10080429/s1, Figure S1: The schematic diagram of β2-agonist structure (clenbuterol, salbutamol, and ractopamine); Figure S2: The mass spectra of each β2-agonist used in this method; Table S1: The retention times, qualitative ions, and quantitative ions for each β2-agonist in the method; Table S2: Kinetic parameters for the adsorption of clenbuterol on the ZMS@N-CQDs; Table S3: Adsorption isotherm parameters of clenbuterol on the ZMS@N-CQDs.

Author Contributions

Conceptualization, Methodology, Validation, Formal Analysis, Data Curation, Writing—Original Draft, S.Z.; Investigation, Conceptualization, Validation, Investigation, Data Curation, B.M.; Writing—Review & Editing, L.Z. (Liao Zheng); Software, Resources, Writing—Review & Editing, Funding Acquisition, Supervision, Project Administration, L.W.; Data Curation, Resources, Writing—Review & Editing, Funding Acquisition, Supervision, Project Administration, N.G.; Resources, Funding Acquisition, Supervision, Project Administration, L.Z. (Lin Zheng). All authors have read and agreed to the published version of the manuscript.

Funding

This research was funded by the XinMiao Talent Plan Project of Zhejiang Province (grant number 2022R405B080), the National Natural Science Foundation of China (Grant no. 21974074, 22204086), Ningbo Natural Science Funding (Grant no. 2023J095, 2023J096), Ningbo Public Welfare Technology Plan Project of China (Grant no. 2021Z056, 2022S011), Major scientific and technological tasks of Ningbo (Grant no. 2022Z170), and K. C. Wong Magna Fund in Ningbo University.

Data Availability Statement

Not applicable.

Acknowledgments

This work was supported by the XinMiao Talent Plan Project of Zhejiang Province (grant number 2022R405B080), the National Natural Science Foundation of China (Grant no. 21974074, 22204086), Ningbo Natural Science Funding (Grant no. 2023J095, 2023J096), Ningbo Public Welfare Technology Plan Project of China (Grant no. 2021Z056, 2022S011), Major scientific and technological tasks of Ningbo (Grant no. 2022Z170), and K. C. Wong Magna Fund in Ningbo University.

Conflicts of Interest

The authors declare no conflict of interest.

References

  1. Liu, M.; Ma, B.; Wang, Y.; Chen, E.; Li, J.; Zhang, M. Research on Rapid Detection Technology for β2-Agonists: Multi-Residue Fluorescence Immunochromatography Based on Dimeric Artificial Antigen. Foods 2022, 11, 863. [Google Scholar] [PubMed]
  2. Lv, C.Z.; Xun, Y.; Cao, Z.; Xie, J.L.; Li, D.; Liu, G.; Yu, L.; Feng, Z.M.; Yin, Y.L.; Tan, S.Z. Sensitive determination of toxic clenbuterol in pig meat and pig liver based on a carbon nanopolymer composite. Food Anal. Methods 2017, 10, 2252–2261. [Google Scholar] [CrossRef]
  3. Shishani, E.I.; Chai, S.C.; Jamokha, S.; Aznar, G.; Hoffman, M.K. Determination of ractopamine in animal tissues by liquid chromatography-fluorescence and liquid chromatography/tandem mass spectrometry. Anal. Chim. Acta 2003, 483, 137–145. [Google Scholar] [CrossRef]
  4. Wan, L.; Gao, H.; Liu, X.; Gao, S.; Zhou, L.; Wang, F.; Chen, M. Electromembrane extraction of clenbuterol from swine urine for monitoring illegal use in livestock. J. Sep. Sci. 2022, 45, 3966–3973. [Google Scholar] [CrossRef]
  5. Ma, Z.; Wang, Q.; Gao, N.; Li, H. Electrochemical detection of clenbuterol with gold-nanoparticles-modified porous boron-doped diamond electrode. Microchem. J. 2020, 157, 104911. [Google Scholar] [CrossRef]
  6. Wang, Z.L.; Zhang, J.L.; Zhang, Y.N.; Zhao, Y. Mass spectrometric analysis of residual clenbuterol enantiomers in swine, beef and lamb meat by liquid chromatography tandem mass spectrometry. Anal. Methods 2016, 8, 4127–4133. [Google Scholar] [CrossRef]
  7. Cai, C.; Xiang, Y.; Tian, S.; Hu, Z.; Hu, Z.; Ma, B.; Wu, P. Determination of β2-Agonist Residues in Fermented Ham Using UHPLC-MS/MS after Enzymatic Digestion and Sulfonic Resin Solid Phase Purification. Molecules 2023, 28, 2039. [Google Scholar] [CrossRef]
  8. Yan, K.; Zhang, H.; Hui, W.; Zhu, H.; Li, X.; Zhong, F.; Chen, C. Rapid screening of toxic salbutamol, ractopamine, and clenbuterol in pork sample by high-performance liquid chromatography-UV method. J. Food Drug Anal. 2016, 24, 277–283. [Google Scholar] [CrossRef]
  9. Chang, L.Y.; Chou, S.S.; Hwang, D.F. High performance liquid chromatography to determine animal drug clenbuterol in pork, beef and hog liver. J. Food Drug Anal. 2005, 13, 163–167. [Google Scholar] [CrossRef]
  10. Li, F.; Zhou, J.; Wang, M.; Zhang, L.; Yang, M.; Deng, L. Production of a matrix certified reference material for measurement and risk monitoring of clenbuterol in mutton. Anal. Bioanal. Chem. 2023, 415, 1487–1496. [Google Scholar] [CrossRef]
  11. Giannetti, L.; Ferretti, G.; Gallo, V.; Necci, F.; Giorgi, A. Analysis of beta-agonist residues in bovine hair: Development of a UPLC-MS/MS method and stability study. J. Chromatogr. B 2016, 1036–1037, 76–83. [Google Scholar]
  12. Zhao, L.; Zhao, J.; Huangfu, W.G.; Wu, Y.L. Simultaneous Determination of Melamine and Clenbuterol in Animal Feeds by GC-MS. Chromatographia 2010, 72, 365–368. [Google Scholar] [CrossRef]
  13. Pinheiro, I.; Jesuino, B.; Barbosa, J.; Ferreira, H.; Ramos, F.; Matos, J.; da Silveira, M.I.N. Clenbuterol Storage Stability in the Bovine Urine and Liver Samples Used for European Official Control in the Azores Islands (Portugal). J. Agric. Food Chem. 2009, 57, 910–914. [Google Scholar] [CrossRef] [PubMed] [Green Version]
  14. Chen, X.; Wu, R.; Sun, L.; Yao, Q.; Chen, X. A sensitive solid-state electrochemiluminescence sensor for clenbuterol relying on a PtNPs/RuSiNPs/Nafion composite modified glassy carbon electrode. J. Electroanal. Chem. 2016, 781, 310–314. [Google Scholar] [CrossRef]
  15. Ma, F.; Li, X.; Li, Y.; Feng, Y.; Ye, B.C. High current flux electrochemical sensor based on nickel-iron bimetal pyrolytic carbon material of paper waste pulp for clenbuterol detection. Talanta 2022, 250, 123756. [Google Scholar] [CrossRef] [PubMed]
  16. Chunsheng, L.; Yujing, L.; Yan, Z.; Jingjing, L.; Junhua, L.; Meng, W.; Haiyan, L.; Zhencai, Y. Preparation of an anti-formoterol monoclonal antibody for indirect competitive ELISA detection of formoterol in urine and pork samples. Anal. Methods 2018, 10, 548–553. [Google Scholar] [CrossRef]
  17. Li, Y.; Zhang, H.; Cui, Z.; Liu, S.; Xu, J.; Jia, C.; Chen, Y.; Wang, L.; Sun, J.; Zhang, D.; et al. Chemical staining enhanced Enzyme-linked immunosorbent assay for sensitive determination of Clenbuterol in food. Food Chem. 2023, 400, 134012. [Google Scholar] [CrossRef]
  18. Guo, Q.; Peng, Y.; Zhao, X.; Chen, Y. Rapid Detection of Clenbuterol Residues in Pork Using Enhanced Raman Spectroscopy. Biosensors 2022, 12, 859. [Google Scholar] [CrossRef] [PubMed]
  19. Peng, F.; Li, B.; Sun, S.; Mi, F.; Wang, Y.; Hu, C.; Geng, P.; Pang, L.; Li, J.; Guan, M. A novel fluorescence internal filtration immunoassay for the detection of clenbuterol. Eur. Food. Res. Technol. 2022, 248, 415–426. [Google Scholar] [CrossRef]
  20. Fan, J.; Cai, Y.; Yan, Z.; Li, Y.; Yao, X. Determination of polycyclic aromatic hydrocarbons in Chinese herbal medicines by gas chromatography-mass spectrometry with graphene-functionalized nickel foam. J. Chromatogr. A 2023, 1694, 463904. [Google Scholar] [CrossRef]
  21. Wu, C.; Ning, X.; Chen, X.; Ma, J.; Zhao, Q.; Zhao, L.; Zhu, G.; Shi, S. Multi-functional porous organic polymers for highly-efficient solid-phase extraction of β-agonists and β-blockers in milk. RSC Adv. 2021, 11, 28925–28933. [Google Scholar] [CrossRef] [PubMed]
  22. Lin, Y.P.; Lee, Y.L.; Hung, C.Y.; Huang, W.J.; Lin, S.C. Determination of multiresidue analysis of β-agonists in muscle and viscera using liquid chromatograph/tandem mass spectrometry with Quick, Easy, Cheap, Effective, Rugged, and Safe methodologies. J. Food Drug Anal. 2017, 25, 275–284. [Google Scholar] [CrossRef] [PubMed]
  23. Behbahani, M.; Bagheri, S.; Omidi, F.; Amini, M.M. An amino-functionalized mesoporous silica (KIT-6) as a sorbent for dispersive and ultrasonication-assisted micro solid phase extraction of hippuric acid and methylhippuric acid, two biomarkers for toluene and xylene exposure. Microchim. Acta 2018, 185, 505–512. [Google Scholar] [CrossRef]
  24. Parvizi, S.; Behbahani, M.; Esrafili, A. Preconcentration and ultra-trace determination of hexavalent chromium ions using tailor-made polymer nanoparticles coupled with graphite furnace atomic absorption spectrometry: Ultrasonic assisted-dispersive solid-phase extraction. New J. Chem. 2018, 42, 10357–10365. [Google Scholar]
  25. Salem, A.A.; Wasfi, I.; Al-Nassib, S.S.; Allawy Mohsin, M.; Al-Katheeri, N. Determination of Some β-Blockers and β2-Agonists in Plasma and Urine Using Liquid Chromatography-tandem Mass Spectrometry and Solid Phase Extraction. J. Chromatogr. Sci. 2017, 55, 846–856. [Google Scholar] [CrossRef]
  26. Villa, C.C.; Galus, S.; Nowacka, M.; Magri, A.; Petriccione, M.; Gutiérrez, T.J. Molecular sieves for food applications: A review. Trends Food Sci. Technol. 2020, 102, 102–122. [Google Scholar] [CrossRef]
  27. ALOthman, Z.A. A Review: Fundamental Aspects of Silicate Mesoporous Materials. Materials 2012, 5, 2874–2902. [Google Scholar]
  28. Liu, X.; Guo, Y.; Zhang, C.; Huang, X.; Ma, K.; Zhang, Y. Preparation of Graphene Oxide/4A Molecular Sieve Composite and Evaluation of Adsorption Performance for Rhodamine B. Sep. Purif. Technol. 2022, 286, 120400. [Google Scholar] [CrossRef]
  29. Yu, H.; Shi, R.; Zhao, Y.; Waterhouse, G.I.; Wu, L.Z.; Tung, C.H.; Zhang, T. Smart Utilization of Carbon Dots in Semiconductor Photocatalysis. Adv. Mater. 2016, 28, 9454. [Google Scholar] [CrossRef]
  30. Ahmad, A.; Shahraki, H.S.; Shakeel, N.; Bushra, R. Cynodon dactylon derived fluorescent N-doped carbon dots: Implications of photocatalytic and biological applications. Surf. Interfaces 2023, 38, 102812. [Google Scholar]
  31. Zhang, H.; Liu, K.; Liu, J.; Wang, B.; Li, C.; Song, W.; Li, J.; Huang, L.; Yu, J. Carbon Dots-in-Zeolite via In-Situ Solvent-Free Thermal Crystallization: Achieving High-Efficiency and Ultralong Afterglow Dual Emission. CCS Chem. 2020, 2, 118–127. [Google Scholar]
  32. Eeshwarasinghe, D.; Loganathan, P.; Kalaruban, M.; Sounthararajah, D.P.; Kandasamy, J.; Vigneswaran, S. Removing polycyclic aromatic hydrocarbons from water using granular activated carbon: Kinetic and equilibrium adsorption studies. Environ. Sci. Pollut. Res. 2018, 25, 13511–13524. [Google Scholar] [CrossRef] [PubMed] [Green Version]
  33. Lv, J.; Chen, Q.; Liu, J.H.; Yang, H.S.; Wang, P.; Yu, J.; Xie, Y.; Wu, Y.F.; Li, J.R. Effective Removal of Clenbuterol and Ractopamine from Water with a Stable Al(III)-Based Metal-Organic Framework. Lnorg. Chem. 2021, 60, 1814–1822. [Google Scholar] [CrossRef] [PubMed]
  34. Liu, R.; Tang, X.; Xiong, R.; Li, L.; Du, X.; He, L. Simultaneous determination of fourteen β2-agonist enantiomers in food animal muscles by liquid chromatography coupled with tandem mass spectrometry. J. Chromatogr. B 2022, 1193, 123169. [Google Scholar] [CrossRef] [PubMed]
  35. Ar-sanork, K.; Karuwan, C.; Surapanich, N.; Wilairat, P.; Nacapricha, D.; Chaisuwan, P. Mixed mode monolithic sorbent in pipette tip for extraction of ractopamine and clenbuterol prior to analysis by HPLC-UV and UHPLC-Q ExactiveTM Plus Orbitrap MS. J. Anal. Sci. Technol. 2021, 23, 12–23. [Google Scholar] [CrossRef]
  36. Zhao, Y.; Feng, Z.; Li, S.; Lu, Y.; Hu, Y.; Fan, H.; Zhai, X. Preparation of Magnetic Molecularly Imprinted Polymers for Selective Recognition and Determination of Clenbuterol in Pork Samples. J. Chem. 2020, 2020, 8820262. [Google Scholar] [CrossRef]
  37. Wang, J.; Duan, H.L.; Fan, L.; Zhang, J.; Zhang, Z.Q. A magnetic fluorinated multi-walled carbon nanotubes-based QuEChERS method for organophosphorus pesticide residues analysis in Lycium ruthenicum Murr. Food Chem. 2021, 338, 127805. [Google Scholar] [CrossRef]
Figure 1. The experimental schematic diagram of the ZMS@N-CQDs as SPE adsorption material.
Separations 10 00429 g001
Figure 2. Characterization of the adsorption material. The SEM representation plots of ZMS at 1 μm (a); the ZMS@N-CQDs at 1 μm (b); TEM representation plots of the ZMS@N-CQDs at 2 μm (c); the ZMS@N-CQDs at 0.5 μm (d).
Separations 10 00429 g002
Figure 3. The XPS elemental analysis of ZMS (a) and the ZMS@N-CQDs (b); the zeta potentials diagram of the ZMS@N-CQDs (c); fluorescence spectra of the ZMS@N-CQDs combined with three β2-agonists (d). The concentration of ractopamine, clenbuterol, and salbutamol was 50 ng·g−1. Numbers 1–8 are the zeta potentials of the ZMS, the ZMS@N-CQDs, ractopamine, clenbuterol, salbutamol, the ZMS@N-CQDs mixed with ractopamine, the ZMS@N-CQDs mixed with clenbuterol, and the ZMS@N-CQDs mixed with salbutamol, respectively.
Separations 10 00429 g003
Figure 4. Optimization of extraction and elution conditions. (a) Effect of the ZMS@N-CQDs dosage; (b) effect of extraction time; (c) effect of elution time; (d) effect of extraction salt dosage; (e) effect of temperature; (f) the stability of three different batches of the ZMS@N-CQDs.
Separations 10 00429 g004
Figure 5. The adsorption capacities of ZMS and the ZMS@N-CQDs for 3 β2-agonists (a). A schematic of the adsorption of the ZMS@N-CQDs (b).
Separations 10 00429 g005
Figure 6. Adsorption mechanism between the ZMS@N-CQDs and clenbuterol. (a) The kinetic model fitting; (b) the isothermal adsorption model fitting.
Separations 10 00429 g006
Figure 7. The chromatograms of spiked meat extracts treated without the ZMS@N-CQDs (a), treated with the ZMS@N-CQDs (b). Numbers 1–3 are the peaks of the β2-agonists clenbuterol, salbutamol, and ractopamine, respectively.
Separations 10 00429 g007
Table 1. The characterizations for the detection of the β2-agonist residues in pork.
TargetsCalibration CurveLinear RangeRLOD aLOQ aRSD
(%, n = 5)
ClenbuterolY = 64.735X + 484.375–10000.99252.05.02.7
SalbutamolY = 213.32X + 1950.72–10000.99080.72.411.9
RactopamineY = 202.70X + 2458.52–10000.99360.82.75.9
a the units for LODs and LOQs are ng·g−1.
Table 2. Comparison of other methods with this work.
MethodAdsorbentPre-Treatment ProcedureLinear Range
(ng·g−1)
LOD
(ng·g−1)
RSD (%)Recoveries (%)Ref.
Enzymatic hydrolysis,
SPE-UHPLC-
MS/MS
SCR aEnzymatic hydrolysis,
SPE
0.2–5.00.14.3–10.283.0–98.0[7]
SPE-LC-MS/MSMCX solid phase extraction cartridgeSPE0.2–25.00.2lower than 15%95.3–117.7[34]
micro-extraction, UHPLC-Q ExactiveTM
Plus Orbitrap MS
a mixed mode monolithic materialμ-SPE0.8–2000.192.36–4.6496–106[35]
SPE-HPLCMMIP bSPE50–2504.273.48–7.1494.4–102.3[36]
SPE-GC-MSZMS@N-CQDsSPE2–10000.72.7–11.979.5–97.8This work
a SCR: a polymer-based strong cation resin cartridge containing sulfonic resin; b MMIP: magnetic molecularly imprinted polymer.
Table 3. Linear equation, coefficient of determination, and matrix effect (ME) for β2-agonists.
No.TargetsPure SolventSample Extract without TreatmentExtract Treated with the ZMS@N-CQDs
Y = k1X + b1RY = k2X + b2RME (%)Y = k3X + b3RME (%)
1ClenbuterolY = 117.73X + 3161.40.9992Y = 62.152X + 436110.904347.2Y = 90.029X + 1565.40.996323.5
2SalbutamolY = 612.26X + 2600.30.9987Y = 147.26X + 272390.963875.9Y = 451.06X + 1547.10.998126.3
3RactopamineY = 456.28X + 7932.40.9975Y = 95.626X + 267840.882979.1Y = 368.75X + 8075.70.992419.2
No.TargetsExtract Treated with PSAExtract Treated with C18Extract Treated with NCD a
Y = k4X + b4RME (%)Y = k5X + b5RME (%)Y = k6X + b6RME (%)
1ClenbuterolY = 74.274X + 1185.80.998036.9Y = 78.523X − 122.890.996333.3Y = 83.907X + 1453.70.996928.7
2SalbutamolY = 308.71X + 3945.80.991649.6Y = 363.03X + 60140.990540.7Y = 415.55X + 6610.20.991232.1
3RactopamineY = 211.57X + 1787.60.998353.6Y = 253.29X + 3709.70.992144.5Y = 296.98X + 46370.993734.9
a NCD: nitrogen doped carbon dots using L-glutamic acid and ethylenediamine as nitrogen sources.
Table 4. Determination of clenbuterol, salbutamol, and ractopamine in practical samples.
TargetsSpiked aPork Sample 1Pork Sample 2Spiked aBeef Sample 1Beef Sample 2
Found aRecovery%RSDs
(%, n = 5)
Found aRecovery%RSDs
(%, n = 5)
Found aRecovery%RSDs
(%, n = 5)
Found aRecovery%RSDs
(%, n = 5)
Clenbuterol0ND b--3.85-5.20ND b--ND b--
54.8997.84.78.0984.86.454.8196.23.24.6392.62.5
109.5695.61.413.3294.79.7109.6796.74.69.5495.43.1
Salbutamol0ND b--4.44-6.30ND b--ND b--
21.6381.51.66.1585.55.621.7487.09.31.6582.51.9
54.1683.22.38.4880.86.454.3787.48.24.2284.42.3
Ractopamine0ND b--ND b--0ND b--ND b--
21.6783.51.31.6582.57.821.6984.55.71.6180.53.7
54.3687.20.84.4188.24.354.5290.411.44.1783.42.0
TargetsSpiked aMutton Sample 1Mutton Sample 2
Found aRecovery%RSDs (%, n = 5)Found aRecovery%RSDs (%, n = 5)
Clenbuterol0ND b--ND b--
54.5791.45.74.6192.21.2
109.2392.36.19.1491.40.8
Salbutamol0ND b--ND b--
21.6080.04.81.5979.52.4
54.0881.64.54.1382.61.7
Ractopamine0ND b--ND b--
21.6381.53.31.6281.03.1
54.1282.43.94.1583.01.5
a the units for Spiked and Found are ng·g−1; b ND is not detected.
Disclaimer/Publisher’s Note: The statements, opinions and data contained in all publications are solely those of the individual author(s) and contributor(s) and not of MDPI and/or the editor(s). MDPI and/or the editor(s) disclaim responsibility for any injury to people or property resulting from any ideas, methods, instructions or products referred to in the content.

