Article

Green Synthesis of Magnetite Nanoparticles Mediated Fumaria officinalis L. Plant as Sustainable and Renewable Adsorbing Materials

1
Department of Chemistry, College of Science, University of Zakho, Duhok 42001, Iraq
2
Department of Phytochemistry, SRC, Soran University, Soran 44008, Iraq
3
Department of Chemistry, College of Science, University of Duhok, Duhok 42001, Iraq
4
Department of Chemistry, Faculty of Science, Soran University, Soran 44008, Iraq
5
Department of Pharmacy, Rawandz Private Technical Institute, Soran 44008, Iraq
6
Pharmacy Department, Technical Institute Duhok, Duhok Polytechnic University, Duhok 42001, Iraq
7
Department of Chemistry, Faculty of Science, King Khalid University, P.O. Box 9004, Abha 61413, Saudi Arabia
8
Chemistry Department, Faculty of Science, Al-Azhar University, Assiut 71524, Egypt
*
Authors to whom correspondence should be addressed.
Separations 2023, 10(9), 518; https://doi.org/10.3390/separations10090518
Submission received: 25 July 2023 / Revised: 13 August 2023 / Accepted: 16 August 2023 / Published: 21 September 2023

Abstract

:
Magnetite nanoparticles (Fe3O4) have been utilized to mediate Fumaria officinalis L., a plant known for its rich source of various phytogredients such as diterpenes, nor-diterpenoids, tri-terpenoids, flavonoids, and phenolic acids. These natural compounds act as capping, reducing, and stabilizing agents, offering an affordable and safer approach to synthesize nanoparticles in line with sustainable and eco-friendly concepts, such as green nanoparticles. The cost-effective synthesized nanoparticles were employed to adsorb Pb(II) from an aqueous solution. For investigating the surface characteristics of the adsorbent, a range of techniques were employed, including Field Emission Scanning Electron Microscope (FE-SEM), Fourier Transform Infrared Spectroscopy, and X-ray Diffraction. Fourier Transform Infrared (FT-IR) spectroscopy was specifically applied to discern the functional groups present within the compounds. To optimize the adsorption process and achieve the best removal efficiency (R%), several parameters, including pH, initial concentration, temperature, and contact time, were optimized using the Response Surface Methodology (RSM). The experimental results indicated that the Langmuir isotherm provided a well-fitted model, suggesting a monolayer of Pb(II) capping on the surface of magnetite nanoparticles, with a maximum adsorption capacity of 147.1 mg/g. Moreover, the kinetic findings demonstrated a strong alignment with the pseudo-second-order model. The computed (qe) and observed outcomes associated with the pseudo-second-order kinetic model exhibited a commendable concurrence, underscoring the model’s remarkable precision in forecasting the adsorption mechanism of Pb(II) within the examined parameters. The antioxidant activity and green nanocomposite properties were determined using 1,1-diphenyl-2-picrylhydrazyl (DPPH) and standard analytical methods. The phytochemical profile exhibited a total phenolic content of 596 ± 0.001 mg GAE/g dry weight and a total flavonoid content of 18.25 ± 0.001 mg QE/g dry weight. The DPPH radical’s inhibition showed potent antioxidant activity at various concentrations (44.74, 73.86, 119.791, and 120.16% at 200, 400, 600, and 800 μg/mL, respectively), demonstrating the potential of the plant as a natural capping and reducing agent during the green process of nanoparticle formation.

1. Introduction

The rapid progress of industrialization and urbanization has led to the excess discharge of toxic metals into the environment [1,2,3]. Heavy metals are major contaminants in industrial wastewater due to their widespread usage, e.g., in drug manufacturing, battery production, electrolytic processes and metal fabrication etc. [4,5,6]. Exposure to toxic heavy metals such as cadmium and lead can be carcinogenic, even at very low concentrations; therefore, they pose a substantial threat to living organisms [7,8]. Lead (Pb) mostly exists in oxidation states IV and II. Naturally, lead exists in the form of galena, chloride, and sulfide. Lead is considered one of the most widely used in the production of automobile batteries, pigments, piping, plastics, sheathing and many other sectors. Lead compounds have carcinogenic properties that can damage kidney and digestive, nervous, respiratory and immune systems [9].
Different conventional physicochemical treatment technologies have been commonly applied such as ion exchange, electrochemical remediation, chemical precipitation, coagulation-flocculation and membrane filtration [10,11,12]. However, because most of these methods are not feasible, excessively expensive as well as eco-unfriendly, water treatment needs materials that not only have high removal efficiency but are also environmentally friendly. Adsorption using nanoparticles materials is one low-cost alternative method used currently.
Nanomaterials have promising characteristics supporting their applications in many industrial and environmental sectors [13]. Yet, research is currently being undertaken on how plants can reduce metal nanoparticles [14,15]. Because of their unique characteristics, including strong catalytic activity, remarkable effectiveness, robust thermodynamic stability, efficient electron mobility, and expansive specific surface areas, a range of magnetic nanoparticles have been the subject of investigation as catalysts in various organic reactions. Of greater significance, the engineered nanostructures are anticipated to demonstrate exceptional catalytic performance in environmentally friendly reactions. They can be easily separated from the reaction mixture and reused multiple times without experiencing any reduction in their activity. To clean up the environment, green nanotechnology, which has drawn a lot of interest, uses a range of techniques to reduce or eliminate harmful substances. A contemporary approach for making metal nanoparticles is to synthesize them using inactivated plant extracts, plant tissue, exudates, and other elements found in living plants. Green synthesis of nanoparticles uses reagents that are safe, non-toxic, and beneficial to the environment [16,17,18,19,20,21]. As opposed to that, has been demonstrated to be an economical, environmentally responsible substitute for chemical and physical processes, have been quite expensive, the reason behind this study, we present a simple and inexpensive ecologically friendly green synthesis [22]. Magnetite (Fe3O4), a common magnetic iron oxide, with a cubic inverse spinel structure. The flow of electrons between Fe2+ and Fe3+ in the site octahedral gives the complex its distinctive electric and magnetic characteristics [23,24]. There is a lot of potential for nanoparticles in numerous biomedical applications, including cellular therapy, drug delivery, tissue repair, hyperthermia, magnetic resonance imaging (MRI), and magnetofection. This is due to their mechanical properties, distinctive physical, chemical, and thermal as well as the fact that they have the right surface characteristics [25].
Commonly, optimization of the adsorption process involves studying different parameters, changing one independent variable parameter while maintaining all other parameters at a constant level. Usually, traditional methods require extra chemical consumption, more effort and excessive time for studying each parameter individually. Response surface methodology (RSM) can be used to overcome these problems through collection of statistical methods for improving and optimizing progression [26,27,28,29,30]. RSM finds extensive utility within the realms of engineering and structural reliability, particularly when employed in conjunction with finite element modelsRSM relies primarily on various experimental designs such as the central composite design (CCD), the Box–Behnken approach, factorial design, and the Doehlert matrix. Among these, CCD has gained prominence as a recent and favored approach for assessing the impact of diverse parameters. The utilization of this technique has the potential to minimize the quantity of experimental trials essential for evaluating individual study parameters along with their interrelationships. It is also more environmentally friendly as reducing the number of experiments to be undertaken means consumption of less chemicals and materials [31]. The present study aims to provide a green and eco-friendly approach for magnetic Fe3O4 preparation using Fumaria officinalis L. plant. In addition, it aims to study the plant composition and its antioxidant and free radical scavenging effects. Moreover, this study investigates the efficiency of Fe3O4 for adsorption of Pb(II), by optimizing the operational conditions using response surface methodology including central composite design.

2. Materials and Methods

2.1. Chemicals and Experiments in Batch

Reagent-grade chemicals (Perkin Elmer, Waltham, MA, USA) were employed without additional purification. To create working solutions, stock solutions (100 mg/L) were appropriately diluted using deionized water.

2.2. Spectroscopic Measurements

UV-Vis analyses and FT-IR measurements were conducted using a CECIL double beam spectrophotometer (CE9500) and a Perkin Elmer instrument, respectively. The functional groups present in the Fumaria officinalis L. plant extract and the green synthesis of magnetite nanoparticles were assessed using an FTIR spectrophotometer with a resolution of 4 cm−1.

2.3. Instruments for Characterization of Green Synthesized Magnetite NPs

The generated Cubic Fe3O4 NPs surface morphologies, microstructures, and elemental compositions were investigated using energy-dispersive X-ray (Quanta 4500) and field emission scanning electron microscope (FE-SEM). Cubic Fe3O4 nanocomposite’s crystal structures were verified by X-ray diffraction (XRD) analysis (X-Pert PRO) in the 2θ range of 20–80° using Cu-K radiation (0.15406 nm).

2.4. Plant Material

Fumaria officinalis L. (Papaveraceae) was harvested from Trwanesh (Latitude 37°12′10.44″ N and Longitude 43°29′38.5799″ E) Duhok city, Kurdistan Region, Iraq (April 2022). The plant was botanically authenticated in the forest department at the University of Duhok.

2.5. Preparation of Fumaria officinalis L. Aqueous Extract

Ten g of dried powder of the plant mixed to 100 mL distilled water 40 min at 80 °C under reflux conditions. The obtained extract was filtered then filtrate was kept at refrigerator to use further. The obtained aqueous extract was monitored using UV-Vis spectrophotometer to study its phytochemical content.

2.6. Extraction for Antioxidants, Total Phenol, and Flavonoids

The methanolic extract was prepared with a ratio of 1:10 of dry plant materials using 90% methanol solvent. The samples were shaken at 120 rpm for 1 h at 80 °C. It was then filtered with Whatman No. 40 filter paper and transported to a 45 °C rotary evaporator for concentration. After 1 h of concentration, the extract was moved to a laminar hood to gradually evaporate the remaining solvent, yielding a dry extract [32,33].

2.6.1. Total Phenol Content

To quantify the phenolic content of the Fumaria officinalis L. (Papaveraceae) plant, the Folin-Ciocalteu method was used using a modified form [34] with a bit of modification. In summary, 20 L of each specimen’s extract (500 g/mL) was put to test tubes, followed by 10 times diluted Folin-Ciocalteu reagent (100 L in each sample) and 7.5% Na2CO3 (300 L), and finally (1580 L) distilled water. The mixture was briskly agitated before being incubated in the dark for 60 min at room temperature. Using a conventional gallic acid curve (200–800 g/mL, y = 0.0004x + 0.0184, R2 = 0.9964), the phenolics were measured as gallic acid representing GAE/g per dried plant. All measurements were made in triplicate.

2.6.2. Total Flavonoid Content

Flavonoids profile of Fumaria officinalis L. (Papaveraceae) plant was also estimated according to bibi et al. with some modifications [35]. In a concise procedure, 0.1 mL of the sample extract (0.1 g/mL) was combined with the extract (500 µg/mL) in 1.5 mL of 95% methanol within test tubes, and the mixture was allowed to interact for 5 min. Subsequently, 0.1 mL of aluminum chloride (10%) was introduced, followed by 0.1 mL of 1 M CH3COOH. After a lapse of 30 min, 2.8 mL of distilled water (DW) were added to halt the reaction. Absorbance at 410 nm was measured against a blank using a UV-Vis spectrophotometer. The concentration of total flavonoid content in the test samples was estimated using the calibration plot (y = 0.0033x + 0.2604, R2 = 0.9693) and presented as mg of quercetin equivalence (QE)/g of crude plant (200–400 g/mL). All replicates were carried out in triplicate.

2.7. Evaluation of Antioxidant Activity

The hydrogen atom and electron donation capabilities of the Fumaria officinalis L. (Papaveraceae) plant extract were evaluated using the decolorization of the purple-hued ethanol solution of DPPH (2,2-diphenyl-1-picrylhydrazyl). This spectrophotometric test was carried out utilizing the stable radical DPPH as a reagent, as described elsewhere [34,36]. In brief, 1 mL of each sample (200, 400, 800, and 1600 g/mL) was added to 1 mL of freshly made 0.2 mmol/L DPPH ethanolic solution in the dark. After a 30-min incubation period at room temperature, the absorbance was assessed at 517 nm. As a positive control, BHT and ascorbic acid were utilized. The samples’ radical-scavenging activities were estimated as inhibition ratio using Equation (1) [37]:
I% = (A blank − A sample/A blank) × 100
Here, A blank signifies the absorbance of the control, encompassing all reagents except the test compound, while A sample denotes the absorbance of the test compounds. To determine the extract concentration leading to 50% inhibition (IC50), the inhibition percentages of all samples at various concentrations were plotted and analyzed.

2.8. Green Synthesis of Magnetite NPs Using Fumaria officinalis L.

In a 100 mL conical flask, 0.5 g iron (II) chloride and 1 g iron (III) chloride were mixed with 50 mL extract, pH 10 at 80 °C under stirring. Stirring continued until the production of a precipitate was seen by a change in the color of the solution from brown to black. Precipitate was separated using magnet and then calcined at 400 °C. Impurities were removed by washing with hot distillate water. The chemical interaction between Fumaria officinalis L. plant biomolecules and salt precursors to synthesize the green NPs was proposed as ET-HSAB mechanism reactive proton of OH phenolic group, Scheme 1.

2.9. In Vitro Biological (Antibacterial) Activity of Fumaria officinalis L. and Green

The antibacterial abilities of Fumaria officinalis L. and the green synthesized Fe3O4 against standard bacterial strains including Escherichia Coli (ATCC TM 51813), Salmonella typhimurium (ATCC 13311), Staphylococcus aureas (ATCC 25923), Pseudomonas aeruginosa (ATCC 27853) and using filter paper disks which saturated with the sample’s suspensions with different concentrations (5000, 10,000, 50,000, 100,000) μg/mL DW for 24 h at 37 °C. The disks treated with samples and distilled water (negative control) were placed directly onto the plates, then incubation for 48 h at 37 °C was carried out. After one or two days, the zones of inhibition were measured.

2.10. Experimental and Establishment of RSM

A batch study was accomplished using aqueous solutions of Pb(II) in contact with eco-friendly synthesized Fe3O4 nanoparticles mediated by Fumaria officinalis L. plant extract. Adsorption experiments were carried out in 100 mL volumetric flasks at concentrations 10–50 mg/L in contact with 10 mg of the Fe3O4 nanoparticles adsorbent. The suspensions were shaken at different temperatures 20–40 °C with an agitation speed fixed at 250 rpm, for time periods of 20–60 min and within a pH range 3–7. The pH of the solutions was adjusted through the utilization of 0.1 N HCl and 0.1 N NaOH. Following this, the suspensions underwent centrifugation for a duration of 10 min at 8000 rpm, subsequently being filtered using syringe and filter disks with a pore size of 0.20 µm. The concentration of residual heavy metal present in the solutions was quantified utilizing atomic absorption spectrometry (AAS) with the Shimadzu AAS AA-700 series, 6000 VA, and a wavelength range of 185–900 nm. The efficiency of removal (R%) and the quantity of adsorbed heavy metal (qe) were both computed employing Equations (2) and (3), respectively.
R % = C o C e C o × 100
q e = C o C e × V m
where Co and Ce are the initial and equilibrium heavy metal concentrations (mg/L), respectively. Qe is the adsorption capacity (mg/g). V is the volume of adsorbate solution and m (g) is the amount of adsorbent used [38].
To optimize the adsorption process, an experimental design was conducted, incorporating specific independent parameters such as the initial concentration of heavy metal, contact time, pH, and temperature. The optimization was executed using a randomized approach, with the goal of mitigating the impact of uncontrollable factors. This was achieved through the application of Central Composite Design (CCD) within Design Expert software version 11.0.2 (trial version). The five-levels are specifically highest, high, medium, low, and lowest coded as +α, +1, 0, −1, and −α, respectively [10]. The low (−1) and high (+1) are selected levels in this study, while the highest, medium, and lowest levels (+α, 0 and −α), respectively, are suggested by design. The CCD for the independent variables typically incorporates axial points, factorial points, and replicates at the center points. The total number of experiments is determined using Equation (4):
N = 2 k + 2 k + c
where N is the number of runs, k is the number of independent variables, and c is the number of center points. The response (qe) is determined using the corresponding regression, as given by Equation (5):
y = β o + i = 1 k β i x i + i = 1 k . j = i + 1 k β i j x i x j + i = 1 k β i i x i 2
In the equation, y represents the response variable (qe), while k denotes the count of independent variables. The variables xi and xj represent specific independent variables that are established for each experimental run. The coefficients βo, βi, βij, and βii correspond to the model constant, linear coefficient, interaction coefficient, and quadratic coefficient, respectively [39]. Design Expert software 11.0.2 (trial version) can be applied for the purpose of regression and graphical analysis of the equations obtained by the experimental data. The statistical significance of the model’s variables can be assessed through the utilization of analysis of variance (ANOVA). The lack of fit, F-values (Fisher’s variation ratio), coefficient of determination indicating the goodness of fit, and the probability level (p < 0.05) are all indicative parameters used in this evaluation.

2.11. Adsorption Isotherms

Several isotherm models were applied in this study to explain the experimental data. The Langmuir isotherm is one of the adsorption equilibrium models and the main assumption of this model is the formation of a monolayer (homogenous) of adsorbate species on the surface of the adsorbent [38]. The isotherm equation of generalized linear form is expressed in Equation (6):
C e q e = 1 q m a x k L + 1 q m a x C e
Here, Ce (mg/L) represents the equilibrium concentration, while qe and qmax (mg/g) stand for the adsorption capacity at equilibrium and the maximum capacity, respectively. KL represents the Langmuir constant (L/mg), which indicates the energy associated with adsorption. The values of both KL and qmax can be derived from the slope and intercept of the linear plot obtained by plotting Ce/qe against Ce, respectively. The coefficient of determination (R2) value of the plot is important to evaluate the goodness of fit of the model (or not as the case may be). The Langmuir parameters are essential characteristics used to predict affinity between adsorbent and adsorbate and the application of the dimensionless separation factor (RL) [40], which is represented in Equation (7):
R L = 1 1 + k L C o
The value of RL can reveal the type of isotherm in the range of (0–1). It is favorable if 0 < RL < 1, unfavorable if RL > 1, and irreversible if RL = 0.
The Freundlich adsorption isotherm is widely valid for the characteristics of physical adsorption and multilayer adsorption on a heterogeneous surface of an adsorbent with non-uniform energy distribution. The linearized form of the Freundlich isotherm can be expressed by Equation (8):
L n   q e = L n   K f + 1 n L n   C e
where qe (mg/g) and Ce (mg/L) are the adsorption capacity and concentration of adsorbate in the solution at equilibrium, respectively. Kf (L/g) is a constant that shows the adsorption capacity and 1/n is an empirical parameter that shows the adsorption intensity or surface heterogeneity. Generally, a value of 1/n (0–1) indicates a favorable adsorption process, and as the value of 1/n becomes closer to zero the system becomes more heterogeneous. A plot of ln qe against ln Ce gives a straight line with an intercept of ln Kf and a slope of 1/n [41].

2.12. Adsorption Kinetics

Kinetic parameters are important to control the adsorption process based on physical and chemical characteristics of both adsorbate and adsorbent. Throughout the adsorption process, the adsorbate was transferred from the aqueous solution toward the adsorbent surface. Following a variety of steps, it can determine the rate of adsorption [38]. The pseudo-first-order (1st) is frequently applied to study adsorption in a liquid–solid system. The linearized mathematical form of the model is generally expressed by Equation (9):
l n q e q t = ln q e k 1 t
where qe and qt (mg/g) are the amount of uptake at equilibrium and time (t), respectively. K1 (min−1) is a pseudo-first-order rate constant for the adsorption process. The value of k1 and qe can be calculated from the slope and intercept, respectively, by plotting ln(qe − qt) vs. t time (min). The regression coefficient of the linear plot can indicate good or poor fitting to the pseudo-first-order model [42].
The pseudo-second-order kinetic model posits that the activation sites on the adsorbent surface and the quantity of adsorbate present in the solution work in tandem to elucidate the kinetics of the process [43]. The linearized mathematical model of pseudo-second-order kinetics is expressed as in Equation (10):
t q t = 1 k 2 q e 2 + 1 q e t
In this context, qt and qe (mg/g) represent the amounts adsorbed at a specific time (min) and at equilibrium, respectively. The rate constant of the pseudo-second-order kinetic model is denoted as k2 (g/mg/min).

3. Results and Discussion

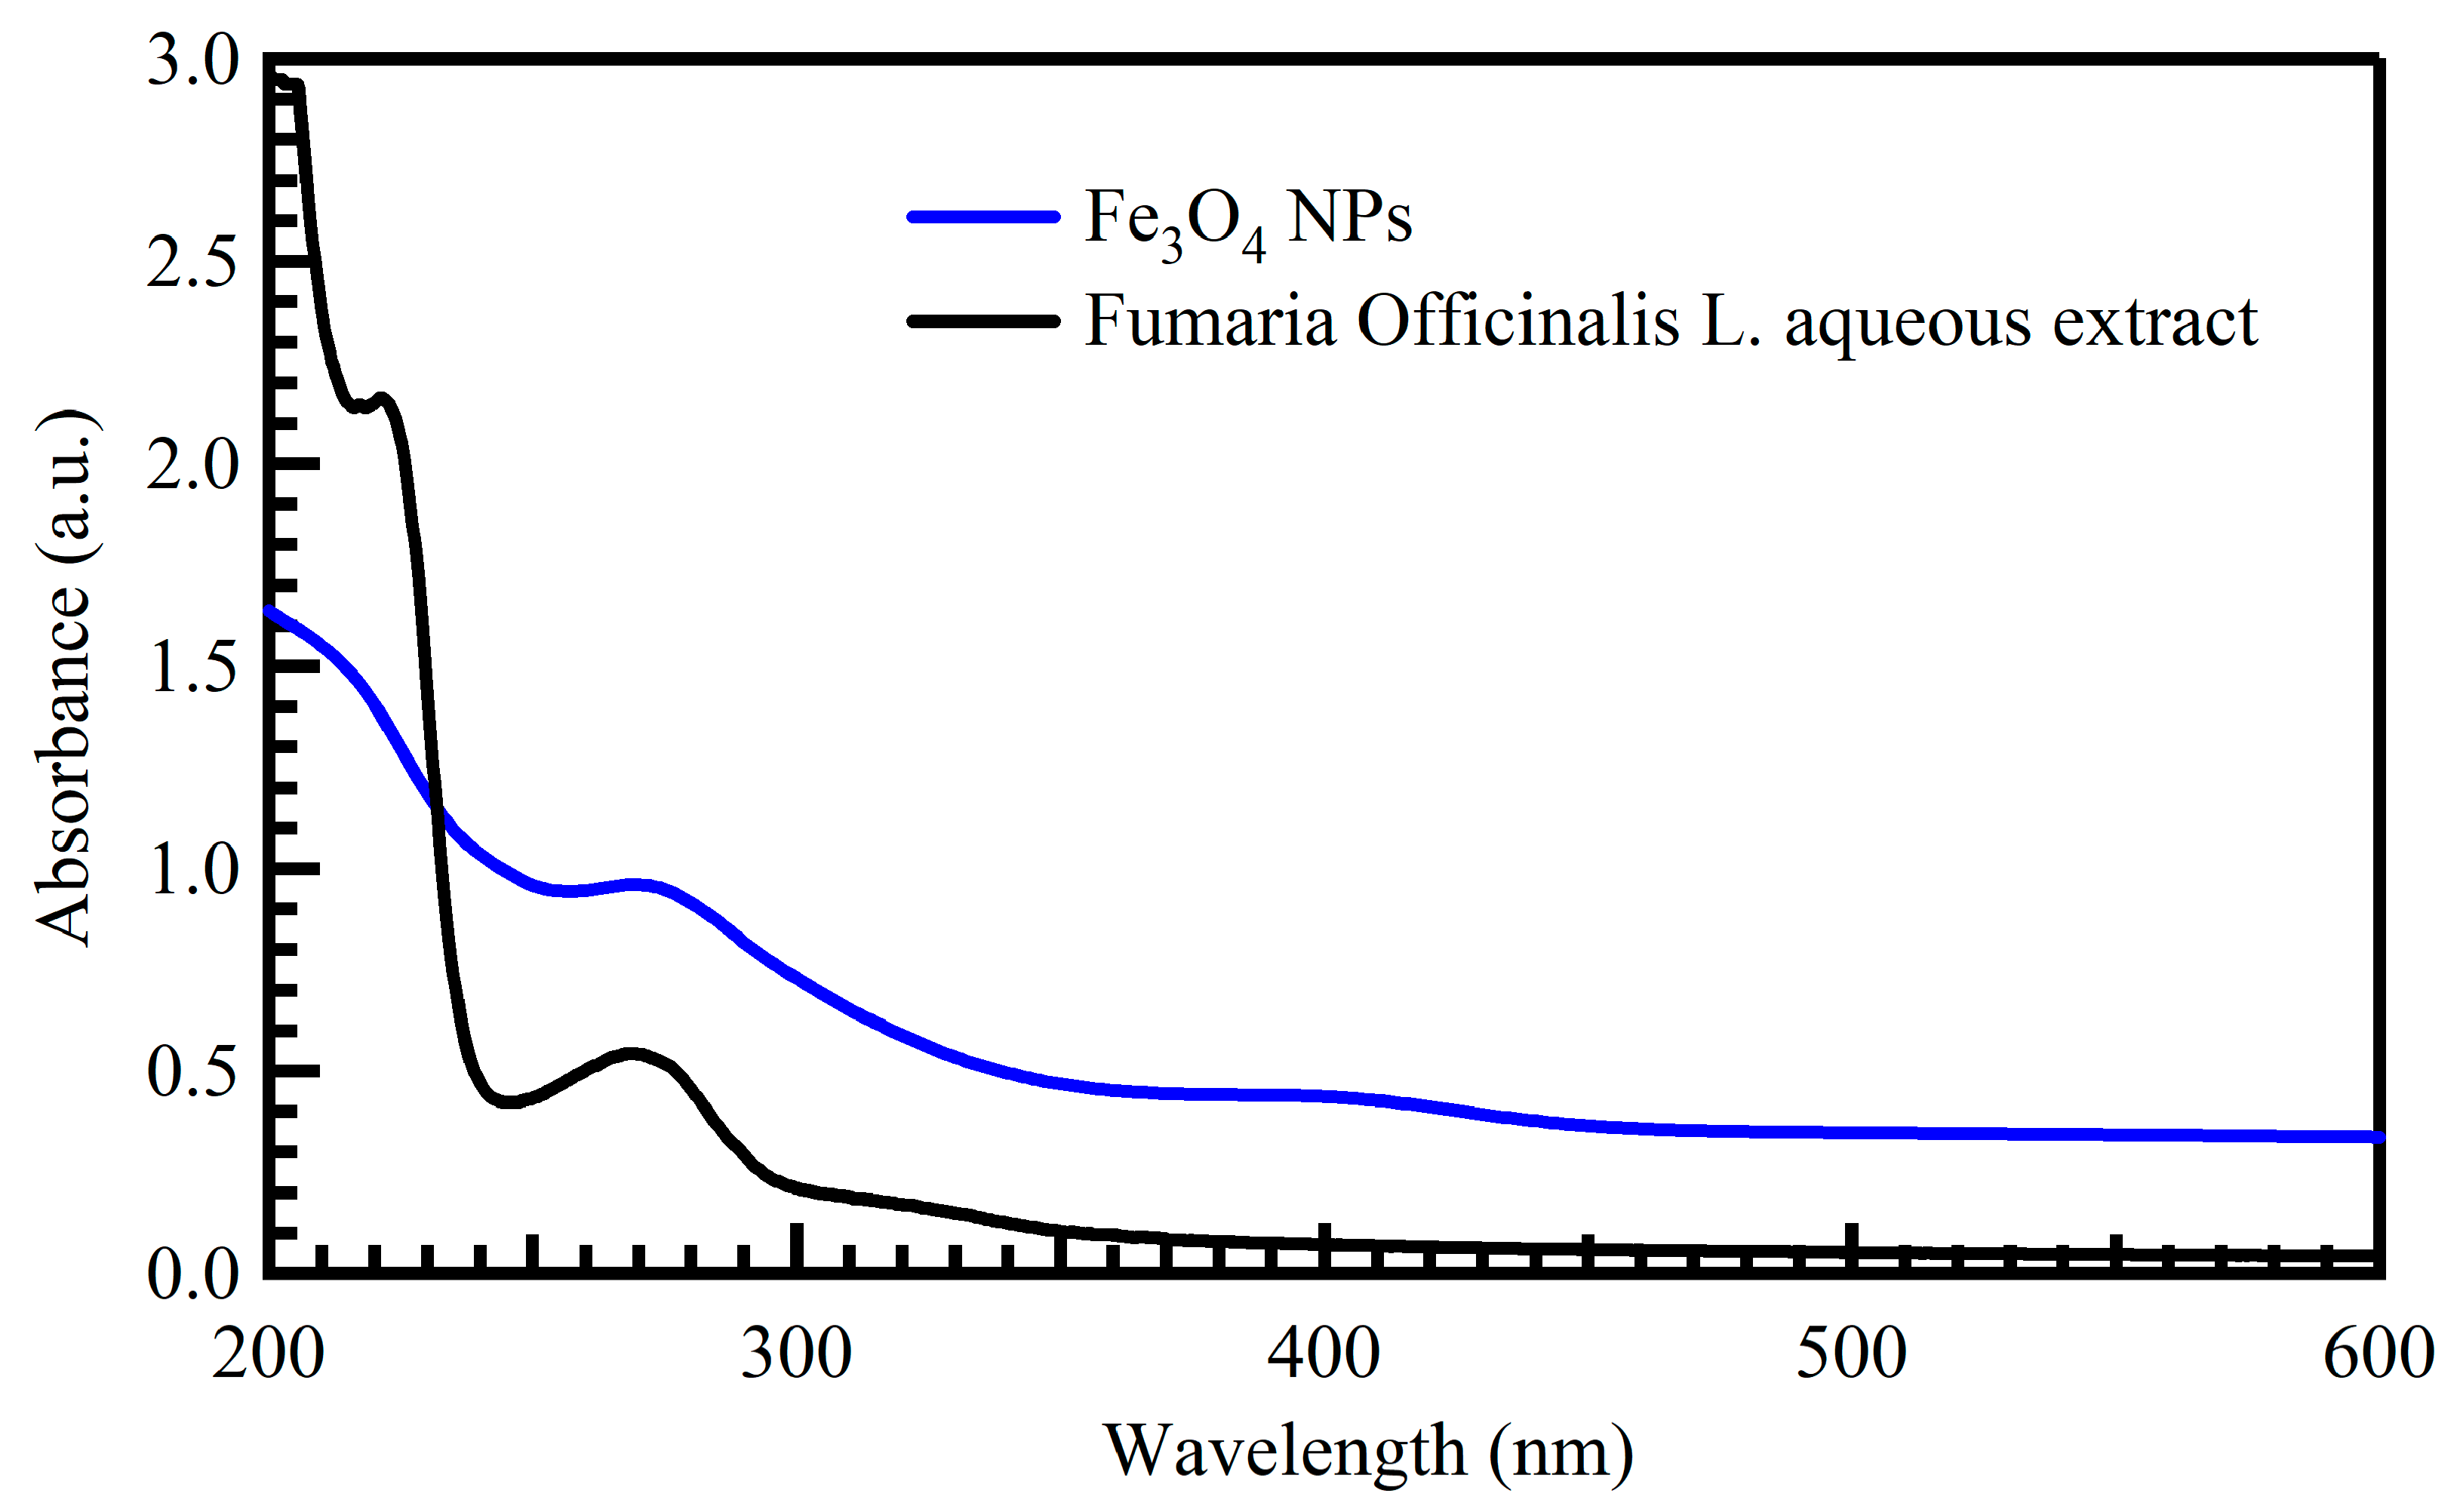
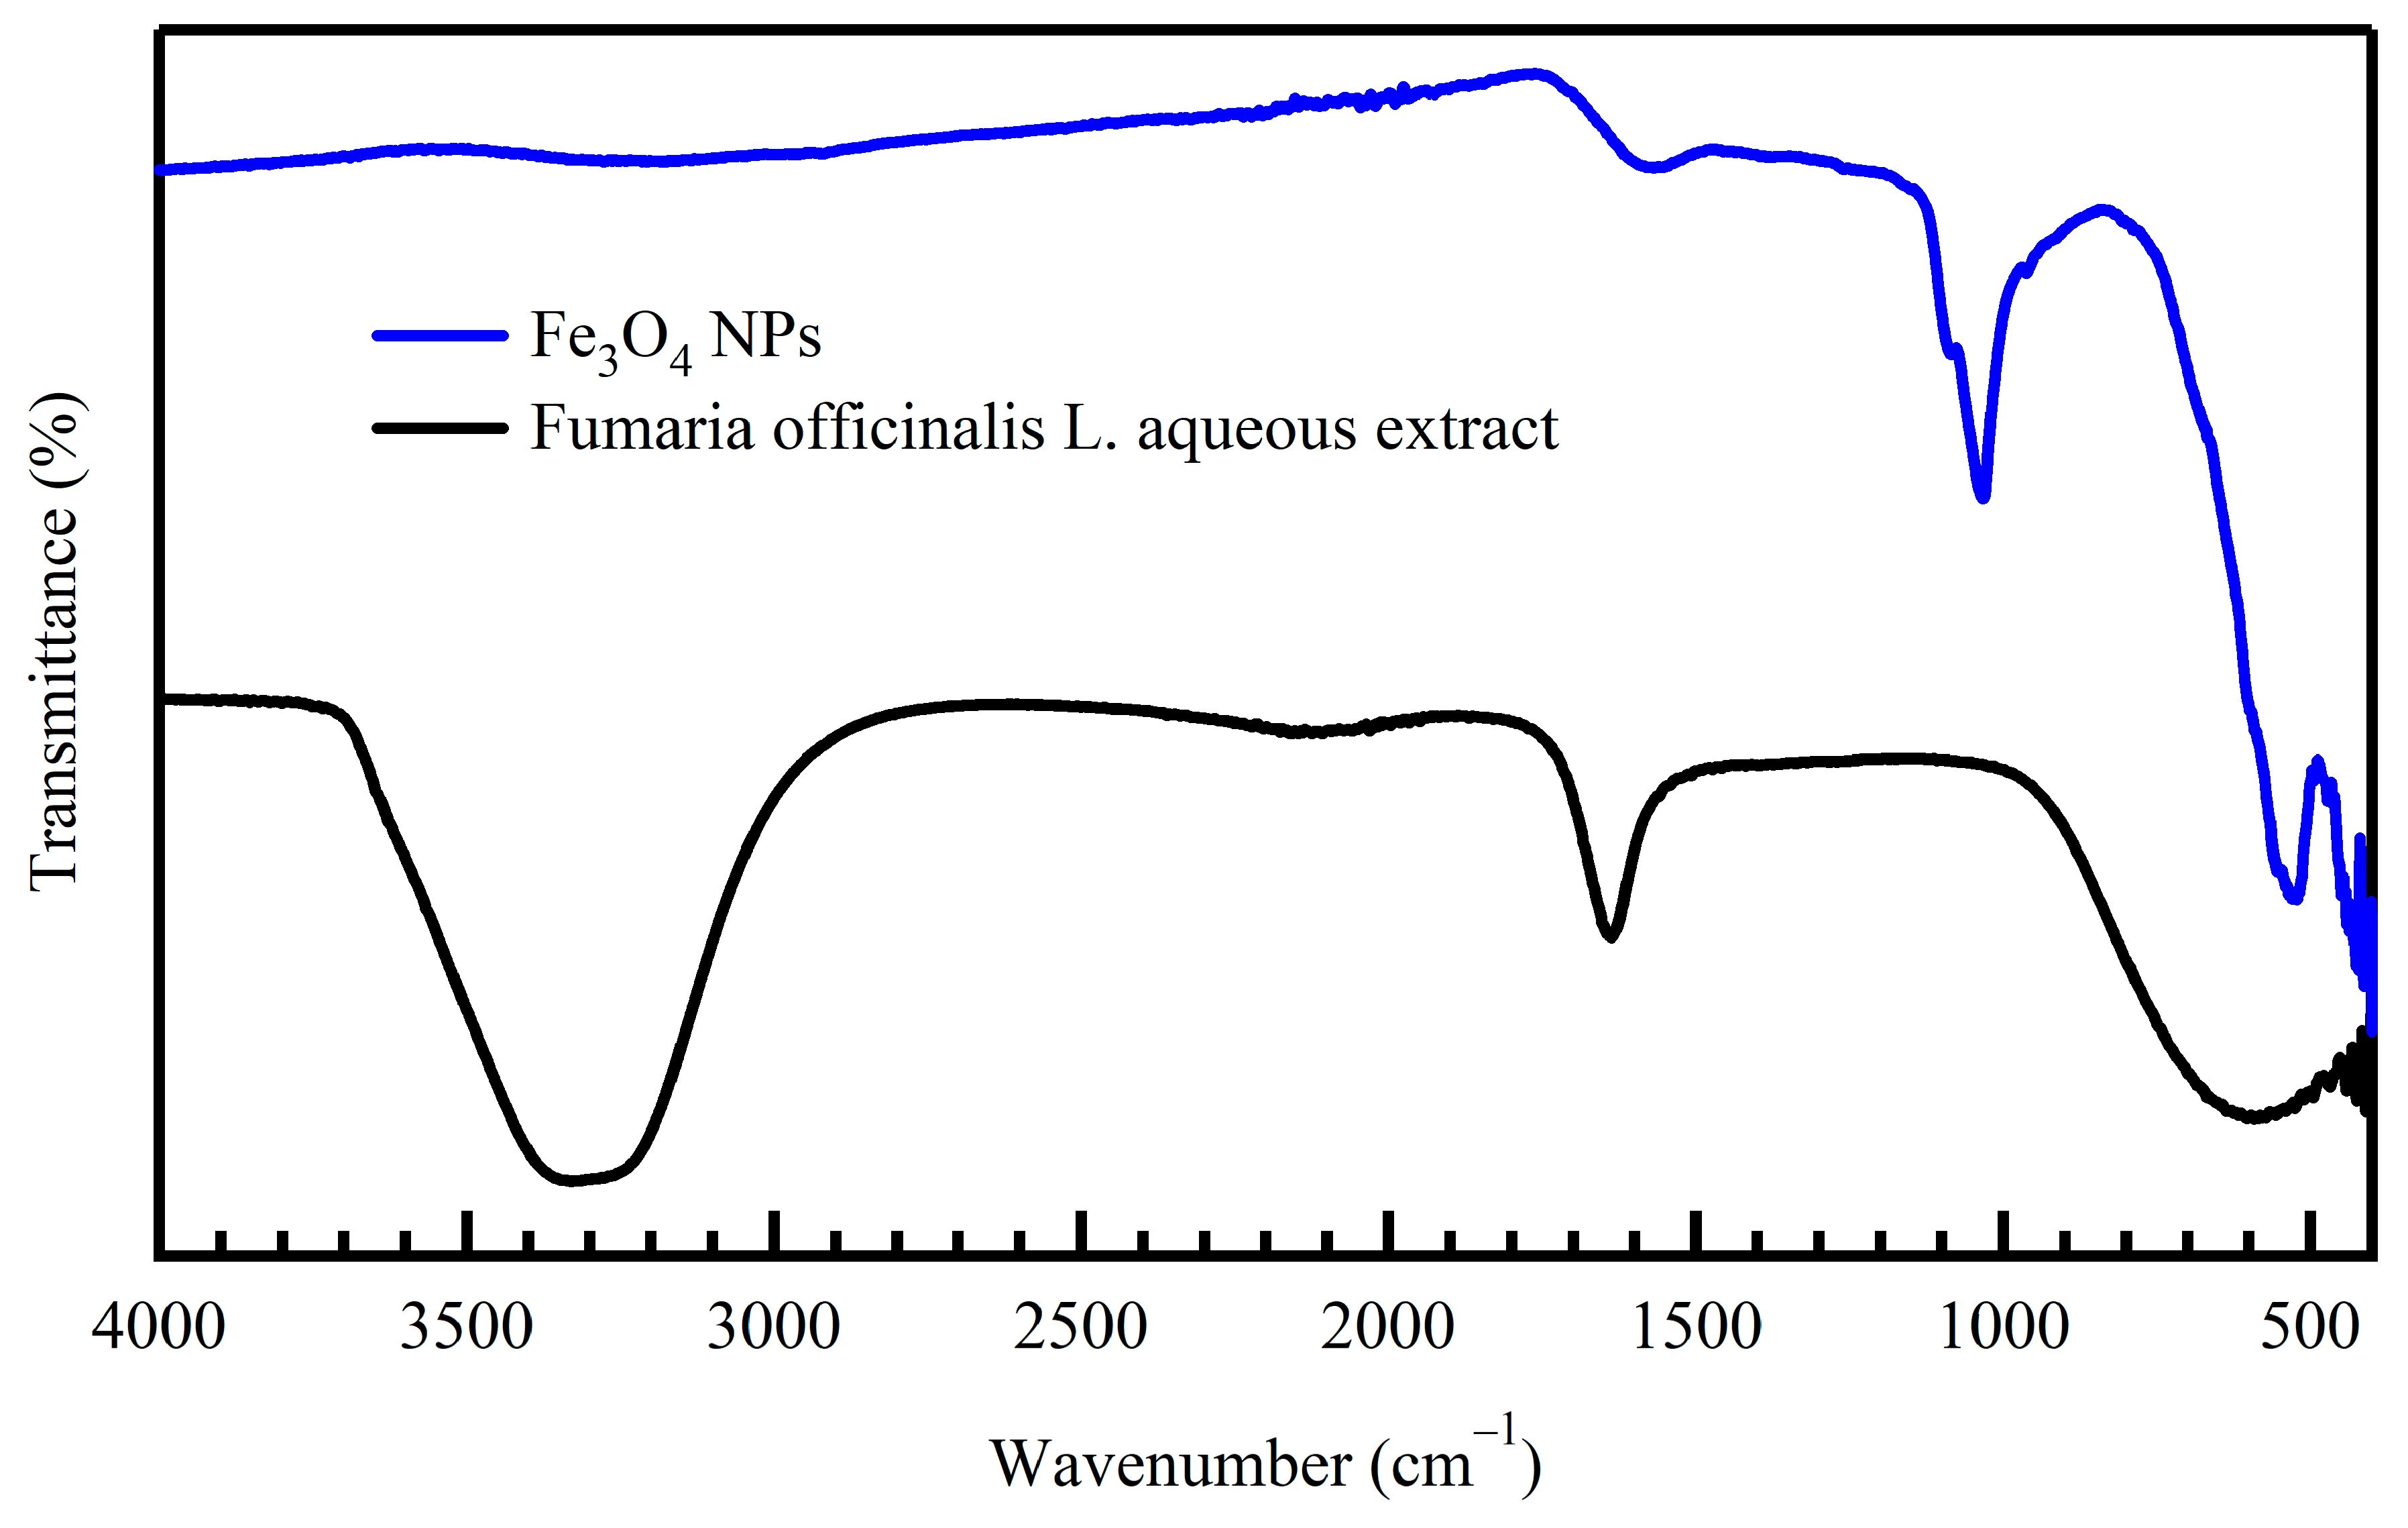
3.1. Spectroscopic Study of Fumaria officinalis L. Plant Extract and Green NPs

According to Figure 1, the cinnamoyl and benzoyl phenolic systems were assigned UV-Vis signals at 275 nm (bond I) and 225 nm (bond). These signals are related to the π → π* transitions, which show the presence of phenolics as an antioxidant free radical source for green nanoparticle synthesis. The results at 262 and 450 nm verified the green magnetite NPs produced with Fumaria officinalis L. extract.
FTIR spectra of Fumaria officinalis L. extract and green synthesized magnetite NPs. Were investigated to determine the functional groups in charge of turning metal ions into nanostructures. In both spectra, a prominent wide peak within the ranges of 3050–2800 cm−1 and 3600–3300 cm−1 can be associated with the stretching of C-H bonds in CH2 groups and OH groups of phenolic compounds, as visually represented in Figure 2. The existence of aromatic C=O bonds within phenolic compounds is validated by the signal observed at 1598.17 cm−1, while the presence of carboxylic compounds is confirmed by the presence of two distinct bands at 1116 and 1239 cm−1, which correspond to the vibrational stretching of C=O bonds and the stretching of C-O bonds, respectively. Functional groups from phytochemicals adsorbed on the surface of green nanostructures operate as capping and stabilizing agents, boosting the synergistic effects and catalytic antioxidant activity of NCs. The peak at 1015 cm−1 is connected to O=Fe-O-Fe=O, indicating the green synthesis Fe3O4. Fe-O is associated with the band at 796 cm−1. However, at 448 cm−1, there is a Fe=O vibration band. All these data confirmed that Salvia multicaulis plant extract is a rich source of phytochemicals.

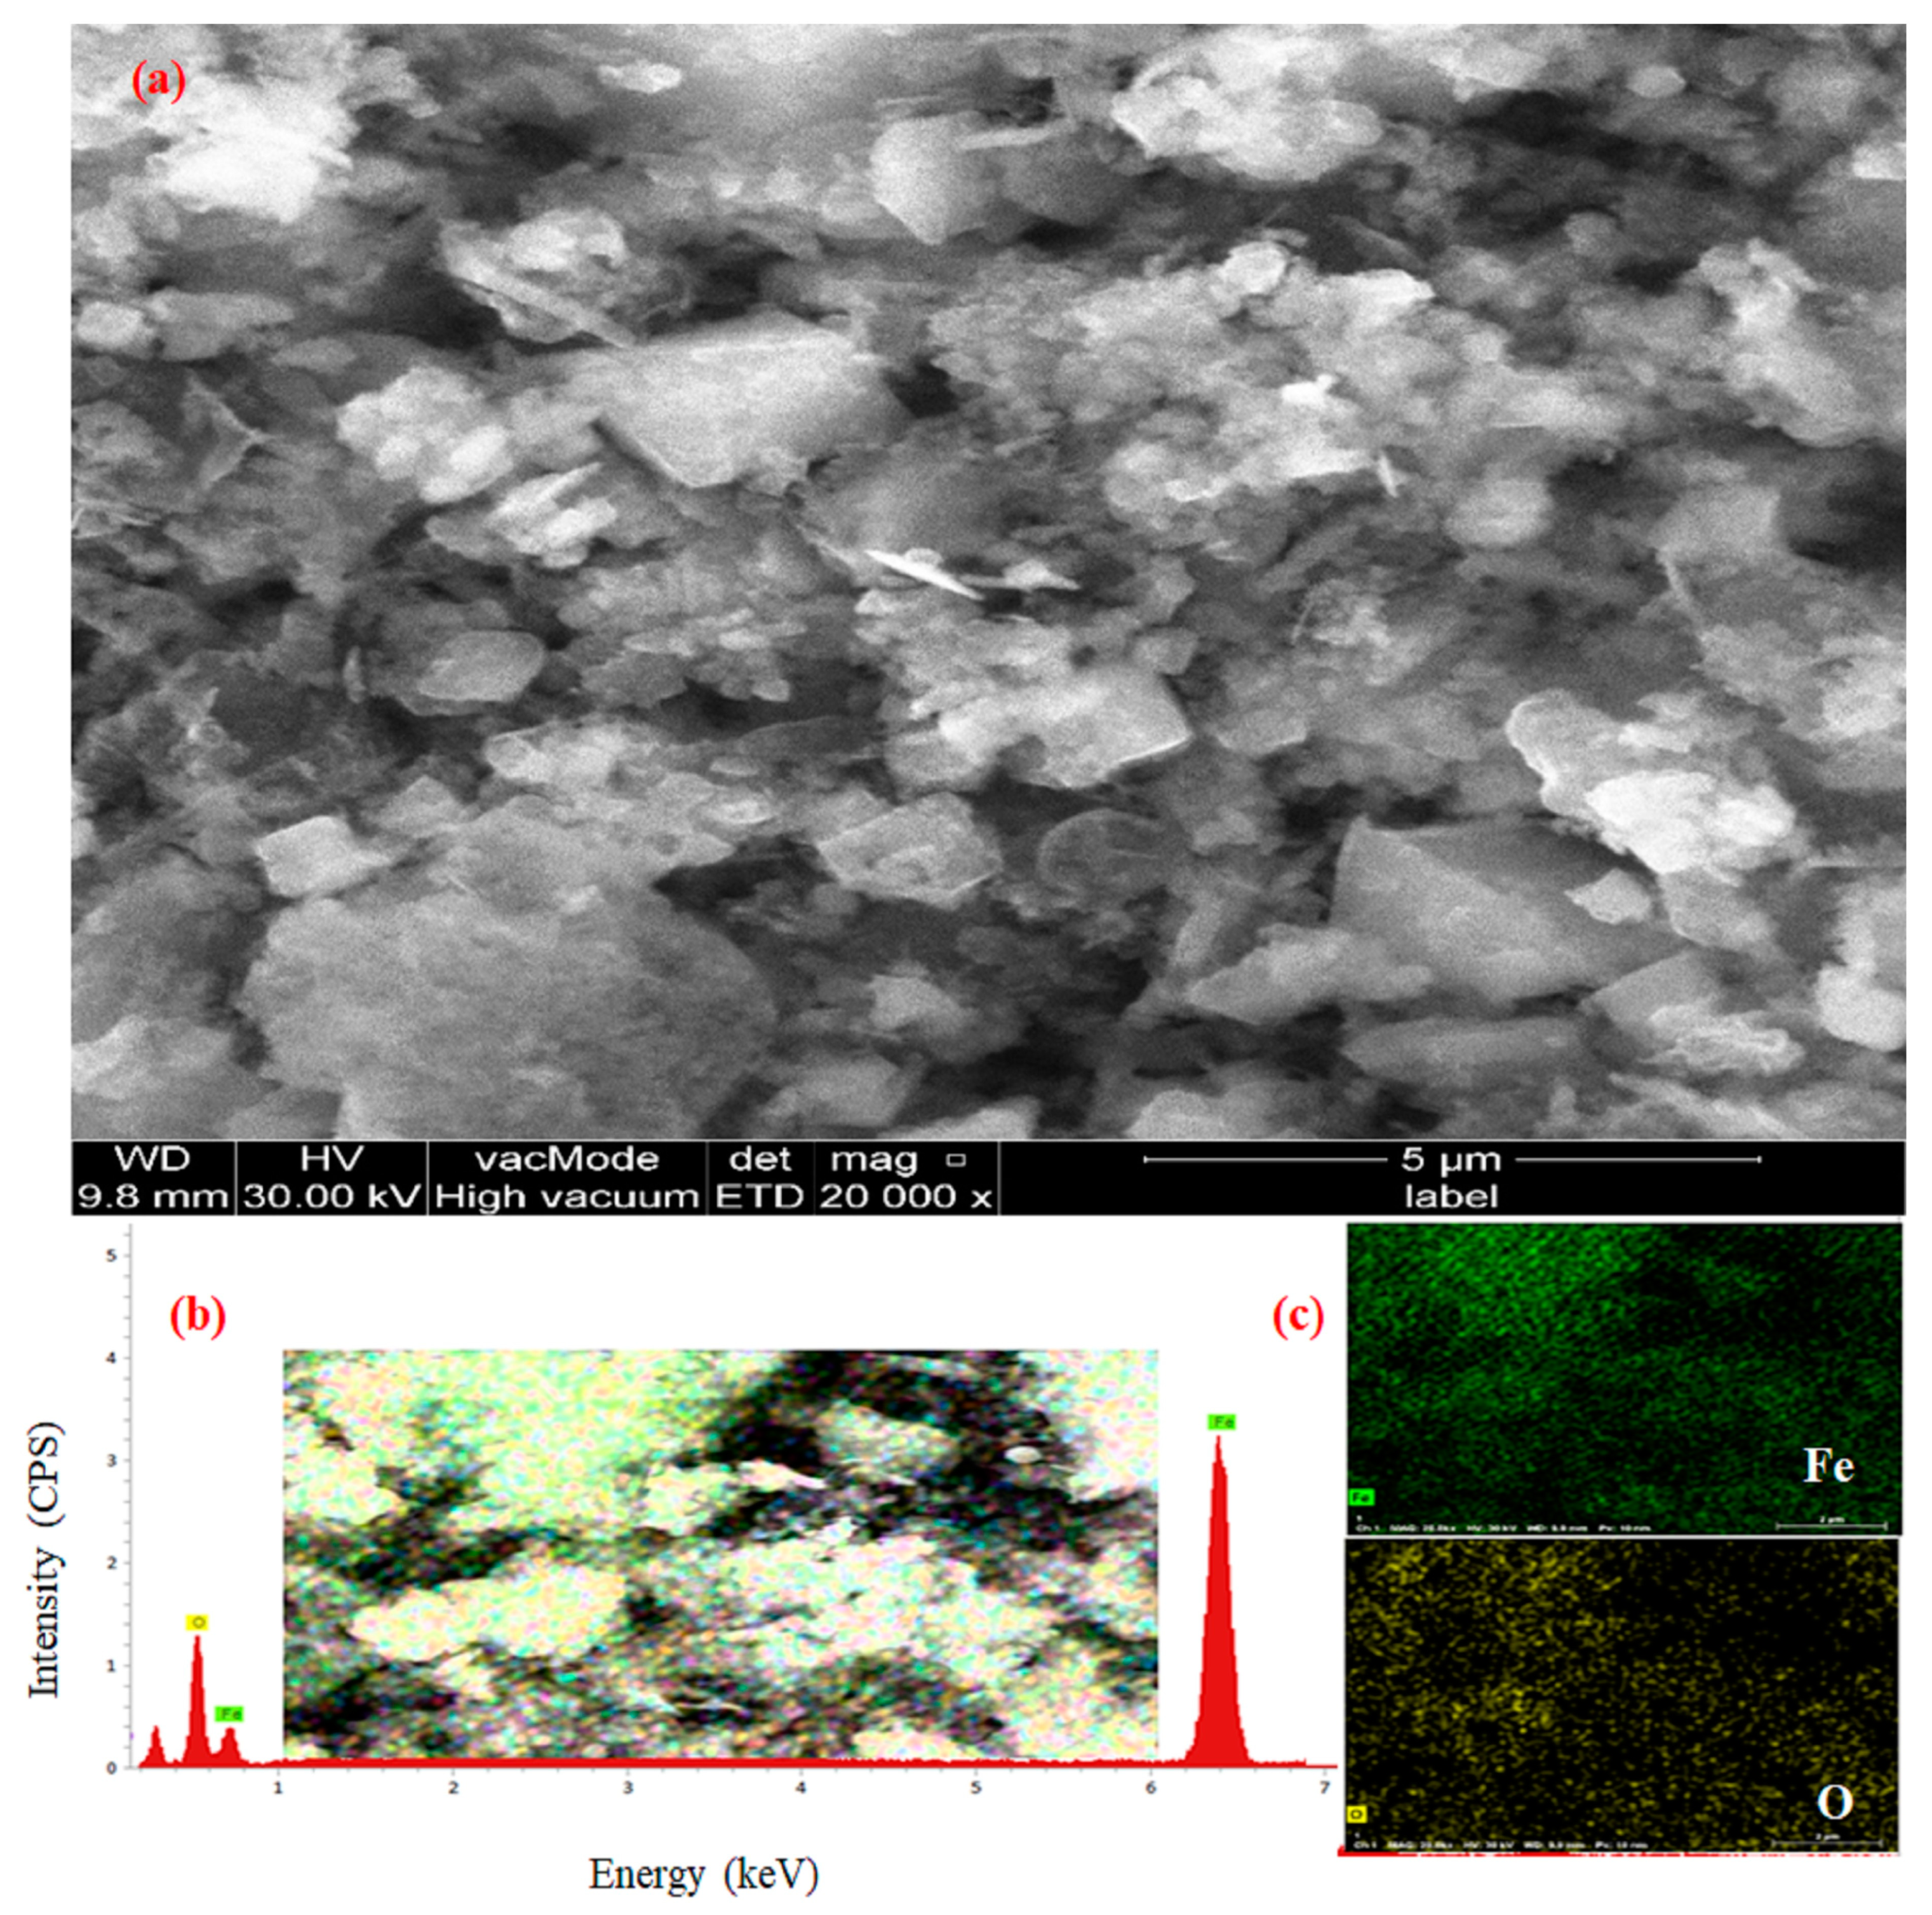
3.2. Characterization of Green Synthesized Magnetite NPs

FE-SEM, EDX, XRD, and elemental mapping analysis were performed on green synthesized magnetite NPs. The surface morphology of eco-friendly synthesized magnetite NPs has been investigated using the field emission scanning electron microscope FE-SEM, Figure 3, at different magnifications. FE-SEM micrographs of green synthesized magnetite NPs are shown in Figure 3a. The cubic shape of the nanomaterials was clearly shown in the micrograph with some agglomerations. Electron dispersive spectroscopy and elemental mapping were applied for further confirmation concerning the biosynthesis of Fe3O4 NPs. In Figure 3b,c, the EDS analysis and elemental mapping clearly illustrate the existence of Fe and O elements, serving as evidence for the successful creation of the nanocomposite through the environmentally friendly synthesis method.

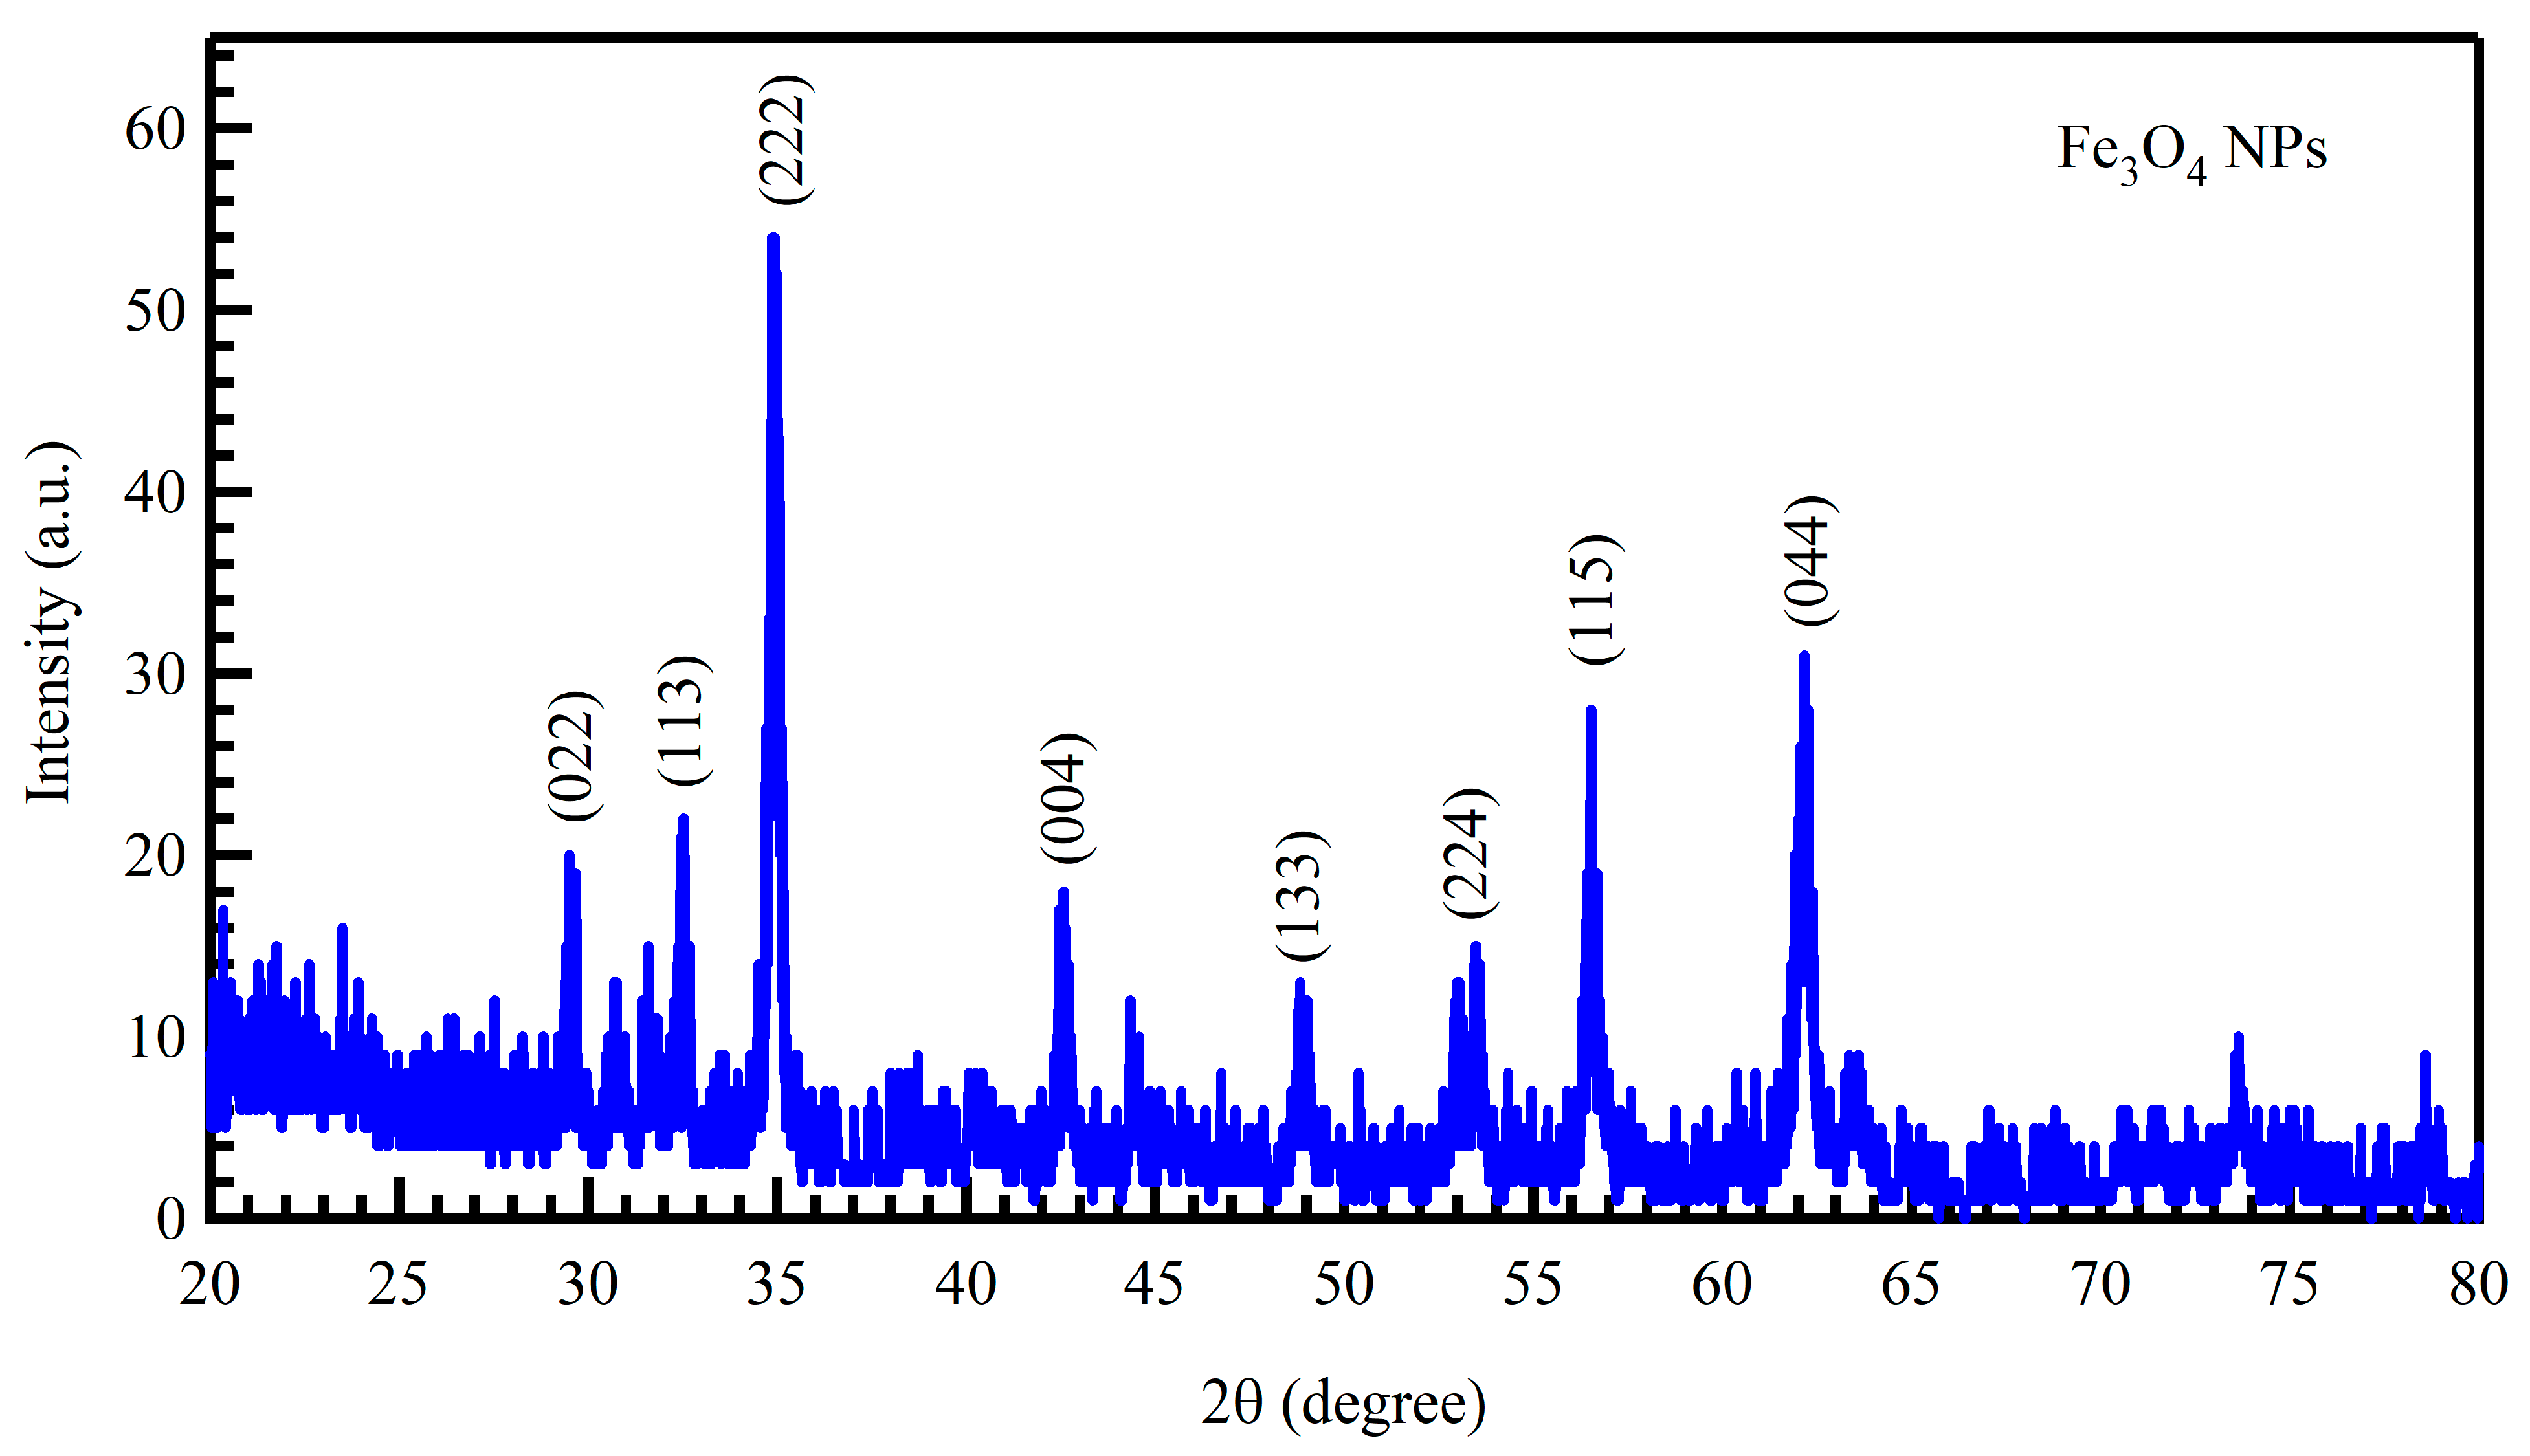
3.3. X-ray Diffraction

Figure 4 displays the XRD pattern of the green synthetic magnetite NPs, which includes all peaks connected to the NPs’ purity and crystalline planes. By calculating the full width at half maximum (FWHM) of the 2θ characteristic peaks, the signals at 29.54°, 32.53°, 34.92°, 42.56°, 48.87°, 53.56°, 56.51°, and 62.17° are assigned for (022), (113), (222), (004), (133), (224), (115), and (044) planes of the crystal lattice of Fe3O4 and JCPDS card No. 98-018-3976 for calculating the sample’s crystallite sizes using the well-known Debye-Scherer equation for the suggested Fe3O4 NPs.
The average crystallite size of the Fe3O4 NPs, which was determined using Debye-Scherrer’s Equation (11), is around 23 nm.
D = k λ β   c o s θ
In the given context, D represents the crystal size, λ symbolizes the wavelength of the X-ray radiation (λ = 1.540598 Å for Cu), k denotes the shape factor conventionally set at 0.89, β represents the full width at half maximum (FWHM), and θ corresponds to the Bragg diffraction angle [44].
The suggested approach hinges on readily available plant sources, making it environmentally friendly and sustainable by minimizing chemical usage. Furthermore, the method is characterized by its simplicity and affordability. Consequently, this study stands out as an economically favorable option for synthesizing Fe3O4 nanoparticles.

3.4. Polyphenol Profile of Fumaria officinalis L. (Papaveraceae) Plant

In vitro assay determining total phenol content, FCR (Folin–Ciocalteu Reagent), involves phosphotungstate and phosphomolybdate. As indicated in Table 1, LC/MS analysis revealed that Fumaria species contain phenolic acids and high amounts of flavonoids, with rutin and quercitrin as the main compounds. The Fumaria officinalis L. (Papaveraceae) plant is an excellent source of total phenol and flavonoid content (596.5 mg GAE/g dry wt) and (18.25 mg QE/g dry wt), respectively [34].
The Fumaria officinalis L. (Papaveraceae) plant contains several polyphenols and flavonoids that may be responsible for its antioxidant and free radical scavenging effects. It is easy to see that a plant’s polyphenol profile correlates linearly with total polyphenol content (TPC) and positively with the methanolic extract’s potent antioxidant activity [34].

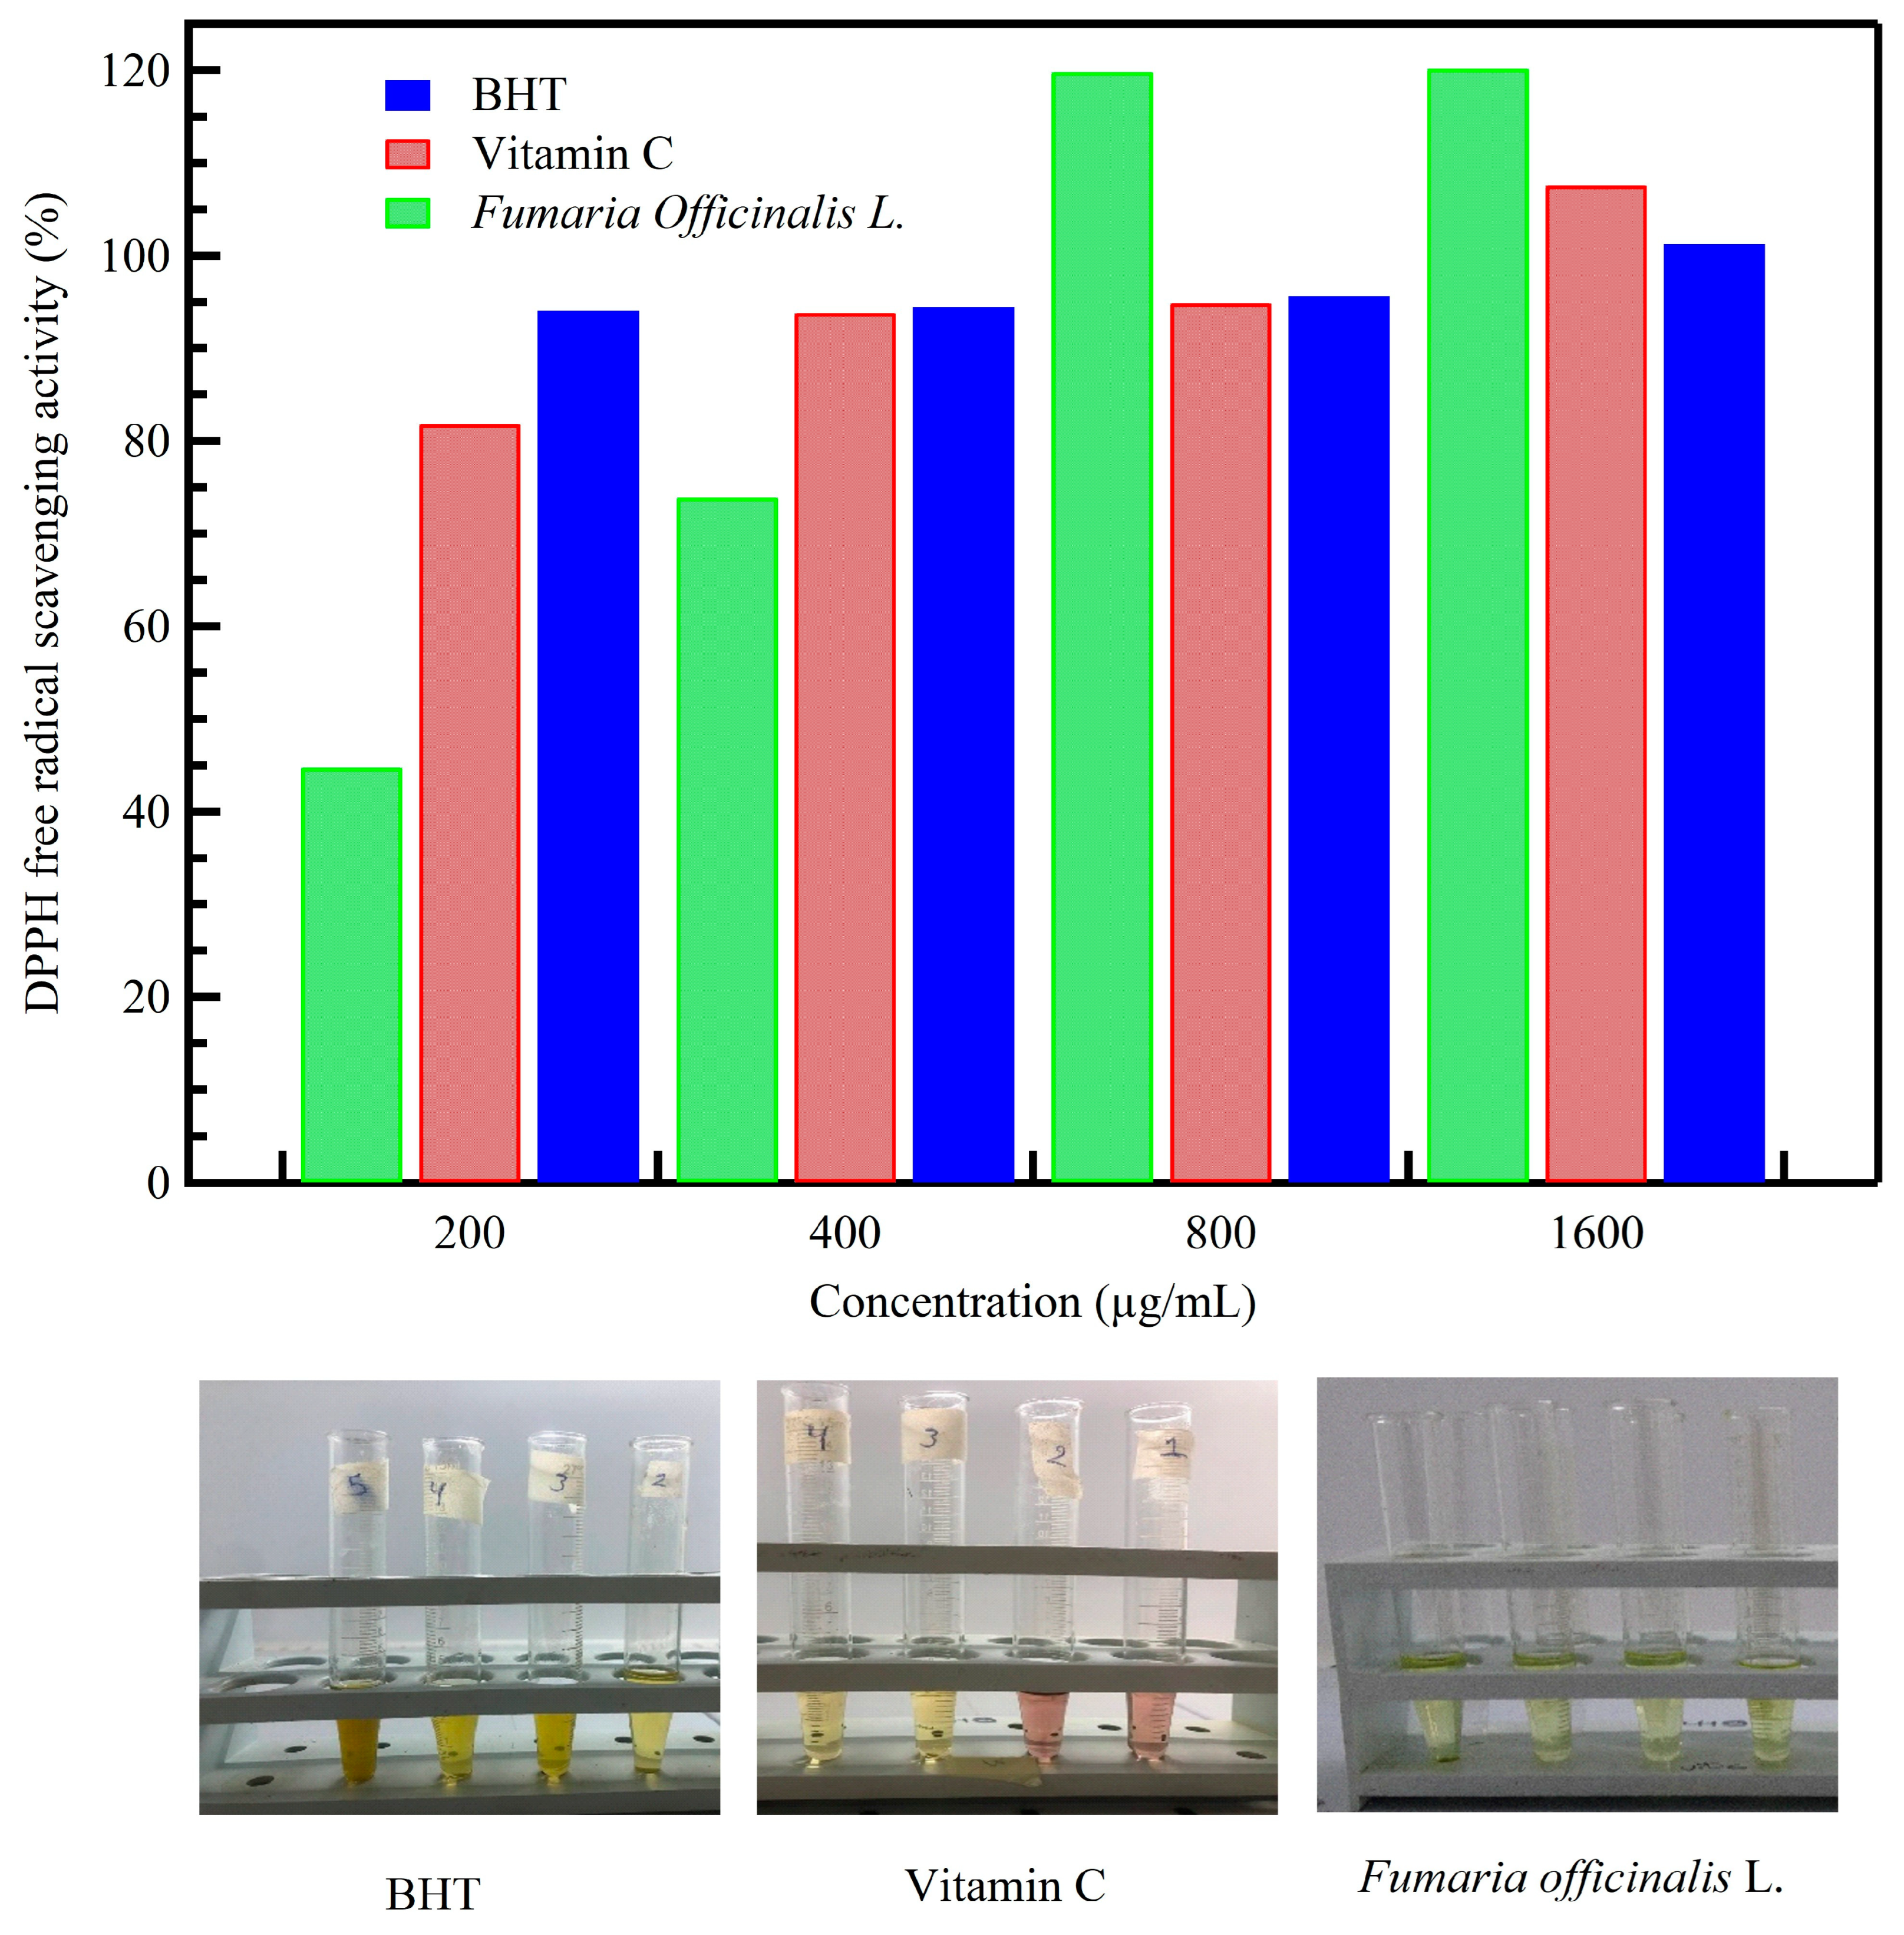
3.5. Antioxidant Activity Fumaria officinalis L. (Papaveraceae) Plant Extract

When a plant extract interacts with DPPH radicals the yellow color DPPHH is produced. Table 2 and Figure 5 revealed RSA% and IC50 of Fumaria officinalis L. plant extract compared to BHT and vitamin C as positive controls. Antioxidant activity of the Fumaria officinalis L. plant extract showed remarkable scavenging activities with IC50 1.136, which is higher than ascorbic acid 18.4 and BHT 3.1 at the same concentrations. Indicative of the positive correlations between antioxidant capacity and phenolic content, polyphenolics are eminent groups of secondary metabolites recognized as natural antioxidants [45].

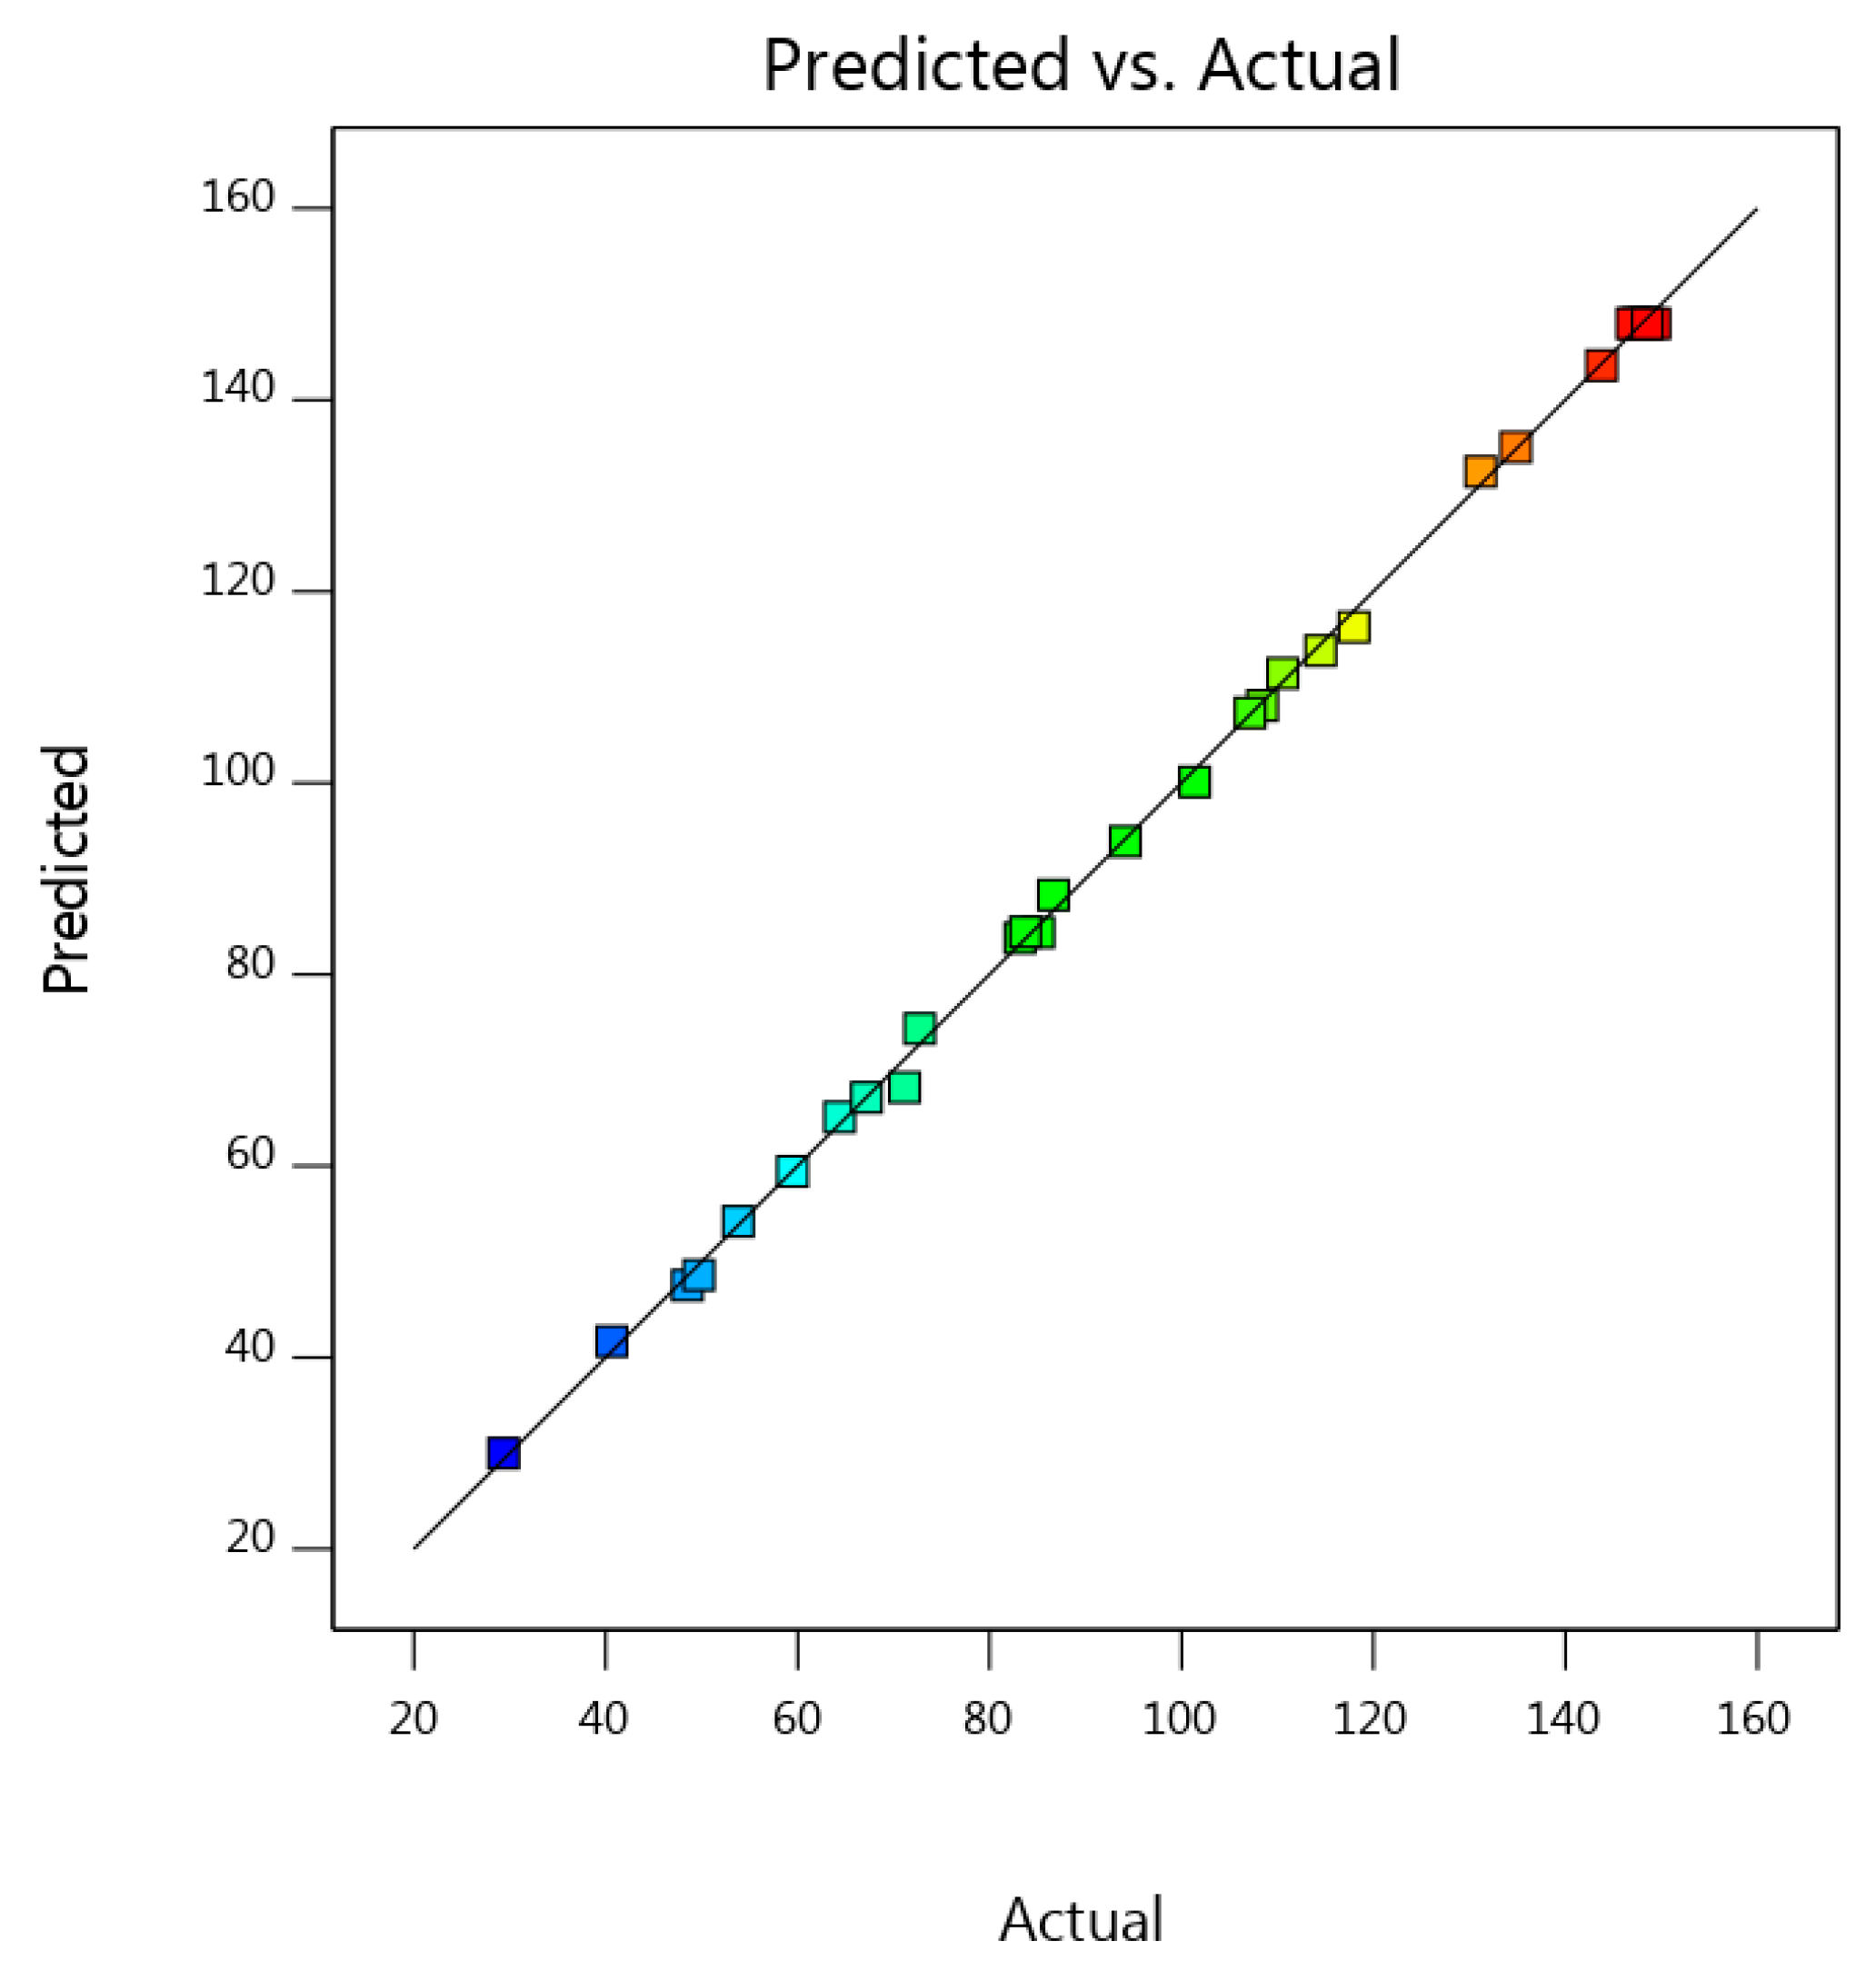
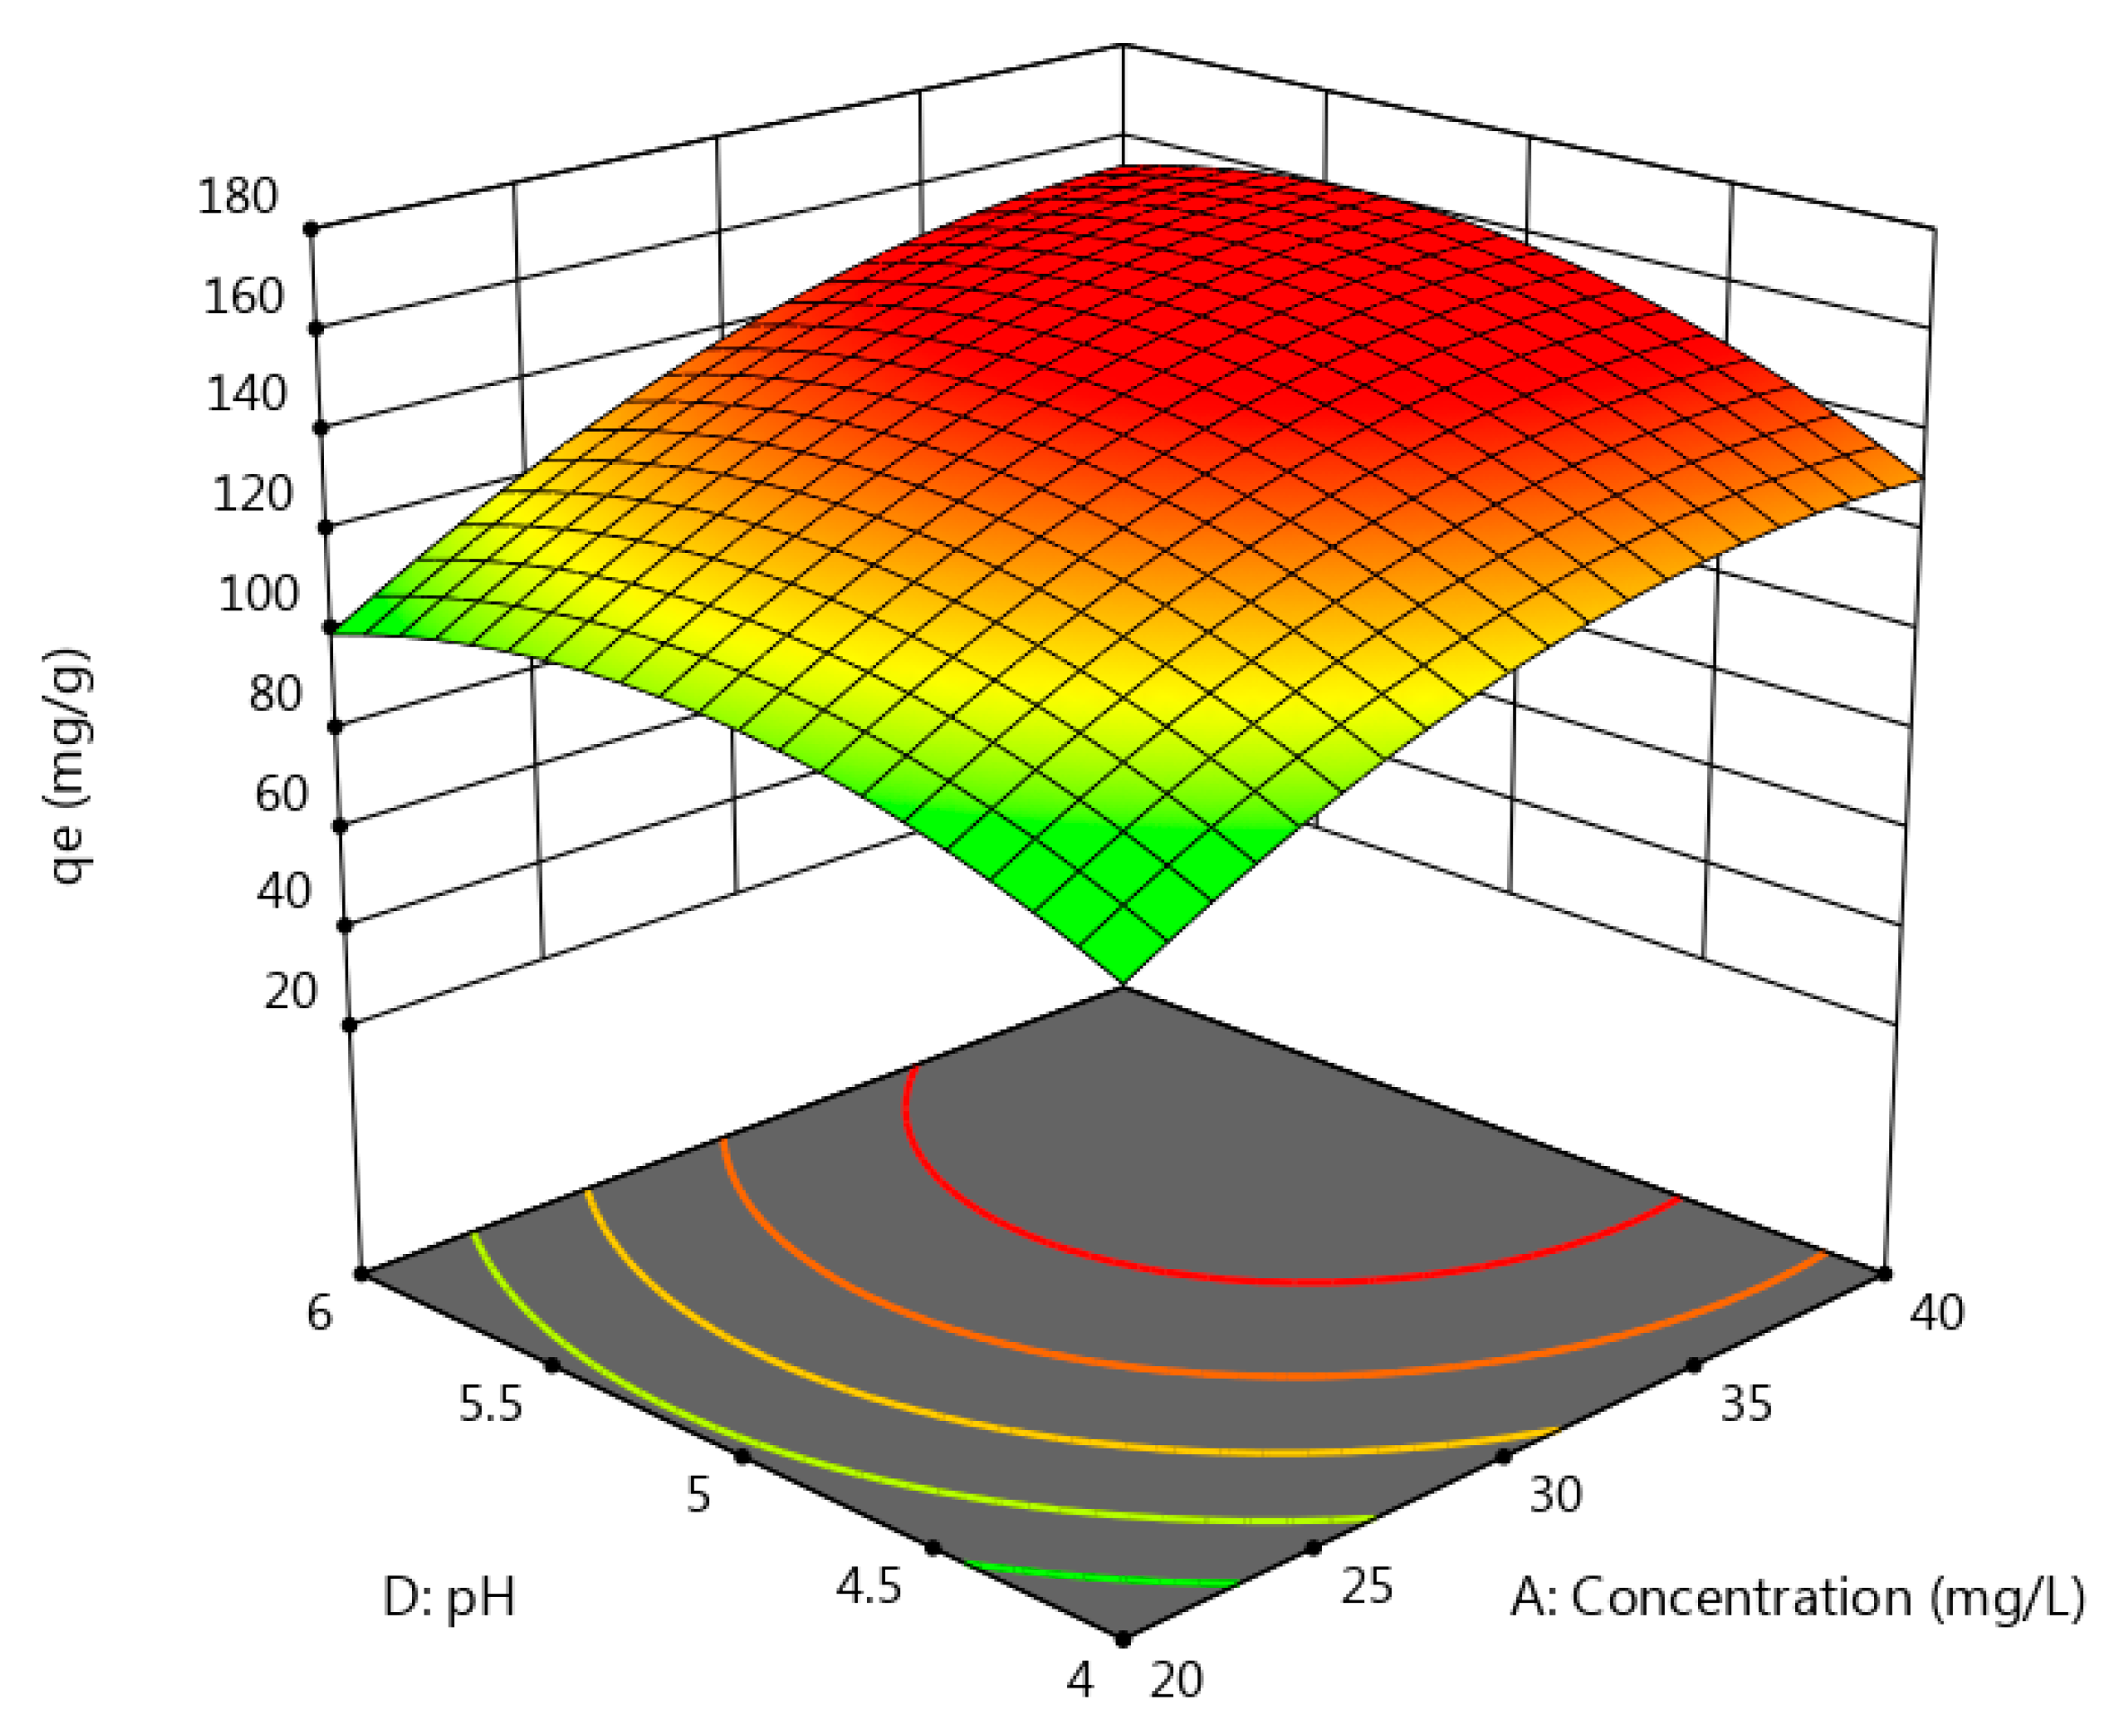
3.6. Central Composite Design

A central composite design set up was used to determine the effect of four influential variables, including initial concentration, temperature, contact time, and pH. Three levels of the variables (+1, 0, −1) encoded with ± α were defined as shown in (Table 3).
A CCD consisting of 30 experiments was suggested for the optimization of Pb(II) ion according to Equation (4) and as shown in (Table 4). Statistical analysis by RSM was employed for the determination of how well the regression models fitted the adsorption process of Pb(II). The experimental results reveal the relationship between actual responses (qe) and independent variables (Table 4). The regression analysis of CCD for adsorbate afforded linear, interactive, and quadratic models, as shown in Equation (12). ANOVA was applied to determine the significance of the suggested regression model.
q e = + 147.98 + 23.75 A 5.03 B + 15.52 C + 8.24 D + 4.25 A B 1.86 A C   + 2.96 A D 0.4475 B C 0.0475 B D 0.610 C D 12.96 A 2 17.43 B 2   15.69 C 2 16.09 D 2
where this equation is the predicted response for the adsorption capacity of Pb(II) ion. A, B, C, and D are the codes for the four variables, including initial concentration, contact time, temperature, and pH, respectively.
Results obtained from the ANOVA for Pb(II) uptake were tabulated in (Table 5). The statistical significance and accuracy of the model were confirmed through calculated coefficient of determination (R2), F-values, and p-values where the probability value (p-value) is less than 0.05. To estimate the goodness of fit of the model, the difference between adjusted R2 and predicted R2 should be approximately 0.20. The coefficient of determination (adjusted R2) was 0.9985. Consequently, predicted R2 was found to be 0.9960, which suggested a reasonable agreement. As shown in (Table 5), the F-value of the model was found to be 1386.13 with very low probability value (p-value < 0.0001). Therefore, these results have statistical significance showing the wellness of fit of the regression model to the adsorption process. In addition, the p-value was used to determine the main effect of each variable and their interactive effect. As can be seen from (Table 5), the p-values of A, B, C, D, AB, AC, AD, A2, B2, C2, and D2 are less than 0.05, which points out that these parameters have a more significant effect on the adsorption capacity of Pb(II).
The relationship between the actual and predicted values of adsorption capacity in (Figure 6) shows a close distribution in linear regression fitness suggesting a strong adequacy of the model. The colors indicate the adsorption capacity, where the blue and red colors indicates the low and high adsorption capacities, respectively. This means the model utilized is suitable to predict the adsorption process of Pb(II) under the studied conditions with a high level of accuracy.

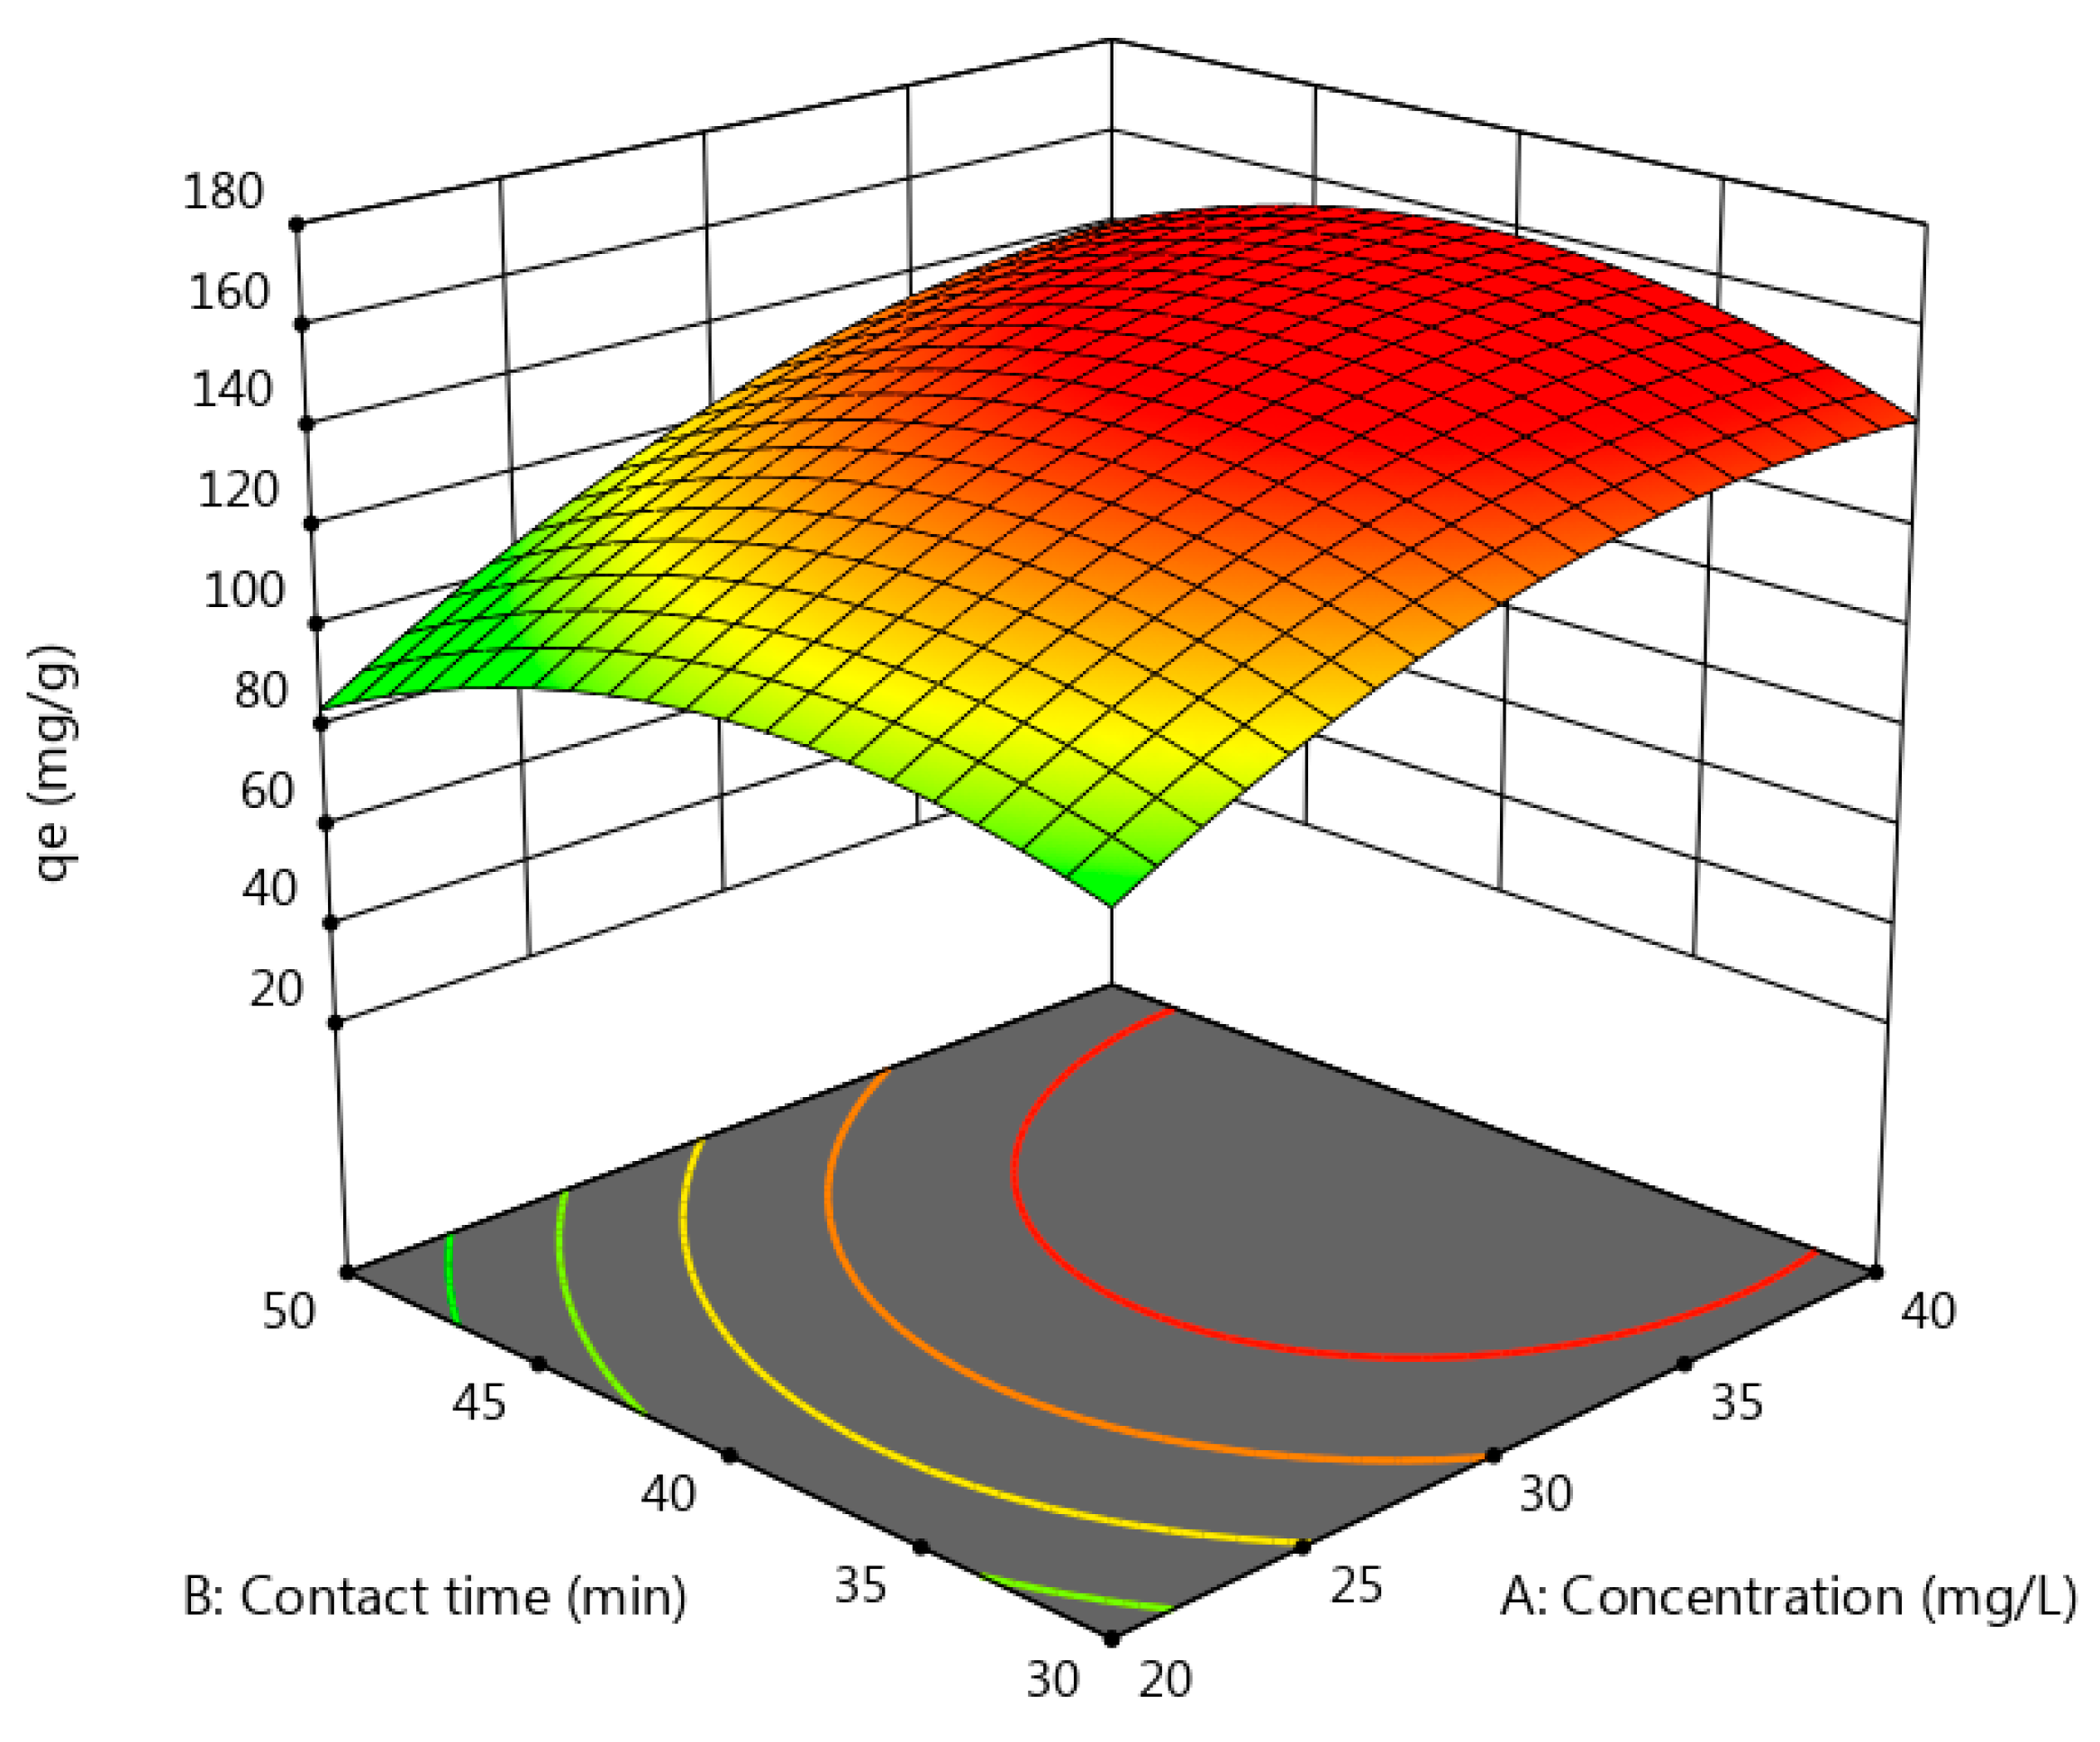
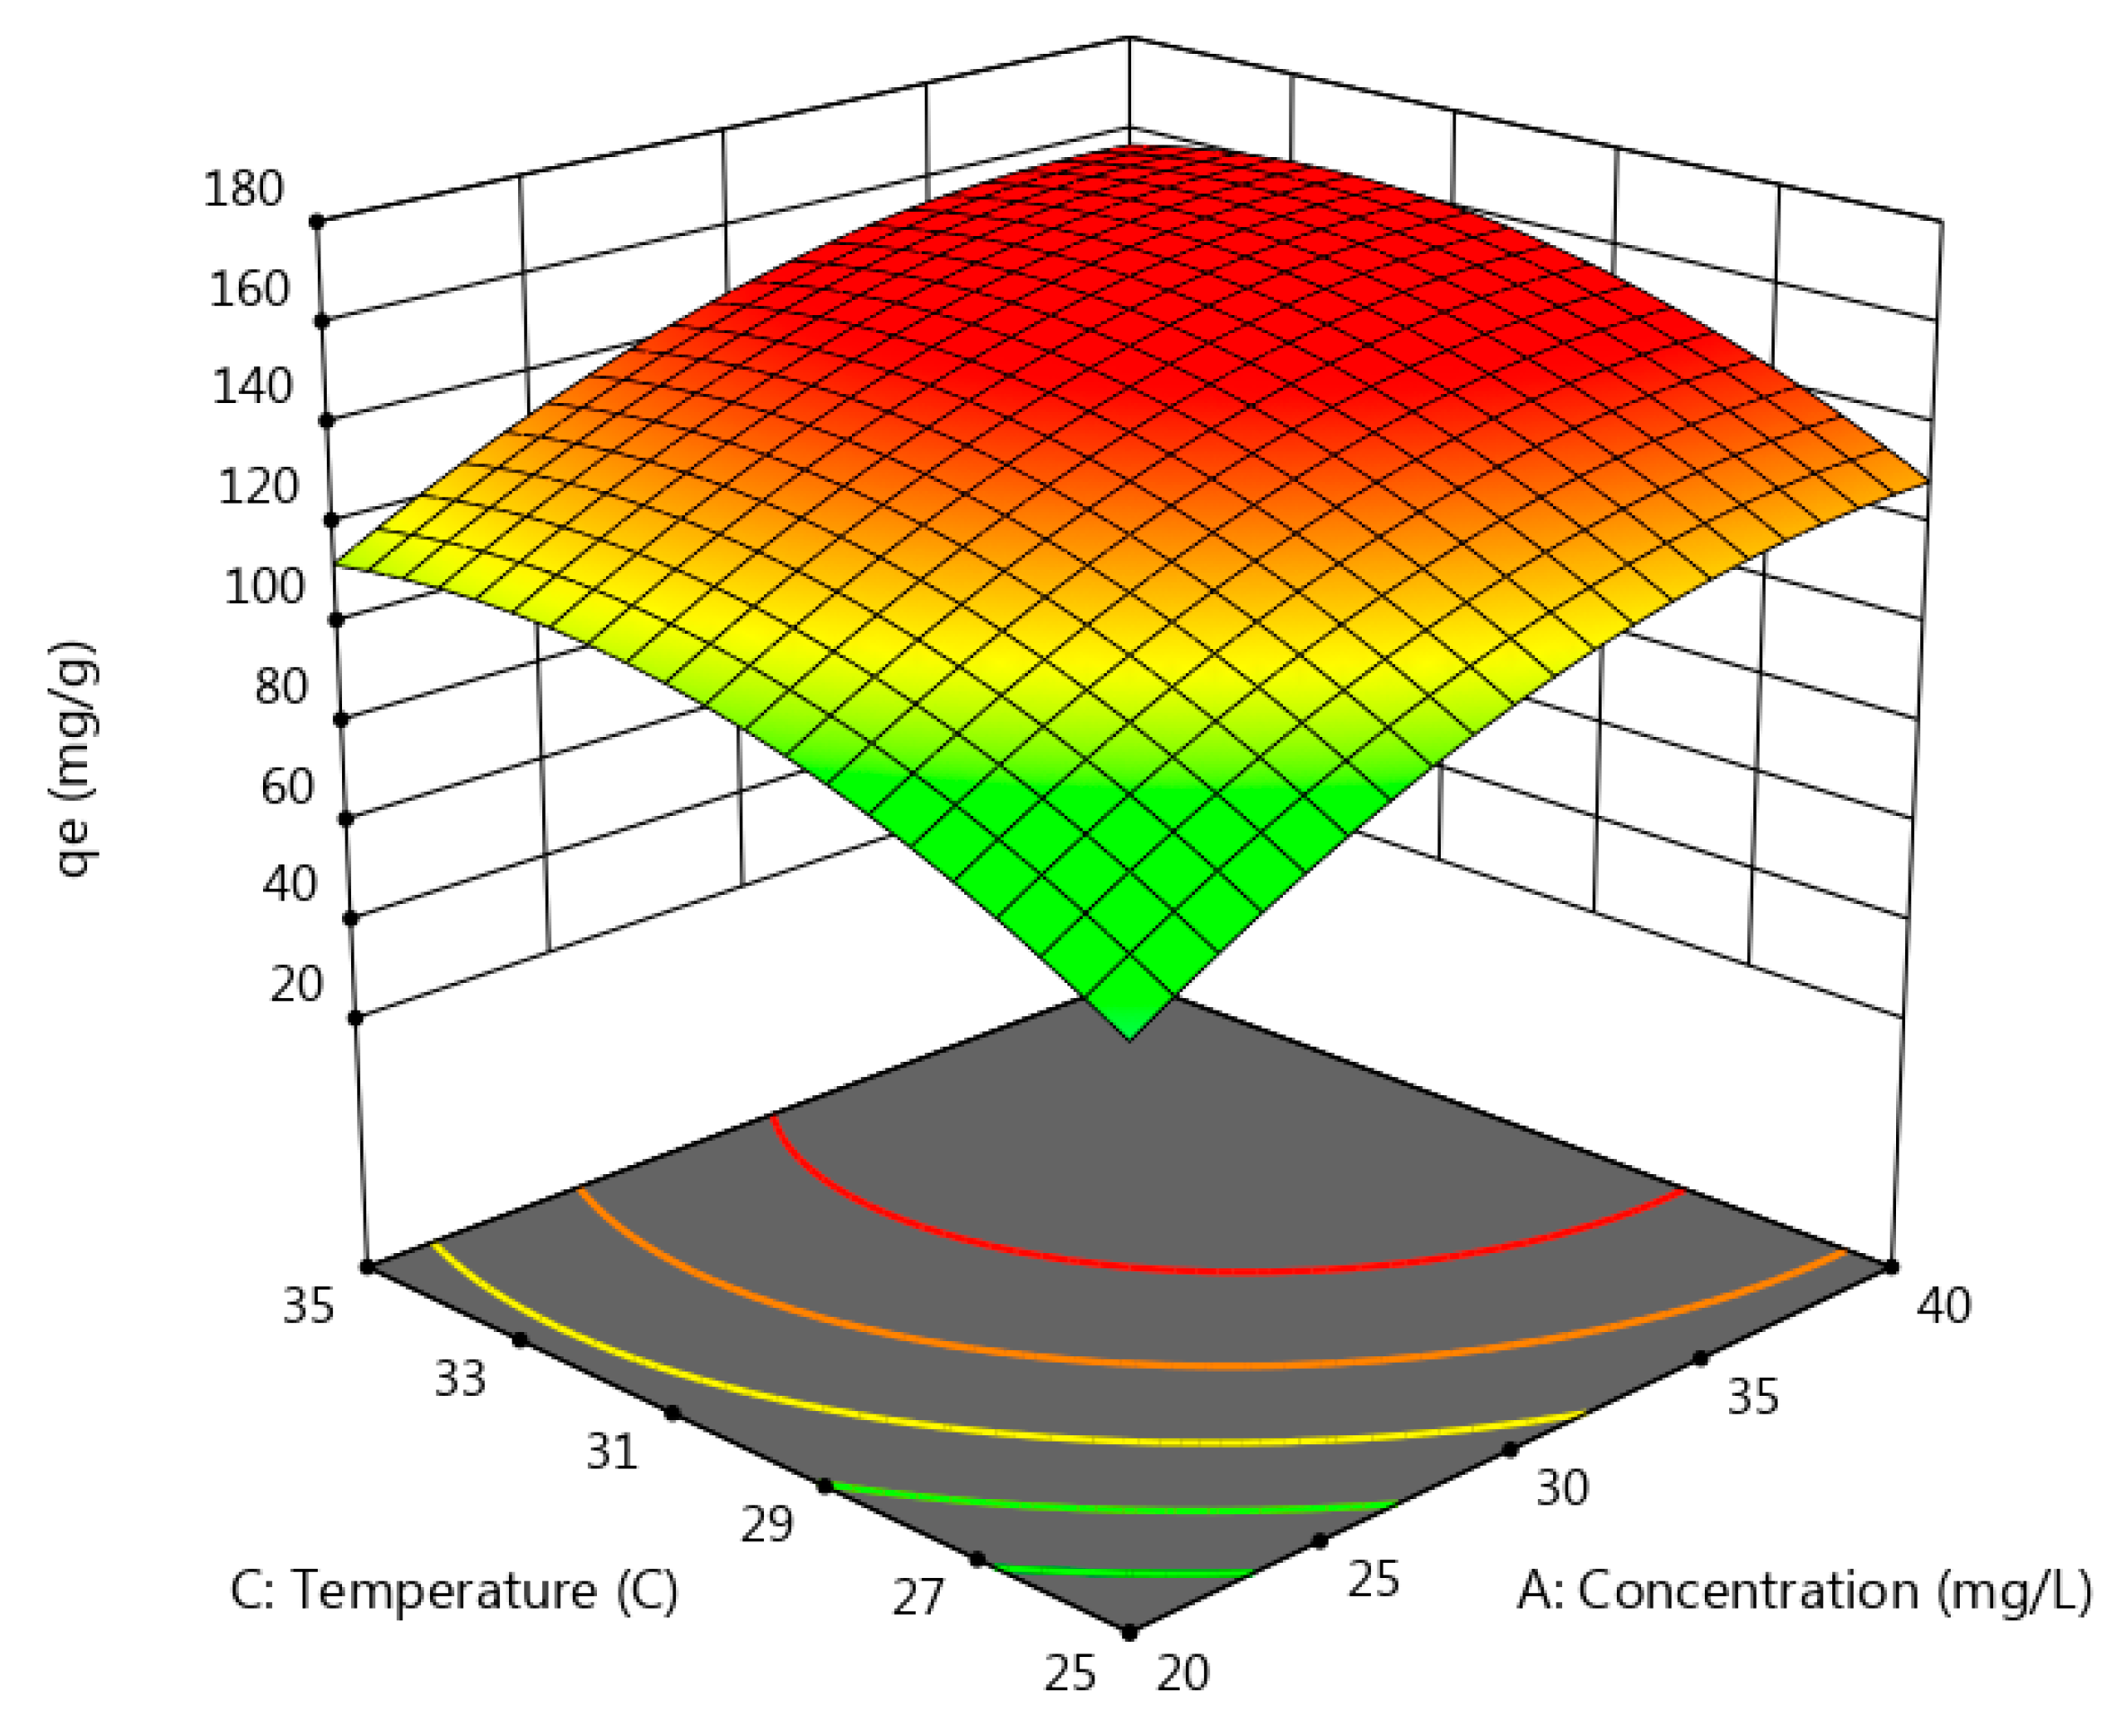
3.7. Effect of Initial Concentration

The initial concentration is the main factor that can affect the adsorption mechanism. A three-dimensional response surface plot was obtained from data as the function of two variables fixing the others. Figure 7 demonstrated the effect of initial concentration of metal and contact time on adsorption of Pb(II). The initial concentration of Pb(II) had a positive effect on the adsorption capacities, as shown in Equation (12), and the coefficient A is +23.75, in which increasing the initial concentration of Pb(II) (from 20 to 40 mg/L) increased the adsorption capacity from 80 to 148 mg/g (red zone). This might be due to metal ions densities in the solution getting higher which affords a more considerable uptake capacity. However, based on the same Equation (12), the further concentration (A2) of metal ion had a negative effect on the adsorption capacity (the coefficient of A2 is −12.96) and the adsorption process showed inappreciable efficiency. The reason for that could be related to competitive adsorption of metal ions on the active sites of Fe3O4 at high initial concentrations [46].

3.8. Effect of Contact Time

The relationship between the removal of adsorbate materials (heavy metals) and reaction time has a potential effect on the adsorption mechanism. The effect of contact time (from 20 to 60 min) on the adsorption of Pb(II) ion is presented in (Figure 7). The results indicate that uptake requires about 38 min of contact time between Fe3O4 and the metal solution of Pb(II) to obtain a removal efficiency of 99%. Generally, an increase in the adsorption capacity relative to contact time (from 10 to 30 min) may be attributed to more unsaturated and active sites available on the surface area of Fe3O4, after which the uptake decreases, presumably due to available sites being filled. Increasing the contact time (from 20 to 35 min) increased the uptake from 70 to 145 mg/g. However, from the same Equation (12), increasing the contact time further (B2) more than 60 min had a negative impact on the adsorption capacity (the coefficient B2 was −17.43). It was also noted that the interaction of initial concentration with contact time (AB) based on Equation (12), showed a negative impact (the coefficient of AB was +4.25).

3.9. Effect of Temperature

Solution temperature is another parameter that has a significant effect on the adsorption process by affecting the solubility and diffusion rate of the adsorbate material. The change in temperature can also affect the surface of the adsorbent. The temperature can also influence the adsorption process in different ways depending on the nature of the process. Usually, an increase in solution temperature enhances the mobility of metal ions due to an increase in their kinetic energy. In addition, higher temperatures can improve the intraparticle diffusion rate of metal ions [47].
The effect of temperature was investigated at a range of 20–40 °C. The results are presented in (Figure 8). The effect of temperature showed a positive effect on the adsorption capacity according to Equation (12), as the coefficient (C) was 15.52. The effect of temperature on adsorption of Pb(II) was enhanced when temperature increased from 20 to 35 °C and above 35 °C it started decreasing (red zone). However, a further increase in temperature (B2) had a negative impact on the adsorption capacity based on Equation (12), and the coefficient (B2) was −17.43.

3.10. Effect of pH

Solution pH is the most crucial factor that plays an important role in controlling the adsorption process of heavy metals. The pH strongly influences not only the surface characteristics of adsorbents, but also precipitation, competition, speciation, and degree of ionization of the adsorbate. The effect of pH (3 to 7) was studied, and the results are presented in (Figure 9). The pH showed a significant positive effect on Pb(II) uptake with the coefficient (D) of +8.24. The adsorption capacity of Pb(II) was increased from 50 to 149 mg/g.
The minimum uptake observed at strong acidic medium can be attributed to the high amount and mobility of available H+ ions which can compete with Pb(II) and prevent the latter from binding of Fe3O4 sites. In addition, at a higher pH the adsorbent surface becomes more positively charged, thus causing repulsion and hindering metal cation uptake. In contrast, as solution pH increases, H+ in solution decreases and competition becomes weaker, so adsorbate ions are able to replace the proton for the same adsorption sites [46]. It should be noted that experimental runs were not carried out above pH 7 due to the chemical speciation of Pb(II) ions starting to precipitate at pH values above 7. However, there was a decrease in adsorption capacity observed at (pH 6.5). This behavior can be explained according to Equation (12), in which increasing pH (D2) had a negative impact on the adsorption process (the coefficient D2 was −16.09). This behavior may also be attributed to the occurrence of metal hydroxide precipitation [46,48].

3.11. Optimization Conditions Using Desirability Function

To determine the optimum values of different parameter combinations for Pb(II) uptake onto Fe3O4 from aqueous solutions, the CCD program was set up for four independent process parameters, namely initial concentration, contact time, temperature, and pH. Numerical optimization established a point that maximizes the desirability function, as shown in (Table 6).

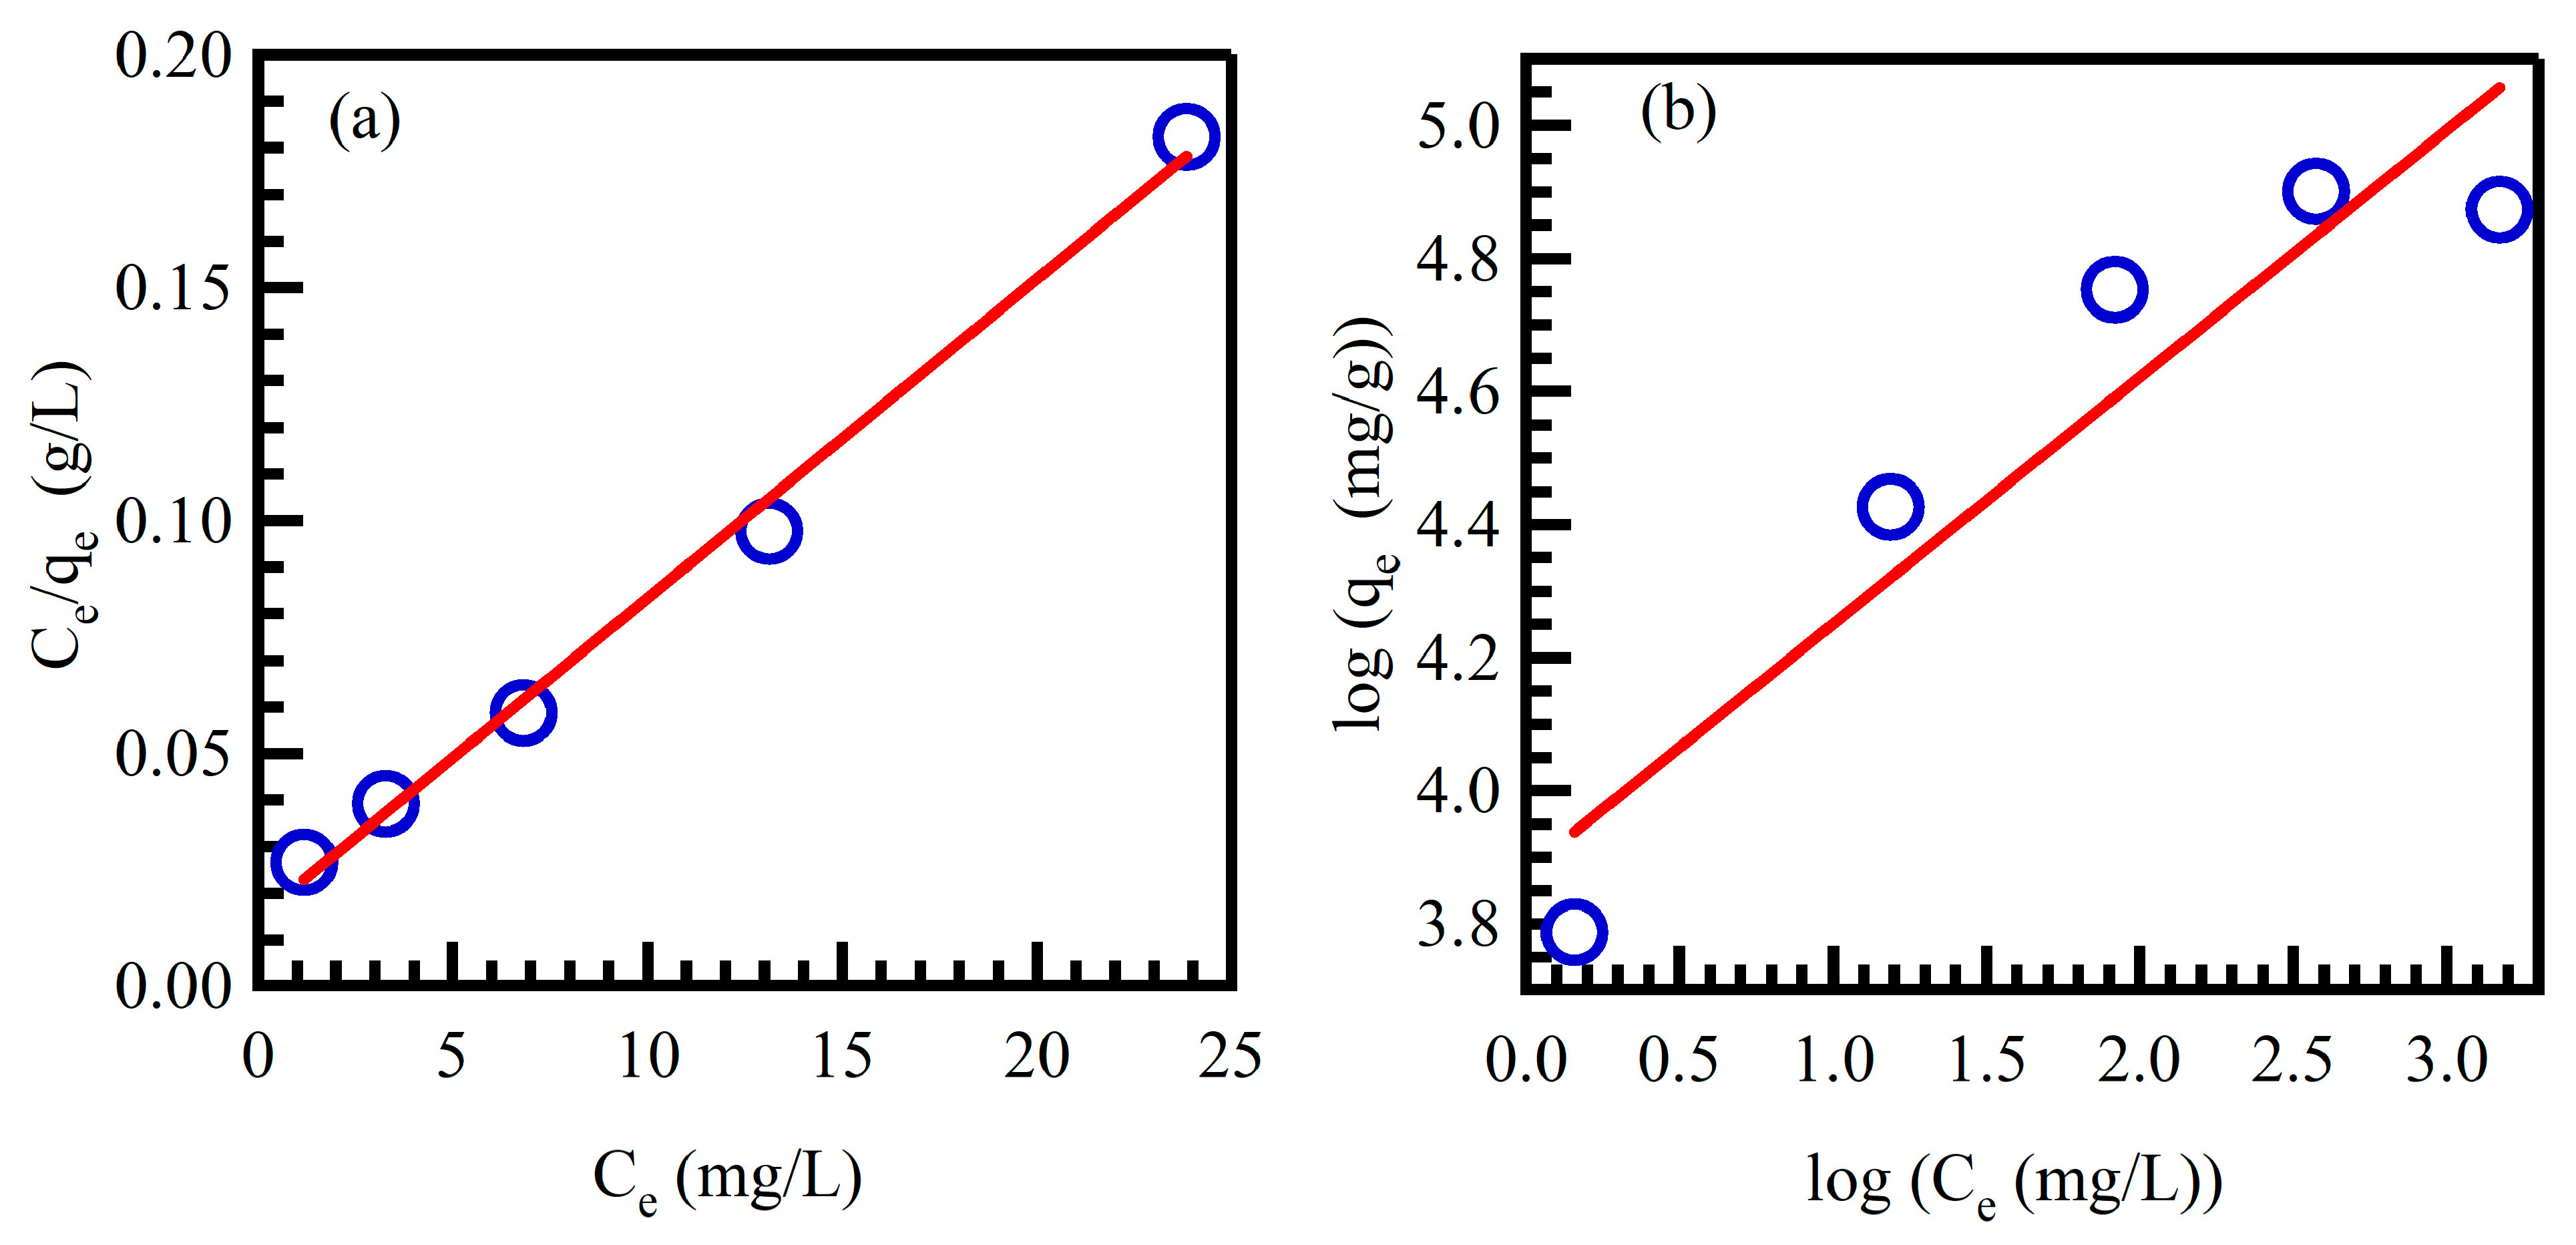
3.12. Adsorption Isotherms

The fitting of adsorption data is fundamentally necessary to evaluate the adsorption capacity of the adsorbent. When equilibrium is achieved, the concentration of adsorbate in solution is in dynamic balance with that on the adsorbent boundary and the concentration of the solution remains constant. The Langmuir model fitted the experimental data for Pb (II) and showed regression coefficients (R2) of 0.99 (Figure 10a), revealing a goodness of fitting of the experimental data. The KL and RL values were calculated to be 0.456 L/mg and 0.042. The values of RL demonstrate that the adsorption process is favorable. The theoretical maximum adsorption capacity obtained is 147.1 mg/g. The Freundlich model showed a linear fit with the value of the coefficient of determination (R2) to be 0.887, as shown in Figure 10b and listed in Table 7. In addition, the values of 1/n and Kf from the correlation of the experimental data were computed to be 0.37 and 48.37 L/g. Table 8 compares the main adsorption findings with some related Fe3O4-based materials with their main characteristics and experimental conditions.
To compare between the fitting isotherms models, it can be seen from (Table 7) that the Langmuir isotherm model gives the best fit based on the coefficient of determination value of R2.

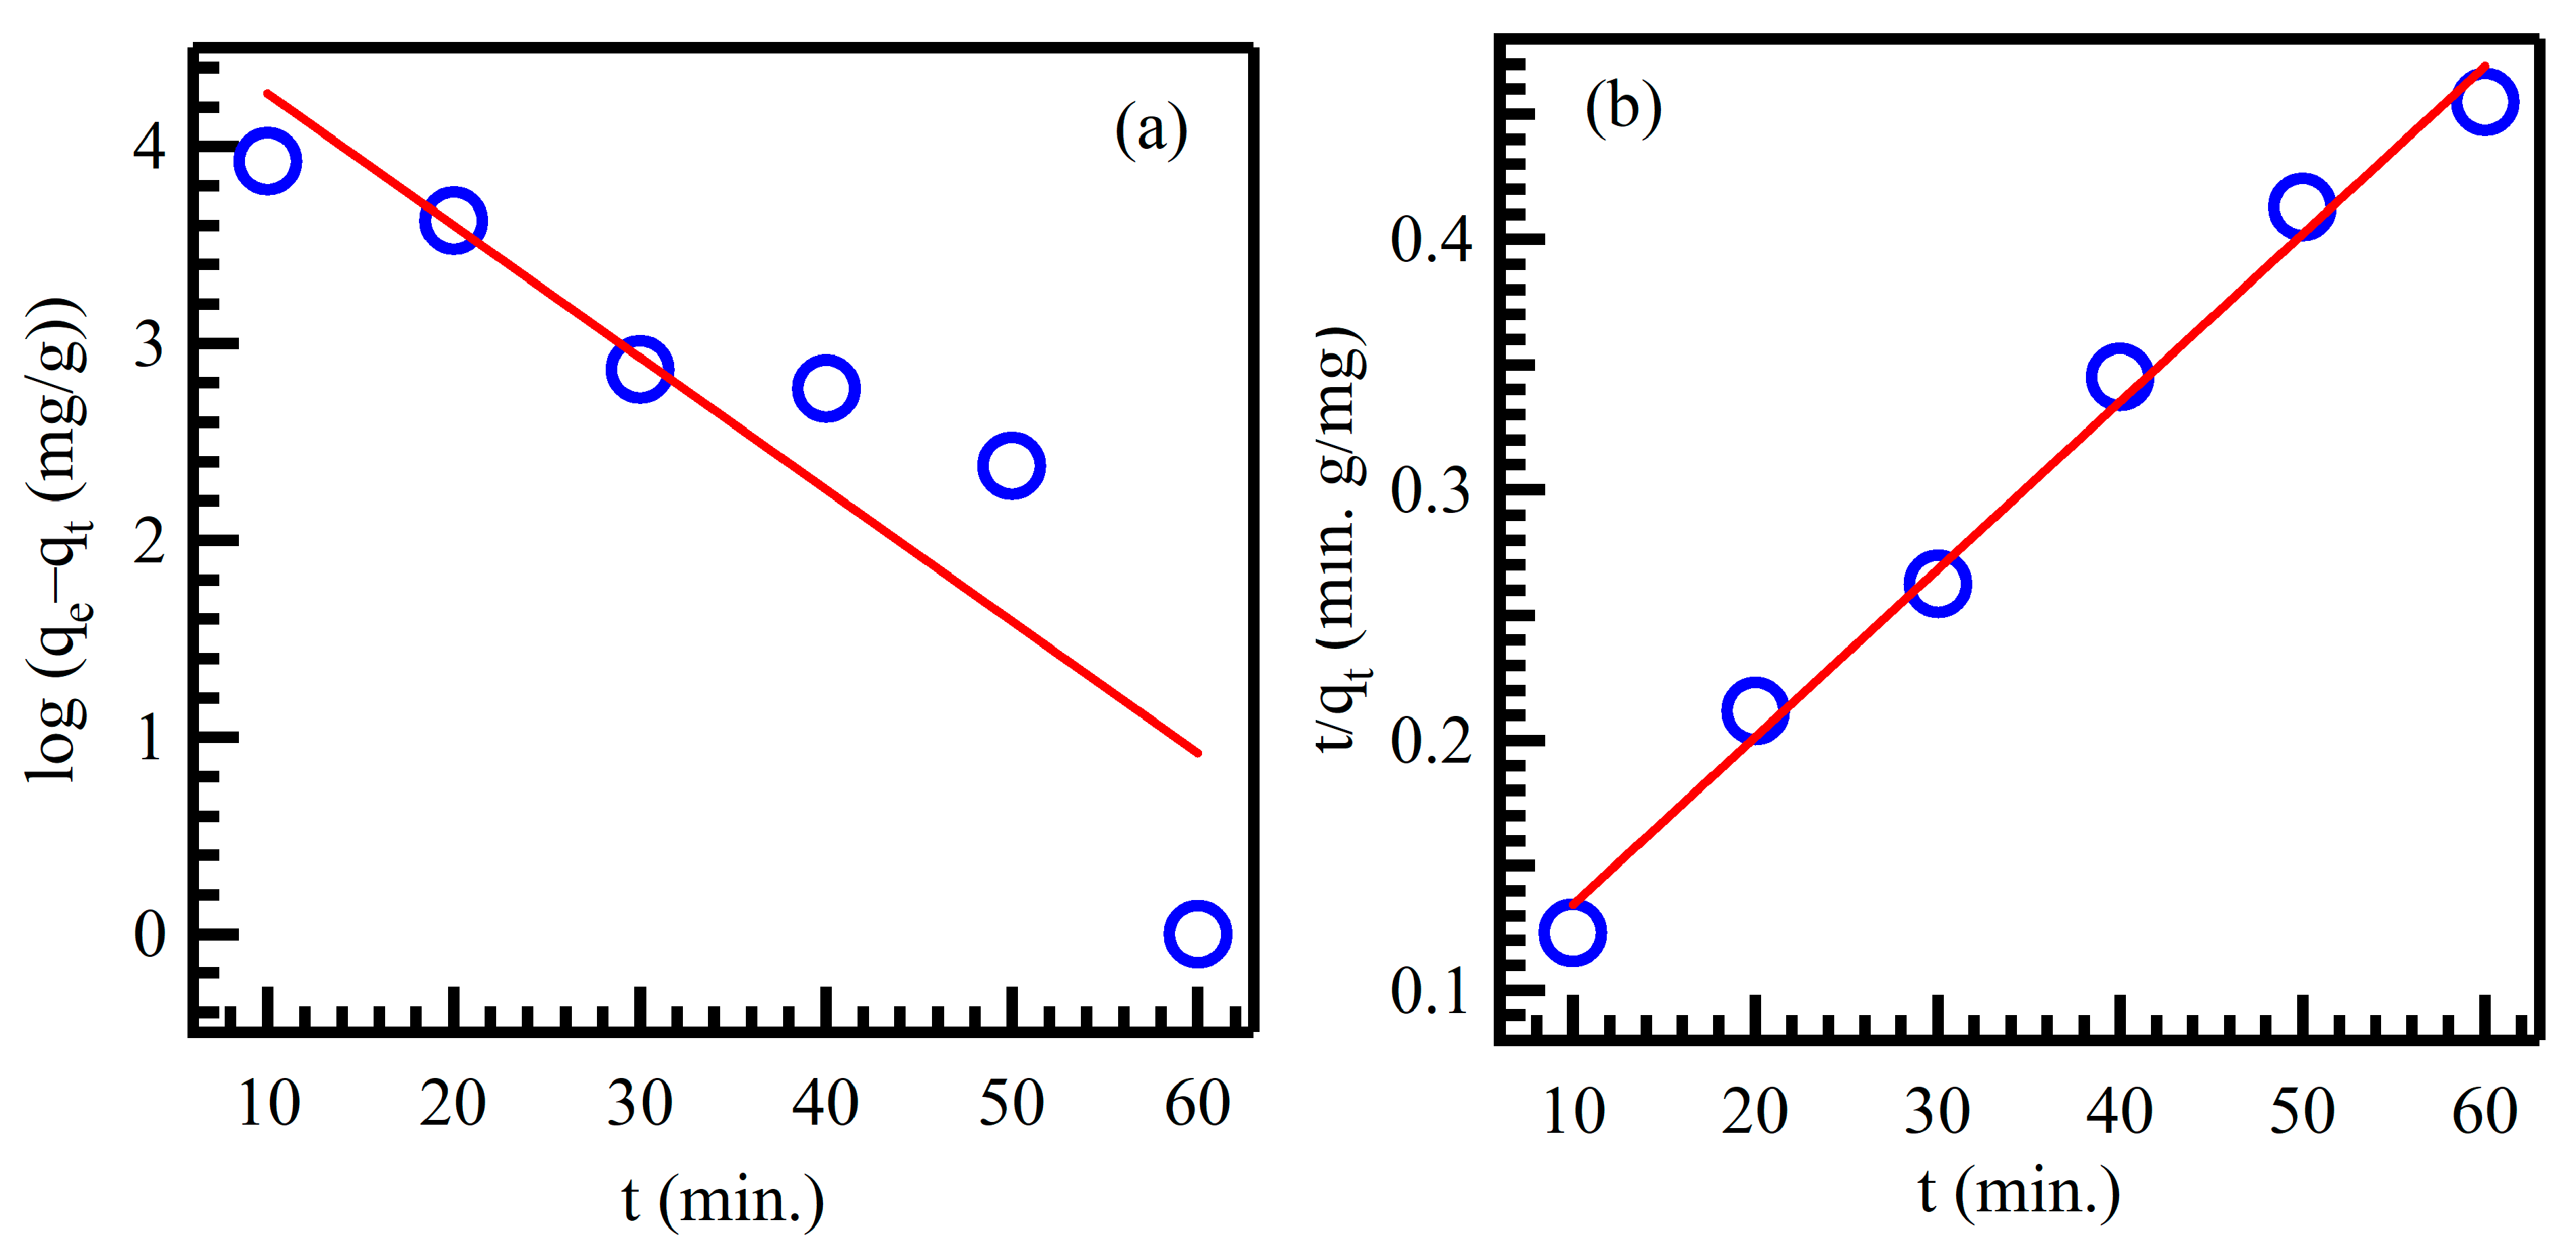
3.13. Adsorption Kinetics

Kinetic parameters were investigated to establish the efficiency and mechanism of adsorption of Pb(II) onto Fe3O4. Pseudo-first-order was employed for the analysis of the quantitative kinetics of the experimental data, giving a coefficient of determination of 0.81, and the rate constant (k) of adsorption process was 0.067 min−1 (Figure 11a). The maximum value of adsorption capacity was found to be 139.66 mg/g. Pseudo-second-order was applied (Figure 11b) showing a value of coefficient of determination of 0.99, with rate constants of 0.00061 g/mg/min. Also, the value of adsorption capacity was 149.25 mg/g.
A comparison of the fitting kinetic models to the experimental results was evaluated based on the coefficient of determination (R2) and adsorption capacity, as given in (Table 9). From (R2), it can be concluded that the adsorption of Pb(II) ion followed a pseudo-second-order kinetic. The theoretical value for the adsorption capacity of the second order model compares more reasonably with experimental data relative to the first order model. From the results of the pseudo-second-order model, it can be suggested that the chemical interactions of Pb(II) ion with Fe3O4 surface involved either bonding forces or ions and electrons exchange.

3.14. Adsorption Mechanism

Based on the Langmiur isotherm and kinetic data, the adsorption mechanism Pb(II) adsorption on Fe3O4 is mainly based on chemical reactions and particle precipitation reactions on the surface of the adsorbent [59]. The chemical interaction is attributed to the formation of surface complexes between the functional groups (:FeOH) and Pb(II) [60]. In addition, electrostatic interaction plays a key role in the adsorption process. It has been found that Fe3O4 could attract both negative and positive particles based on the pH conditions.

4. Conclusions

This study demonstrates the effectiveness of eco-friendly synthesized Fe3O4 nanoparticles for the adsorption of lead Pb(II). The operational parameters were fine-tuned using response surface methodology, with a focus on the central composite design. This approach was employed to synthesize and employ the nanoparticles as a proficient adsorbent for effectively eliminating Pb(II) from aqueous solutions. The findings indicated that, at pH 5.5 and with a contact time of 35 min, the maximum Pb(II) recovery reached an impressive 99%. The adsorption mechanism was effectively captured by the Langmuir isotherm model, while the kinetics of the process adhered to the characteristics of a pseudo-second-order model. The Langmuir isotherm model revealed a maximum adsorption capacity of 147.1 mg/g for Pb(II). The use of response surface methodology, particularly the central composite design, proved to be beneficial as it allowed for the optimization of multiple parameters with a reduced number of experiments, saving time and resources. The plant extract used in the synthesis of the Fe3O4 nanoparticles exhibited a high phenolic and flavonoid content, indicating its potential as a powerful antioxidant. This characteristic enables the plant to effectively reduce metal ions to the nanoscale, resulting in nanoparticles with a large surface area, all achieved through a cost-effective and safer approach.

Author Contributions

Conceptualization, S.A.Y. and G.A.M.A.; methodology, A.A.H. and R.S.A.; software, Z.A.O.; validation, H.A.A., S.A.Y. and M.A.A.; formal analysis, R.S.A. and S.A.Y.; investigation, G.A.M.A.; resources, S.A.Y.; data curation, Z.A.O. and H.A.A.; writing—original draft preparation, A.A.H.; writing—review and editing, S.A.Y., M.A.A. and G.A.M.A.; visualization, S.A.Y. and G.A.M.A.; supervision, S.A.Y. and G.A.M.A. All authors have read and agreed to the published version of the manuscript.

Funding

This research received no external funding.

Data Availability Statement

The data presented in this study are available in the article.

Acknowledgments

S.A. Yasin acknowledges the generous financial assistance provided by the USAID Partnerships for Enhanced Engagement in Research (PEER) Program. This international grant initiative supports researchers and engineers from developing nations who collaborate with U.S. government-funded counterparts to tackle global developmental issues. The PEER/Iraq project within cycle 6 was administered by the U.S. National Academies of Sciences, Engineering, and Medicine (NASEM). M.A. Assiri extends his appreciation to the Deanship of Scientific Research at King Khalid University for funding this work through the research group project under grant number (RGP-2/525/44).

Conflicts of Interest

The authors declare no conflict of interest.

References

  1. Zhang, L.; Zeng, Y.; Cheng, Z. Removal of heavy metal ions using chitosan and modified chitosan: A review. J. Mol. Liq. 2016, 214, 175–191. [Google Scholar] [CrossRef]
  2. Essa, W.K.; Yasin, S.A.; Abdullah, A.H.; Thalji, M.R.; Saeed, I.A.; Assiri, M.A.; Chong, K.F.; Ali, G.A.M. Taguchi L25 (54) Approach for Methylene Blue Removal by Polyethylene Terephthalate Nanofiber-Multi-Walled Carbon Nanotube Composite. Water 2022, 14, 1242. [Google Scholar] [CrossRef]
  3. Zhu, S.; Khan, M.A.; Wang, F.; Bano, Z.; Xia, M. Exploration of adsorption mechanism of 2-phosphonobutane-1,2,4-tricarboxylic acid onto kaolinite and montmorillonite via batch experiment and theoretical studies. J. Hazard. Mater. 2021, 403, 123810. [Google Scholar] [CrossRef]
  4. Carolin, C.F.; Kumar, P.S.; Saravanan, A.; Joshiba, G.J.; Naushad, M. Efficient techniques for the removal of toxic heavy metals from aquatic environment: A review. J. Environ. Chem. Eng. 2017, 5, 2782–2799. [Google Scholar] [CrossRef]
  5. Lee, S.P.; Ali, G.A.M.; Algarni, H.; Chong, K.F. Flake size-dependent adsorption of graphene oxide aerogel. J. Mol. Liq. 2019, 277, 175–180. [Google Scholar] [CrossRef]
  6. Mao, S.; Shen, T.; Han, T.; Ding, F.; Zhao, Q.; Gao, M. Adsorption and co-adsorption of chlorophenols and Cr(VI) by functional organo-vermiculite: Experiment and theoretical calculation. Sep. Purif. Technol. 2021, 277, 119638. [Google Scholar] [CrossRef]
  7. Sharma, S.K. Heavy Metals in Water: Presence, Removal and Safety; Royal Society of Chemistry: London, UK, 2014. [Google Scholar]
  8. Shayegan, H.; Ali, G.A.M.; Safarifard, V. Amide-Functionalized Metal–Organic Framework for High Efficiency and Fast Removal of Pb(II) from Aqueous Solution. J. Inorg. Organomet. Polym. Mater. 2020, 30, 3170–3178. [Google Scholar] [CrossRef]
  9. Acharya, J.; Sahu, J.; Mohanty, C.; Meikap, B. Removal of lead (II) from wastewater by activated carbon developed from Tamarind wood by zinc chloride activation. Chem. Eng. J. 2009, 149, 249–262. [Google Scholar] [CrossRef]
  10. Sharma, S.K.; Sanghi, R. Advances in Water Treatment and Pollution Prevention; Springer Science & Business Media: Berlin/Heidelberg, Germany, 2012. [Google Scholar]
  11. Ethiraj, A.S.; Rhen, D.S.; Soldatov, A.V.; Ali, G.A.M.; Bakr, Z.H. Efficient and recyclable Cu incorporated TiO2 nanoparticle catalyst for organic dye photodegradation. Int. J. Thin Film Sci. Technol. 2021, 10, 169–182. [Google Scholar]
  12. Li, P.; Zhang, H.; Xia, M.; Wang, F.; Zhu, S.; Lei, W. The synergistic effect and microscopic mechanism of co-adsorption of three emerging contaminants and copper ion on gemini surfactant modified montmorillonite. Ecotoxicol. Environ. Saf. 2019, 184, 109610. [Google Scholar] [CrossRef]
  13. Yew, Y.P.; Shameli, K.; Miyake, M.; Khairudin, N.B.B.A.; Mohamad, S.E.B.; Naiki, T.; Lee, K.X. Green biosynthesis of superparamagnetic magnetite Fe3O4 nanoparticles and biomedical applications in targeted anticancer drug delivery system: A review. Arab. J. Chem. 2020, 13, 2287–2308. [Google Scholar] [CrossRef]
  14. Golabiazar, R.; Omar, Z.A.; Ahmad, R.N.; Hasan, S.A.; Sajadi, S.M. Synthesis and characterization of antibacterial magnetite-activated carbon nanoparticles. J. Chem. Res. 2020, 44, 80–87. [Google Scholar] [CrossRef]
  15. Elshazly, E.H.; Mohamed, A.K.S.H.; Aboelmagd, H.A.; Gouda, G.A.; Abdallah, M.H.; Ewais, E.A.; Assiri, M.A.; Ali, G.A.M. Phytotoxicity and Antimicrobial Activity of Green Synthesized Silver Nanoparticles Using Nigella sativa Seeds on Wheat Seedlings. J. Chem. 2022, 2022, 9609559. [Google Scholar] [CrossRef]
  16. Lukman, A.I.; Gong, B.; Marjo, C.E.; Roessner, U.; Harris, A.T. Facile synthesis, stabilization, and anti-bacterial performance of discrete Ag nanoparticles using Medicago sativa seed exudates. J. Colloid Interface Sci. 2011, 353, 433–444. [Google Scholar] [CrossRef] [PubMed]
  17. Padil, V.V.T.; Černík, M. Green synthesis of copper oxide nanoparticles using gum karaya as a biotemplate and their antibacterial application. Int. J. Nanomed. 2013, 8, 889–898. [Google Scholar]
  18. Salam, H.A.; Rajiv, P.; Kamaraj, M.; Jagadeeswaran, P.; Gunalan, S.; Sivaraj, R. Plants: Green route for nanoparticle synthesis. Int. Res. J. Biol. Sci. 2012, 1, 85–90. [Google Scholar]
  19. Shameli, K.; Ahmad, M.B.; Zamanian, A.; Sangpour, P.; Shabanzadeh, P.; Abdollahi, Y.; Zargar, M. Green biosynthesis of silver nanoparticles using Curcuma longa tuber powder. Int. J. Nanomed. 2012, 7, 5603–5610. [Google Scholar] [CrossRef]
  20. Bouafia, A.; Laouini, S.E.; Tedjani, M.L.; Ali, G.A.M.; Barhoum, A. Green biosynthesis and physicochemical characterization of Fe3O4 nanoparticles using Punica granatum L. fruit peel extract for optoelectronic applications. Text. Res. J. 2022, 92, 2685–2696. [Google Scholar] [CrossRef]
  21. Laouini, S.E.; Bouafia, A.; Soldatov, A.V.; Algarni, H.; Tedjani, M.L.; Ali, G.A.M.; Barhoum, A. Green Synthesized of Ag/Ag2O Nanoparticles Using Aqueous Leaves Extracts of Phoenix dactylifera L. and Their Azo Dye Photodegradation. Membranes 2021, 11, 468. [Google Scholar] [CrossRef]
  22. Prasad, C.; Karlapudi, S.; Venkateswarlu, P.; Bahadur, I.; Kumar, S. Green arbitrated synthesis of Fe3O4 magnetic nanoparticles with nanorod structure from pomegranate leaves and Congo red dye degradation studies for water treatment. J. Mol. Liq. 2017, 240, 322–328. [Google Scholar] [CrossRef]
  23. Mahdavi, M.; Namvar, F.; Ahmad, M.B.; Mohamad, R. Green biosynthesis and characterization of magnetic iron oxide (Fe3O4) nanoparticles using seaweed (Sargassum muticum) aqueous extract. Molecules 2013, 18, 5954–5964. [Google Scholar] [CrossRef]
  24. Revati, K.; Pandey, B. Microbial synthesis of iron-based nanomaterials-A review. Bull. Mater. Sci. 2011, 34, 191–198. [Google Scholar]
  25. Guo, J.; Wang, R.; Tjiu, W.W.; Pan, J.; Liu, T. Synthesis of Fe nanoparticles@ graphene composites for environmental applications. J. Hazard. Mater. 2012, 225, 63–73. [Google Scholar] [CrossRef] [PubMed]
  26. Habeeb, O.A.; Ramesh, K.; Ali, G.A.M.; Yunus, R.M. Isothermal modelling based experimental study of dissolved hydrogen sulfide adsorption from waste water using eggshell based activated carbon. Malays. J. Anal. Sci. 2017, 21, 334–345. [Google Scholar]
  27. Habeeb, O.A.; Ramesh, K.; Ali, G.A.M.; Yunus, R.M. Application of response surface methodology for optimization of palm kernel shell activated carbon preparation factors for removal of H2S from industrial wastewater. J. Teknol. 2017, 79, 1–10. [Google Scholar] [CrossRef]
  28. Habeeb, O.A.; Ramesh, K.; Ali, G.A.M.; Yunus, R.M. Experimental design technique on removal of hydrogen sulfide using CaO-eggshells dispersed onto palm kernel shell activated carbon: Experiment, optimization, equilibrium and kinetic studies. J. Wuhan Univ. Technol. Mater. Sci. Ed. 2017, 32, 305–320. [Google Scholar]
  29. Habeeb, O.A.; Ramesh, K.; Ali, G.A.M.; Yunus, R.M.; Olalere, O.A. Kinetic, Isotherm and Equilibrium Study of Adsorption of Hydrogen Sulfide From Wastewater Using Modified Eggshells. IIUM Eng. J. 2017, 18, 13–25. [Google Scholar] [CrossRef]
  30. Habeeb, O.A.; Ramesh, K.; Ali, G.A.M.; Yunus, R.M. Low-cost and eco-friendly activated carbon from modified palm kernel shell for hydrogen sulfide removal from wastewater: Adsorption and kinetic studies. Desalin. Water Treat. 2017, 84, 205–214. [Google Scholar] [CrossRef]
  31. Nwabueze, T.U. Basic steps in adapting response surface methodology as mathematical modelling for bioprocess optimisation in the food systems. Int. J. Food Sci. Technol. 2010, 45, 1768–1776. [Google Scholar] [CrossRef]
  32. Fazeli-Nasab, B.; Ghafari, M.; Jahantigh, M.; Beigomi, Z.; Saeidi, S. Evaluation of Phenolic and Flavonoid Content, Alkaloids, Antioxidant Capacity and Antibacterial Properties of Methanolic Extract of Zahak Native Medicinal Plants Against Seven Pathogens. J. Med. Plants By-Prod. 2023, in press. [Google Scholar]
  33. Rakotondramasy-Rabesiaka, L.; Havet, J.L.; Porte, C.; Fauduet, H. Solid-liquid extraction of protopine from Fumaria officinalis L.-Kinetic modelling of influential parameters. Ind. Crops Prod. 2009, 29, 516–523. [Google Scholar] [CrossRef]
  34. Păltinean, R.; Mocan, A.; Vlase, L.; Gheldiu, A.-M.; Crișan, G.; Ielciu, I.; Voștinaru, O.; Crișan, O. Evaluation of polyphenolic content, antioxidant and diuretic activities of six Fumaria species. Molecules 2017, 22, 639. [Google Scholar] [CrossRef] [PubMed]
  35. Bibi, N.; Shah, M.H.; Khan, N.; Al-Hashimi, A.; Elshikh, M.S.; Iqbal, A.; Ahmad, S.; Abbasi, A.M. Variations in total phenolic, total flavonoid contents, and free radicals’ scavenging potential of onion varieties planted under diverse environmental conditions. Plants 2022, 11, 950. [Google Scholar] [CrossRef]
  36. Baliyan, S.; Mukherjee, R.; Priyadarshini, A.; Vibhuti, A.; Gupta, A.; Pandey, R.P.; Chang, C.M. Determination of Antioxidants by DPPH Radical Scavenging Activity and Quantitative Phytochemical Analysis of Ficus religiosa. Molecules 2022, 27, 1326. [Google Scholar] [CrossRef]
  37. Rassem, H.H.A.; Nour, A.H.; Ali, G.A.M.; Masood, N.; Al-Bagawi, A.H.; Alanazi, T.Y.A.; Magam, S.; Assiri, M.A. Essential Oil from Hibiscus Flowers through Advanced Microwave-Assisted Hydrodistillation and Conventional Hydrodistillation. J. Chem. 2022, 2022, 2000237. [Google Scholar] [CrossRef]
  38. Haji, A.A.; Mohammed, N.M.S. Optimization of Arsenic Adsorption onto Activated Carbon of Potato Peel Using Response Surface Methodology. Sci. J. Univ. Zakho 2019, 7, 37–44. [Google Scholar]
  39. Van Thuan, T.; Quynh, B.T.P.; Nguyen, T.D.; Bach, L.G. Response surface methodology approach for optimization of Cu2+, Ni2+ and Pb2+ adsorption using KOH-activated carbon from banana peel. Surf. Interfaces 2017, 6, 209–217. [Google Scholar] [CrossRef]
  40. Davarnejad, R.; Panahi, P. Cu (II) removal from aqueous wastewaters by adsorption on the modified Henna with Fe3O4 nanoparticles using response surface methodology. Sep. Purif. Technol. 2016, 158, 286–292. [Google Scholar] [CrossRef]
  41. Samadi, N.; Hasanzadeh, R.; Rasad, M. Adsorption isotherms, kinetic, and desorption studies on removal of toxic metal ions from aqueous solutions by polymeric adsorbent. J. Appl. Polym. Sci. 2015, 132, 41642. [Google Scholar] [CrossRef]
  42. Chaudhry, S.A.; Zaidi, Z.; Siddiqui, S.I. Isotherm, kinetic and thermodynamics of arsenic adsorption onto Iron-Zirconium Binary Oxide-Coated Sand (IZBOCS): Modelling and process optimization. J. Mol. Liq. 2017, 229, 230–240. [Google Scholar] [CrossRef]
  43. Mashhadi, S.; Sohrabi, R.; Javadian, H.; Ghasemi, M.; Tyagi, I.; Agarwal, S.; Gupta, V.K. Rapid removal of Hg (II) from aqueous solution by rice straw activated carbon prepared by microwave-assisted H2SO4 activation: Kinetic, isotherm and thermodynamic studies. J. Mol. Liq. 2016, 215, 144–153. [Google Scholar] [CrossRef]
  44. Patterson, A. The Scherrer formula for X-ray particle size determination. Phys. Rev. 1939, 56, 978. [Google Scholar] [CrossRef]
  45. Tavan, M.; Azizi, A.; Sarikhani, H.; Mirjalili, M.H.; Rigano, M.M. Phenolics diversity among wild populations of Salvia multicaulis: As a precious source for antimicrobial and antioxidant applications. Nat. Prod. Res. 2022, 36, 1332–1336. [Google Scholar] [CrossRef] [PubMed]
  46. Mousavi, S.V.; Bozorgian, A.; Mokhtari, N.; Gabris, M.A.; Nodeh, H.R.; Ibrahim, W.A.W. A novel cyanopropylsilane-functionalized titanium oxide magnetic nanoparticle for the adsorption of nickel and lead ions from industrial wastewater: Equilibrium, kinetic and thermodynamic studies. Microchem. J. 2019, 145, 914–920. [Google Scholar] [CrossRef]
  47. Park, D.; Yun, Y.-S.; Park, J.M. The past, present, and future trends of biosorption. Biotechnol. Bioprocess Eng. 2010, 15, 86–102. [Google Scholar] [CrossRef]
  48. Shahabuddin, S.; Tashakori, C.; Kamboh, M.A.; Korrani, Z.S.; Saidur, R.; Nodeh, H.R.; Bidhendi, M.E. Kinetic and equilibrium adsorption of lead from water using magnetic metformin-substituted SBA-15. Environ. Sci. Water Res. Technol. 2018, 4, 549–558. [Google Scholar] [CrossRef]
  49. Lung, I.; Stan, M.; Opris, O.; Soran, M.-L.; Senila, M.; Stefan, M. Removal of Lead(II), Cadmium(II), and Arsenic(III) from Aqueous Solution Using Magnetite Nanoparticles Prepared by Green Synthesis with Box–Behnken Design. Anal. Lett. 2018, 51, 2519–2531. [Google Scholar] [CrossRef]
  50. Venkateswarlu, S.; Kumar, B.N.; Prathima, B.; SubbaRao, Y.; Jyothi, N.V.V. A novel green synthesis of Fe3O4 magnetic nanorods using Punica Granatum rind extract and its application for removal of Pb(II) from aqueous environment. Arab. J. Chem. 2019, 12, 588–596. [Google Scholar] [CrossRef]
  51. Lingamdinne, L.P.; Koduru, J.R.; Rao Karri, R. Green synthesis of iron oxide nanoparticles for lead removal from aqueous solutions. Key Eng. Mater. 2019, 805, 122–127. [Google Scholar] [CrossRef]
  52. Ali, A.A.; Ahmed, I.S.; Elfiky, E.M. Auto-combustion Synthesis and Characterization of Iron Oxide Nanoparticles (α-Fe2O3) for Removal of Lead Ions from Aqueous Solution. J. Inorg. Organomet. Polym. Mater. 2021, 31, 384–396. [Google Scholar] [CrossRef]
  53. Taqui, M.; Das, S.; Kamilya, T.; Mondal, S.; Chaudhuri, S. Green synthesis of iron-oxide nanoparticles using scrap iron as precursor for the removal of Pb (II) from aqueous medium. J. Environ. Eng. Landsc. Manag. 2022, 30, 308–320. [Google Scholar] [CrossRef]
  54. Hu, R.; Wang, X.; Dai, S.; Shao, D.; Hayat, T.; Alsaedi, A. Application of graphitic carbon nitride for the removal of Pb(II) and aniline from aqueous solutions. Chem. Eng. J. 2015, 260, 469–477. [Google Scholar] [CrossRef]
  55. Tan, Y.; Chen, M.; Hao, Y. High efficient removal of Pb (II) by amino-functionalized Fe3O4 magnetic nano-particles. Chem. Eng. J. 2012, 191, 104–111. [Google Scholar] [CrossRef]
  56. Zhao, J.; Niu, Y.; Ren, B.; Chen, H.; Zhang, S.; Jin, J.; Zhang, Y. Synthesis of Schiff base functionalized superparamagnetic Fe3O4 composites for effective removal of Pb(II) and Cd(II) from aqueous solution. Chem. Eng. J. 2018, 347, 574–584. [Google Scholar] [CrossRef]
  57. Xie, Y.; Yuan, X.; Wu, Z.; Zeng, G.; Jiang, L.; Peng, X.; Li, H. Adsorption behavior and mechanism of Mg/Fe layered double hydroxide with Fe3O4-carbon spheres on the removal of Pb(II) and Cu(II). J. Colloid Interface Sci. 2019, 536, 440–455. [Google Scholar] [CrossRef] [PubMed]
  58. Yan, Y.; Yuvaraja, G.; Liu, C.; Kong, L.; Guo, K.; Reddy, G.M.; Zyryanov, G.V. Removal of Pb(II) ions from aqueous media using epichlorohydrin crosslinked chitosan Schiff’s base@Fe3O4 (ECCSB@Fe3O4). Int. J. Biol. Macromol. 2018, 117, 1305–1313. [Google Scholar] [CrossRef]
  59. Li, J.; Hu, Z.; Chen, Y.; Deng, R. Removal of Pb(II) by Adsorption of HCO–(Fe3O4)x Composite Adsorbent: Efficacy and Mechanism. Water 2023, 15, 1857. [Google Scholar] [CrossRef]
  60. Giraldo, L.; Erto, A.; Moreno-Piraján, J. Magnetite nanoparticles for removal of heavy metals from aqueous solutions: Synthesis and characterization. Adsorption 2013, 19, 465–474. [Google Scholar] [CrossRef]
Scheme 1. ET-HSAB mechanism of reactive proton OH phenolic group for green synthesis of Fe3O4 NPs based Fumaria officinalis L. plant.
Separations 10 00518 sch001
Figure 1. The ultraviolet-visible spectrum of Fumaria officinalis L. aqueous extract with green produced magnetite NPs.
Separations 10 00518 g001
Figure 2. FTIR spectrum of Fumaria officinalis L. extract and green synthesized magnetite NPs.
Separations 10 00518 g002
Figure 3. FE-SEM (a), EDX (b), and mapping (c) of green synthesized magnetite NPs.
Separations 10 00518 g003
Figure 4. XRD pattern of the green synthesized magnetite NPs using Fumaria officinalis L.
Separations 10 00518 g004
Figure 5. DPPH free radical scavenging activity of Fumaria officinalis L. compared to BHT and Vitamin C as a positive control.
Separations 10 00518 g005
Figure 6. Actual against predicted values of Pb(II) uptake capacity onto Fe3O4.
Separations 10 00518 g006
Figure 7. Response surface 3D plot of Pb(II) removal dependence on the initial concentration and contact time.
Separations 10 00518 g007
Figure 8. Response surface 3D plot of Pb(II) removal dependence on the initial concentration and temperature.
Separations 10 00518 g008
Figure 9. Response surface 3D plot of Pb(II) removal dependence on the initial concentration and pH.
Separations 10 00518 g009
Figure 10. The line plots of Langmuir (a) and Freundlich (b) isotherms (The solid lines are the linear fitting).
Separations 10 00518 g010
Figure 11. Pseudo-first-order (a) and pseudo-second-order (b) kinetic models (The solid lines are the linear fitting).
Separations 10 00518 g011
Table 1. Total phenol and flavonoid content of Fumaria officinalis L. (Papaveraceae) plant.
SampleTotal Phenol Content
(mg GAE/g dry wt)
Total Flavonoid Content
(mg QE/g dry wt)
Fumaria officinalis L.596.55 ± 0.0518.25 ± 0.05
Table 2. DPPH RSA% with IC50 of Fumaria officinalis L. at different concentrations compared to BHT and Vitamin C.
Concentration μg/mLRSA (%)
BHTVitamin CFumaria officinalis L.
20081.800 ± 0.0594.040 ± 0.0544.735 ± 0.05
40093.766 ± 0.0594.403 ± 0.0573.861 ± 0.05
60094.840 ± 0.0595.581 ± 0.05119.791 ± 0.05
800107.540 ± 0.05101.250 ± 0.05120.164 ± 0.05
IC503.182 ± 0.0518.440 ± 0.051.136 ± 0.05
Table 3. Parameters studied and test design levels for each parameter.
FactorNameUnits−α−101
AConcentrationmg/L1020304050
BContact timemin2030405060
CTemperature°C2025303540
DpH 34567
Table 4. CCD suggested run and results for Pb(II) adsorption onto X.
No. of RunConcentrationContact TimeTemperaturepHActual (qe)
(mg/L)(min)(°C) (mg/g)
1203025448.520
2203025659.460
3205025429.350
4403025485.120
54030256108.41
6405025483.150
7203035483.720
8205025640.630
9203035694.150
104030354114.48
11205035464.380
124050354110.54
133040305148.18
144050256107.16
154050356131.16
164030356134.84
17205035672.730
183040305146.93
19104030549.720
205040305143.78
213040305147.67
22302030586.660
23306030571.150
243040305149.31
25304020553.810
263040405117.96
273040305147.24
28304030367.180
293040307101.37
303040305148.56
Table 5. ANOVA for Pb(II) uptake onto Fe3O4.
SourceSSDfMSF-Valuep-Value
Model40,937.8142924.11386.1<0.0001significant
A-Concentration13,539.4113,5396418.1<0.0001
B-Contact time606.221606.22287.37<0.0001
C-Temperature5781.5115781.52740.6<0.0001
D-pH1627.8911627.9771.67<0.0001
AB288.321288.32136.67<0.0001
AC55.65155.6526.380.0001
AD139.711139.7166.23<0.0001
BC3.213.21.520.2368
BD0.036110.03610.01710.8977
CD5.9515.952.820.1137
A24613.3214613.32186.9<0.0001
B28333.1318333.13950.2<0.0001
C26748.1416748.13198.8<0.0001
D27098.9117098.93365.1<0.0001
Residual31.64152.11
Lack of Fit27.75102.783.570.0866not significant
Pure Error3.8950.7783
Cor Total40,969.429
SS = Sum of SquaresMS = Mean Square
Table 6. Optimum conditions for adsorption of Pb(II) onto Fe3O4.
Metal IonInitial Concentration (mg/L)Temperature (°C)Contact Time (min)pHAdsorption Capacity (mg/g)Max Adsorption (%)
Pb(II)3531355.5149.399%
Table 7. Isotherm results for adsorption of Pb(II) onto Fe3O4.
LangmuirFreundlich
qmaxKLRLR2Kf1/nR2
147.10.4560.0420.99448.370.370.887
Table 8. Comparison of Pb(II) adsorption capacities using some related adsorbents.
AdsorbateCharacteristicsRemoval of Pb(II)Ref.
Magnetite nanoparticles (Fe3O4) using Fumaria officinalis L. plant extractCubic shape with size of 23 nm147.1 mg/g
(1.79 mmol/g)
99%
at pH 5.5 and 25 °C
This work
Fe3O4 nanoparticles using Citrus limon aqueous peel extractNanoporous structure with a surface area of 137.4 m2/g, and particles size of 8 nm9.01 mg/g
98.8%
at pH 5.5 and 28 °C
[49]
Conventional Fe3O4 nanoparticlesNanoparticles with a surface area of 89.6 m2/g0.16 mg/g
59.4%
at pH 5.5 and 28 °C
[49]
Fe3O4 magnetic nanorods using Punica Granatum rind extractNanorods with average diameter of 40 nm and length above 200 nm46.18 mg/g
96.68%
at pH 5.0 and 28 °C
[50]
Fe3O4 nanoparticles modified with tangerine peel extractHexagonal shape with mesoporous nature 101.20 mg/g
99%
at pH 5.0 and 25 °C
[51]
Iron Oxide Nanoparticles (hematite, α-Fe2O3)Aspherical and aspherical-like shaped with a size of 36 nm29.93 mg/g
97.5%
at pH 5.5 and 25 °C
[52]
Magnetic Fe3O4 nanoparticlesNanoparticles with a size of 31 nm and surface area of 46.856 m2/g68.07 mg/g
98%
at pH 5.7 and 25 °C
[53]
Graphitic carbon nitrideg-C3N4 contains small flat sheets with irregular wrinkles with a surface area of 150.5 m2/g and a pore diameter of 16.39 nm65.6 mg/g
at pH 5.0 and 25 °C
[54]
Amino-functionalized Fe3O4 magnetic nanoparticlesSpherical particles with a size of 50–100 nm and a mean diameter of 78.7 nm40.10 mg/g
98%
at pH 5.0 and 25 °C
[55]
Schiff base functionalized Fe3O4Uniform spherical morphology with lattice fringes spacing of 0.297–0.485 nm and surface area of 42.02 m2/g0.56 mmol/g
98%
at pH 6.0 and 25 °C
[56]
Layered double hydroxide loaded with magnetic (Fe3O4) carbon spheresSmall plate-like units with surface area of 4.38 m2/g3.66 mmol/g
at pH 6.3 and 298 K
[57]
Epichlorohydrin crosslinked chitosan Schiff’s base@Fe3O4Spherical particles with about 10 and 50 nm in size86.20 mg/g
97%
at pH 4.0 and 25 °C
[58]
Table 9. Kinetic results for adsorption of Pb(II) onto Fe3O4.
First Order KineticSecond Order Kinetic
qek1R2qek2R2
139.660.0670.800149.250.000670.990
Disclaimer/Publisher’s Note: The statements, opinions and data contained in all publications are solely those of the individual author(s) and contributor(s) and not of MDPI and/or the editor(s). MDPI and/or the editor(s) disclaim responsibility for any injury to people or property resulting from any ideas, methods, instructions or products referred to in the content.

