Abstract
A novel liquid chromatography-tandem mass spectrometry (LC-MS/MS) method has been developed and validated for the simultaneous determination of tipiracil (TIP), trifluridine (FTD), and their metabolites, 5-trifluoromethyluracil (FTY) and 5-carboxy-2′-deoxyuridine (5CDU), in rat plasma. This method is highly sensitive, specific, and fast. Paracetamol (PAR) is used as an internal standard (IS). Using acetonitrile-induced protein precipitation, the analytes were extracted from a plasma sample and separated on a Waters BEH C18 (1.7 μm particle size, 50 mm × 2.1 mm ID) column protected by a security guard cartridge (C18, 4 × 2.0 mm). The isocratic mobile phase was made up of methanol and water containing 0.1% formic acid (80:20, v/v) at a flow rate of 0.5 mL/min for 4 min. The quantification was performed using a positive electrospray ionization (ESI) interface and a multiple-reaction monitoring (MRM) mode. The MRM transitions employed were m/z 242.96 → 182.88 for TIP, 296.96 → 116.86 for FTD, 180.98 → 139.85 for FTY, 272.96 → 156.86 for 5CDU, and 151.97 → 92.68 for IS. The validated method complied with the guidelines set by the US-FDA over on a linear concentration range of 5–4000 ng/mL for FTD, FTY, and 5CDU, and 5–1000 ng/mL for TIP. The coefficient of determination (r2) was equal to or greater than 0.997. The corresponding lower limits of detection (LLOD) were 1.5 ng/mL for FTD, FTY, and 5CDU and 1.0 ng/mL for TIP. The recoveries of all analytes from rat plasma ranged from 88.67% to 112.18%, and the mean relative standard deviation (RSD) of accuracy and precision result was less than or equal to 6.84%. FTD, FTY, 5CDU, and TIP demonstrated adequate stability throughout the various circumstances examined. Additionally, no matrix effects were identified for any of the analytes. The assay was effectively utilized to conduct a pharmacokinetic study in rats following the oral administration of FTD and TIP at a dosage of 5.6 mg/kg, with a ratio of 1:0.5 for FTD and TIP, respectively. This indicates that the suggested approach is suitable for future clinical research. The pharmacokinetic parameters Cmax (maximum concentration), Tmax (time to reach maximum concentration), t1/2 (half-life), AUC0-24 (area under the concentration–time curve from 0 to 24 h), AUC total (total area under the concentration–time curve), Ke (elimination rate constant), Vd (volume of distribution), and CL (clearance) of all analytes were assessed. The assay developed exhibits significant advancements compared to earlier bioanalytical methods documented in the literature. These improvements include high sensitivity, specificity, and efficacy in high throughput analysis of complex matrices. Additionally, the assay offers a shorter run time and smaller sample volume (50 μL).
Keywords:
LC-MS/MS; tipiracil; trifluridine; metabolites; colorectal cancer; rat plasma; pharmacokinetic 1. Introduction
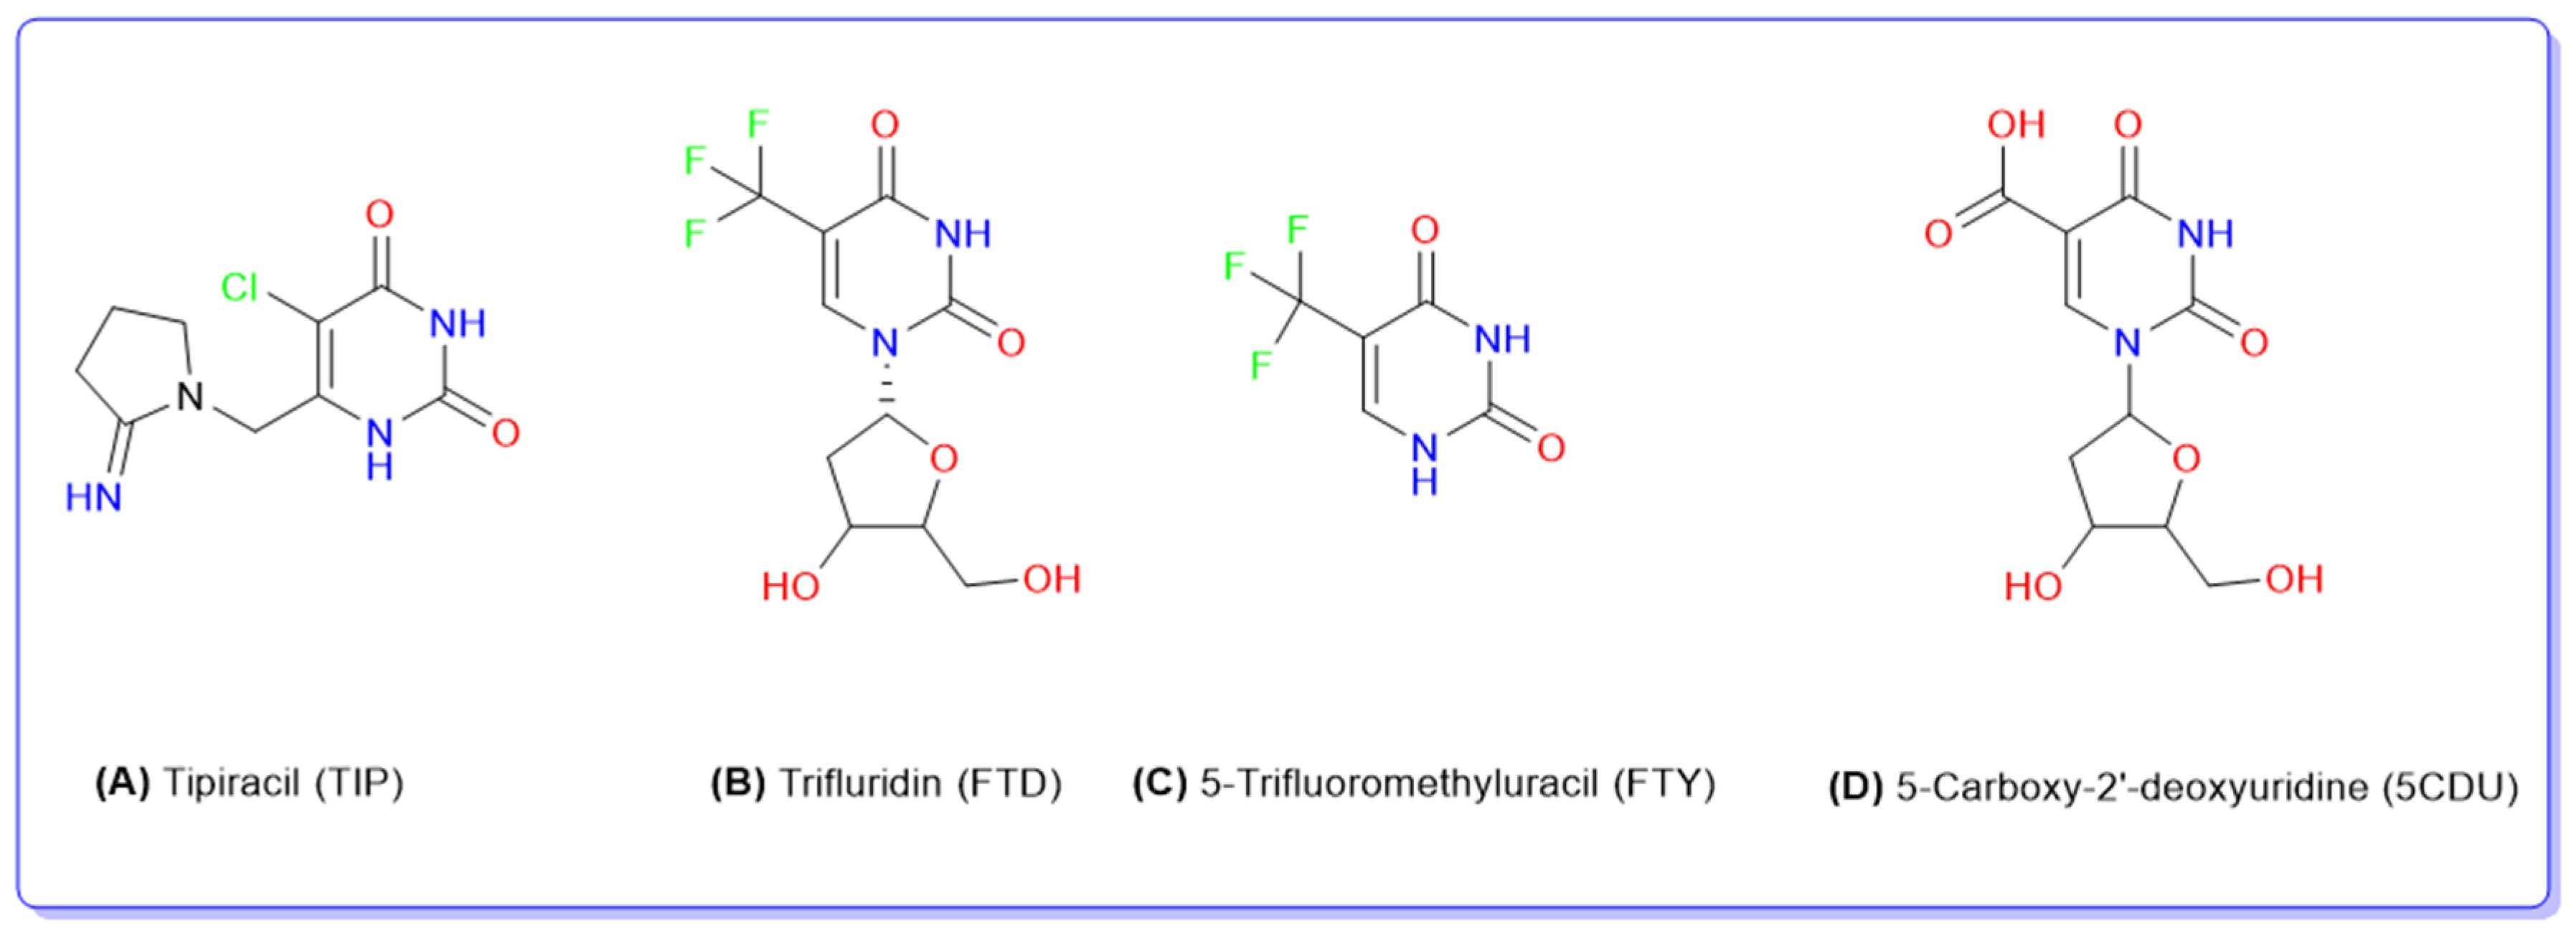
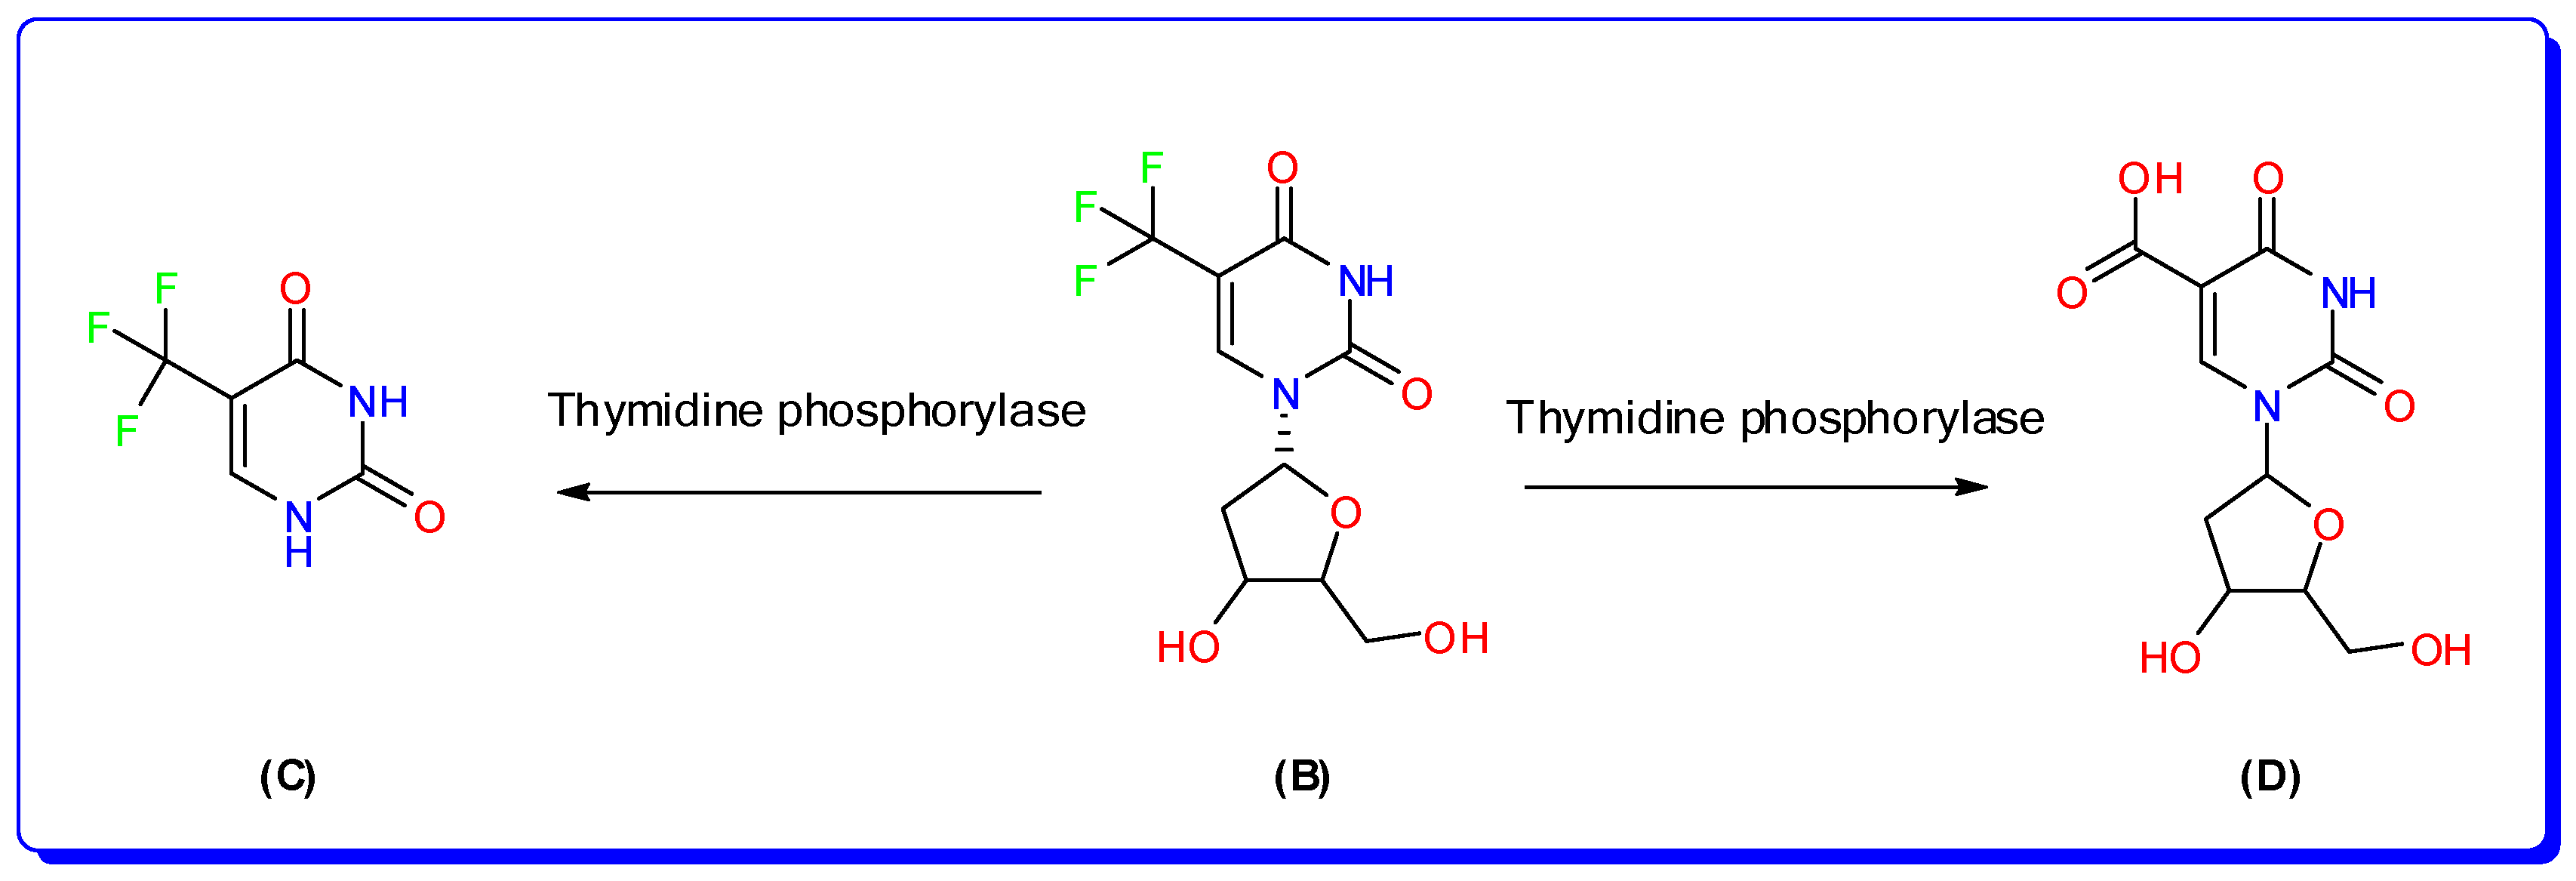
Trifluridine/tipiracil (Lonsurf®; Taiho Oncology, Taiho Pharmaceutical Co., Ltd. Tokyo, Japan.) is an orally taken cytotoxic drug that has been approved for the treatment of patients with advanced colorectal cancer (CRC) who have become unresponsive to other therapies [1]. Colorectal cancer (CRC) accounts for 10% of all cancer cases globally and is the third most common cancer in males and the second most common cancer in women [2]. Trifluridine (FTD; 2′-deoxy-5-(trifluoromethyl) uridine; [Mwt] 296.20 g/mol, (Figure 1), is an antivirus thymine derivative drug; it was approved for medical use in 1980 to treat primary herpes simplex keratoconjunctivitis [3]. FTD functions as an anticancer agent by being incorporated into DNA during the process of DNA synthesis, hence impeding the proliferation of tumor cells. Thymidine kinase quickly adds a phosphate group to it, turning it into its active form called TF-TMP. This active form easily attaches itself to tyrosine 146 in the active site of thymidylate synthase (TS), which stops the enzyme from working properly [4]. The primary method of elimination was by metabolism via thymidine phosphorylase (TPase), resulting in the formation of an inactive metabolite called 5-Trifluoromethyl-2,4(1H,3H)-pyrimidinedione (FTY), which was the major metabolite, and 5-carboxy-2′-deoxyuridine (5CDU) as a minor metabolite [5] as represented in Figure 2.
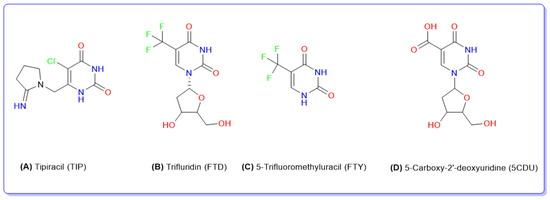
Figure 1.
Chemical structures of tipiracil (A), trifluridine (B), 5-trifluoromethyluracil, (C) and 5-carboxy-2′-deoxyuridine (D).
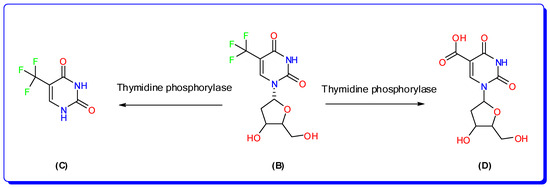
Figure 2.
Metabolic pathways of trifluridine in human; trifluridine (B), 5-trifluoromethyluracil, (C) and 5-carboxy-2′-deoxyuridine (D).
After administering a single 60 mg tablet of Lonsurf®, the average cumulative urine excretion of unaltered FTD was 1.5%, FTY was 19.2%, and unchanged tipiracil was 29.3% within 48 h [6]. The primary route of elimination for FTD is through metabolism by TPase, resulting in the production of the major metabolite FTY, which is then eliminated in the urine. On the other hand, tipiracil is primarily excreted in unchanged form in the urine [6]. Tipiracil (TIP), with a molecular weight of 279.12 g/mol (Figure 1), is a compound that inhibits the breakdown of FTD by TPase when administered orally.
The monitoring of plasma concentrations of anticancer medications holds significant potential. Drug monitoring enables dose adjustment to enhance effectiveness and minimize treatment-related side effects. This can be accomplished through the advancement and refinement of sophisticated and highly responsive analytical techniques. The predominant instrumentation employed in this methodology is LC-MS/MS, utilizing a triple quadrupole mass spectrometer [7,8,9]. LC-MS/MS has emerged as a powerful separation technique utilizing various separation approaches. It offers distinct benefits in terms of precision, heightened responsiveness, and effectiveness, requiring lower sample volume, less solvent usage, and rapid analysis. These advantages enable the identification of medicines in biological samples even when metabolites are present [10].
Estimating FTD, FTY, 5CDU, and TIP in biological fluids is a challenging task due to the diverse physical and chemical properties of these analytes, as well as their distinct pharmacokinetic profiles. Only a limited number of analytical approaches have been documented for the quantification of FTD and TIP. RP-HPLC techniques with UV detection were developed to quantify FTD and TIP in capsules, tablets, and bulk form [11,12,13,14,15,16,17,18]. Nevertheless, the methods that were reported utilized a linear range of 2.5–15 μg/mL and were also time-consuming. FTD, FTY, and TPI measurement in biological fluids using HPLC-UV techniques has only been published in two papers [19,20]. These methods utilized liquid–liquid extraction for FTD/FTY and solid-phase extraction for TPI. They were laborious and time-consuming. Furthermore, the assay described in reference [19] utilized a larger plasma volume of 500 μL, a longer analytical run time of 8 min, and a greater lower limit of quantification (LLOQ). These factors may potentially decrease the sensitivity and suitability of the test for accurately measuring plasma concentration in advanced cancer patients. Hence, it is imperative to devise a proficient and exceedingly responsive bioanalytical technique for the simultaneous quantification of TIP and FTD in the presence of their metabolites.
After conducting a thorough assessment of the existing literature, it has been found that there is currently no bioanalytical LC-MS/MS method available for simultaneously analyzing the combination of TIP and FTD, along with their metabolites FTY and 5CDU, in rat plasma. The objective of this study is to create, refine, and thoroughly validate a bioanalytical technique using LC-MS/MS that can accurately measure the levels of these drug combinations in rat plasma. In addition, this thoroughly verified created technique was effectively utilized for the pharmacokinetic study in rats following the oral administration of FTD and TIP. The newly developed LC-MS/MS approach offers several advantages over previous methods, including a short run time of 4 min, a significantly smaller sample volume of 50 µL, cost-effective sample preparation using protein precipitation extraction, and minimal solvent use.
2. Experimental
2.1. Chemical and Reagents
Toronto Research Chemicals (Toronto, ON, Canada) provided reference standard samples of FTD, TPI, FTY, and 5CDU (purity > 99%). The Paracetamol reference standard, with a purity level exceeding 99%, was acquired from the Amoun Pharmaceutical Company located in El-Obour City, Cairo, Egypt. This standard serves as the internal standard (IS). The mobile phases were prepared using HPLC-grade solvents, specifically acetonitrile and methanol, obtained from Panreac in Barcelona, Spain. Additionally, Sigma Aldrich and Chemic GmbH (Steinem, Germany) provided acetic acid, ammonium acetate, formic acid, and trifluoroacetic acid. The Ultrapure water was obtained via the Ultrapure water Milli-Q Advantage water purification system, which utilizes a 0.22 μm filter manufactured by Millipore in Molsheim, France. The study utilized male Wistar rats with a healthy condition, weighing around 250 ± 30 g. These rats were obtained from the experimental animal care department located in the college of pharmacy at King Saud University in Saudi Arabia.
2.2. LC-MS/MS System
The process of chromatographic separation was carried out using a Waters® Acquity Ultra Performance LC system from Milford, USA. The system included a sample manager (Acquity Ultra Performance LC/model code UPA, serial # K08UPA 993M, product of USA, Waters Corporation, Milford, MA, USA) and a Binary Solvent Manager (Acquity Ultra Performance LC/model code UPA, serial # C08UPA 634M, product of USA, Waters Corporation, Milford, MA, USA). The instrument was equipped with electrospray ionization spectrometry (Zspray™ ESI- APCI-ESCI, Acquity Ultra Performance LC) and utilized multiple reaction monitoring (MRM) mode. It employed a triple-quadrupole mass spectrometer detector (STEP WAVE™, Ultra Performance LC/TQ Detector/model code TQD, serial # QBA489). The process of sample filtration was carried out by utilizing disposable syringe filters (CHROMAFIL Xtra PA-20/25 polyamide filter) with a pore size of 0.22 µm and a filter size of 25 mm. These filters were obtained from MACHEREY NAGEL, GmbH & Co, KG. located in Duren, Germany. The samples were separated using a reversed phase Acquity® UPLC BEH C18 column (50 mm × 2.1 mm ID, 1.7 μm particle size). The separation was performed in isocratic mode. The mobile phase consisted of a mixture of methanol and water with 0.1% formic acid (80:20, v/v). The column temperature and autosampler were maintained at a constant value of 25 °C. The injection volume was 5 µL using the full loop mode, with a constant flow rate of 0.5 mL/min. The overall duration was 4 min. A strong washing solution consisting of a mixture of water, methanol, and acetonitrile at a ratio of 1:1:1 (v/v/v) was prepared and employed both before and after the injection procedure to ensure complete removal of any potential residue. The drugs under investigation, namely FTD, FTY, 5CDU, and TIP, were subjected to electrospray ionization (ESI) in positive ion mode. Various MS parameters, such as impact energy, capillary voltage, and cone voltage, were individually tuned for each analyte. The temperature used was 150 °C. The desolvation gas employed was nitrogen, flowing at a rate of 800 L/h. The collision gas flow rate was set to 0.15 mL/min, while the cone gas flow rate was set to 150 L/h. A uniform dwell period of 0.025 s was employed for all compounds. The MS analyzer was configured with a low mass (LM) resolution of 2.8 and a high mass (HM) resolution of 14.86 for both ion energy 1 and 2. The acquisition was conducted with multiple reaction monitoring (MRM) to measure each analyte by tracking the transitions from protonated precursor ions [M + H]+ to specific daughter ions. The precursor with the highest abundance is m/z 242.96 → 182.88 for TIP, followed by 296.96 → 116.86 for FTD, 180.98 → 139.85 for FTY, 272.96 → 156.86 for 5CDU, and 151.97 → 92.68 for IS. The data were obtained and analyzed using the Masslynx™ version 4.1 software (Micromass, Manchester, UK).
2.3. Preparation of Calibration Curve and Quality Control (QC) Samples
The stock solutions of FTD, FTY, 5CDU, TIP, and IS were made separately as standards and quality controls (QC) with a concentration of 100 µg/mL. This was achieved by dissolving 10 mg of each analyte in 50 mL of warm ultrapure water and then filling a 100 mL volumetric flask with ultrapure water to reach the desired volume. The stock solutions were held at a temperature of −80 °C. Individual working standard solutions of these drugs were generated by diluting the aforementioned stock solution with ultrapure water to a concentration of 5.0 µg/mL. The solutions remained stable for one month when stored in a refrigerator at −20 °C. The FTD, FTY, 5CDU, and TIP working standard solutions with a concentration of 5.0 µg/mL were added to a pool of rat plasma that did not contain any substances of interest. This mixture was then diluted with ultrapure water to make eight calibration standards. The concentration ranges for FTD, FTY, and 5CDU were 5–4000 ng/mL, while the concentration range for TIP was 5–1000 ng/mL. The calibration ranges for all analytes were selected based on the drug concentrations in rats. The quality control (QC) standards were prepared using the same methodology at four different concentration levels: the lower limit of quantification (LLOQ), lower QC (LQC), medium QC (MQC), and high QC (HQC). The concentration levels for FTD, FTY, and 5CDU were 5, 15, 2000, and 3900 ng/mL, respectively. For TIP, the concentration levels were 5, 15, 500, and 950 ng/mL. The approach was validated using an adequate number of calibration and quality control standards. Three levels of controls were established, namely Low Quality Control (LQC), Medium Quality Control (MQC), and High Quality Control (HQC). The samples were kept at a temperature of −20 °C.
2.4. Sample Preparation
The protein precipitation method was employed for sample extraction. Prior to examination, rat plasma samples were thawed at ambient temperature. Rat plasma (50 μL) was mixed with different amounts of the working standard solutions (5 µg/mL) of FTD, FTY, 5CDU, and TIP to create concentrations of 5, 15, 100, 500, 1000, 1500, 2000, and 4000 ng/mL for FTD, FTY, 5CDU, and 5, 15, 50, 100, 250, 500, 750, and 1000 ng/mL for TIP. Additionally, 50 µL of a working internal standard (IS) solution was added to achieve concentrations of 500 ng/mL in 2.0 mL disposable polypropylene microcentrifuge tubes. Every tube was diluted to a volume of 1200 μL using ultrapure water and then thoroughly mixed for a minimum of 30 s. Deproteinization of the mixture was achieved by adding 500 μL of acetonitrile. The tubes were then subjected to high-speed vortexing for one minute and subsequently centrifuged at 6000 rpm for 30 min. The liquid portion was moved to sterile Eppendorf tubes and then subjected to evaporation at 40 °C using a mild flow of nitrogen until completely dried. The dry extracts were dissolved in 100 µL of the mobile phase, filtered, and placed into the autosampler tray. Subsequently, a 5 μL aliquot of the supernatant was introduced into the LC-MS/MS apparatus to perform quantitative analysis. Plasma samples that did not include FTD, FTY, 5CDU, TIP, or the internal standard (IS) were processed in a similar manner.
2.5. Pre-Study Validation
The complete method validation protocol for this LC-MS/MS assay, which includes assessing linearity, accuracy, precision, selectivity, carry-over, recovery, matrix effect (ME), and stability, was compiled in accordance with the recommendations provided by the US Food and Drug Administration (FDA) [21].
The method’s selectivity and specificity were assessed by analyzing six distinct batches of rat plasma from six individual animals. This analysis included samples without the analyte and internal standard (double blank samples), samples with only the internal standard (blank samples), and samples with the lowest limit of quantification (LLOQ) along with the internal standard. The purpose of this analysis was to demonstrate that there was no interference from endogenous plasma components in the chromatography. The LLOQ (lowest limit of quantification) was established by identifying the concentration at which the precision, as measured by the relative standard deviation (RSD), is less than 20%, and the accuracy falls within the range of 80% to 120% of the theoretical value [21].
The linearity of the method was evaluated by analyzing the calibration curves of FTD, FTY, 5CDU, and TIP, which were made in duplicate. The calibration standards were examined separately at the start and the end of the analytical batch. The calibration curves were created in rat plasma by plotting the peak area ratio of the analytes’ transition pair with that of the internal standard (IS) against the nominal concentration of the calibration standards. The concentrations utilized were 5, 15, 100, 500, 1000, 1500, 2000, and 4000 ng/mL for FTD, FTY, and 5CDU. For TIP, the concentrations employed were 5, 15, 50, 100, 250, 500, 750, and 1000 ng/mL. The lower limit of quantification (LLOQ) was determined as the minimum concentration exhibiting a signal-to-noise ratio of 10 or above, with a precision not exceeding 20% of the relative standard deviation (RSD), and an accuracy within ±20%. The linearity of the data was assessed by calculating the squared correlation coefficient (r) and determining the least-squares regression line. A correlation coefficient (r) equal to or greater than 0.997 was necessary.
A carry-over (residual) effect is defined as the effect of treatment on the response from the previous time point to the current time point. It occurs when the effect of a treatment administered at the initial time point persists into the next period and distorts the effect of the subsequent treatment. The carry-over effect on subsequent runs was assessed by sequentially injecting the following samples: plasma with no analyte, plasma with the lowest limit of quantification (LLOQ), plasma with no analyte, plasma with the highest limit of quantification (ULOQ), and lastly plasma with no analyte.
To evaluate accuracy and precision, we used four different quality control (QC) levels: lower limit of quantification (LLOQ), lower QC (LQC), medium QC (MQC), and high QC (HQC). These levels were set at 5, 15, 2000, and 3900 ng/mL for FTD, FTY, and 5CDU, and at 5, 15, 500, and 950 ng/mL for TIP. To assess the precision and accuracy of the assay, we analyzed six replicates of each QC level on three separate days. Relative standard deviations (RSDs) were computed to assess both the precision within a single day and the precision across several days. The recovery of each analyte from the current protein precipitation technique was assessed by comparing the peak regions of each analyte and internal standard (IS) in two samples. Recovery was assessed by comparing processed samples (HQC, MQC, and LQC, n = 6) to the reference FTD, FTY, 5CDU, and TIP solutions in blank rat plasma collected at the same quantities. The extraction recovery values were quantified as a percentage (%).
The LC-MS/MS system’s ESI interface can encounter ion suppression, caused by endogenous substances present in the biological sample matrix. This phenomenon is referred to as the matrix effect (ME), which has the potential to impact essential analytical parameters such as limit of detection (LOD), limit of quantification (LOQ), linearity, accuracy, and precision. Hence, it is imperative to thoroughly examine ME during the method development and validation [22,23,24]. The post-extraction spiked method was employed to accurately measure and quantify the extent of matrix effect (ME) on the LC-MS/MS method that was developed. The impact of plasma components on the ionization of FTD, FTY, 5CDU, TIP, and the IS was assessed by comparing the responses of the post-extracted plasma standard QC samples (A) with the response of the pure analyte solutions in the mobile phases (B) at the same concentrations [23]. The plasma samples were enriched with FTD, FTY, 5CDU, and TIP at three different concentration levels, which spanned the linear range of 15, 2000, and 3900 ng/mL for FTD, and 15, 500, and 980 ng/mL for FTY, 5CDU, and TIP, respectively. The internal standard (IS) was present at a concentration of 500 ng/mL. The ratio, expressed as A divided by B multiplied by 100, is defined as ME.
The assessment of dilution integrity involved diluting plasma samples with high concentrations that beyond the linear range of the established method. This was done to determine the impact on the recoveries of FTD, FTY, 5CDU, and TIP. Plasma samples were enriched with high concentrations of 6000 ng/mL for FTD, FTY, and 5CDU, and 1500 ng/mL for TIP. These enriched samples were then diluted with blank plasma samples using dilution factors of 1:2 and 1:4. The diluted samples were subsequently processed according to the instructions provided in the sample preparation Section 2.4. The stability of the analytes was assessed by doing six duplicates at the LQC and HQC levels, utilizing a calibration curve that was produced immediately prior to the experiment. The stock solutions’ stability was assessed by quantifying the concentrations of analytes following a 30-day storage period at a temperature of −80 °C. The stability of FTD, FTY, 5CDU, and TIP in the plasma samples was assessed using the same conditions as the study samples. The freeze-thaw stability was assessed by exposing the quality control (QC) samples to three cycles of freezing (at −80 °C) and thawing (at room temperature). The quality controls (QCs) were subjected to ambient temperature for a duration of 6 h and thereafter stored at a temperature of −80 °C for a period of 30 days in order to conduct short-term and long-term stability tests, respectively. For the samples to be deemed stable, the test readings needed to fall within the permitted levels of accuracy (±15% standard deviation) and precision (≤15% relative standard deviation) [21].
2.6. Application to Pharmacokinetic Study
Prior to the studies, four male Wistar rats in good health, 8 weeks old and weighing 250 ± 30 g, were obtained from King Saud University’s Animal Care Center in Saudi Arabia and housed in a typical laboratory setting. The King Saud University Institutional Research Ethics Committee (REC) rules, which were reviewed in compliance with all experimental methods, were issued with an ethics reference number (KSU-SE-18–18). The rats were given an oral mixture of TIP and FTD saline solution. Meeh’s formula [25] converts a dose of 35 mg/m2 at a ratio of 1:0.5 FTD and TIP to 5.6 mg/kg. Blood samples (approximately 300 μL) were collected into 1.5 mL polythene tubes containing ethylenediamine tetraacetic acid dipotassium (EDTA K2), (anticoagulant), before drug administration, and at thirty minutes, one, two, four, six, eight, ten, twelve, and twenty-four hours later, the samples were collected into lithium heparinized tubes, which were placed in ice water. The samples underwent an instantaneous centrifugation at 4500 rpm for ten minutes at 4 °C. The plasma samples were then stored at −80 °C until examination. Sample preparation followed the same extraction procedure as outlined in calibration standards preparation (Section 2.4). The pharmacokinetic parameters of the analytes under study were determined using the non-compartmental analysis (NCA) model and the PK Solver Add-In software [26]. The area under curve zero to last and infinity (AUC0–24; AUC0–∞), maximum plasma concentration (Cmax), time to achieve this (Tmax), half-life (T½), elimination rate constant (Kel), and mean residence time were measured.
3. Results and Discussion
3.1. Method Development and Optimization
3.1.1. Liquid Chromatography
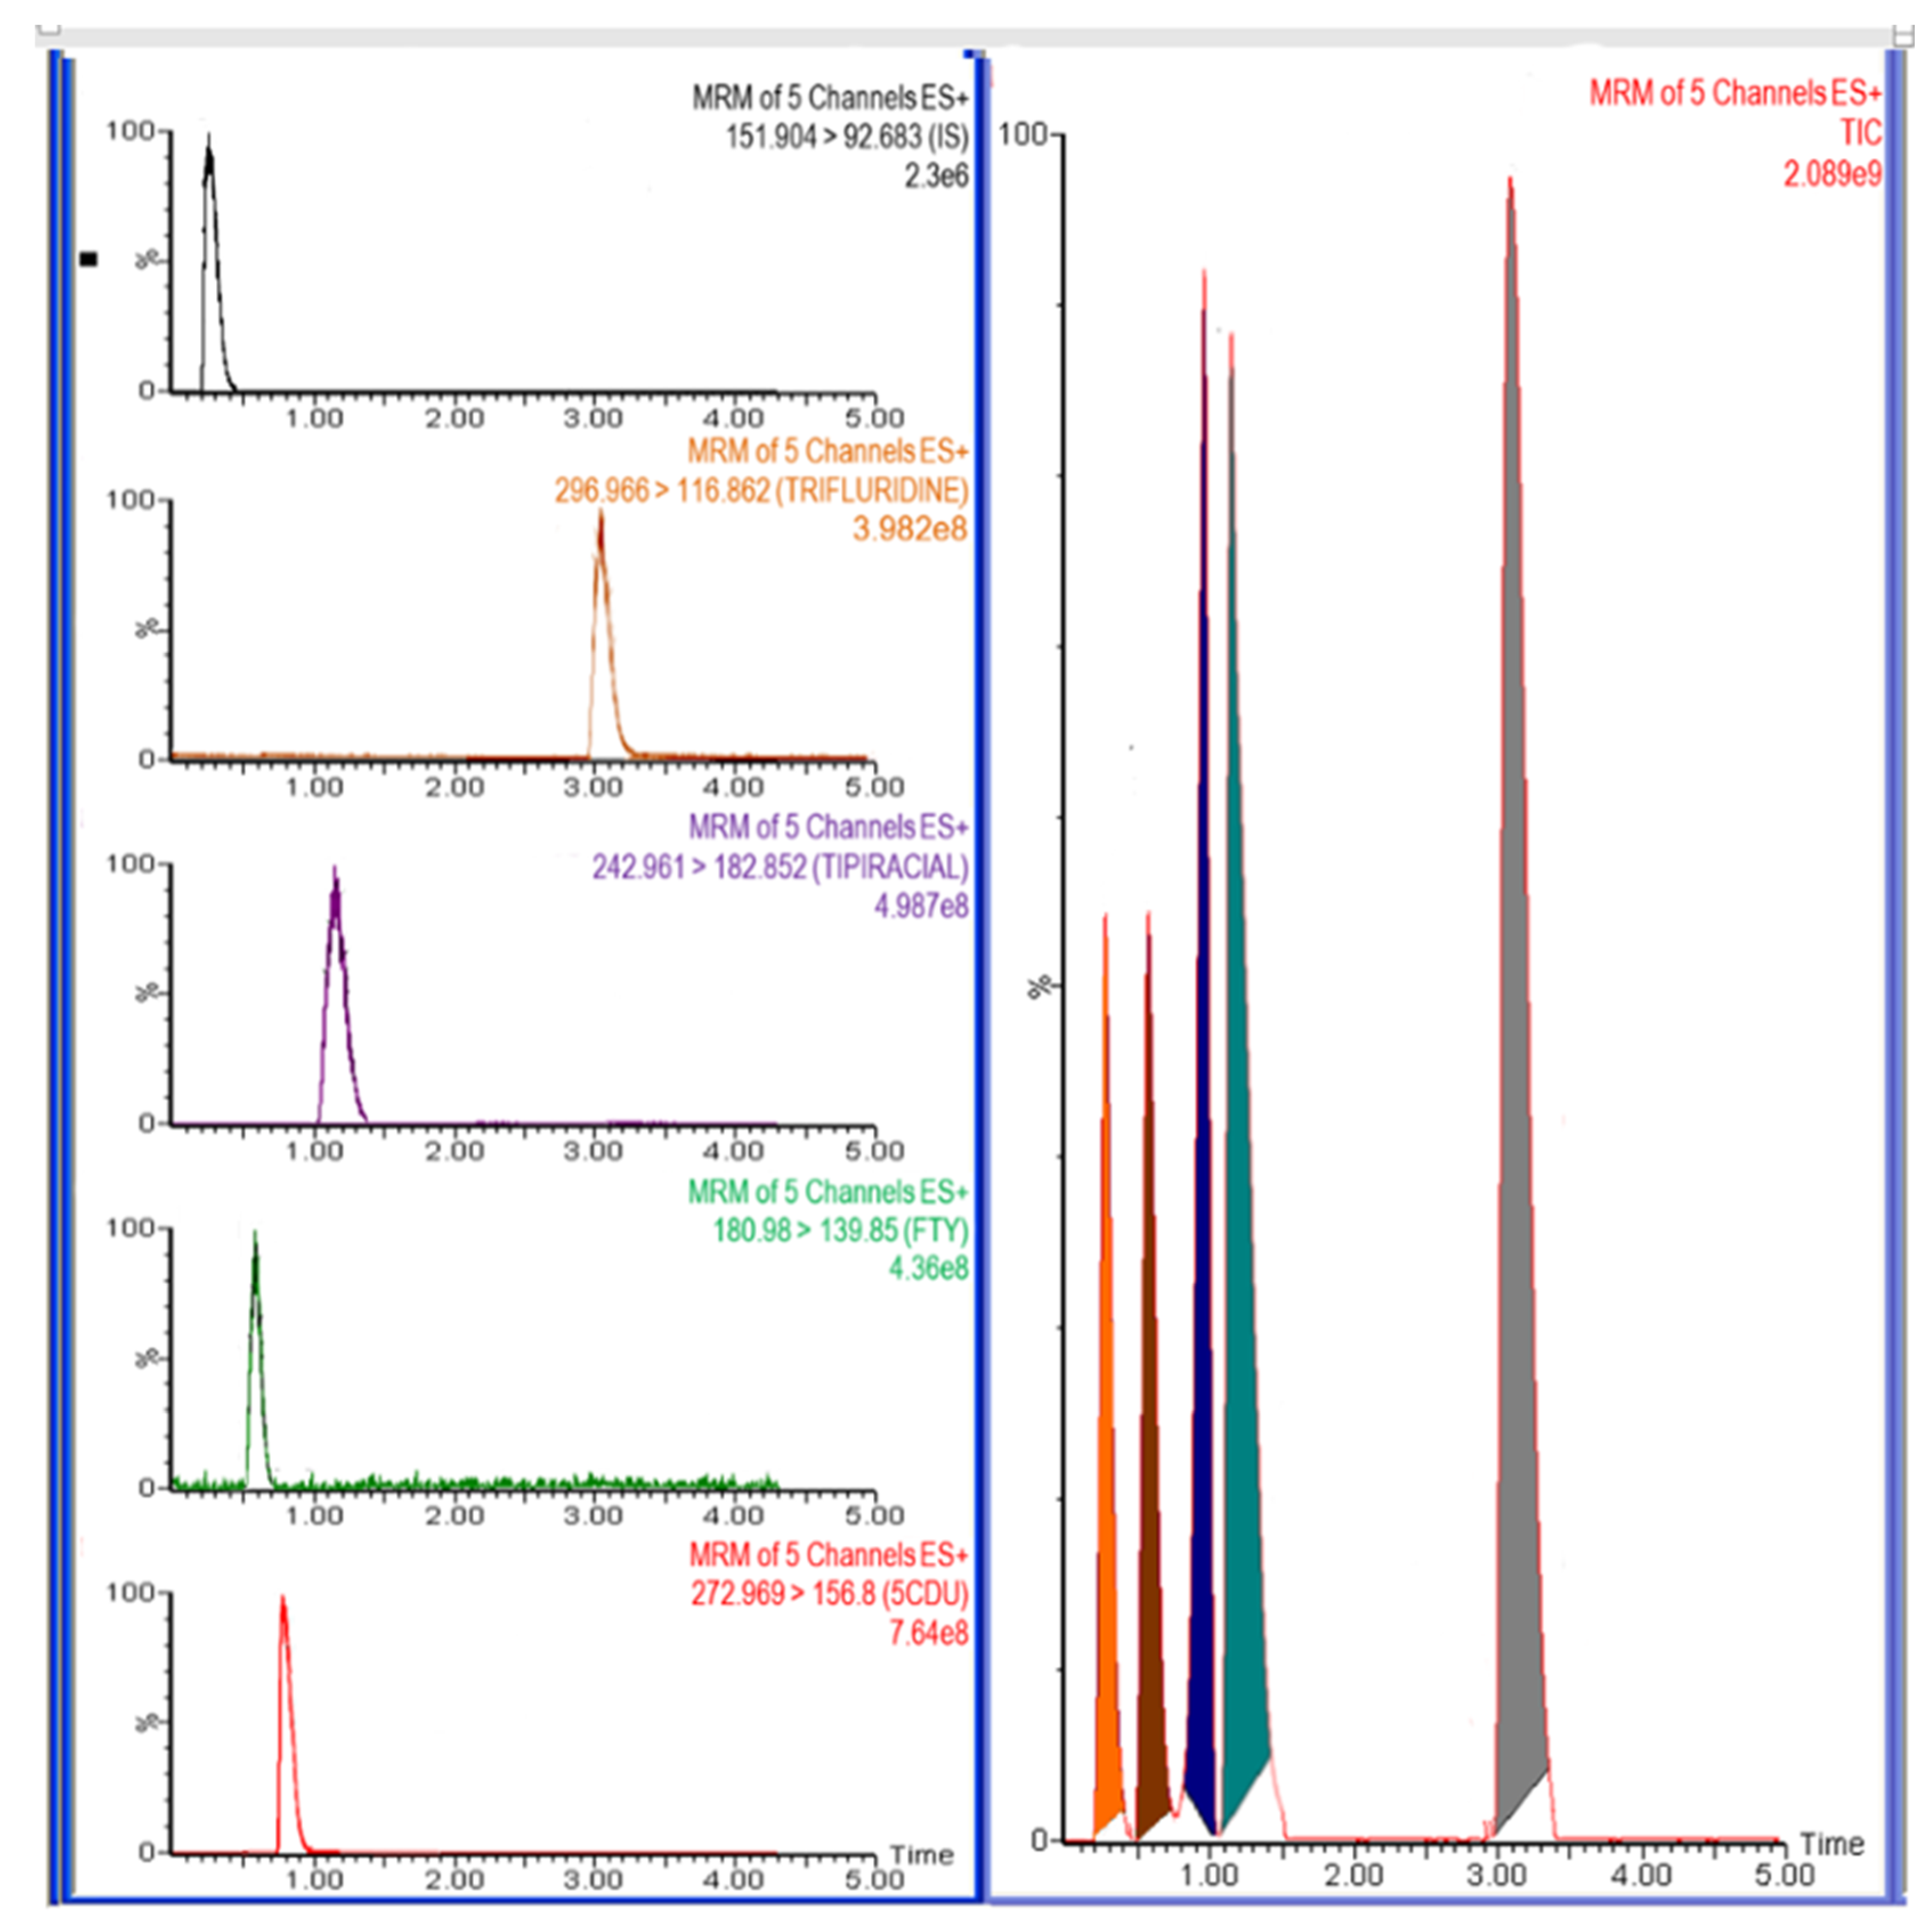
In order to account for the complicated internal components present in plasma, it was imperative to achieve a more refined chromatographic separation and enhanced resolution throughout the LC optimization process. The LC conditions were optimized using the standard mixture of FTD, FTY, 5CDU, and TIP. At first, the FTD exhibited an increase in the width of its peak on the Waters XBrige C18 column (50 mm × 2.1 mm, 3.5 μm) when acetonitrile was used as the organic phase. No detectable peaks were seen for FTY and 5CDU when acetonitrile was used. To enhance the widening peak, one could employ the Acquity UPLC BEH™ C18 (2.1 × 50 mm, 1.7 μm) column and best separation with high efficiency at an isocratic elution mode. The chromatographic optimization of the studied analytes was conducted using several mixtures of solvents as the mobile phase, such as acetonitrile and methanol with water, and those including 0.1% formic, 0.1% trifluoroacetic acid, 0.1% acetic acid, or 10 mM ammonium acetate and tested about peak shape and area and response and analysis time. By adding a trace amount of formic acid (0.05%) to the mobile phase of methanol with water (1:1, v/v), both the peak shapes and the separation efficiency can be well improved. Furthermore, this trace quantity of formic acid can rarely have an impact on the positive MS mode detection sensitivity. In addition, we investigated the best ratio of methanol by using different methanol percentages (30–90%), which indicated the best separation and retention time were obtained by the ratio of methanol 80%. Furthermore, formic acid in different concentrations 0.05, 0.10, and 0.15% were studied on the retention time and shape of the peaks where the retention time of all drugs decreased with increasing formic acid in the mobile phase and 0.1% given the sharp FTY and TIP peaks and some tailing for FTY and FTD were apparent with 0.15% formic acid. A mobile phase consisting of methanol and 0.1% formic acid in water (v/v) was given the best separation and peak shape for FTD, FTY, 5CDU, and TIP. In addition, different flow rates ranging from 0.1 to 1 mL/min were also assessed to achieve better resolution, and 0.5 mL/min was set as the final choice. We investigated the use of different internal standards such as venetoclax, nateglinide, repaglinide, cytarabine, glasdegib, and decitabine, but such internal standards either showed poor peaks or led to overlapping with FTD, FTY, 5CDU, and TIP. Paracetamol was selected as the method’s IS, whereas it has a higher extraction recovery (≥94%) and performance characteristics for FTD, FTY, 5CDU, and TIP [21]. Based on the result, the optimum responses were observed with 0.1% formic acid. The separation of the studied drugs was performed with an isocratic elution using an Acquity UPLC BEH™ C18 (2.1 × 50 mm, 1.7 μm) column with a mobile phase of methanol and water (80:20, v/v) containing 0.1% formic acid with a flow rate of 0.5 mL/min and column temperature of 25 °C for a total run time of 4 min; the peaks obtained were sharp and symmetric, wherein FTD eluted at 2.88 ± 0.24 min, FTY at 0.49 ± 0.11 min, 5CDU at 0.79 ± 0.08 min, TIP at 1.09 ± 0.08 min, and the IS at 0.27 ± 0.07 min. The chromatographic separations of FTD, FTY, 5CDU, TIP, and IS are shown in Figure 3.
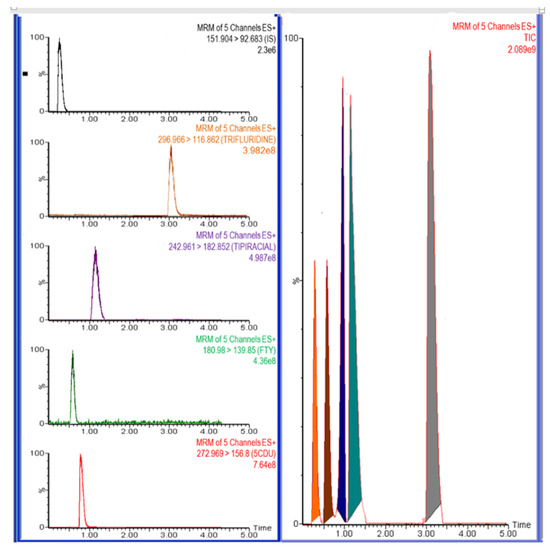
Figure 3.
Representative LC-MS/MS chromatograms of trifluridine (2.88 min), 5-trifluoromethyluracil (0.50 min), 5-carboxy-2′-deoxyuridine (0.71 min), tipiracil (1.00 min), paracetamol, and IS, (0.21 min).
3.1.2. Mass Spectrometry
Needle pump injection with individual standard of FTD, FTY, 5CDU, TIP, and IS in both positive and negative ionization was utilized to obtain the most suitable response of the parents and the main products of the drugs, where the best analyte signal was obtained in positive mode. Consequently, the positive ionization mode was used to obtain both the precursor and daughter for FTD, FTY, 5CDU, TIP, and IS. Different optimization of MS/MS condition of source temperature and the desolvation gas flow rate was tested to obtain the highest intensity of protonated molecular ions, which found the 150 °C was the best ESI source temperature, and the best desolvation gas flow rate was 800 L/h. Likewise, the collision energy and cone voltage are a critical effect on the responses of the daughter fragment ions because an increase or a decrease from an optimum value tends to a reduction in intensity. The values of collision energy and cone voltage that produced maximum intensities of the selected daughter ions of FTD, FTY, 5CDU, TIP, and IS are summarized in Table 1.

Table 1.
Optimized mass parameters and m/z transitions for tipiracil (TIP), trifluridine (FTD) 5-trifluoromethyluracil (FTY), 5-carboxy-2′-deoxyuridine (5CDU), and paracetamol (IS).
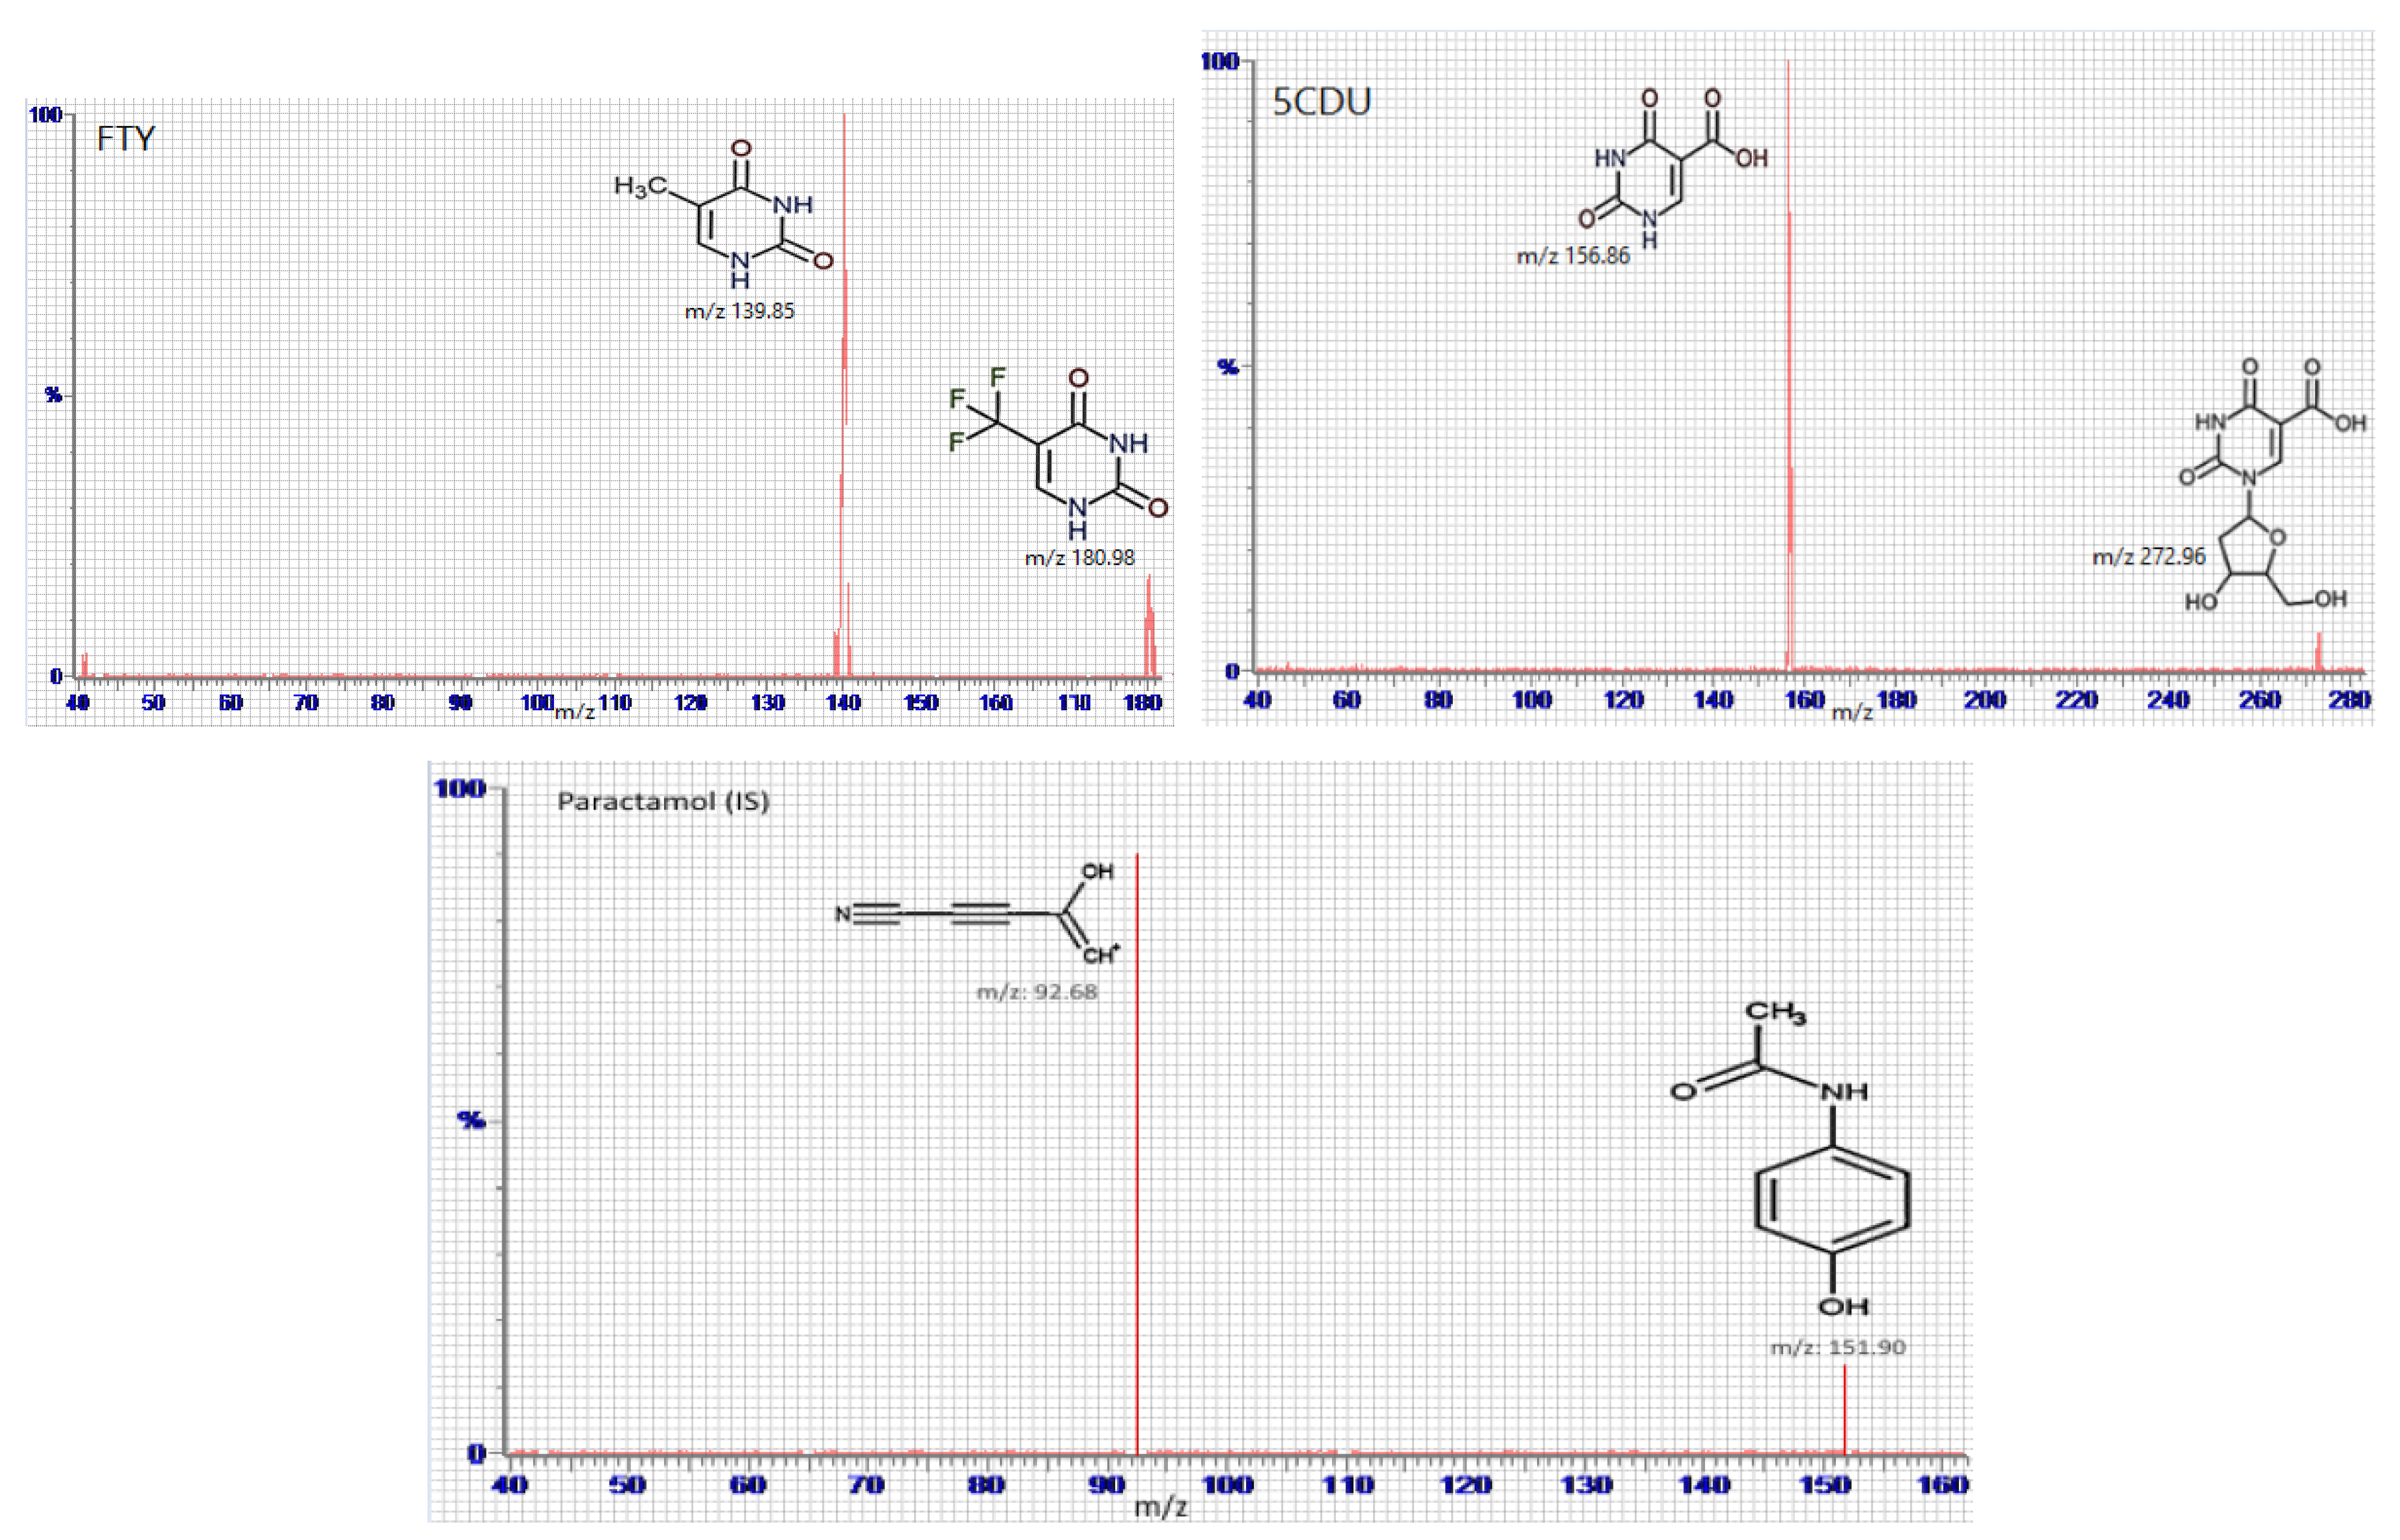
Full mass spectrum scans were performed under the optimal working conditions to select the most abundant m/z value, which was 296.96 → 116.86 for FTD, m/z 180.98 → 139.85 for FTY, m/z 272.96 → 156.8 for 5CDU, m/z 242.96 → 182.85 for TIP, and m/z 151.90 → 92.68 for IS, as seen in Figure 4.

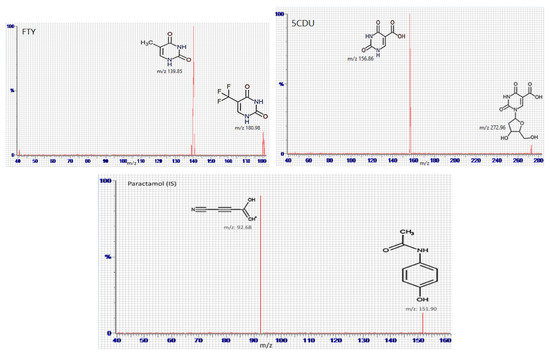
Figure 4.
Multiple reaction monitoring (MRM) mass spectra and the expected fragmentation pathway of tipiracil (TIP), trifluridine (FTD), 5-trifluoromethyluracil (FTY), 5-carboxy-2′-deoxyuridine (5CDU), and paracetamol (IS).
3.2. In-Study Validation
3.2.1. Specificity and Selectivity
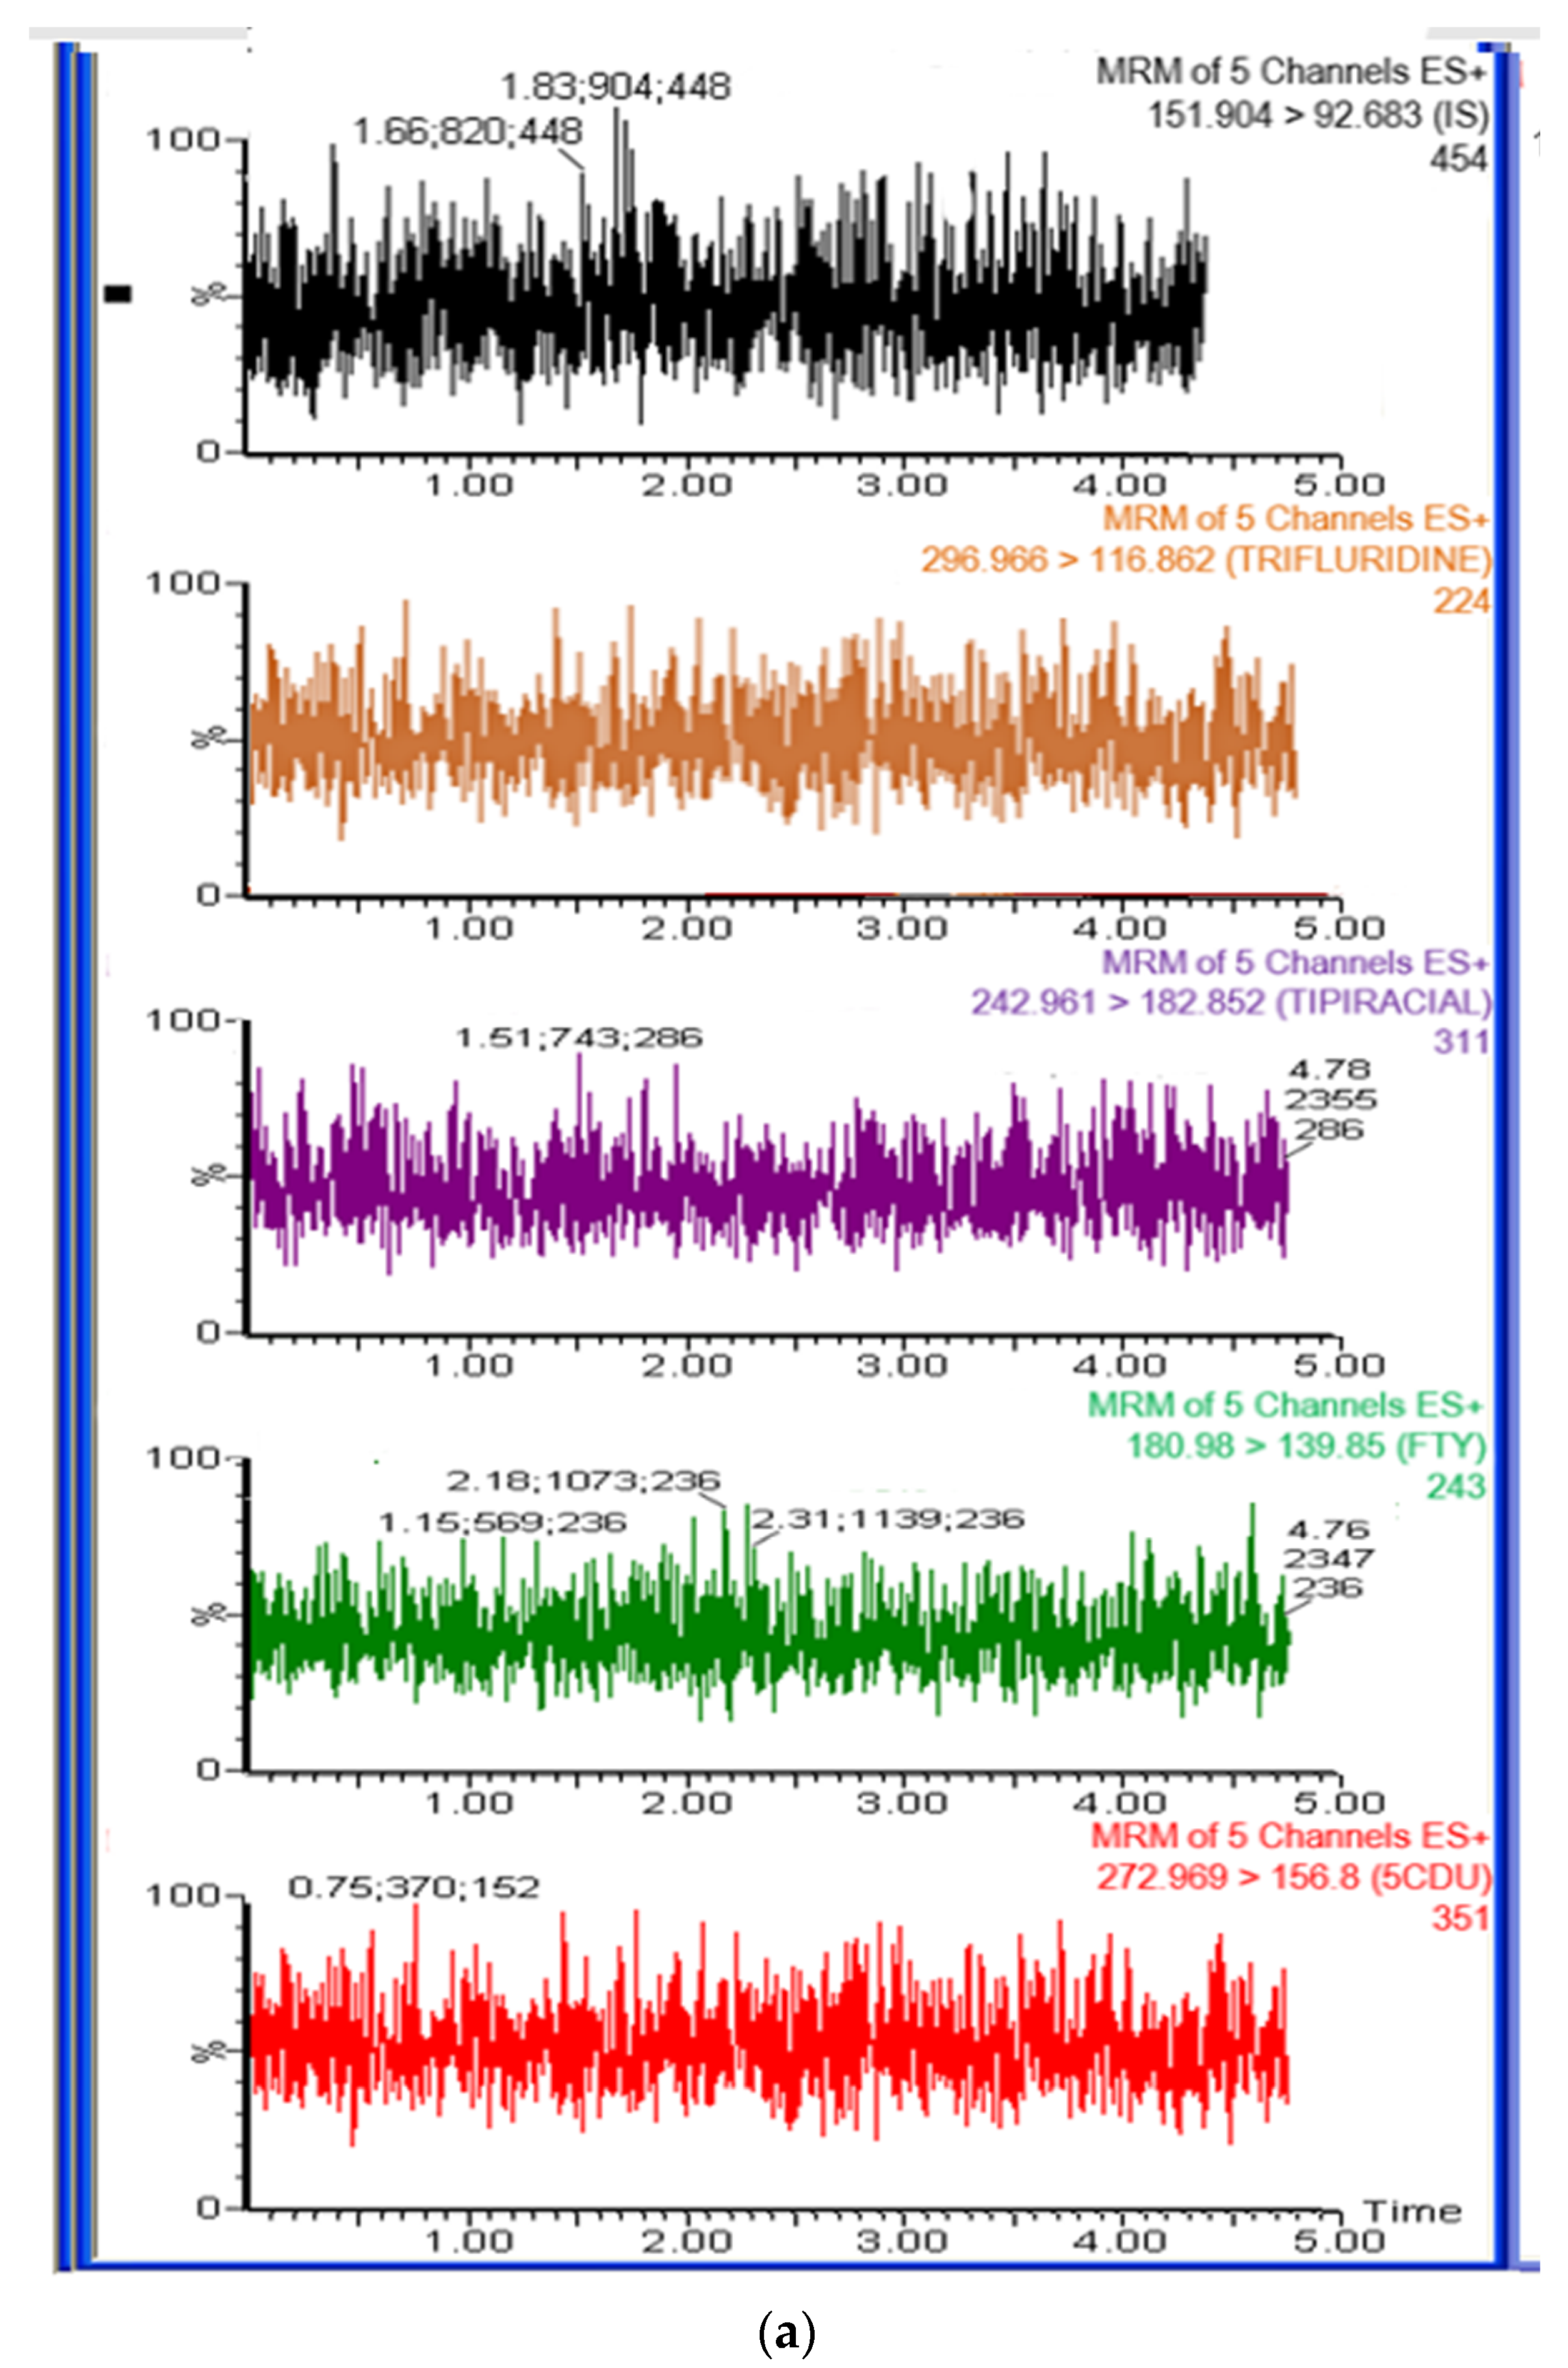
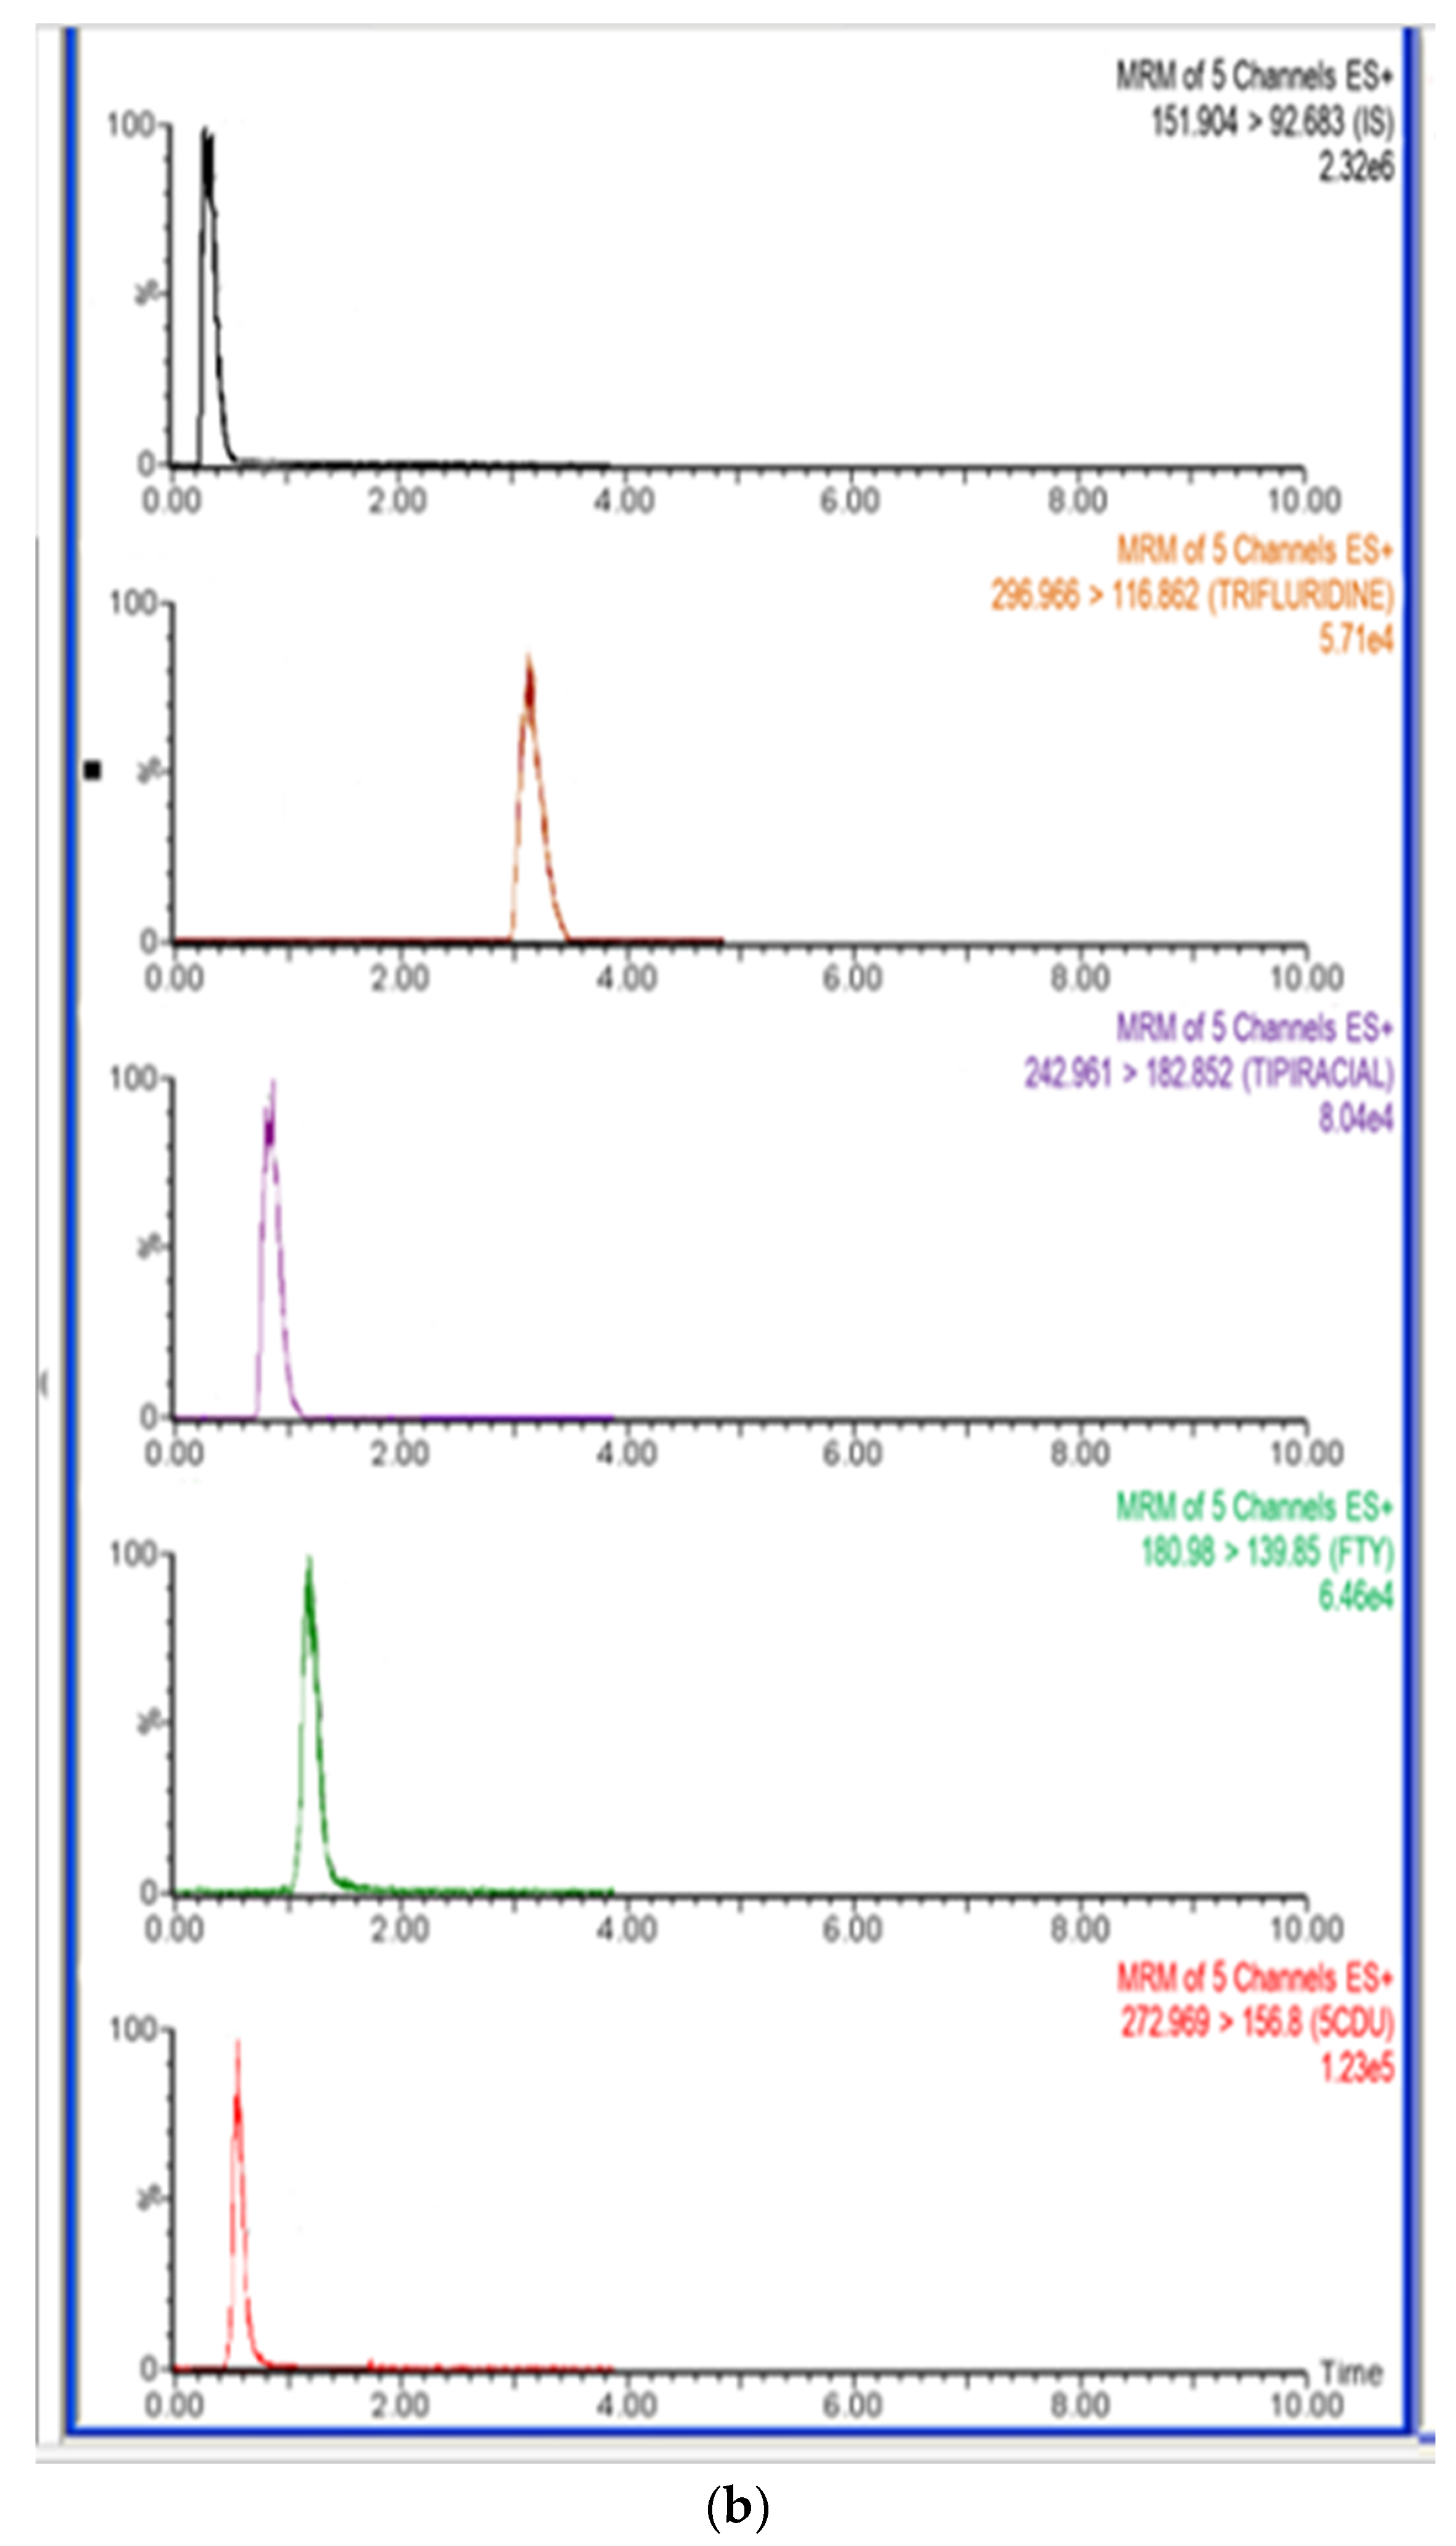
The method’s specificity was assessed by utilizing the developed LC-MS/MS method on blank rat plasma samples and plasma samples spiked with FTD, FTY, 5CDU, and TIP at respective limit of quantification (LLOQ) values, along with the internal standard (IS). The absence of any interference at the retention times of study drugs and the IS indicated the high degree of method specificity. Representative chromatograms of extracting rat plasma, with and without analyte, are shown in Figure 5a,b.
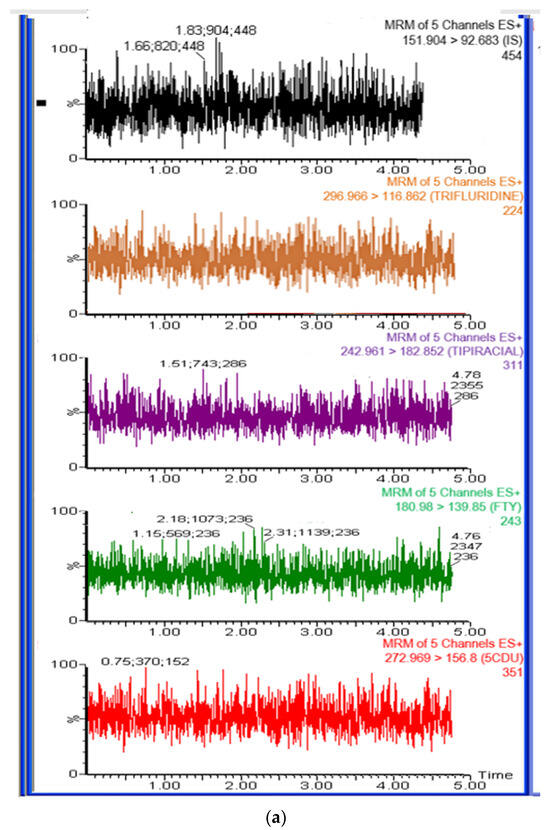
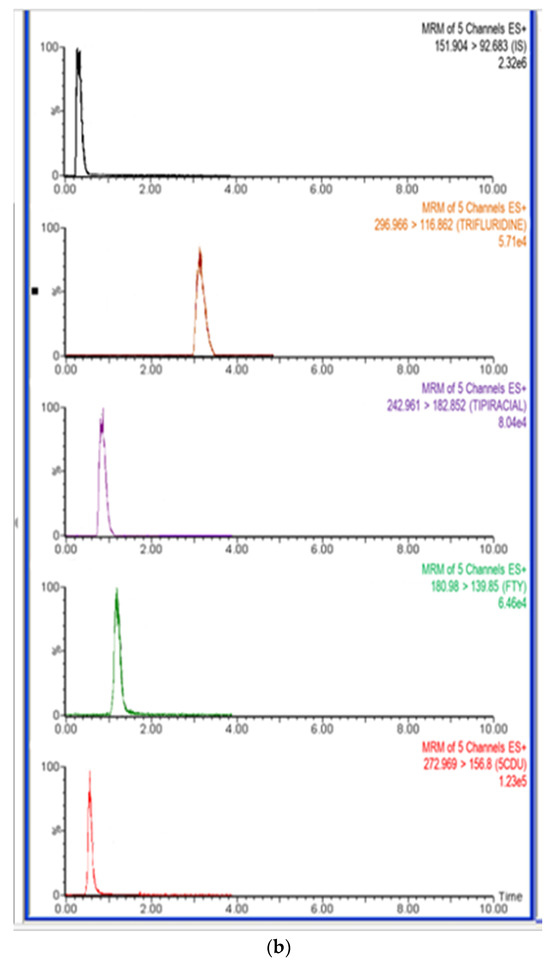
Figure 5.
(a) Representative total ion chromatograms for blank rat plasma. (b) Representative total ion chromatograms for rat plasma sample spiked with LLOQ concentration (5 ng/mL) of trifluridine (2.88 min), 5-trifluoromethyluracil (0.50 min), 5-carboxy-2′-deoxyuridine (0.71 min), tipiracil (1.00 min), and 500 ng/mLof IS (0.21 min).
The retention time of all drugs was 2.88 min for FTD, 1.09 min for TIP, 0.49 min for FTY, and 0.79 min for 5CDU, respectively. The internal standard (IS) had a retention time of 0.27 min.
3.2.2. Calibration Curve
As per the standards set by the US-FDA [21], the calibration curve for rat plasma is considered satisfactory in describing the relationship between concentration and response if the observed deviation and precision are equal to or less than 15%. When the experimental conditions were optimized, it was observed that the peak area ratio of FTD, FTY, 5CDU, and TIP to that of IS showed a linear relationship within the concentration range of 5–4000 ng/mL for FTD, FTY, and 5CDU, and within the concentration range of 5–1000 ng/mL for TIP. By utilizing the approach of least squares, we were able to obtain high correlation coefficients (r) with values exceeding 0.997 for all analytes. Additional statistical parameters and regressions were also computed. The variables used in the analysis were intercept (a), slope (b), and standard deviations of residuals (Sy/x), intercept (Sa), and slope (Sb). In addition, variance ratios were computed and presented in Table 2. The low values of Sy/x, together with the high F values, indicate a low degree of scatter of the experimental points around the regression line [27].

Table 2.
Statistical parameters of calibration curves for trifluridine (FTD), 5-trifluoromethyluracil (FTY), 5-carboxy-2′-deoxyuridine (5CDU), and tipiracil (TIP) in rat plasma using the developed LC–MS/MS method.
3.2.3. Lower Limits of Quantitation (LLOQ) and Detection (LLOD)
The minimum concentration indicated on the calibration graph should be considered as the lower limit of quantitation, provided that the response of the analyte is at least five times higher than that of the blank extracted plasma. Furthermore, it is expected that the drug response at the lower limit of quantification (LLOQ) should exhibit an accuracy within an acceptable range of ±20% and a precision of no more than 20% [21]. The limit of detection (LOD) refers to the minimum concentration of the analyte at which the signal exceeds three times the baseline noise [21]. The study determined that the lower limits of quantification (LLOQ) for FTD, FTY, 5CDU, and TIP were 5 ng/mL each. The lower limit of detection (LLOD) for FTD, FTY, 5CDU was 1.5 ng/mL, whereas for TIP it was 1.0 ng/mL, (Table 2). The acquired low limit of quantification (LLOQ) for FTD, FTY, 5CDU, and TIP confirms the suitability of the developed LC-MS/MS method for accurately measuring trace amounts of these substances in plasma. This is particularly relevant in pharmacokinetic (PK) studies.
3.2.4. Accuracy and Precision
The accuracy and precision of the analytes were evaluated by measuring four QC concentration levels (LLOQ, LQC, MQC, and HQC) using six replicates, both within the same day and across different days. Table 3 demonstrates that both the intra- and inter-day accuracies were equal to or less than 9.86%, while the intra- and inter-day precisions were equal to or less than 6.84% across all QC concentration levels. The findings exhibited the satisfactory level of accuracy and precision achieved by the developed method.

Table 3.
The accuracy and precision data for the determination of trifluridine (FTD), 5-trifluoromethyluracil (FTY), 5-carboxy-2′-deoxyuridine (5CDU), and tipiracil (TIP) in rat plasma using the developed LC–MS/MS method (n = 6).
3.2.5. Extraction Recovery and Matrix Effect
The extraction recovery results for QC samples at three concentration levels (LQC, MQC, and HQC, n = 6) in rat plasma, using simple protein precipitation, are presented in Table 4. The recovery values of at least 88.67% (FTD), 89.50% (FTY), 91.20% (5CDU), and 93.09% (TIP) demonstrate the high efficiency of the proposed sample treatment method. The matrix effect was determined by dividing the area of the plasma sample containing the analyte and internal standard (IS) by the area of the pure solution. The average matrix effect values for FTD, FTY, 5CDU, and TIP at three different concentration levels were above 95.15%. Additionally, the obtained relative standard deviations (RSD) for the studied analytes were below 9.03%. These results indicate that the developed assay effectively eliminates matrix effects and reliably determines the concentrations of FTD, FTY, 5CDU, and TIP in rat plasma.

Table 4.
The mean extraction recovery and matrix effect for the analysis of trifluridine (FTD), 5-trifluoromethyluracil (FTY), 5-carboxy-2′-deoxyuridine (5CDU), and tipiracil (TIP) in rat plasma by the LC-MS/MS method (n = 6).
3.2.6. Dilution Integrity
Accurate and precise results were obtained when rat plasma samples were spiked with high concentrations of each of the studied analyte beyond the linear range of the developed method and diluted with rat plasma (1:2 and 1:4) then analyzed. The RSD (%) results were 1.91–3.43 for FTD, 1.09–3.73 for FTY, 1.91–3.33 for 5CDU, and 2.01–4.41 for TIP, respectively. Meanwhile, the recovery (%) results were 98.05–101.90% for FTD, 97.65–99.50% for FTY, 97.91–99.05% for 5CDU, and 96.05–99.11% for TIP, respectively, (Table 5).

Table 5.
Evaluation of the dilution integrity of trifluridine (FTD), 5-trifluoromethyluracil (FTY), 5-carboxy-2′-deoxyuridine (5CDU), and tipiracil (TIP) in rat plasma by the LC-MS/MS method.
3.2.7. Sample Stability and Carry-Over
The stability of FTD, FTY, 5CDU, and TIP of the stock solution and biological matrix was examined throughout analysis procedures by the developed method. The stability experiments were conducted at two different QC levels (LQC and HQC) at the following conditions: at ambient temperature for 24 h, post preparation at room temperature for 6 h, three cycles of freeze-thaw, and long-term stability at 80 °C for 30 days. Results are summarized in Table 6. Stability results of accuracy and precision all met the ±15% criteria, and no significant degradation was observed under above storage conditions. The carry-over effect in the blank sample following the high concentration standard of each studied analyte wsd less than 10% of deviation for all the measured concentrations.

Table 6.
Stability results for trifluridine (FTD), 5-trifluoromethyluracil (FTY), 5-carboxy-2′-deoxyuridine (5CDU), and tipiracil (TIP) in rat plasma under different storage conditions.
3.3. Pharmacokinetics in Rats
This study was the first reported method utilizing the LC–MS/MS technique to simultaneously determine FTD and TIP in rat plasma and evaluate its application to a PK study. After the oral administration of the drug combination, 5.6 mg/kg/dose at ratio 1:0.5 for FTD and TIP, respectively, the concentrations of the individual analysts in rat plasma at different time intervals were determined, and the main relevant PK parameters from non-compartment model analysis are listed in Table 7.

Table 7.
The pharmacokinetic parameters of trifluridine (FTD), 5-trifluoromethyluracil (FTY), and tipiracil (TIP) in rat plasma after oral administration of FTD and TIP with dose 5.6 mg/kg at ratio of 1:0.5 for FTD and TIP, respectively. (n = 6, Mean ± SD).
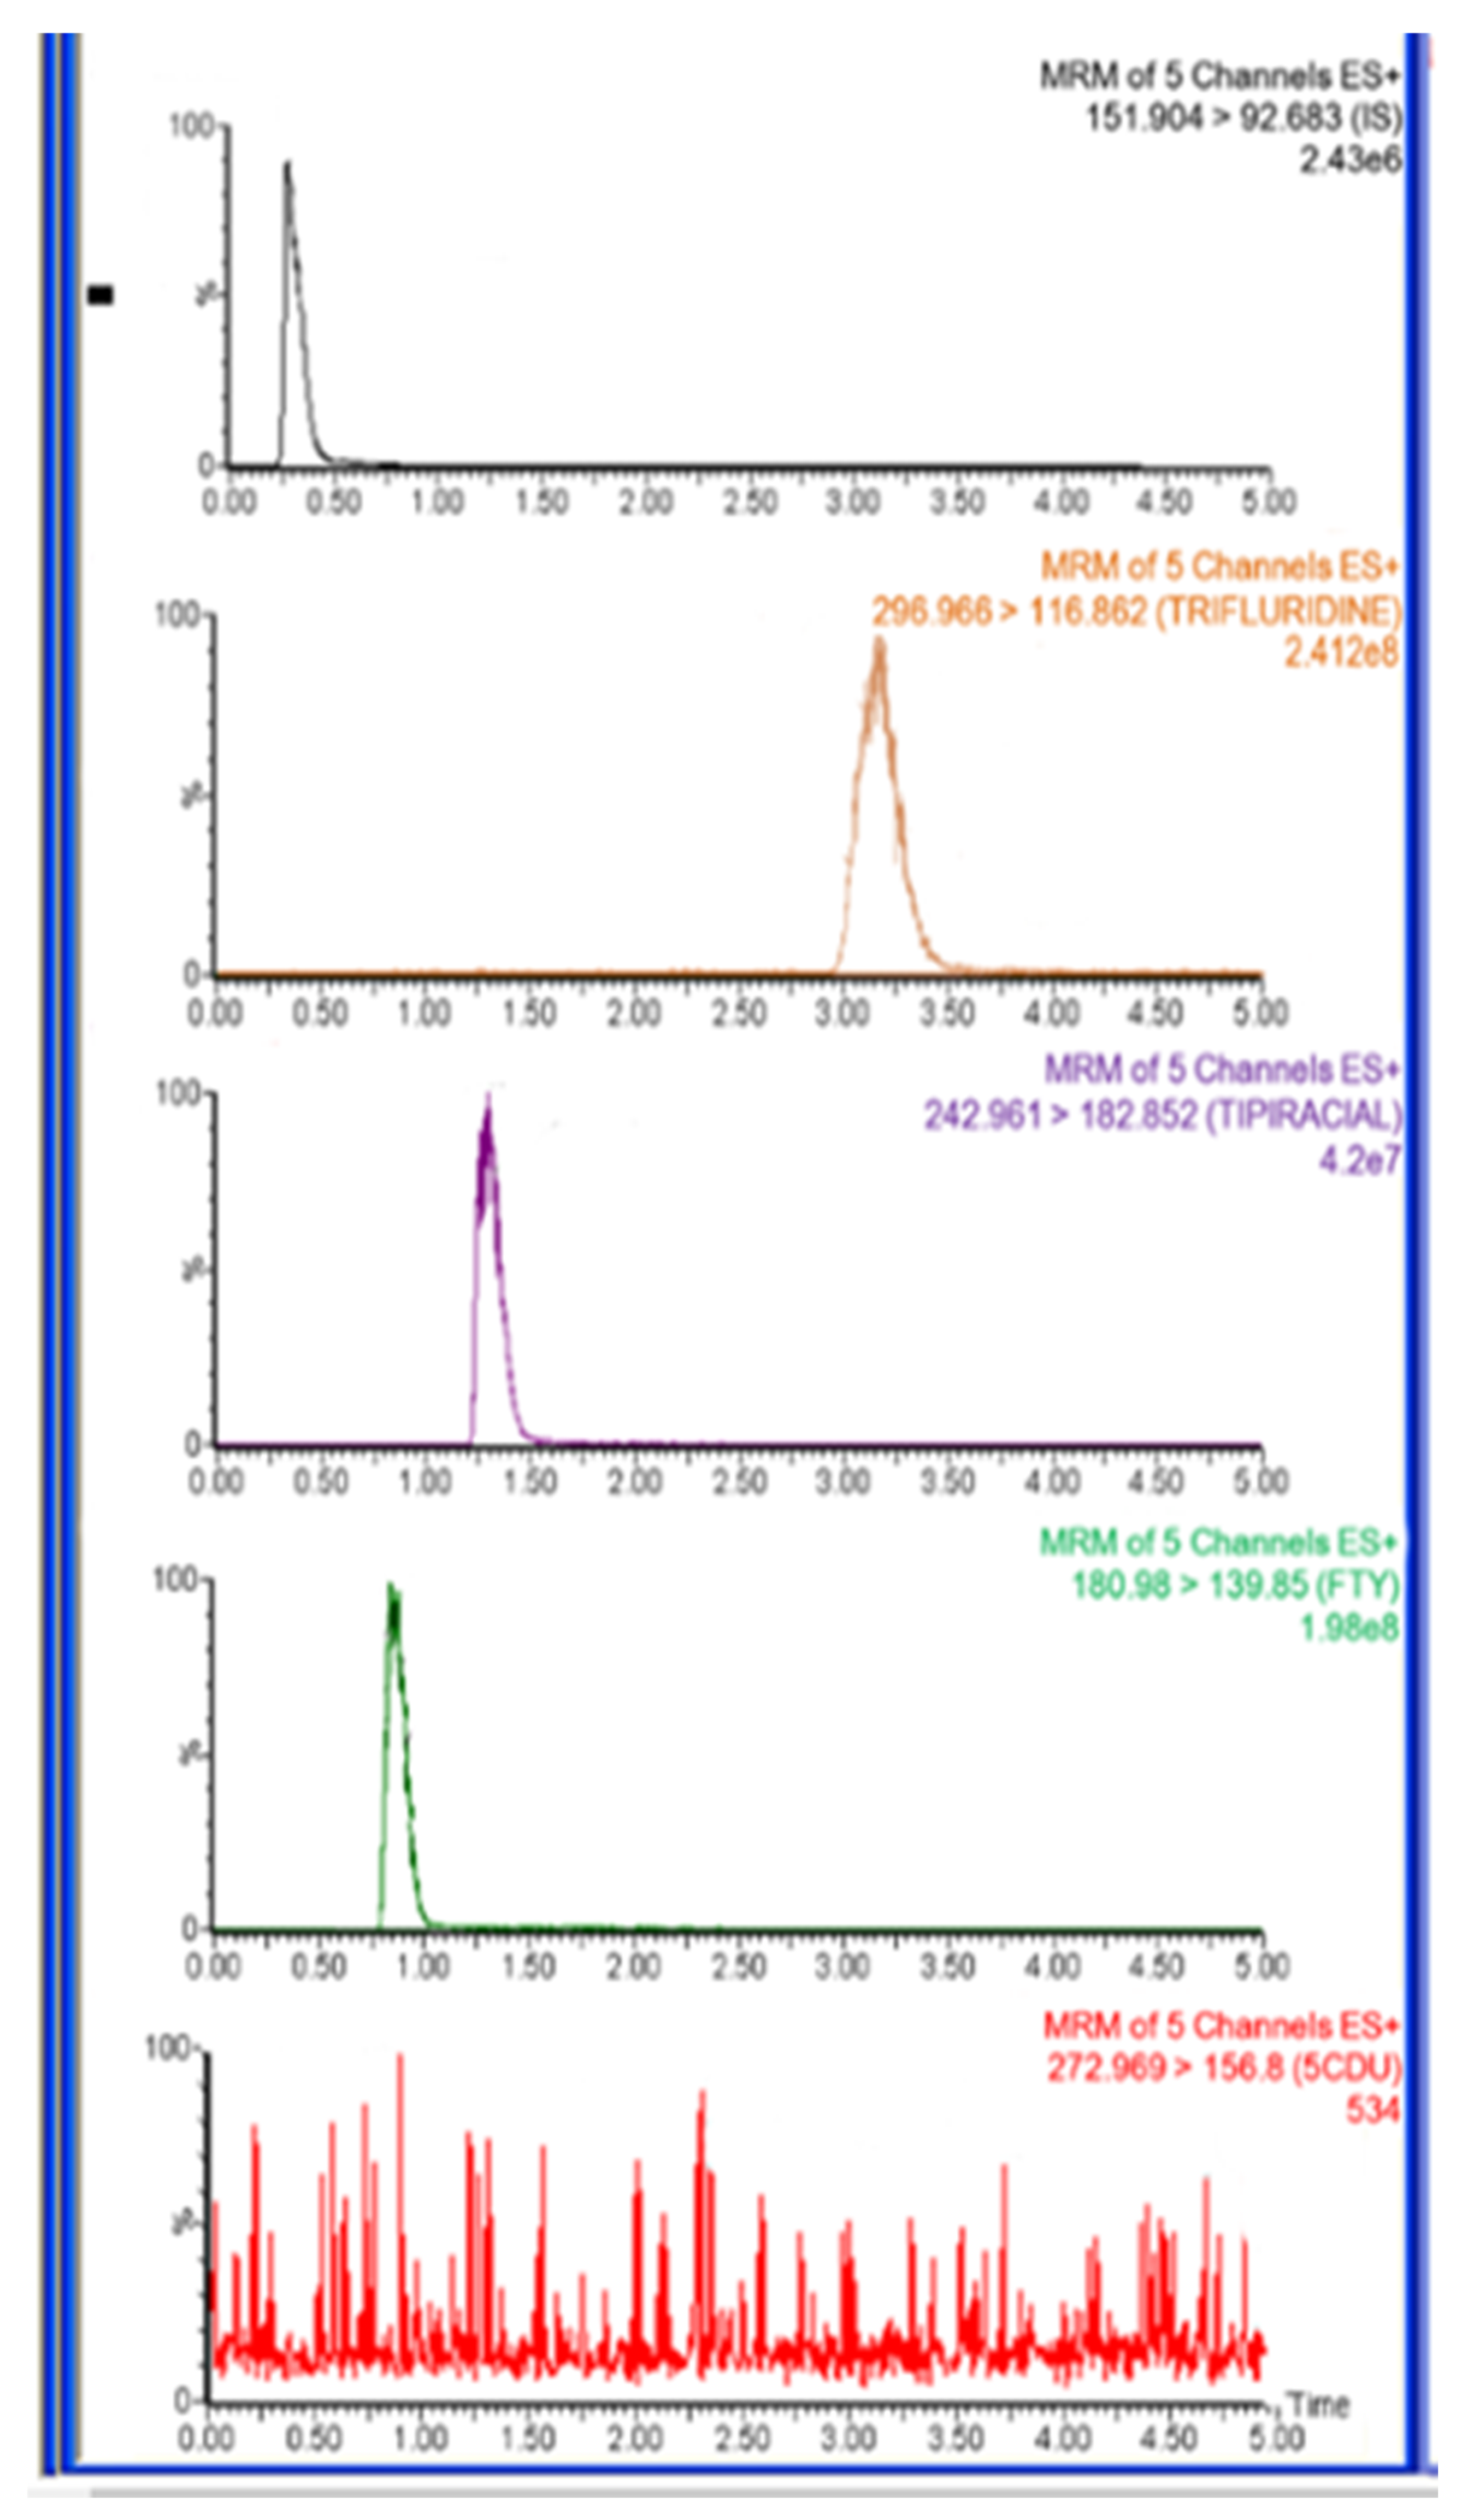
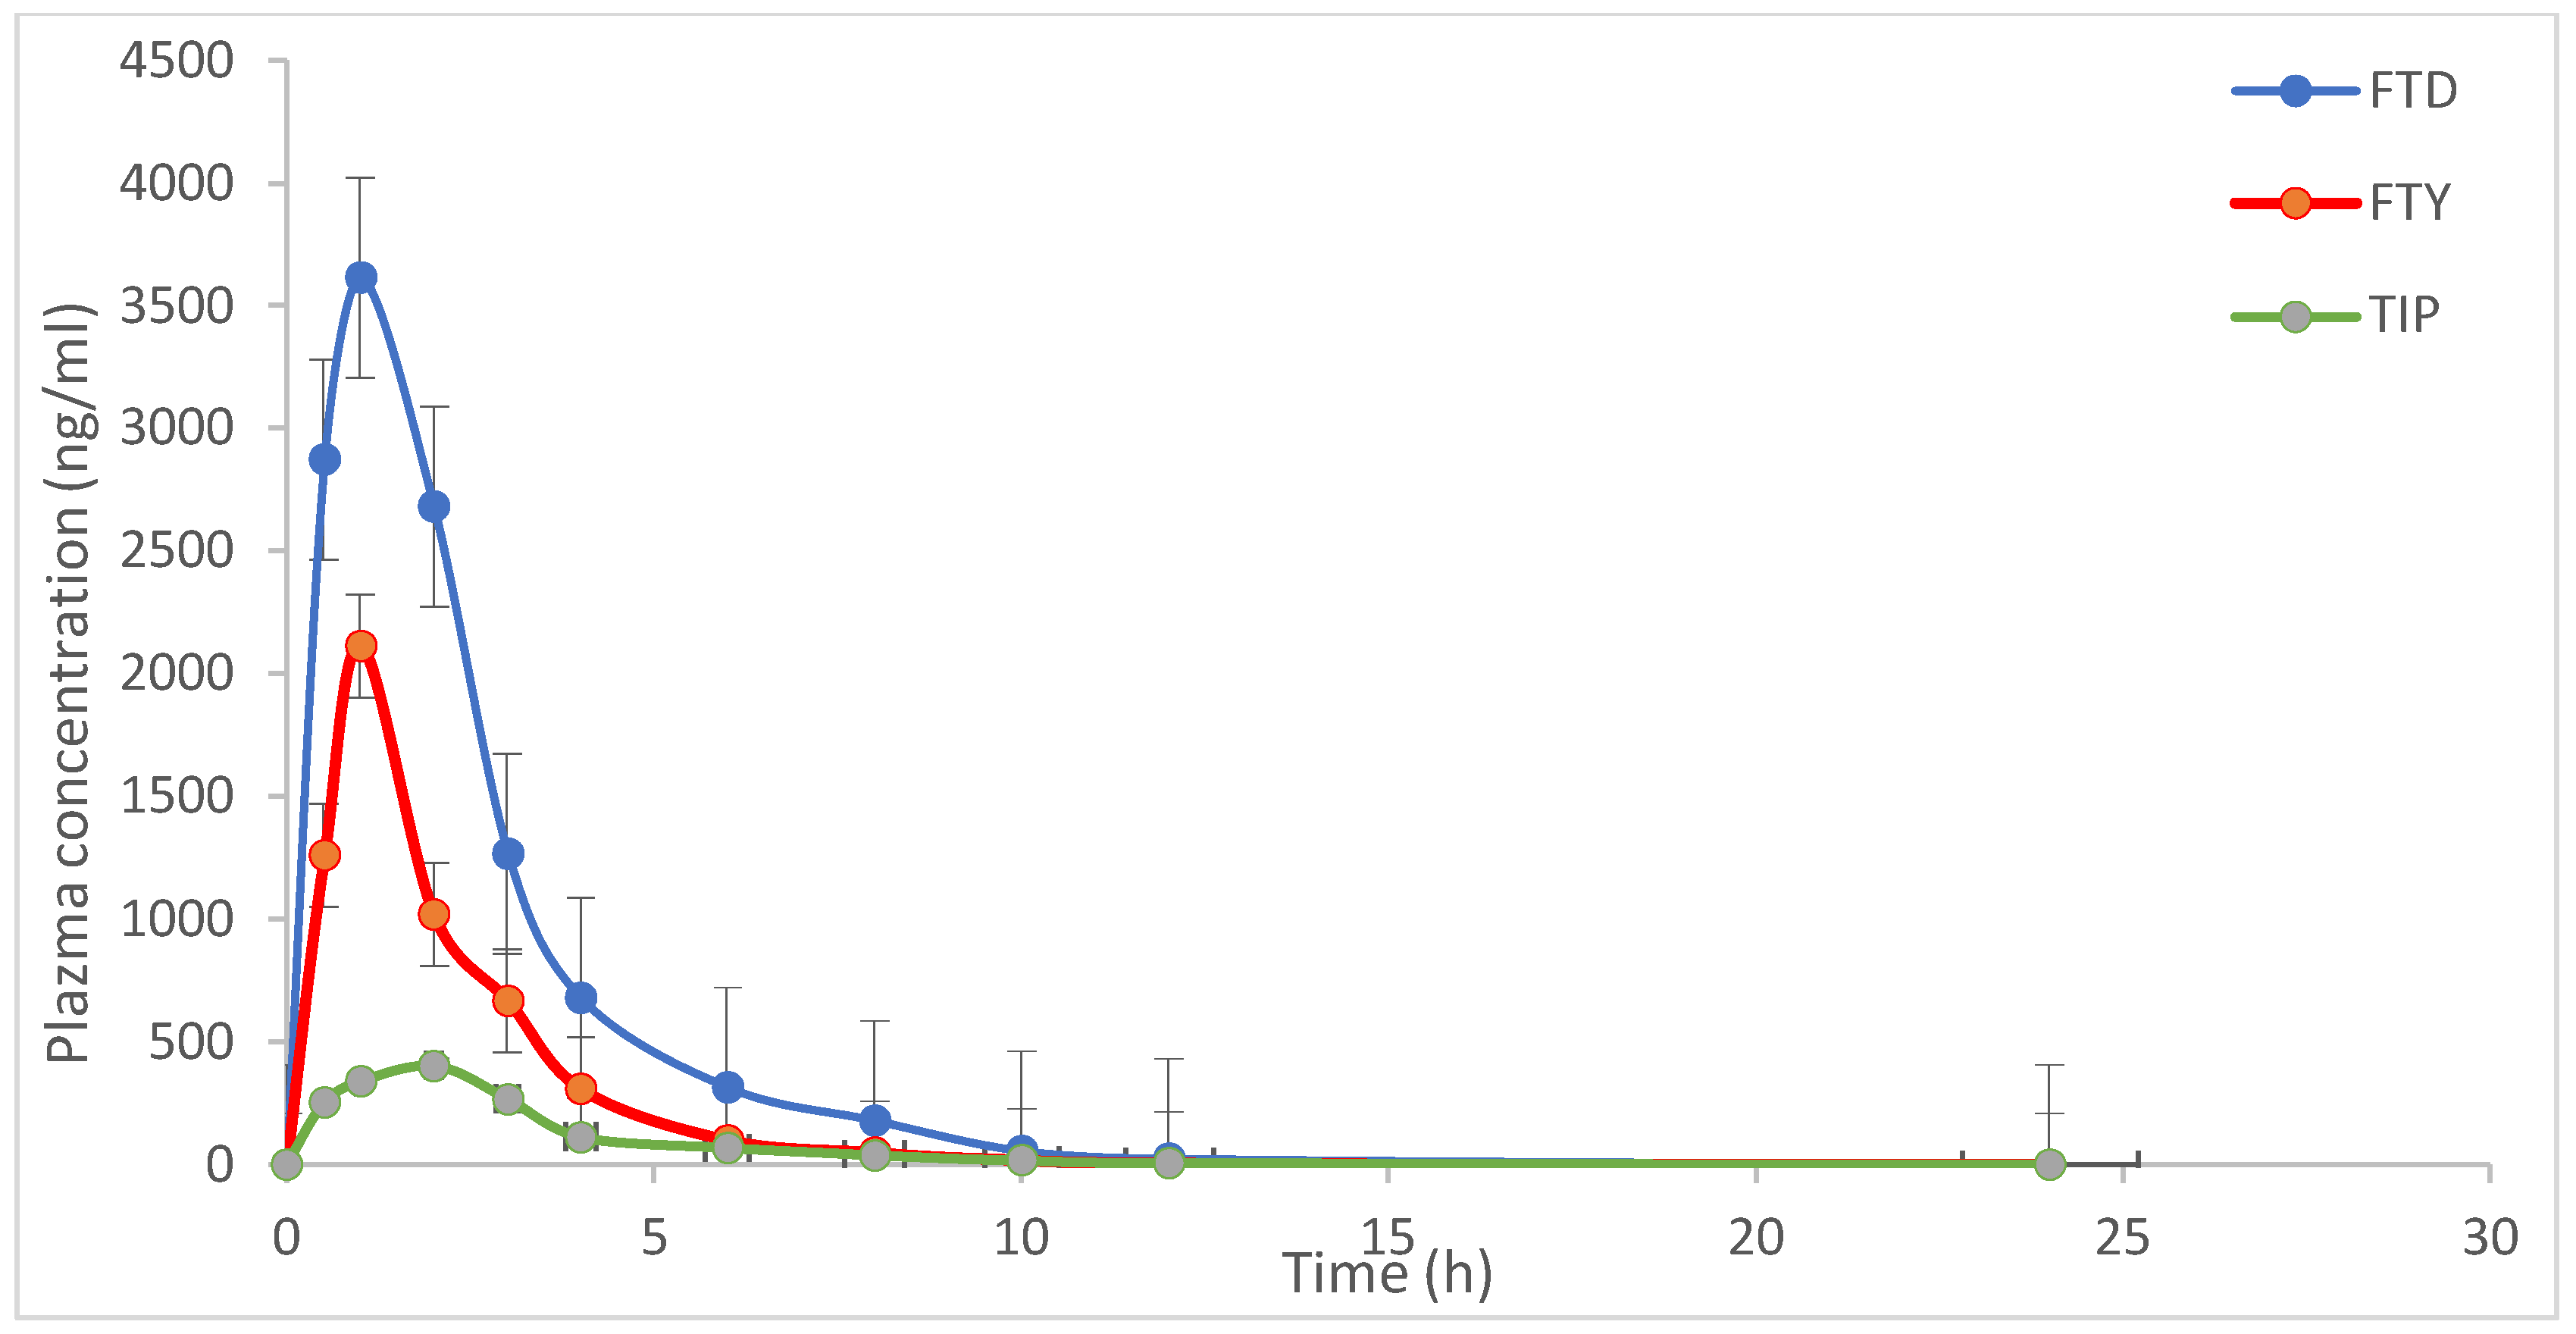
The typical MRM chromatograms of rat plasma one hour after administration of FTD and TIP are shown in Figure 6, and the mean plasma concentration–time profiles of the drug combinations are depicted in Figure 7.
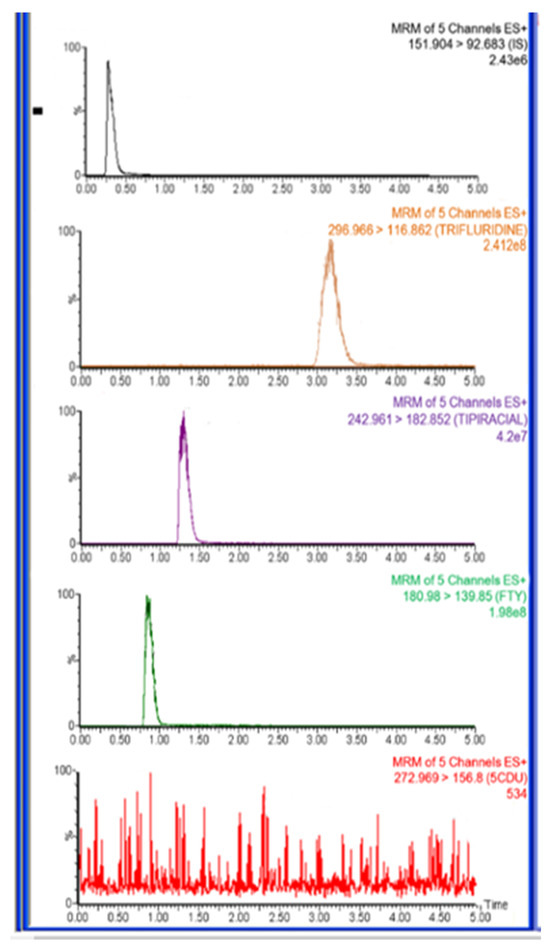
Figure 6.
Representative total ion chromatograms for in vivo rat plasma sample 1.0 h after oral administration of trifluridine (FTD) and tipiracil (TIP) with dose 5.6 mg/kg at ratio of 1:0.5 FTD and TIP, respectively, IS at a concentration of 500.0 ng/mL.
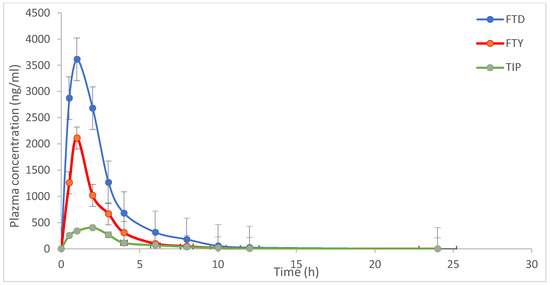
Figure 7.
Mean concentrations–time profile of trifluridine (FTD), 5-trifluoromethyluracil (FTY), and tipiracil (TIP) in rat plasma after oral administration of FTD and TIP with dose 5.6 mg/kg at ratio of 1:0.5 for FTD and TIP, respectively. Each point represents the mean ± S.D. of four rats.
The result is reflective of the overall intake of a drug being fairly in dynamic equilibrium with its elimination [28]. Mean maximum plasma drug concentration (Cmax) and time to achieve Cmax (Tmax) were 3520.43.67 ± 611.25 and 0.83 ± 0.29, 2114.67 ± 302.56 and 1.0 ± 0.01, and 404.29 ± 29.68 ng/mL and 2.0 ± 0.02 h, for FTD, FTY and TIP, respectively. AUC0–24 for FTD, FTY and TIP were 2952.42 ± 266.68 ng·h/mL, 2821.42 ± 690.36 ng·h/mL, and 13.67 ± 1.69 ng·h/mL, respectively, while AUC0–∞ was 3034.68 ± 277.81 ng·h/mL for FTD 3166.94 ± 566.58 ng·h/mL for FTY, and 12.37 ± 0.85 ng·h/mL for TIP. The elimination half-lives (T1/2) were 2.11 ± 0.18 h and 5.61 ± 0.87 h for FTD and TIP, respectively. The result of pharmacokinetic parameters was similar to the data obtained from the assessment of the Committee for Medicinal Products for Human Use (CHMP) [29]. The metabolite, 5CDU was undetectable, probably because it is a minor metabolite (15%), or due to the interindividual variation metabolism among rats.
3.4. Comparison with Previous Methodologies
In general, the LC-MS/MS technique that has distinct advantages in terms of specificity, high sensitivity, and efficiency was applied widely in the field of bioanalysis, especially in complicated biology matrix. As for the novel oral anti-colorectal cancer drugs, FTD and TIP, only two articles have reported the use of HPLC-UV methods for the quantification of FTD and TPI in biological fluids [19,20]. Liquid–liquid extraction for FTD/FTY and solid-phase extraction for TPI were employed in these methods. They were tedious and time consuming. Moreover, the published assay [19] using larger plasma volume (500 μL), longer analytical run time (8 min), and the LLOQ was much higher, which significantly decrease the efficiency of simultaneous determination of these anti-colorectal cancer drugs in biological fluids. Furthermore, RP-HPLC methods with UV detection were developed to determine FTD and TIP in tablets, capsules, and bulk form [11,12,13,14,15,16,17,18]. However, these published methods adopted time-consuming and linear over range 2.5–15 μg/mL and are not applicable in biological samples or applied to a pharmacokinetic study. In our developed LC-MS/MS method, the plasma volume is 50 μL, short chromatographic time (4 min), and a simple and effective PPT sample extraction could satisfy the high throughput bioanalysis in plasma. Moreover, the present validated method was successfully applied to a pharmacokinetic study in rats after oral administration of a mixture of FTD and TIP.
4. Conclusions
A fully validated LC-MS/MS method has been established for the first time to determine FTD, FTY, 5CDU, and TIP in rat plasma simultaneously. This method provides significant benefits compared to the previous literature in terms of a shorter chromatographic duration (4 min), cost-effective sample preparation (protein precipitation extraction), a smaller sample size (50 µL), satisfactory extraction recovery, and little matrix influence. The proposed method facilitated the measurement of the pharmacokinetics of both FTD and TIP after their oral administration to rats. This issue is critical when it comes to individuals with advanced colorectal cancer receiving therapeutic drug monitoring (TDM).
Author Contributions
Conceptualization, writing and original draft, M.E.-G., M.H. and A.A.; methodology and investigation, A.A. and M.E.-G.; data analysis, A.E.-A., A.A.-A. and A.E.G.; pharmacokinetic study, A.A.; writing—reviewing and editing, equal contribution of all authors; project administration, M.H.; funding acquisition, M.H. and M.E.-G. All authors have read and agreed to the published version of the manuscript.
Funding
This study was funded by the Researchers Supporting Project number (RSPD2023R754), King Saud University, Riyadh, Saudi Arabia.
Institutional Review Board Statement
The study was approved by the Institutional Animal Care and Use Committee (IACUC) guidelines, King Saud University, with the ethical approval number KSU-SE-18-18. Date of the approval: 24 April 2018.
Informed Consent Statement
Not applicable.
Data Availability Statement
Data are contained within the article.
Acknowledgments
The authors extend their appreciation to the Researchers Supporting Project number (RSPD2023R754), King Saud University, Riyadh, Saudi Arabia for funding this research.
Conflicts of Interest
The authors declare no conflicts of interest.
References
- Fostea, R.M.; Arkenau, H. Trifluridine/tipiracil in the treatment of gastric cancer. Future Oncol. 2022, 18, 1511–1517. [Google Scholar] [CrossRef] [PubMed]
- Colorectal Cancer. Available online: https://www.who.int/news-room/fact-sheets/detail/colorectal-cancer (accessed on 20 October 2023).
- Reynolds, J.E.F. Martindale: The Extra Pharmacopoeia, 31st ed.; Pharmaceutical Press: London, UK, 1996. [Google Scholar]
- Leighton, J.K. Centre for drug evaluation and research application pharmacology review, Lonsurf (trifluridine and tipiracil). 2020. Available online: https://www.accessdata.fda.gov/drugsatfda_docs/nda/2021/207981Orig1s009.pdf (accessed on 20 October 2023).
- Temmink, O.H.; Emura, T.; de Bruin, M.; Fukushima, M.; Peters, G.J. Therapeutic potential of the dual-targeted TAS-102 formulation in the treatment of gastrointestinal malignancies. Cancer Sci. 2007, 98, 779–789. [Google Scholar] [CrossRef] [PubMed]
- Fernandez Montes, A.; Vazquez Rivera, F.; Martinez Lago, N.; Covela Rúa, M.; Cousillas Castineiras, A.; Gonzalez Villarroel, P.; de la Cámara Gómez, J.; Mendez Mendez, J.C.; Salgado Fernandez, M.; Candamio Folgar, S.; et al. Efficacy and safety of trifluridine/tipiracil in third-line and beyond for the treatment of patients with metastatic colorectal cancer in routine clinical practice: Patterns of use and prognostic nomogram. Clin. Transl. Oncol. 2020, 22, 351–359. [Google Scholar] [CrossRef] [PubMed]
- Alnasser, A.I.; Hefnawy, M.M.; Al-Hossaini, A.M.; Bin Jardan, Y.B.; El-Azab, A.S.; Abdel-Aziz, A.M.; Al-Obaid, A.M.; Al-Suwaidan, I.A.; Attwa, M.W.; El-Gendy, M.A. LC–MS/MS method for the quantitation of decitabine and venetoclax in rat plasma after SPE: Application to pharmacokinetic study. Saudi. Pharm. J. 2023, 31, 101693. [Google Scholar] [CrossRef]
- Hefnawy, M.M.; Alanazi, M.M.; Al-Hossaini, A.M.; Alnasser, A.I.; El-Azab, A.S.; Bin Jardan, Y.A.; Attwa, M.W.; El-Gendy, M.A. A Rapid and Sensitive Liquid Chromatography-Tandem Mass Spectrometry Bioanalytical Method for the Quantification of Encorafenib and Binimetinib as a First-Line Treatment for Advanced (Unresectable or Metastatic) Melanoma—Application to a Pharmacokinetic Study. Molecules 2023, 28, 79–92. [Google Scholar]
- Alnasser, A.I.; Hefnawy, M.M.; Alanazi, M.M.; Al-Hossaini, A.M.; Bin Jardan, Y.B.; El-Azab, A.S.; Abdel-Aziz, A.M.; Attwa, M.W.; El-Gendy, M.A. Applicable pharmacokinetic study: Development and validation of bioanalytical LC-MS/MS method for the simultaneous quantification of cytarabine and glasdegib used for the treatment of acute myeloid leukemia. Arab. J. Chem. 2023, 16, 105117. [Google Scholar] [CrossRef]
- Al-Shehri, M.; Hefnawy, M.; Abuelizz, H.; Alzamil, A.; Mohammed, M.; Alsaif, N.; Almehizia, A.; Alkahtani, H.; Abounassif, M. Development and validation of an UHPLC-MS/MS method for simultaneous determination of palbociclib, letrozole and its metabolite carbinol in rat plasma and pharmacokinetic study application. Arab. J. Chem. 2020, 13, 4024–4034. [Google Scholar] [CrossRef]
- Mastanamma, S.K.; Nagaraju, K.; Reehana, S.K. Development and validation of stability indicating RP-HPLC method for the simultaneous estimation of trifluridine and tipiracilin bulk and their combined dosage form. Int. J. ChemTech Res. 2019, 12, 117–126. [Google Scholar] [CrossRef]
- Sahu, S.; Akula, G. Development and validation of a RP-HPLC-PDA method for simultaneous determination of trifluridine and tipiracil in pure and pharmaceutical dosage form. Int. J. Nov. Trends Pharm. Sci. 2017, 7, 233–242. [Google Scholar]
- Kusuma, J.K.; Rao, M.; Raju, R. An effective and sensitive stability indicating chromatographic approach based on RP-HPLC for trifluridine and tipiracil in bulk and pharmaceutical dosage form. Int. J. Res. Pharm. Chem. 2017, 7, 63–70. [Google Scholar]
- Goday, S.; Abdulrahaman, S.; Prameelarani, A. Development and validation of stability indicating RP-HPLC method for the simultaneous estimation of combination drugs trifluridine and tipiracil in bulk and pharmaceutical dosage forms. Int. J. Res. Appl. 2017, 5, 93–104. [Google Scholar]
- Rizwan, M.; Bhameshan, K.; Sultana, A. Analytical method development and validation for the simultaneous determination of tipiracil and trifluridine in bulk and capsule dosage form by RP-HPLC method. Int. J. Innov. Pharm. Sci. Res. 2017, 5, 32–42. [Google Scholar]
- Paw, B.; Misztal, G. Determination of trifluridine in eye drops by high-performance liquid chromatography. Pharmazie 2017, 52, 551–552. [Google Scholar]
- Hazra, B.; Vageesh, N.; Kistayya, C.; Shahanaz, M. Analytical method development and validation for simultaneous estimation of trifluridine and tipiracil in pure and pharmaceutical dosage form. Innov. Int. J. Med. Pharm. Sci. 2018, 3, 245–256. [Google Scholar]
- Prathap, B.; Hari Baskar, V.; Kumar, V.; Raghu, P.S.; Reddy, S.B. Method development and validation for the simultaneous estimation of trifluridine and tipiracil in tablet dosage form by RP-HPLC method. J. Global Trends Pharm. Sci. 2017, 8, 4514–4521. [Google Scholar]
- Phani, R.S.; Prasad, K.R.S.; Mallu, U.R. New bio-analytical method development and validation for the simultaneous estimation of trifluridine and tipiracil in spiked human plasma. Res. J. Pharm. Technol. 2017, 10, 4264–4270. [Google Scholar]
- Shelke, R.U.; Rishipathak, D.D. Bioanalytical method development for quantification of trifluridine with its metabolites and tipiracil in spiked human plasma by solid-phase extraction (SPE) and HPLC with PDA detection. Mater. Today Proc. 2023. [Google Scholar] [CrossRef]
- U.S. FDA. Bioanalytical Method Validation Guidance for Industry. 2018. Available online: https://www.fda.gov/ucm/groups/fdagov-public/@fdagov-drugs-gen/documents/document/ucm070107.pdf (accessed on 20 October 2023).
- Kim, H.; Kang, J. Matrix effects: Hurdle for development and validation of bioanalytical LC-MS methods in biological samples analyses. Biodesign 2016, 14, 46–58. [Google Scholar]
- Eeckhaut, A.; Lanckmans, K.; Sarre, S.; Smolders, I.; Michotte, Y. Validation of bioanalytical LC-MS/MS assays: Evaluation of matrix effects. J. Chromatogr. B 2009, 877, 2198–2207. [Google Scholar] [CrossRef]
- Quintela, O.; Sauvage, F.; Charvier, F.; Gaulier, J.; Lachâtre, G.; Marquet, P. Liquid chromatography-tandem mass spectrometry for detection of low concentrations of 21 benzodiazepines, metabolites, and analogs in urine: Method with forensic applications. Clin. Chem. 2006, 52, 1346–1355. [Google Scholar] [CrossRef]
- Gouma, E.; Simos, Y.; Verginadis, I.; Lykoudis, E.; Evangelou, A.; Karkabounas, S. A simple procedure for estimation of total body surface area and determination of a new value of Meeh’s constant in rats. Lab. Anim. 2012, 46, 40–45. [Google Scholar] [CrossRef] [PubMed]
- Zhang, Y.; Huo, M.; Zhoua, J.; Xie, S. PKSolver: An add-in program for pharmacokinetic and pharmacodynamic data analysis in Microsoft Excel. Comput. Methods Programs Biomed. 2010, 99, 306–314. [Google Scholar] [CrossRef] [PubMed]
- Miller, J.N.; Miller, J.C. Statistics and Chemometrics for Analytical Chemistry, 4th ed.; Prentice Hall: Harlow, UK, 2000. [Google Scholar]
- AGAH Working Group Pharmacokinetics. “A Collection of Terms, Symbols, Equations, and Explanations of Common Pharmacokinetic and Pharmacodynamic Parameters and Some Statistical Functions” (PDF). Arbeitsgemeinschaft für Angewandte Humanpharmakologie (AGAH) (Association for Applied Human Pharmacology). 16 February 2004. Available online: http://www.agah.eu/fileadmin/_migrated/content_uploads/PK-glossary_PK_working_group_2004.pdf (accessed on 20 October 2023).
- Human Use (CHMP). Assessment Report of Lonsurf (International Non-Proprietary Name: Trifluridine/Tipiracil). EMA/CHMP/287846. 25 February 2016. Procedure No. EMEA/H/C/003897/0000. Available online: https://www.ema.europa.eu/en/medicines/human/EPAR/lonsurf (accessed on 20 October 2023).
Disclaimer/Publisher’s Note: The statements, opinions and data contained in all publications are solely those of the individual author(s) and contributor(s) and not of MDPI and/or the editor(s). MDPI and/or the editor(s) disclaim responsibility for any injury to people or property resulting from any ideas, methods, instructions or products referred to in the content. |
© 2023 by the authors. Licensee MDPI, Basel, Switzerland. This article is an open access article distributed under the terms and conditions of the Creative Commons Attribution (CC BY) license (https://creativecommons.org/licenses/by/4.0/).

