Article

Study on Separation Kinetics of Non-Spherical Single Feeding Particle in the Gas–Solid Separation Fluidized Bed

1
School of Safety and Emergency Management Engineering, Taiyuan University of Science and Technology, Taiyuan 030024, China
2
Intelligent Monitoring and Control of Coal Mine Dust Key Laboratory of Shanxi Province, Taiyuan University of Science and Technology, Taiyuan 030024, China
3
School of Chemical Engineering & Technology, China University of Mining & Technology, Xuzhou 221116, China
*
Author to whom correspondence should be addressed.
Separations 2024, 11(12), 341; https://doi.org/10.3390/separations11120341
Submission received: 27 October 2024 / Revised: 15 November 2024 / Accepted: 25 November 2024 / Published: 28 November 2024
(This article belongs to the Special Issue Research Progress of Gas–Solid Fluidized Dry Separation)

Abstract

:
Gas–solid separation fluidized bed is an efficient and clean coal separation technology with a good separation effect for coal particles. However, there is a lack of systematic research on the complex motion behavior of the feeding particles in gas–solid separation fluidized beds. In this study, the separation kinetics of non-spherical single feeding particles in the fluidized bed are examined. The particle sphericity coefficient Φ is introduced to characterize the morphology of irregular coal particles, and the drag coefficient for the feeding particles is modified to verify the suitability of the non-spherical particle drag model for gas–solid fluidized bed separation. After optimization and correction, a ρS.sus (the bed density when single feeding particles are suspended in the gas–solid separation fluidized bed) prediction model is obtained. When the prediction accuracy of the ρS.sus prediction model is 90%, the confidence degree is 85.72%. This ρS.sus of the single non-spherical feeding particle prediction model highlights a direction for improving the separation effect, provides a theoretical basis for the industrialization of gas–solid fluidized bed, and promotes the process of dry fluidized separation.

1. Introduction

Coal, as the world’s primary fossil fuel, has a significant impact on the global energy landscape and economic development [1,2,3,4]. In September 2020, China explicitly set a “carbon peak” target for 2030 and a “carbon neutrality” goal for 2060 [5,6,7,8,9]. The “dual-carbon” strategy advocates for a green, environmentally friendly, and low-carbon lifestyle. Accelerating the reduction in carbon dioxide emissions is crucial for advancing green technologies in China and enhancing the nation’s industrial and economic competitiveness on an international scale. By 2023, the national raw coal production reached 4.71 billion tons, with a raw coal washing rate of 69.0%, remaining at a historically high level [10]. Due to the distribution of coal in arid and water-scarce areas in China, gas–solid separation fluidized beds have become a research hotspot. Gas–solid fluidized dry separation technology is based on Archimedes’ principle, which is similar to the wet separation method. It combines a dense medium with an airflow, causing the particles to suspend, thus giving the entire separation system fluid-like properties and a stable density. This allows for the efficient separation of coal particles based on the difference in density between clean coal and gangue. Utilizing this technology, an air-dense medium fluidized bed separation system has been developed, scalable from laboratory to industrial levels, enabling efficient coal separation [11,12,13,14].
While much recent research focuses on the characteristics of fluidized beds, few studies investigate feeding particles [11,15,16,17,18,19,20,21]. Prusti et al. studied the effect of coal particles’ shapes and features on their position in the fluidized bed [22]. The feeding particles in the fluidized bed are subjected to the resistance of the airflow, which is the drag force. The drag coefficient related to the drag force is of great significance when studying the behavior of feeding particles [23]. Due to the irregular characteristics of the particles, many researchers have made corrections to the drag coefficient [24,25,26,27,28,29,30,31,32,33]. In the field of fluidized bed coal separation, the effect of drag force on non-spherical particles is rarely considered, and the separation performance of individual feeding coal particles and the bed interaction mechanisms remain unclear.
In this study, single feeding particles are considered the separation objects, and their separation performance in gas–solid fluidized beds is investigated. First, the spherical coefficient of the single feeding particles was calculated, and the general range of the spherical coefficient was obtained. The terminal velocity of single feeding particles in the fluidized bed was calculated based on the fluid-like properties of the fluidized bed. The variation law of bed density when a non-spherical single particle was suspended in the fluidized bed, ρS.sus, was obtained. ρS.sus plays a very important role in the study of the hydrodynamics of fluidized beds, such as the riser pressure drop, fluidization velocity [34], and gas–solid countercurrent of the fluidized bed for particle solar receivers [35].
Based on different drag coefficient calculation methods, the theoretical value of ρS.sus was calculated, and by comparing this with the experimental value of ρS.sus, the drag coefficient most suitable for the fluidized bed separation process was obtained. The prediction model of ρS.sus was optimized, which provides guidance for achieving efficient and reliable coal separation in the gas–solid fluidized bed separation process.

2. Materials and Methods
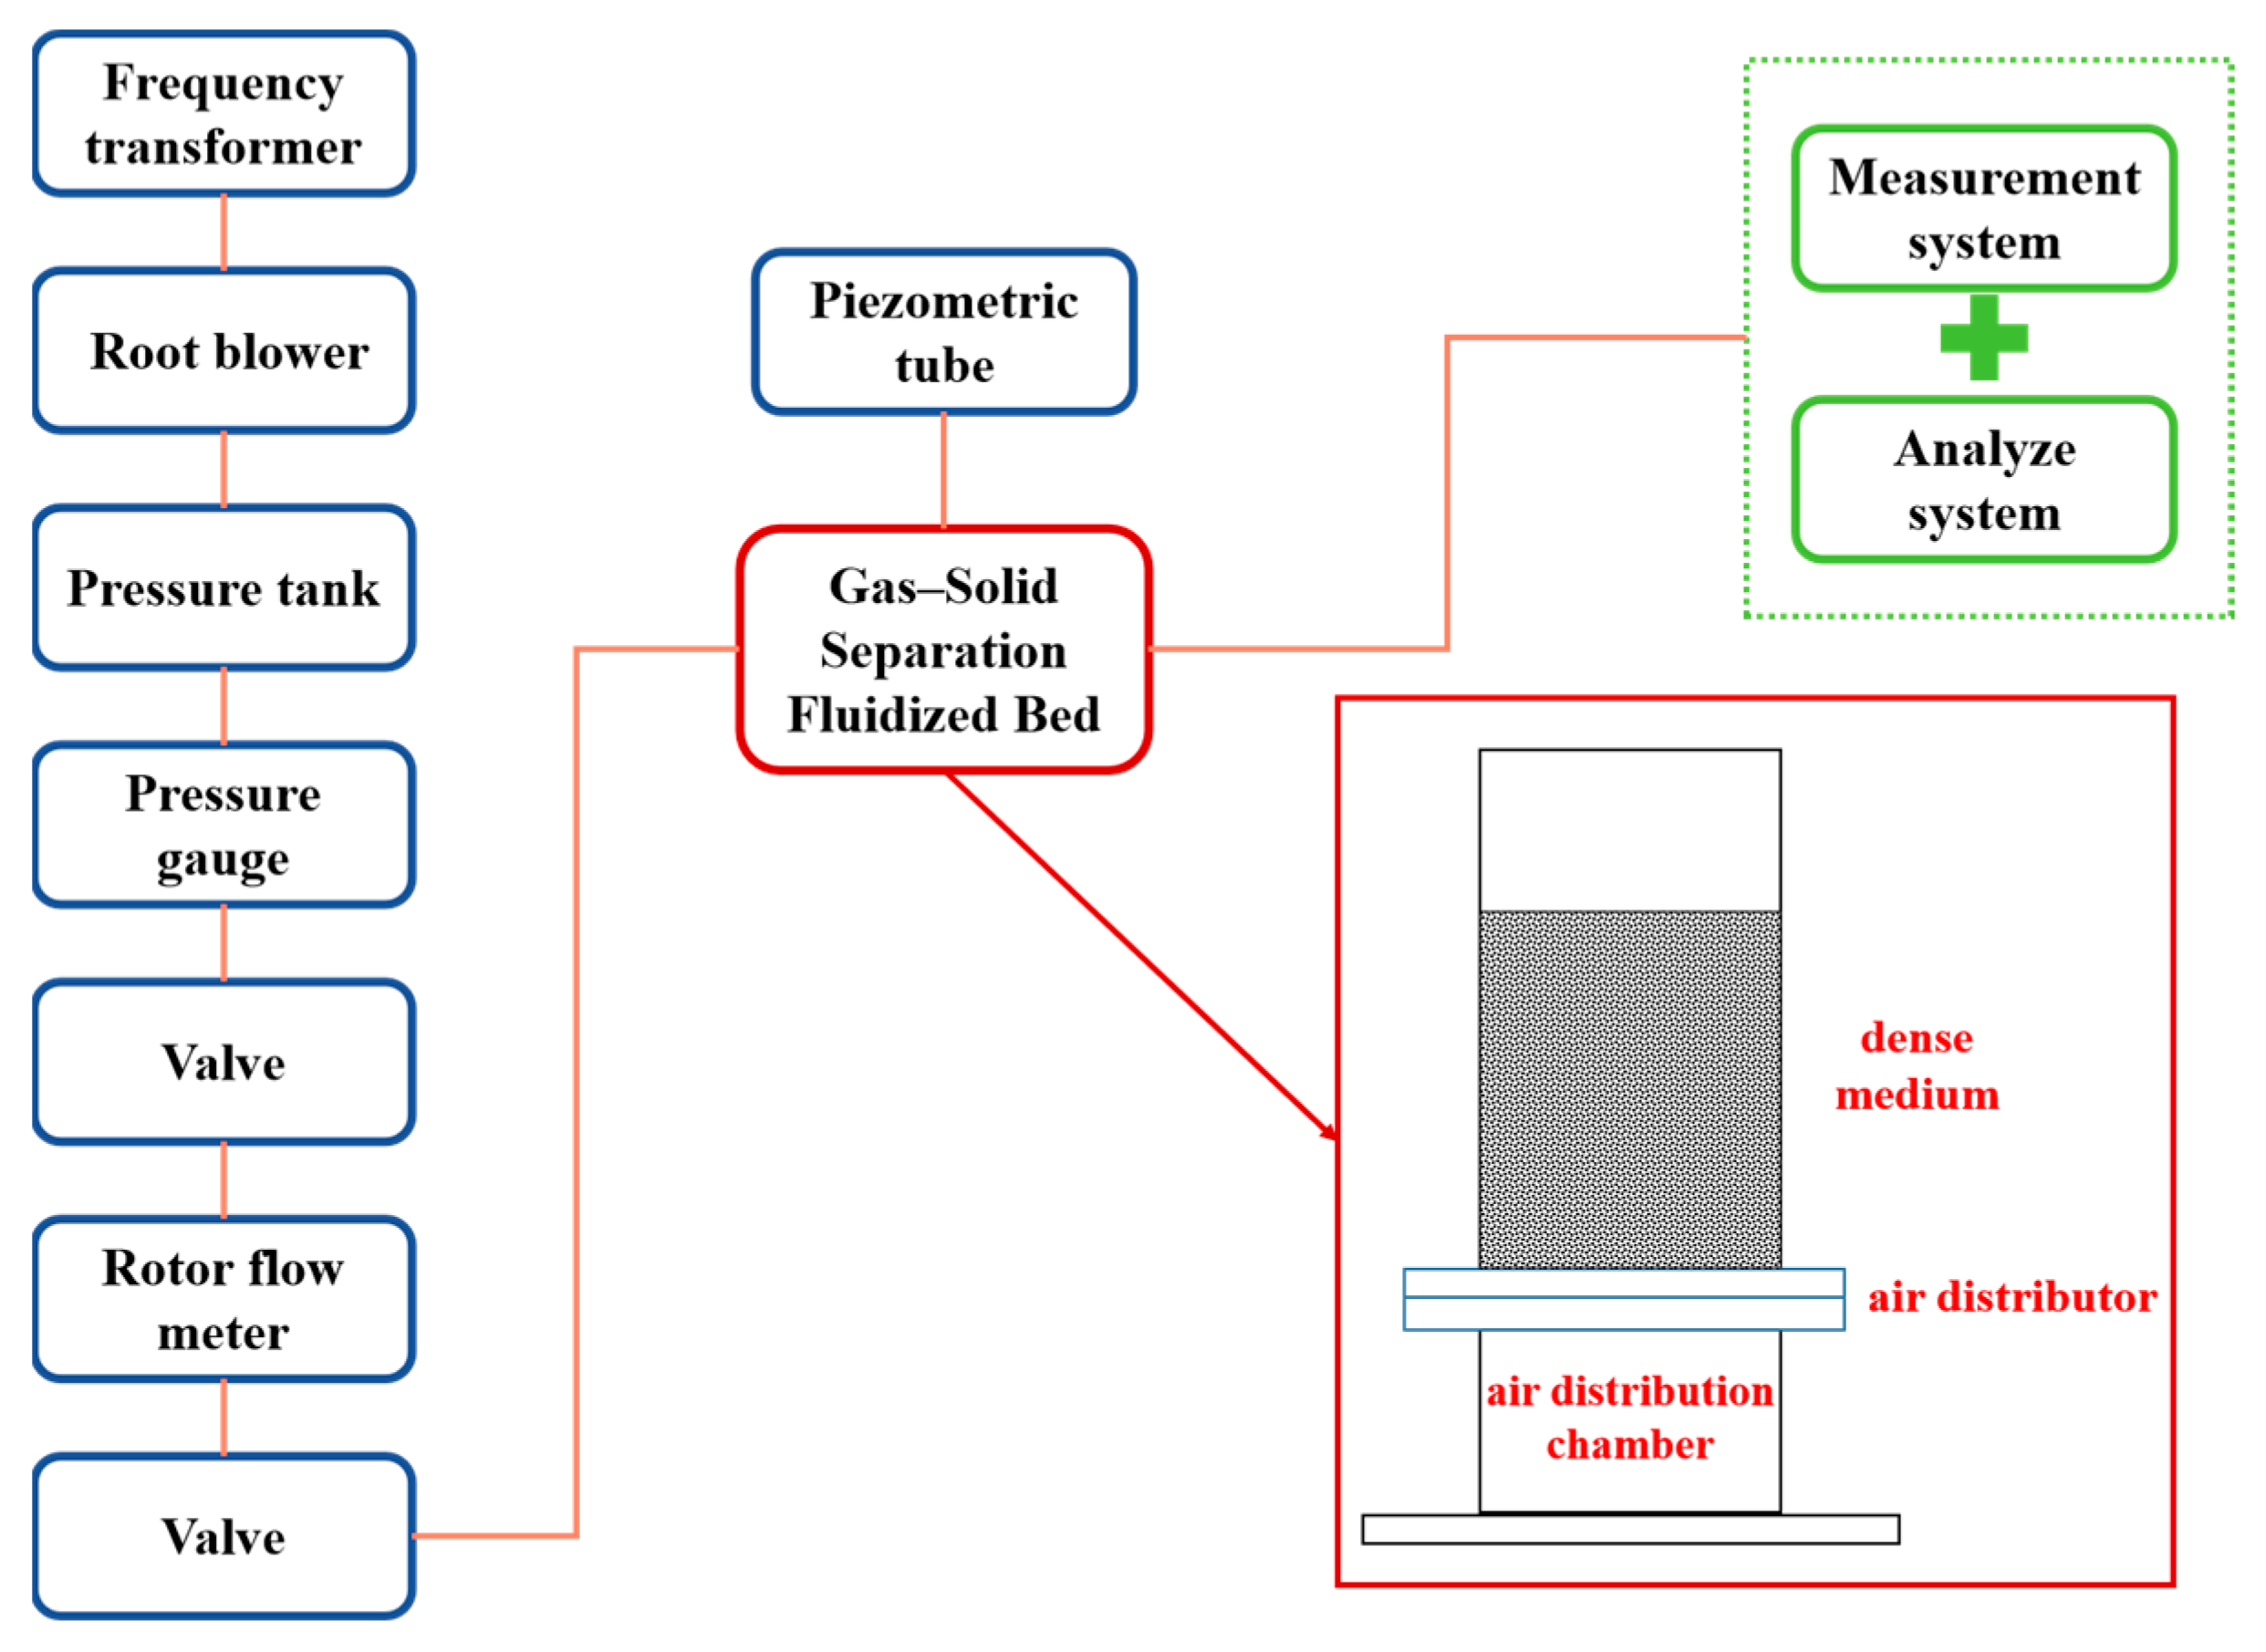
2.1. Apparatus

The experimental system including the gas–solid separation fluidized bed is shown in Figure 1. The experimental system mainly consists of air supply system (a frequency transformer, root blower, pressure tank, pressure gauge, valve, rotor flow meter), gas–solid separation fluidized bed, measurement system, and analysis system. The air pressure during the experiment was set to 0.2 Mpa, providing continuous, stable, and adjustable air flow for the entire separation system. The gas–solid separation fluidized bed includes an air distributor, air distribution chamber, and dense medium. The inner diameter of the fluidized bed is 200 mm, the bed height is 350 mm, and it is composed of organic glass.

2.2. Properties of Dense Medium

In gas–solid fluidized beds, a dense medium of suitable particle size is required to form a stable fluidized state and uniform density distribution in order to achieve efficient separation. Geldart B particle magnetite powder is generally used as the dense medium in coal separation [36]. In order to achieve the separation effect, reduce processing costs, and make the dense medium easy to recycle, wide-particle-size magnetite powder is generally used as the dense medium, with particle sizes mainly distributed between 0.074 and 0.3 mm and an average particle size of 225.37 μm. The particle size distribution of the magnetite powder used in this study is shown in Figure 2. The true density of the magnetite powder is 4.6 g/cm3. The weight content of the dense medium between 0.074 and 0.3 mm reaches approximately 80%, which meets the separation requirements. Its true density is 4.6 g/cm3.

2.3. Properties of Feeding Particles

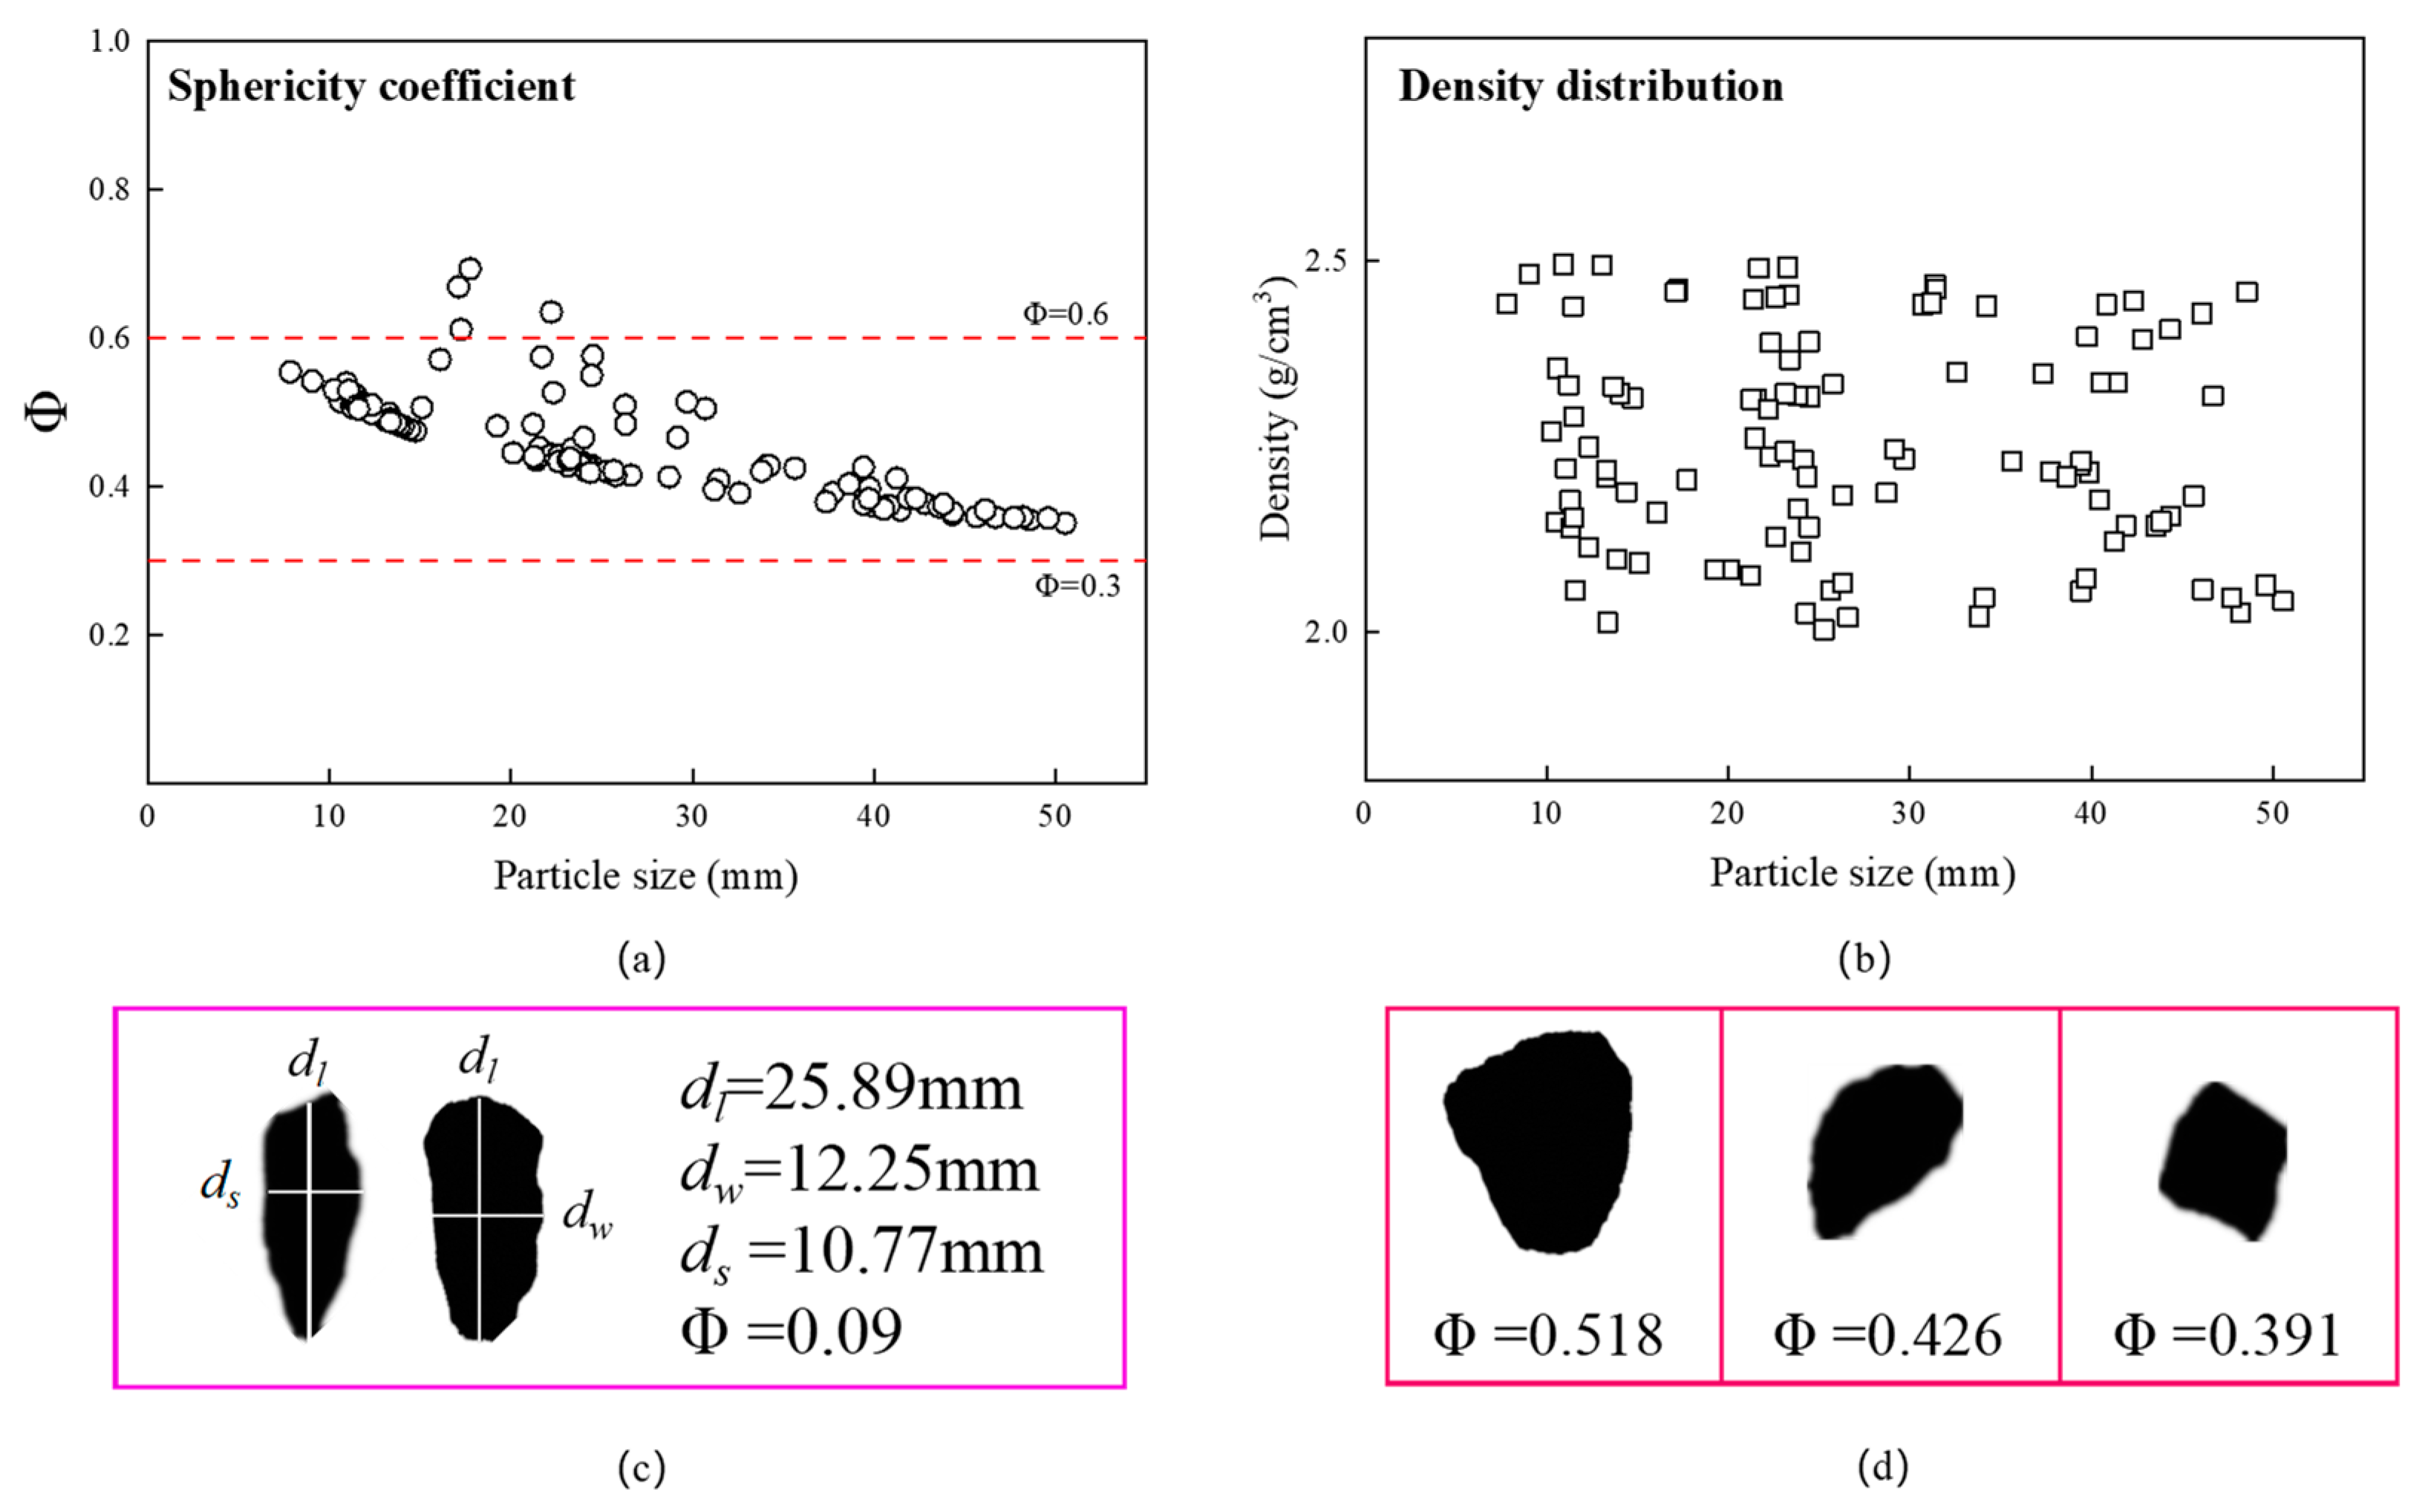
2.3.1. Sphericity Coefficient

In previous research, when analyzing the behavior of feeding particles in fluidized beds, it has generally been assumed that the feeding particles are spherical [20,37,38]; however, this is generally not true in actual separation processes. Therefore, it is crucial to determine a common index for describing the shape of coal particles. The equivalent diameter was used to describe the shape characteristics of coal particles in previous research, but this only considered the shape characteristics of the coal particles in one dimension, making it difficult to determine the shape characteristics accurately [39]. In this study, based on the two-dimensional and three-dimensional shape characteristics of coal particles, the spherical coefficient is introduced to describe the coal properties.
When feeding particles are non-spherical, the spherical coefficient is Φ [29,40], as shown in Equations (1)–(5):
Φ = A S P H A p X
A S P H = π d p 2
d p = 6 d w π 3
A P = 4 π d l d w / 4 1.0675 + d l d b / 4 1.0675 + d b d w / 2 1.0675 3 1 / 1.0675
X = P m p P p
where ASPH is the surface area of a sphere with the same volume as the particle, m2; AP is the surface area of the particle, m2; dp is the volume-equivalent sphere diameter, m; dl, dw, and db are the lengths of the selected particles in three directions, m; Pmp is the circumference of the maximum projected area of the particle, m; and Pp is the circumference of the circle on the same projected surface, m.

2.3.2. Properties of Simulated Particles

Cuboid, cube, and cylinder shapes were selected as simulated particles to study the characteristics of the feeding particles. The properties of the simulated particles are shown in Table 1.

2.3.3. Properties of Selected Feeding Coal Particles

In order to further understand the variation law of the particle sphericity coefficient, feeding coal particles with a particle size range of 6–50 mm were selected. The distribution of the sphericity coefficient and the density of the feeding coal particles are shown in Figure 3. Figure 3 shows that the sphericity coefficient of the feeding coal particles is mostly between 0.3 and 0.6, and the density is distributed between 2.0 and 2.5 g/cm3.
Each particle was mounted on a goniometric universal stage under a stereomicroscope equipped with a camera, ensuring the maximum projection area was visible to the camera (Figure 3c). Upon analyzing the image in this position, dl and ds were measured (Figure 3c, left). The stage was then tilted 90° to capture a second image for measuring dw (Figure 3c, right). The Φ was measured as shown in Figure 3d. As the circularity is particularly sensitive to the perimeter (Equation (5)), which is heavily influenced by the outermost pixels of the particle image, the images of all particles covered at least 3000 pixels to minimize resolution effects [29].

3. Theoretical Analysis of Single Feeding Particle Movement Behavior

3.1. Terminal Sinking Velocity

The fluidized bed has fluid-like properties. The terminal sinking velocity vp is of great significance for the stability of the fluidized bed and improving the separation efficiency. However, since the measurement of vp generally involves invasive methods, which can cause a certain degree of damage to the separation process, calculation methods are generally used to determine the terminal settling velocity, followed by verification.
In order to calculate vp, the volume fraction Vφ of the feeding particles is introduced [41,42], as shown in Equation (6):
V φ 0 = V p D 2 H m f + V p
where Vφ0 is the initial volume fraction, %; Vp is the volume of the feeding particles, %; D is the diameter of the fluidized bed, m; and Hmf is the bed height when the fluidized bed reaches the minimum fluidization state, m. Compared to the volume of the fluidized bed, the volume of the selected particles can be ignored, so it can be simplified as Equation (7):
V φ 0 = V p D 2 H m f
The volume fraction after the minimum fluidization state is
V φ = H m H V φ 0
where Hm is the bed height when the volume fraction is Vφ, m; and H is the initial static bed height of the fluidized bed, m.
According to Zigrand et al. [43], the calculation formula for the terminal sinking velocity of feeding particles is from Equations (9)–(12):
v p = c 1 c 1 2 a 1 2
a 1 = 2 0.63 3 ( ρ p ρ b e d ) g d p ( 1 V φ ) ρ b e d ( 1 V φ 1 / 3 ) 1 / 2
b 1 = 4.8 0.63 μ exp 5 V φ / 3 ( 1 V φ ) ρ b e d d p 1 / 2
c 1 = ( 2 a 1 + b 1 2 ) 2
where ρbed is the density of the gas–solid fluidized bed, kg/m3; ρp is the density of the feeding particle, kg/m3; dp is the equivalent diameter of coal particles, m; vg is the velocity of the gas in the two-phase flow, m/s; and μ is viscosity, Pa·S.

3.2. Theoretical Analysis of Single Feeding Particle Separation Behavior

When the feeding particle moves in the gas–solid suspension space of the fluidized bed, the force balance equation is Equation (13):
F = G P + F f P + F d P
where F is the resultant force experienced by the feeding particle in the fluidized bed; GP is the gravity of the feeding particle; FfP is the buoyancy experienced by the feeding particle in the fluidized bed; and FdP is the drag force of the gas experienced by the feeding particle in the fluidized bed.
The calculation method of F d P is shown in Equation (14):
F d p = 1 8 π C D d p 2 ρ f ( v g v p ) 2
where dp is the equivalent diameter of coal particles, m; vg is the velocity of the gas in the two-phase flow, m/s; vp is the velocity of the coal particles, m/s; CD is the drag coefficient; and ρf denotes the gas flow density, kg/m3.
When the feeding particle is in a suspended state in the fluidized bed, it has reached force balance and the resultant force is zero, as shown in Equation (15):
G P + F f P + F d P = 0
By combining Equation (14), the motion equation can be expressed as Equation (16):
1 6 π d p 3 ρ p g + 1 6 π d p 3 ρ b e d g + 1 8 π C D d p 2 ρ f ( v g v p ) 2 = 0
where ρbed is the density of the gas–solid fluidized bed, kg/m3.
There are various calculation methods for CD on non-spherical particles, which will be discussed later in this paper.
Meanwhile, the difference between ρS.sus and bed density caused by the drag force of the rising airflow during the single feeding particle separation process is defined as ρS.drag, as shown in Equation (17):
ρ S . d r a g = F d g V = 3 C D ρ f ( v g v p ) 2 4 g d p
The calculation method for bed density when the single feeding particles are suspended in the gas–solid separation fluidized bed is shown in Equation (18):
ρ S . s u s = ρ S . d r a g + ρ b e d
The position of each particle is measured, and then the pressure drop at that point is measured under the same operating parameters to obtain the density of that point, which is the experimental bed density when the single feeding particles are suspended in the gas–solid separation fluidized bed. The calculation formula is shown in Equation (19):
ρ s u s . exp = Δ P B g Δ H
where ΔH is the height difference between the different pressure measurement points.

4. Results and Discussion

4.1. Movement Behavior of Non-Spherical Single Feeding Particles in the Gas–Solid Separation Fluidized Bed

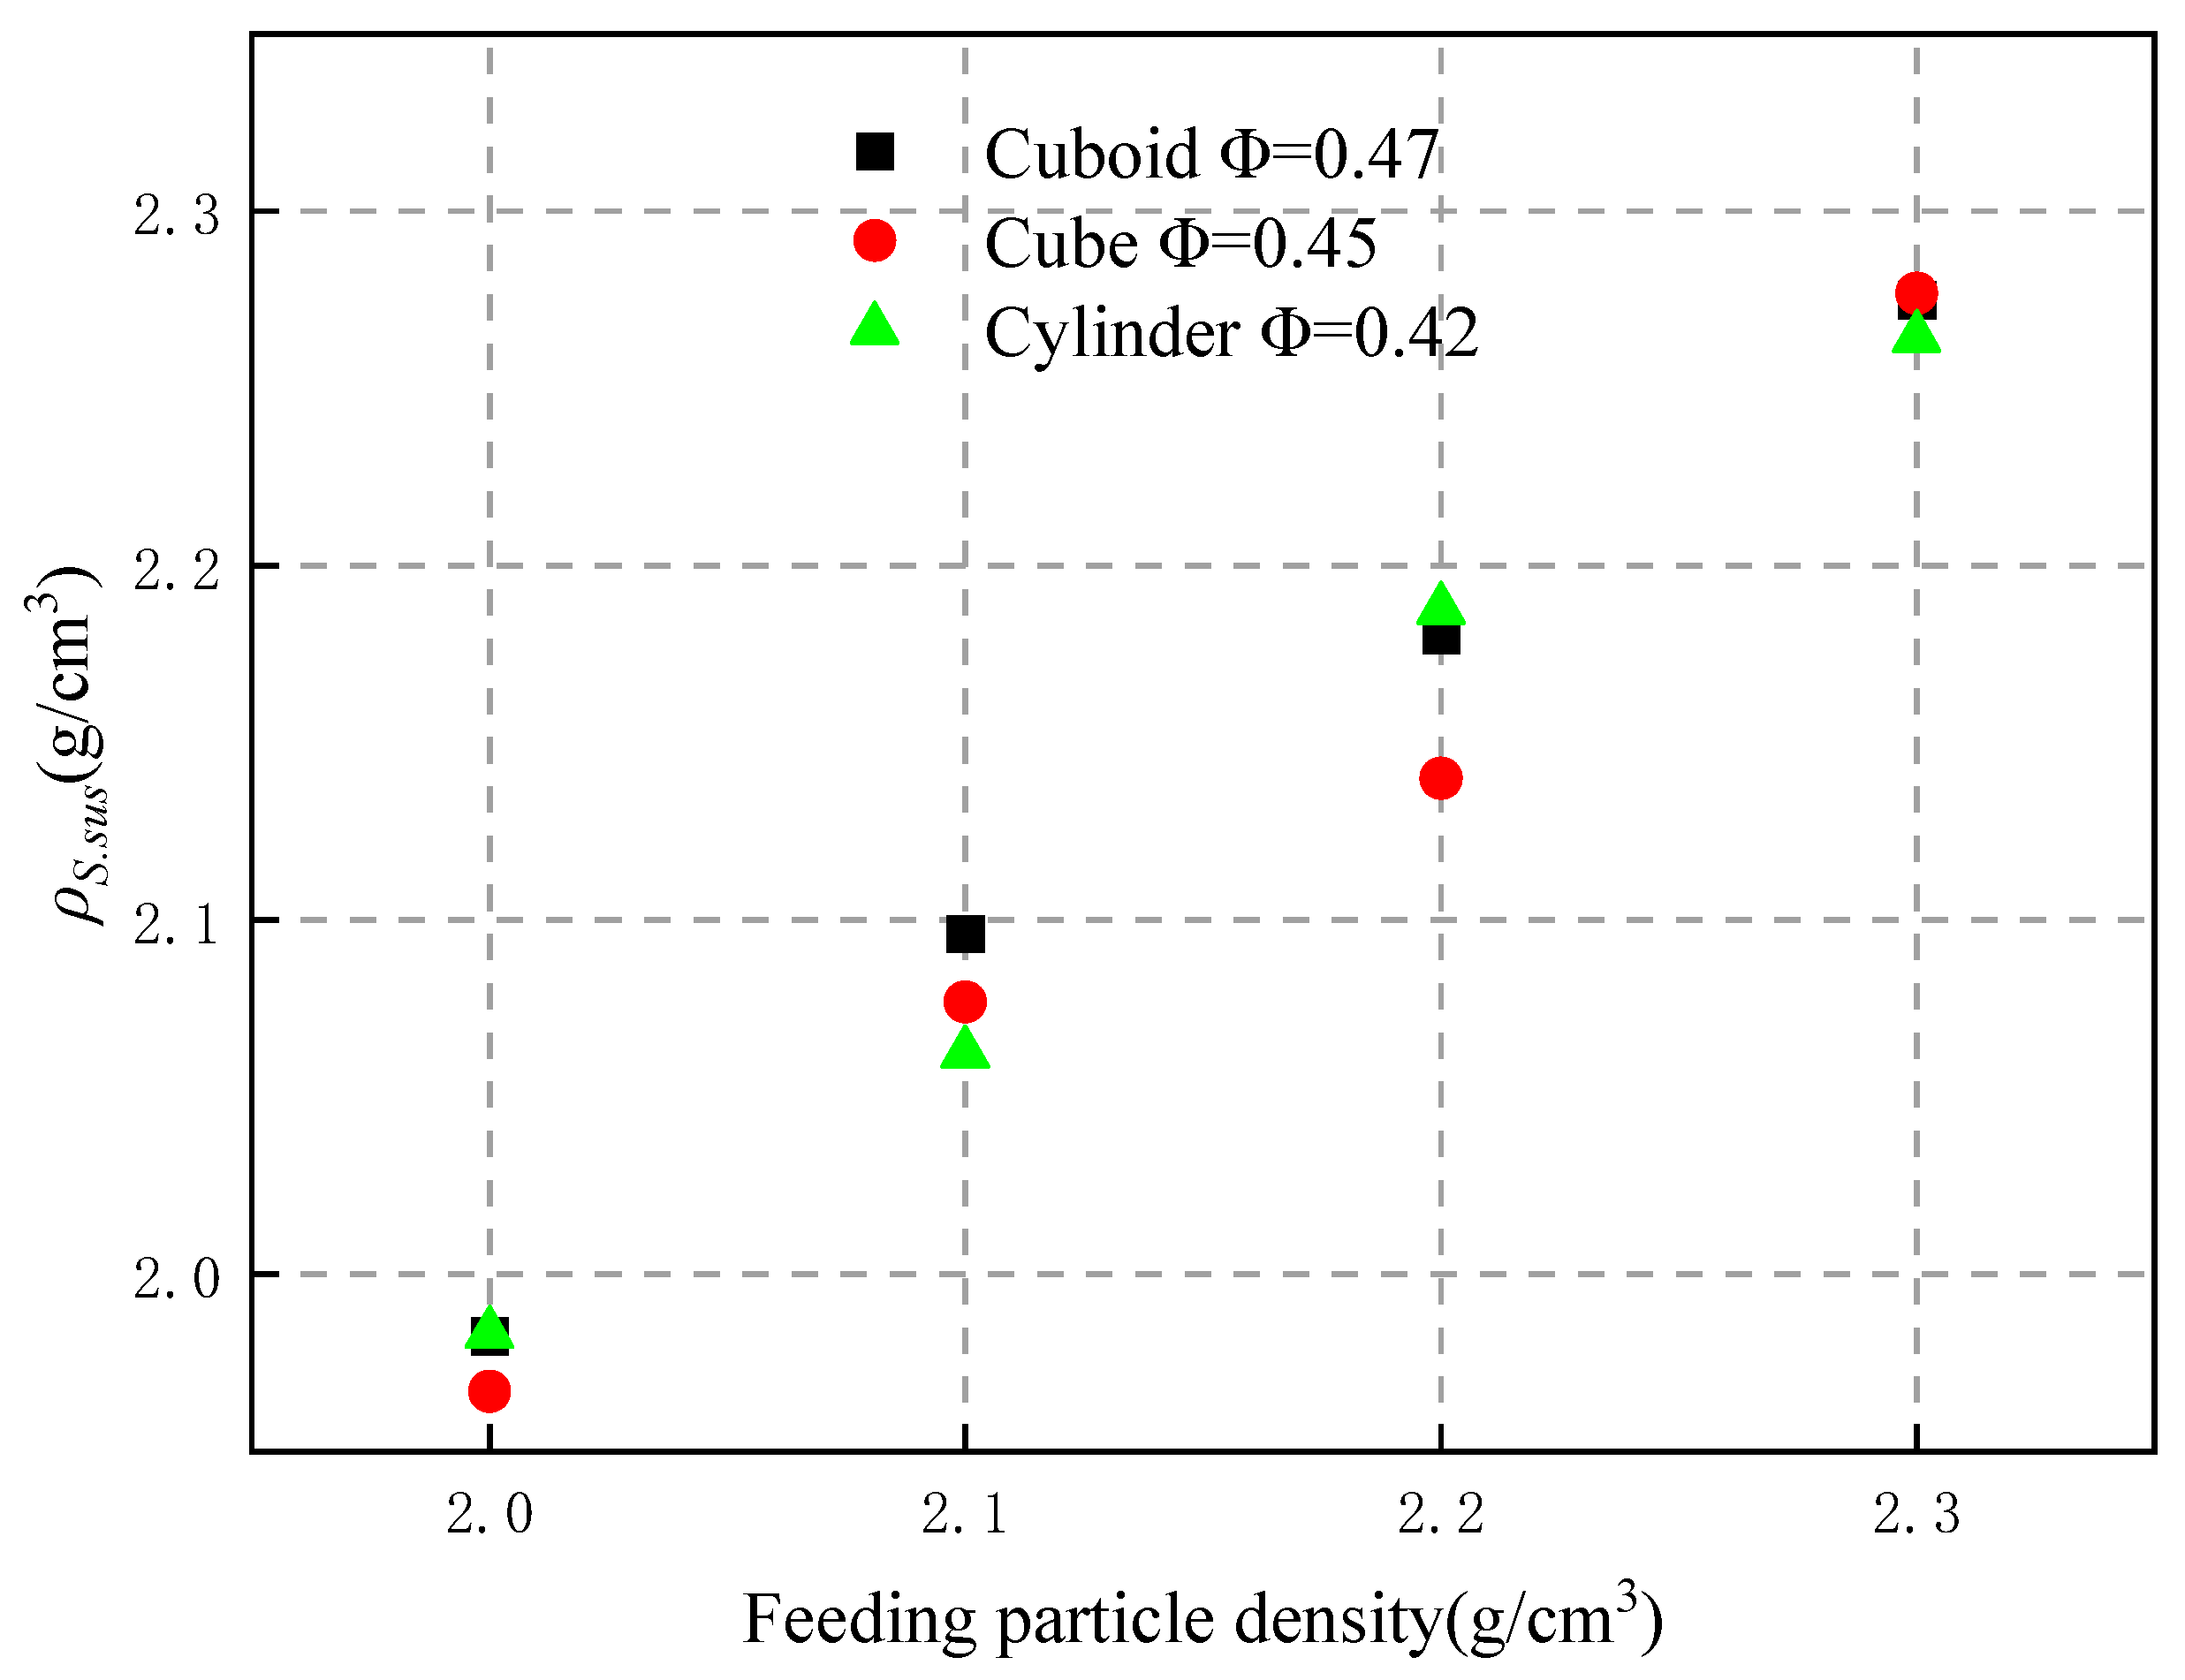
4.1.1. Relationship Between ρS.sus and Feeding Particle Density

The relationship between ρS.sus and feeding particle density is shown in Figure 4. The bed height is 120 mm and the operating gas velocity is 0.148 m/s.
As shown in Figure 4, with the increase in the feeding particle density, ρS.sus also increases. When the feeding particle density increases, the terminal sinking velocity of the particle gradually increases. A higher terminal sinking velocity requires a greater drag force, allowing the particle to remain in a deeper position in the fluidized bed and obtain a larger ρS.sus. ρS.sus is always slightly lower than the actual density of the feeding particle. This is because in the process of single particle separation, there is a significant influence from the bubble and emulsion phases within the bed. Feeding particles can easily be carried to positions closer to the surface of the fluidized bed due to the rising bubbles, thus causing ρS.sus to be lower than the actual particle density.

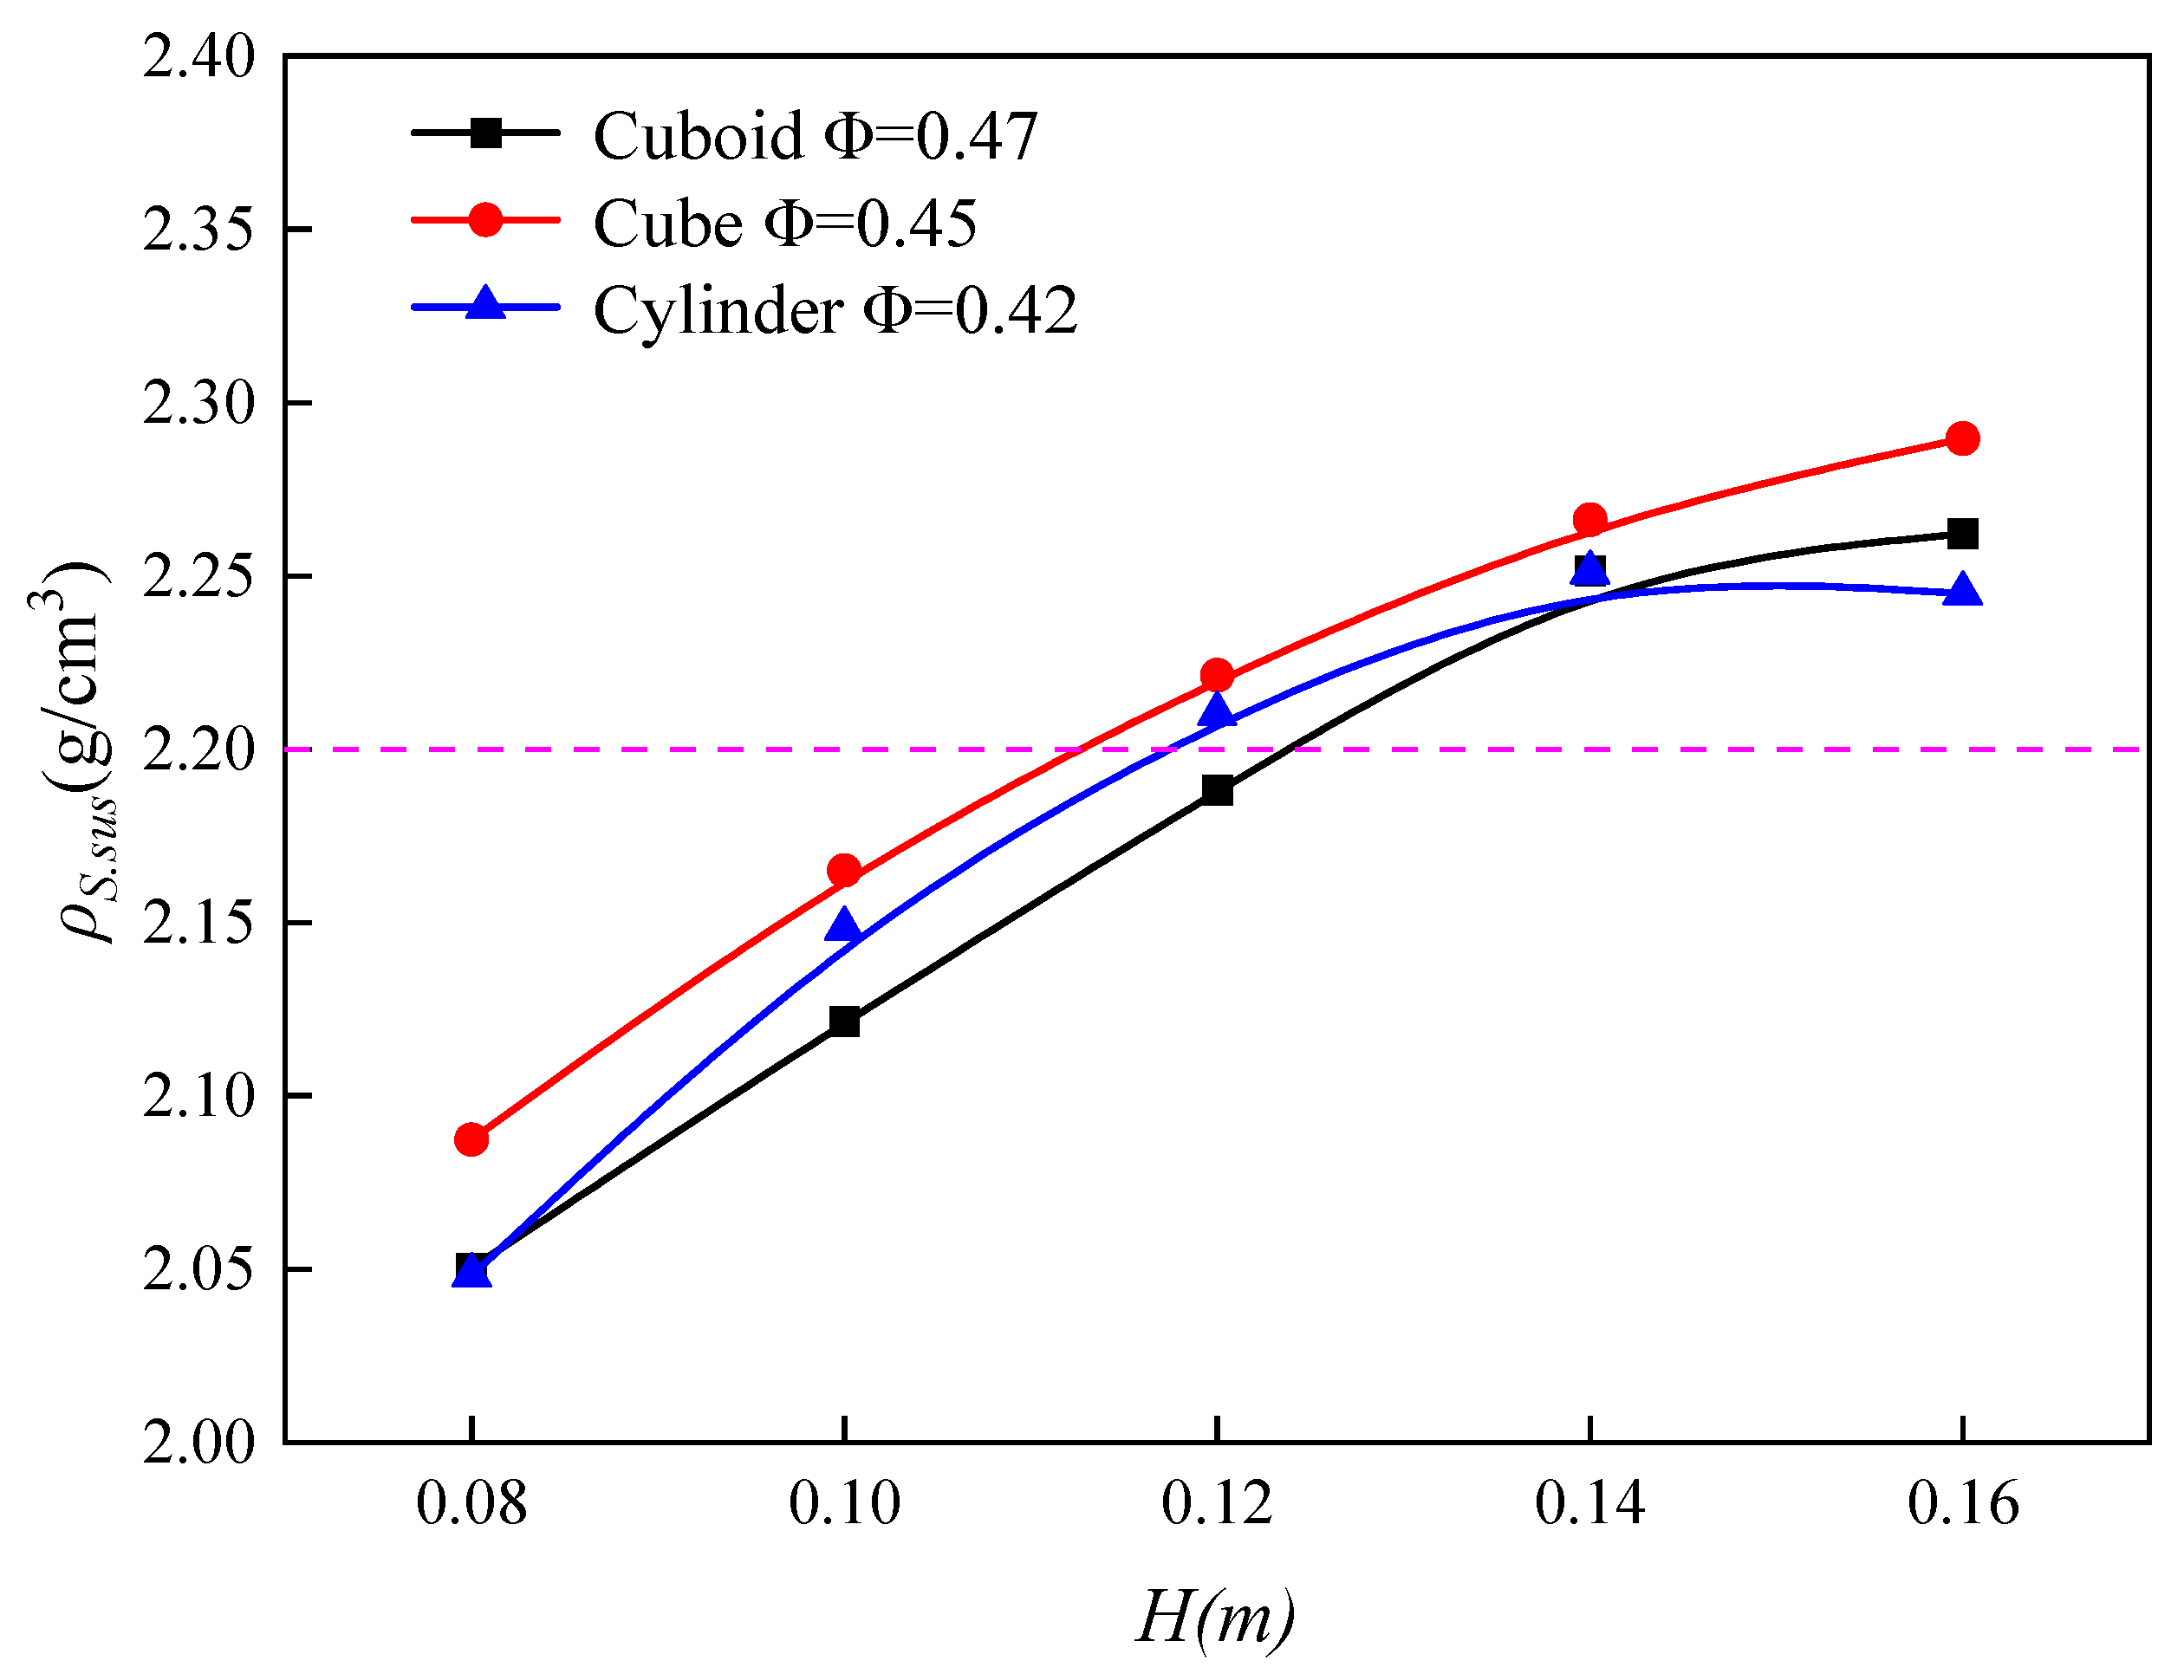
4.1.2. Relationship Between ρS.sus and Bed Height

Cuboid-, cube-, and cylinder-shaped particles with a density of 2.2 g/cm3 were selected for experiments to study the relationship between ρS.sus and bed height. The operating gas velocity was 0.148 m/s. The results are shown in Figure 5 and indicate that, with the increase in bed height, the ρS.sus gradually increases. When the bed height is less than 120 mm, ρS.sus is lower than the particle density, whereas when the bed height is greater than 120 mm, ρS.sus exceeds the particle density. This suggests that when the bed height is relatively low, coal particles do not have sufficient separation space and thus they are more likely to remain in the upper layer of the fluidized bed, causing ρS.sus to be lower. With increasing bed height, the movement of the bubble and emulsion phases intensifies, specifically manifested by the increase in bubble size, accompanied by enhanced particle back-mixing. During the separation process, the feeding particles are more likely to be affected by the uneven structure of the fluidized bed, especially the effect of channel flow, which can easily cause an increase in ρS.sus. Only by maintaining a reasonable bed height in the fluidized bed can the feeding particles be effectively separated.

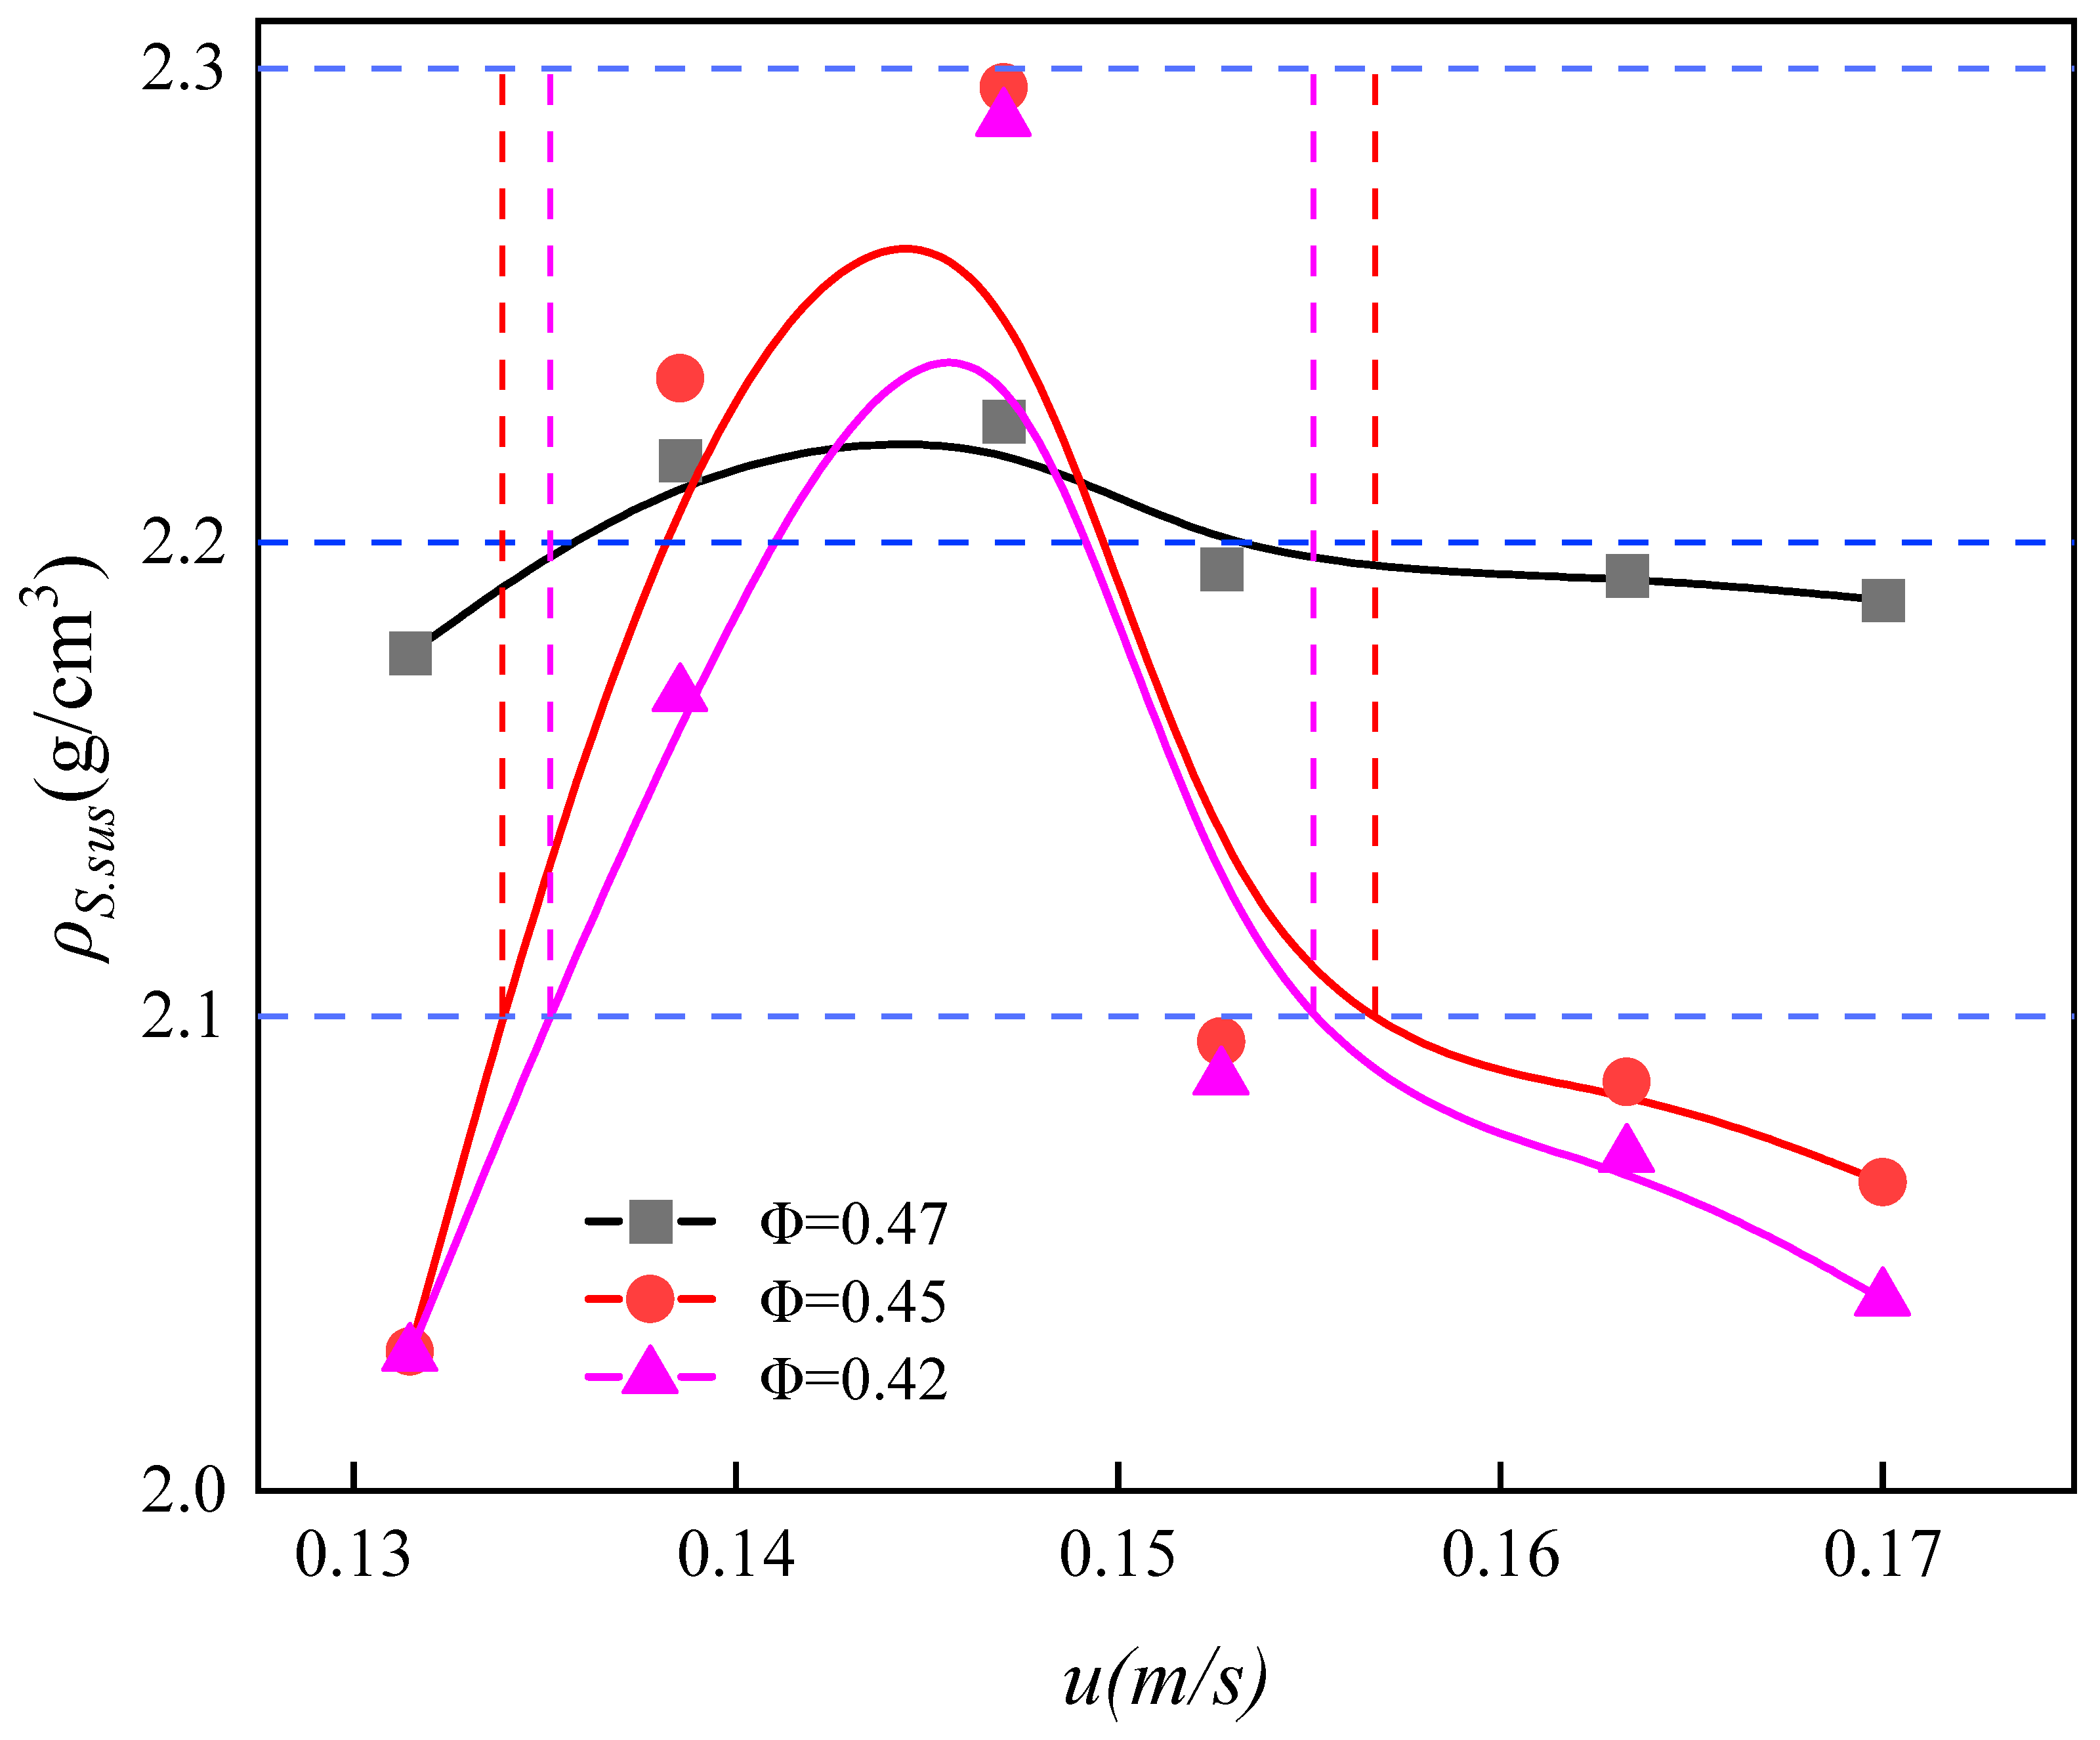
4.1.3. Relationship Between ρS.sus and Gas Velocity

Cuboid-, cube-, and cylinder-shaped particles with a density of 2.2 g/cm3 were selected for experiments to study the relationship between ρS.sus and gas velocity. The bed height was 120 mm. The results are shown in Figure 6. As the gas velocity increases, ρS.sus exhibits a trend of first increasing and then decreasing. When the Φ is 0.47, the error of ρS.sus is below 0.1 g/cm3 within the experimental gas velocities. When Φ is 0.45, the gas velocity is between 0.133 m/s and 0.156 m/s, and the ρS.sus error is below 0.1 g/cm3. When Φ is 0.42, the gas velocity is between 0.135 m/s and 0.155 m/s, and the ρS.sus error is below 0.1 g/cm3. This indicates that with an increase in the sphericity coefficient, the adjustable range of the gas velocity increases. When the gas velocity is low, the bed porosity is low, the frequency of gas exchange between the bubble phase and emulsion phase is low, and the bed activity is low, resulting in greater resistance to particle separation. It is difficult for single feeding particles to enter suitable regions for separation, and they remain on the bed surface, resulting in a lower ρS.sus. When the gas velocity is appropriate, with increasing bed expansion, the exchange frequency between the bubble phase and emulsion phase increases, the bed state is stable, and the density of the feeding particles approaches ρS.sus. However, as the gas velocity further increases, this leads to the growth and coalescence of bubbles in the vertical direction of the bed, and more frequent gas exchange between the emulsion phase and bubble phase. Part of the gas in the emulsion phase enters the bubble phase through exchange, enlarging the proportion of bubbles in the fluidized bed. Since bed density is composed of both bubble and emulsion phases, the increasing proportion of the bubble phase results in a reduction in ρS.sus.

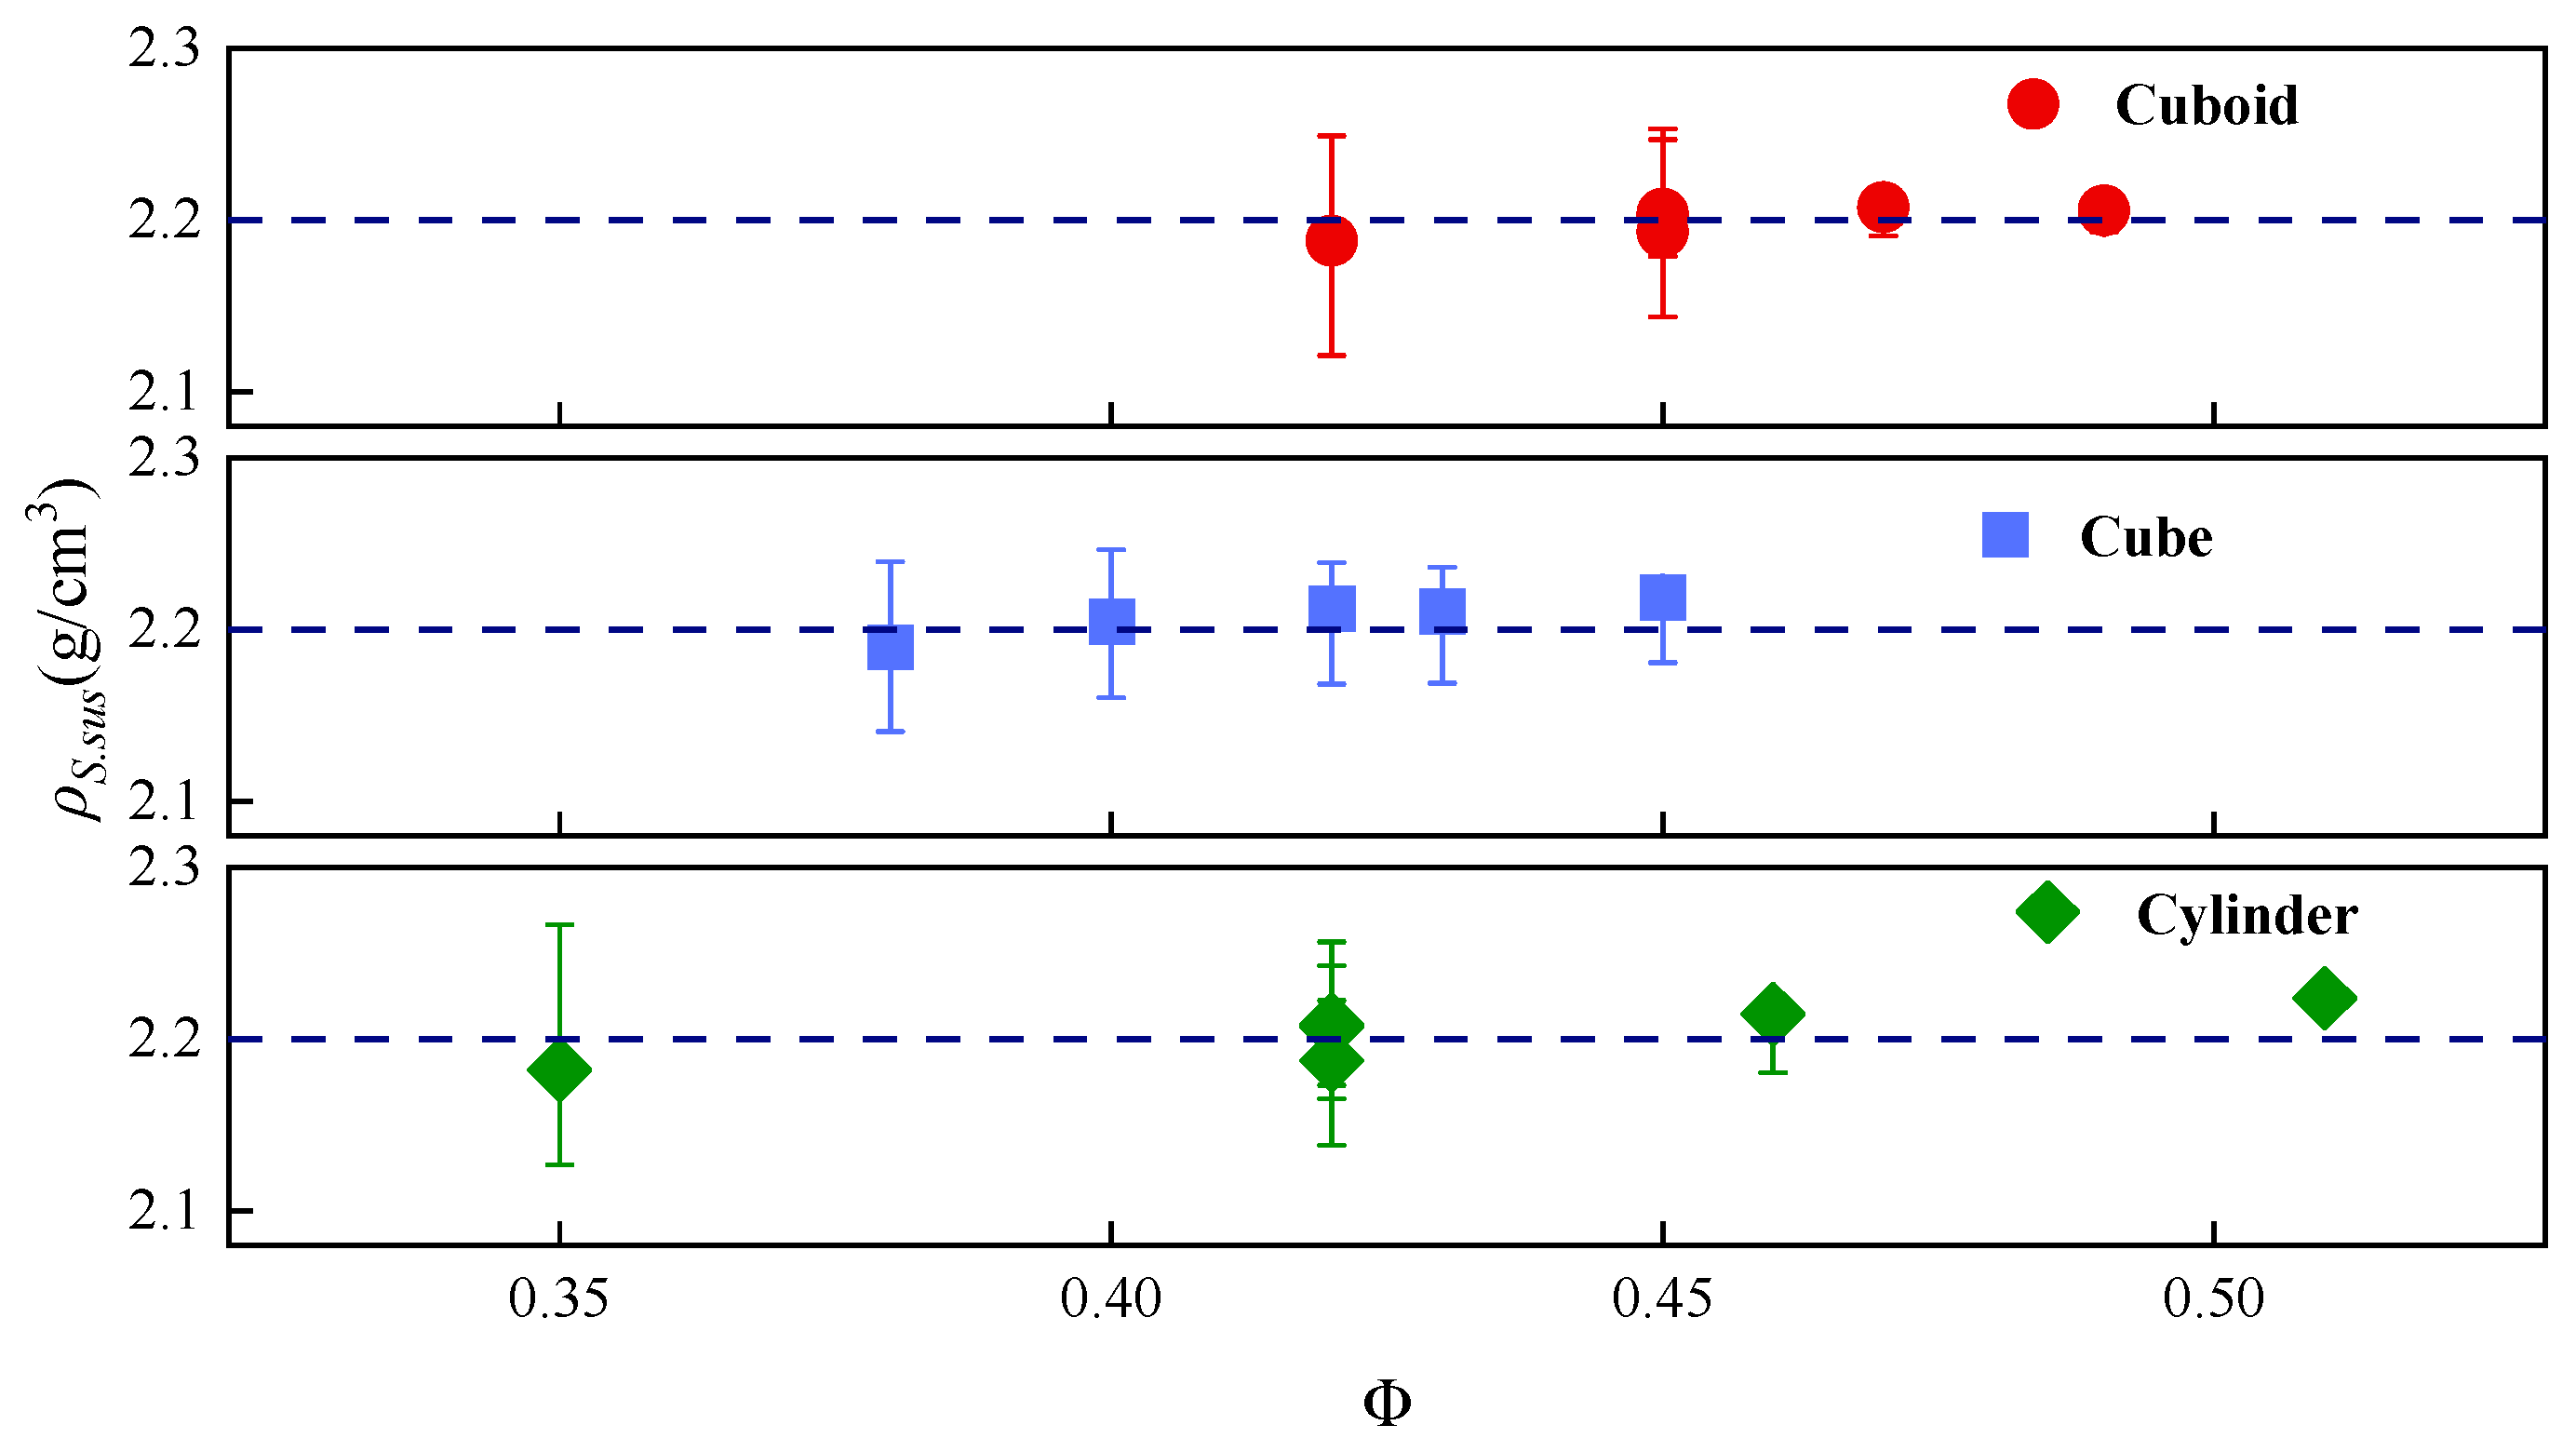
4.1.4. Relationship Between ρS.sus and Sphericity Coefficient

Under appropriate separation conditions, feeding particles with a density of 2.2 g/cm3 were used. Multiple separation experiments were conducted, and the ρS.sus was recorded. The relationship between ρS.sus and sphericity coefficient is shown in Figure 7. From Figure 7, it can be seen that the range of density fluctuations of cuboid, cube, and cylinder particles gradually decreases and tends to stabilize with the increase in the sphericity coefficient. The error between the average value of ρS.sus and their actual density is controlled within 10%. This indicates that as the sphericity coefficient increases, the feeding particle becomes closer to the spherical shape, and the forces exerted by the bed on the feeding particles become more uniform in all directions. Consequently, ρS.sus tends to stabilize and the fluctuation error gradually decreases.

4.2. Movement Behavior Prediction Model and Error Analysis of Non-Spherical Single Feeding Particles in the Gas–Solid Separation Fluidized Bed

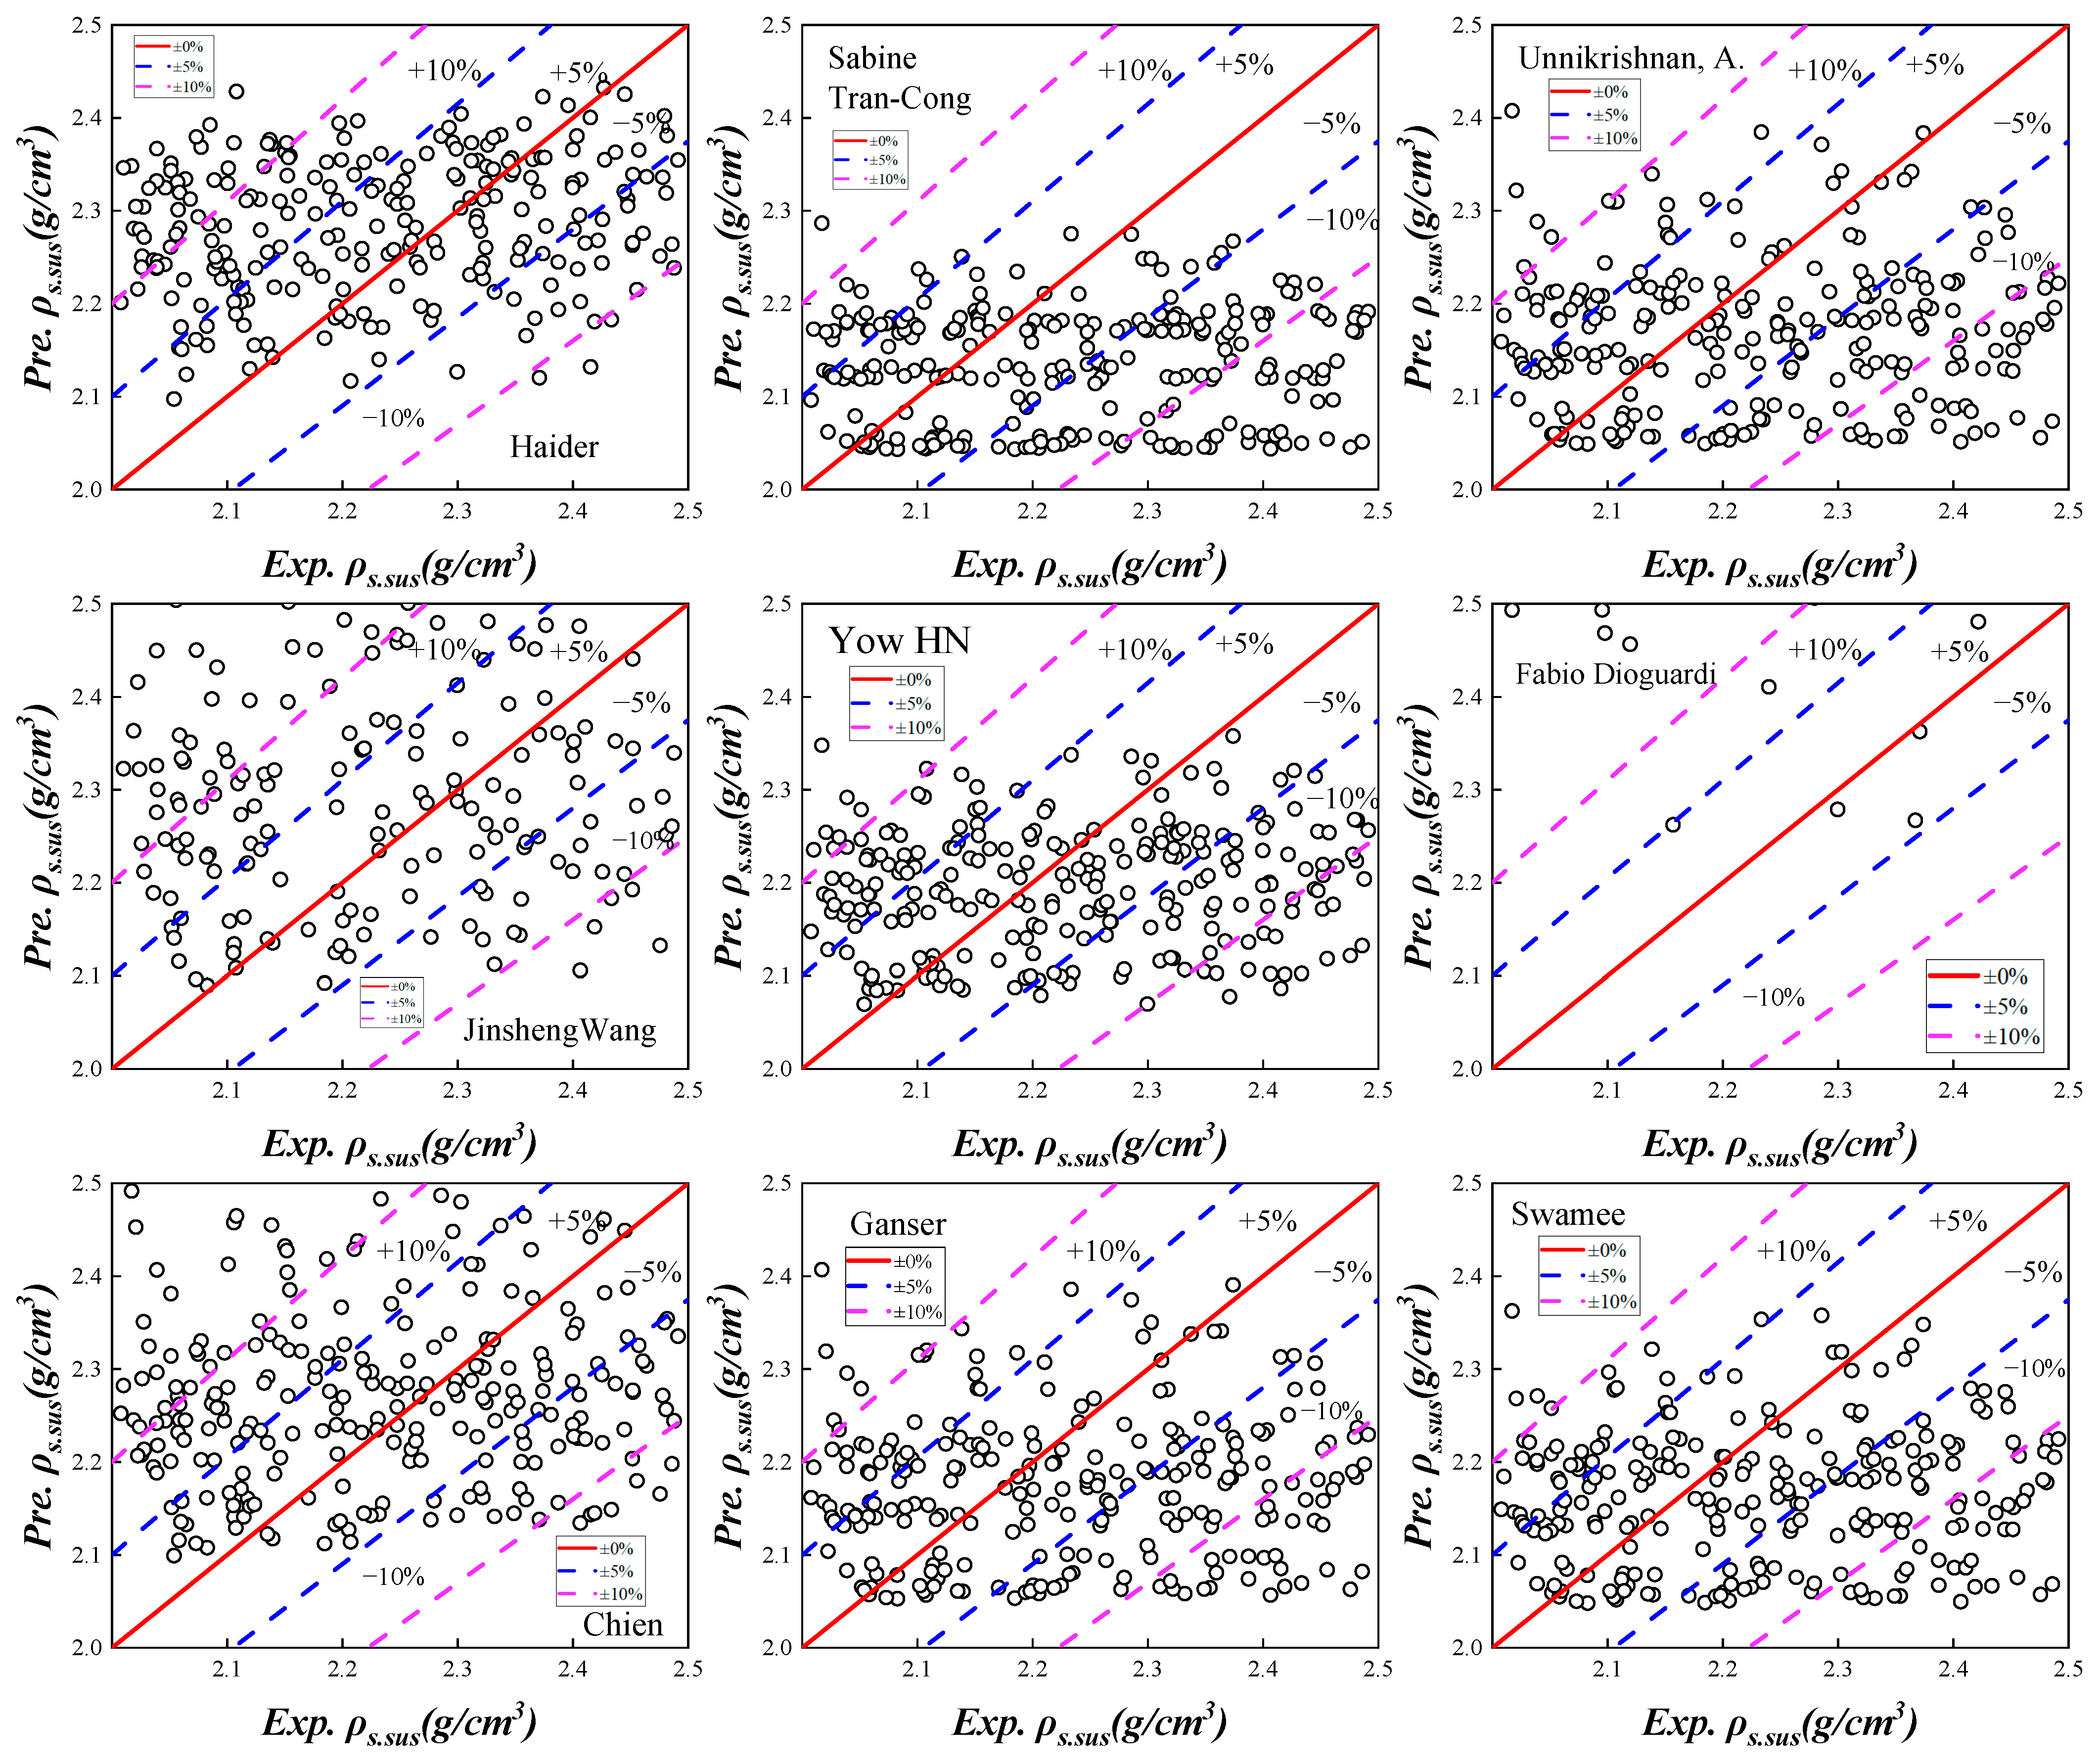
4.2.1. Relationship Between ρS.sus and Drag Coefficient

The shape properties of feeding coal particles affect the drag coefficient, thereby having an influence on ρS.sus. In this study, drag coefficients for non-spherical particles obtained by previous research in other systems were selected to investigate their applicability in coal separation in a gas–solid separation fluidized bed, and the results are shown in Table 2. The expressions of the drag coefficient in Table 2 were substituted into the calculation formula for ρS.sus, and the linear fit results for the experimental ρS.sus of single feeding coal particles are shown in Figure 8.
The density of a single particle is considered an object, and the fitting accuracy is represented by the slope of the fitting. The higher the fitting accuracy, the closer the Pre. ρS.sus is to the Exp. ρS.sus, indicating that the drag coefficient model has a high degree of suitability for the results and conforms well to the actual separation conditions of the gas–solid separation fluidized bed. The fitting accuracy of various drag coefficient models to ρS.sus is shown in Figure 9. From Equation (18), ρS.sus is modified based on the bed density using ρS.drag; thus, high accuracy and confidence are required for ρS.sus prediction. Models with a fitting accuracy greater than 98% include the Haider, Unnikrishnan, A., and Ganser models, but the predictive accuracy for single feeding particle separation still needs to be improved.
As shown in Figure 10, an error analysis was conducted between Pre. ρS.sus and Exp. ρS.sus. The drag coefficient models described by Jinsheng Wang and Fabio Dioguardi have poor prediction performance, with a confidence level of less than 75% when the prediction accuracy is 80%. For the remaining drag coefficient models, the confidence level is close to 100% when the prediction accuracy is 80%. A comparison of the prediction accuracy of the ρS.sus model is shown in Figure 11. When the ρS.sus prediction is made with the Haider drag coefficient model, the confidence level is 45.99% at a 95% prediction accuracy; meanwhile, when the confidence level is 82.93%, the prediction accuracy is 90%. The ρS.sus prediction values using the Haider drag coefficient model are the closest to the experimental values among the selected drag coefficient models. Therefore, the Haider model was chosen as the drag coefficient model for the ρS.sus prediction in this study.

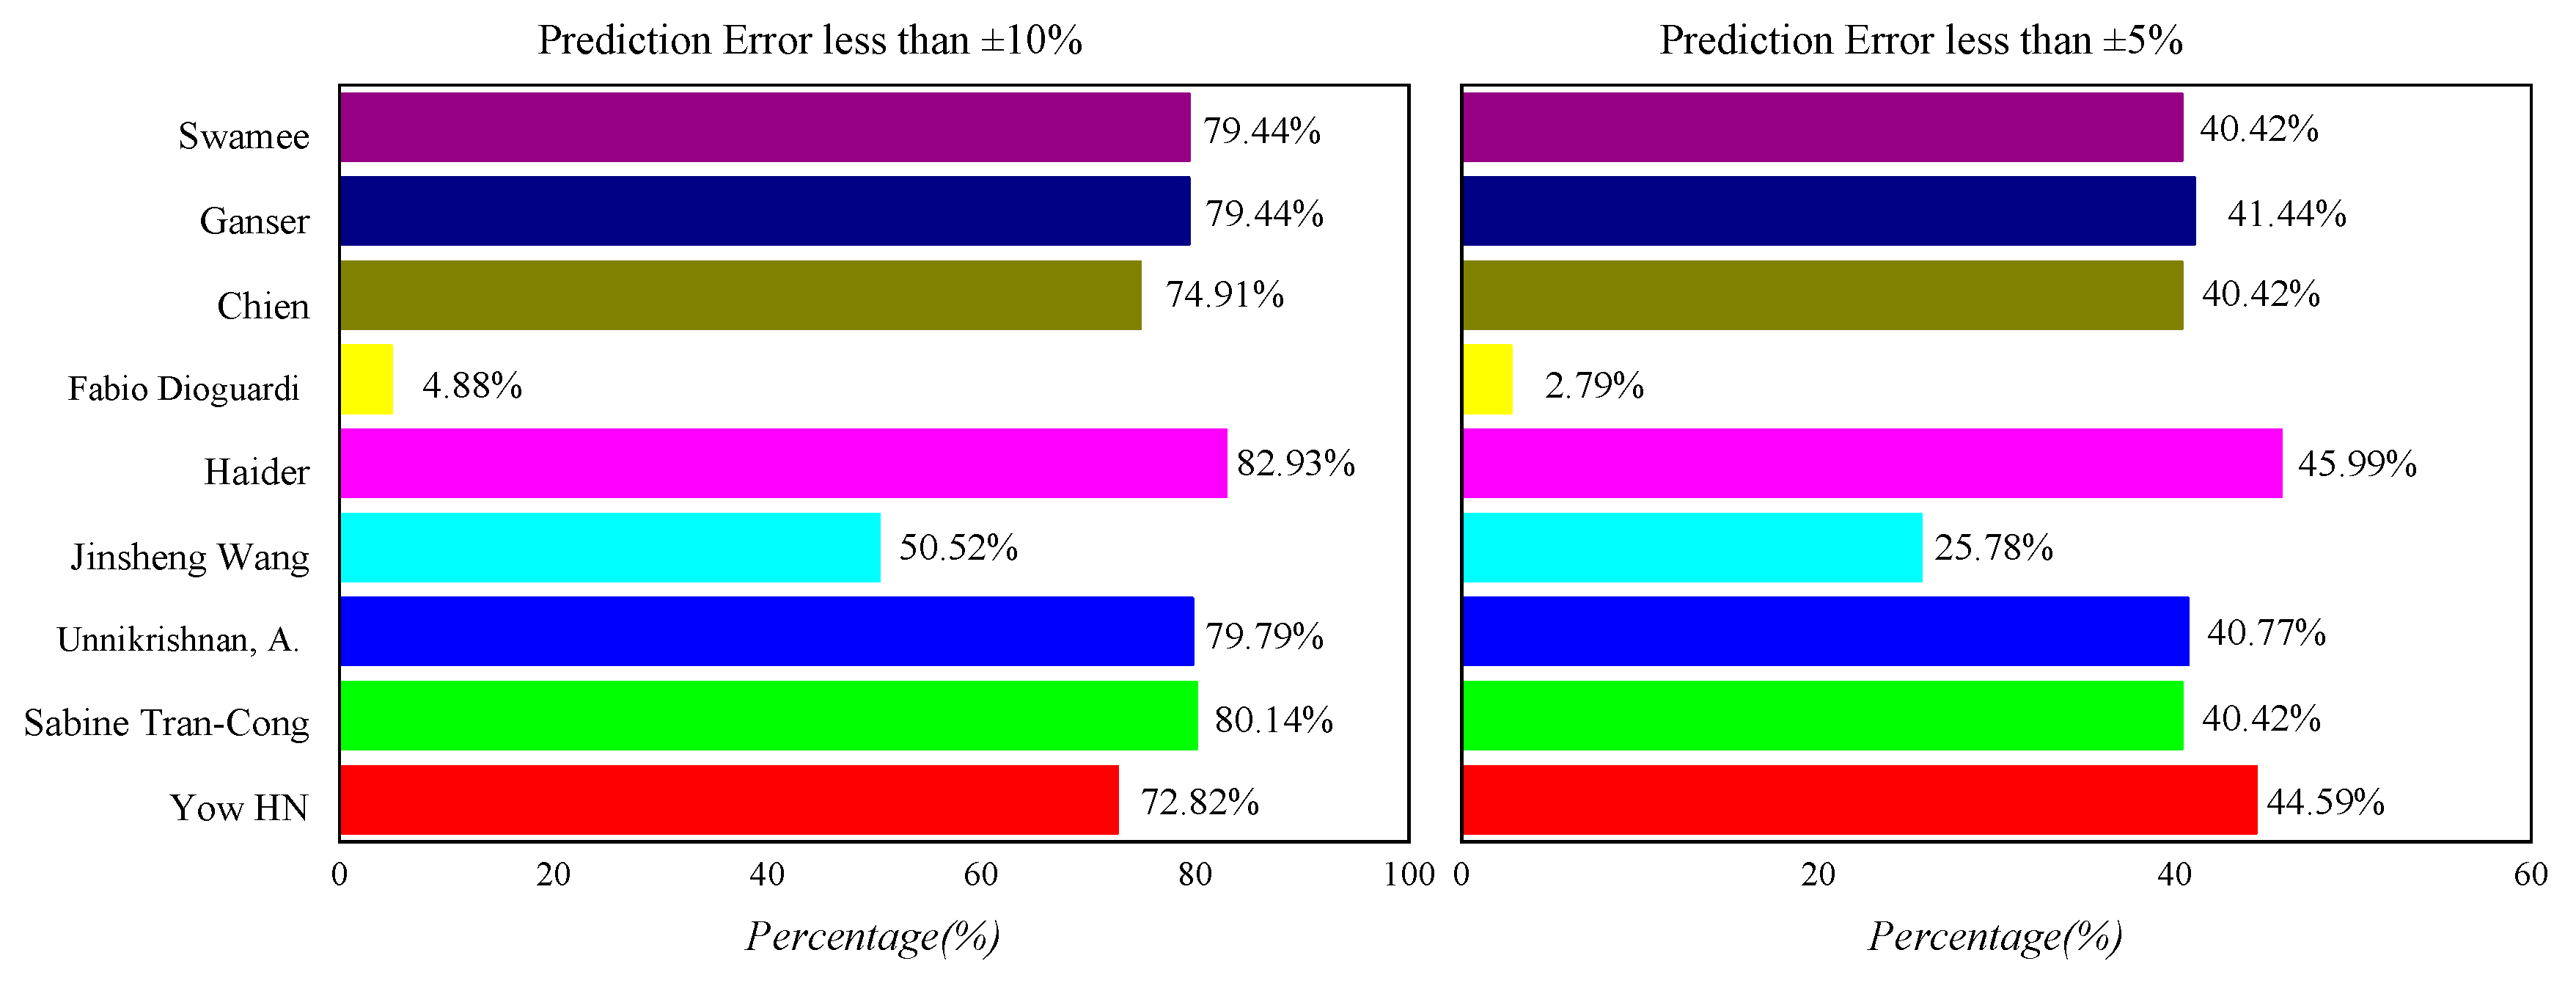
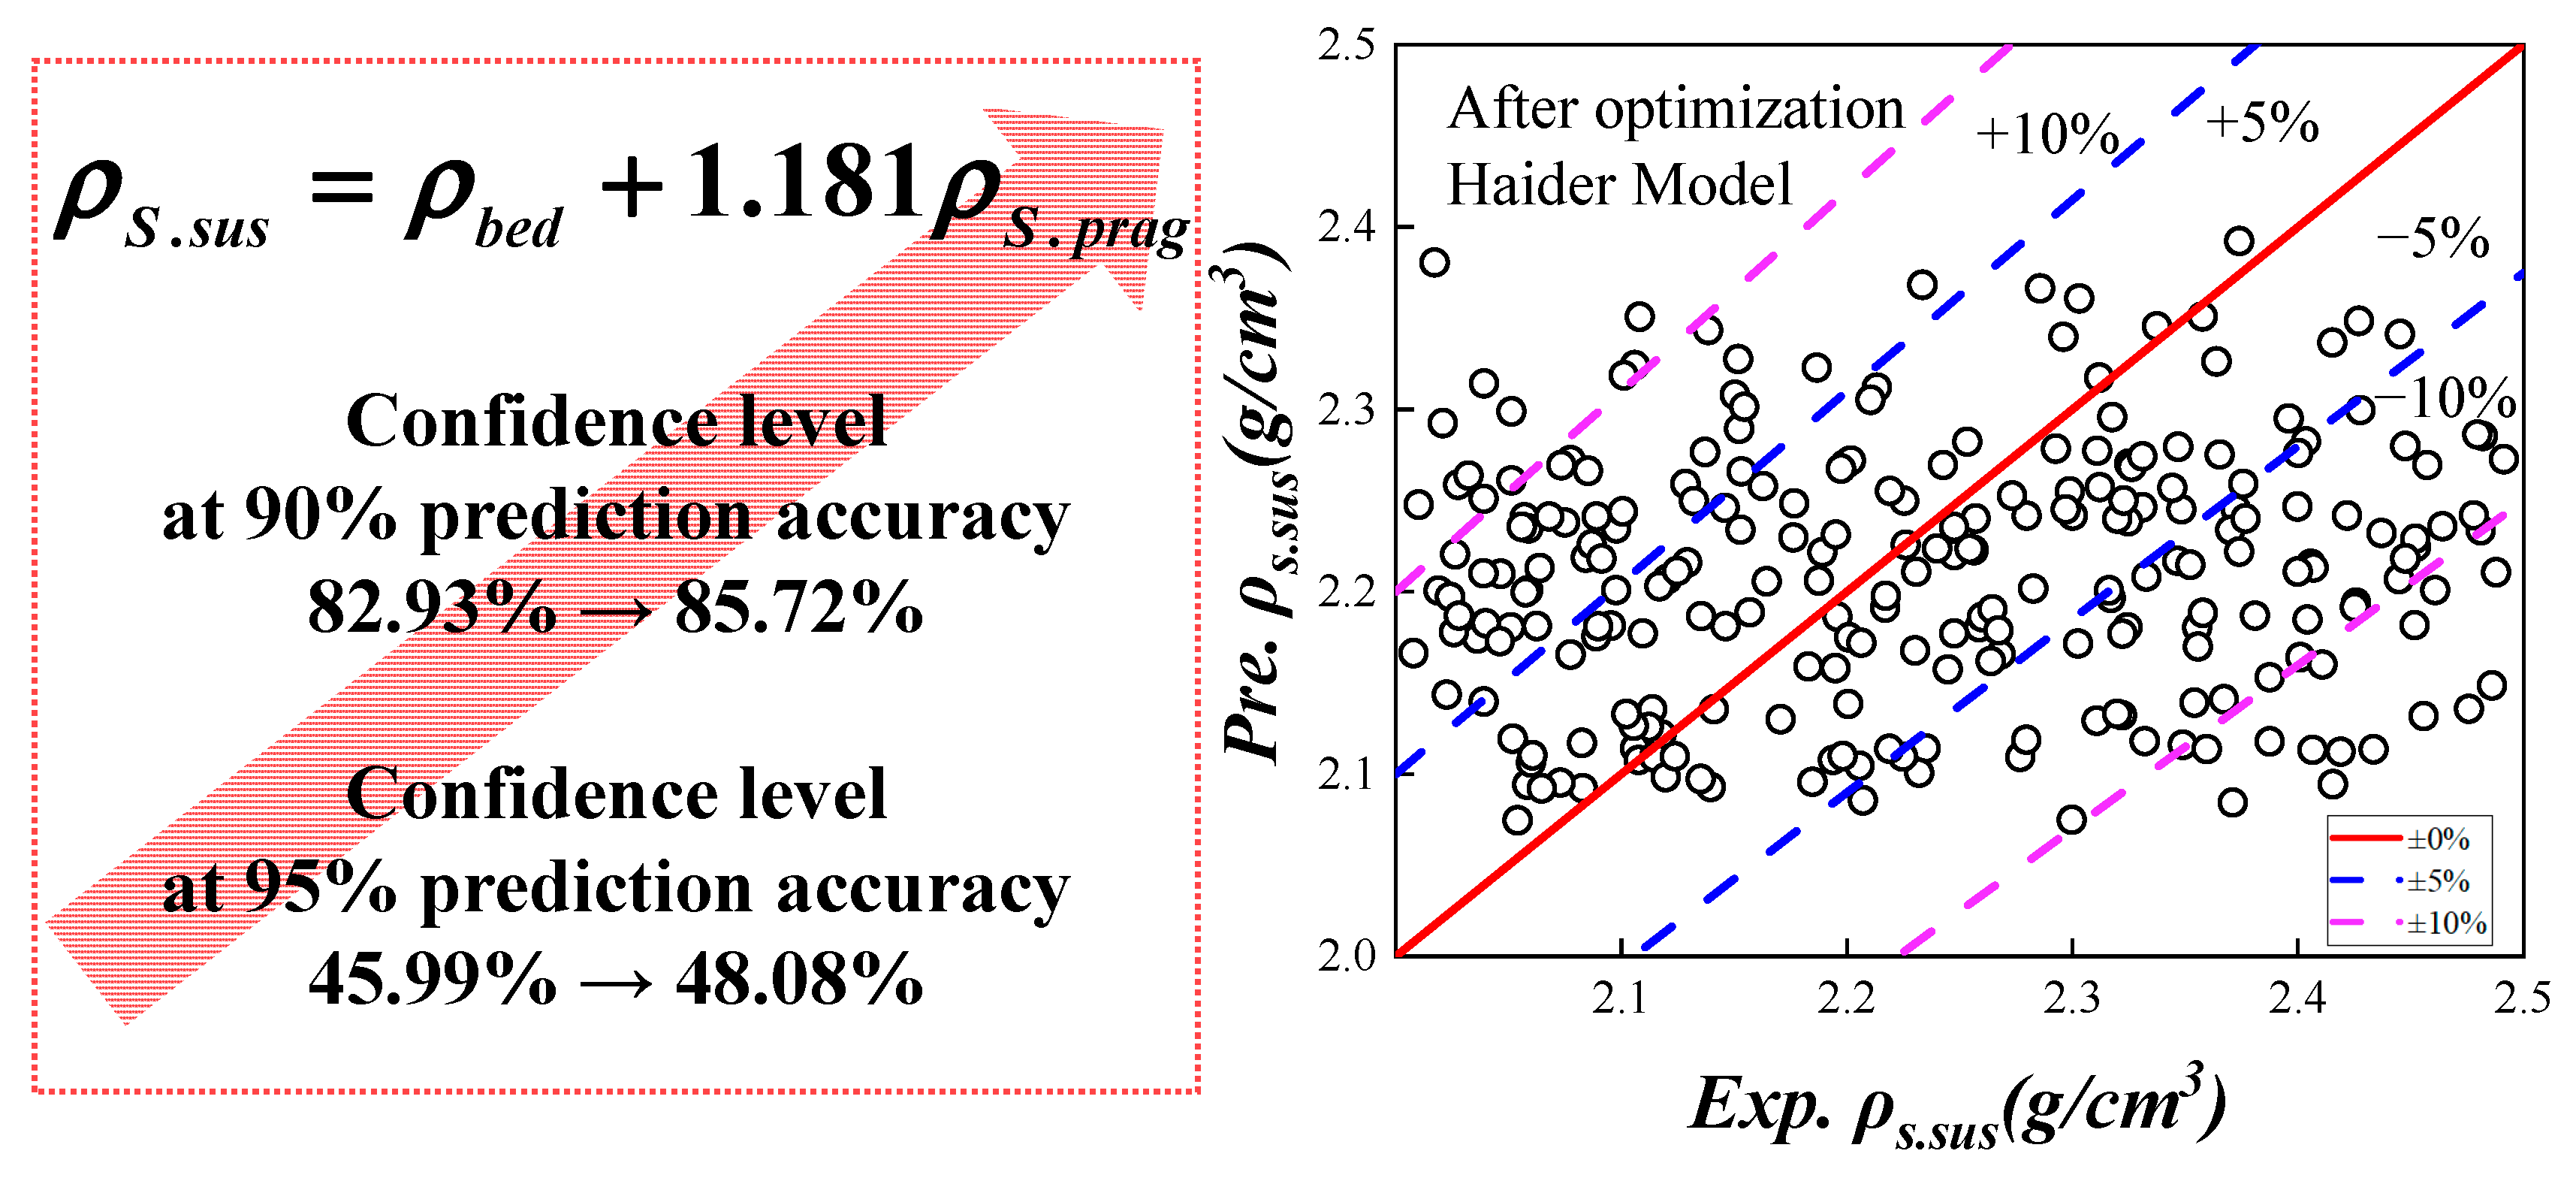
4.2.2. Optimization of the ρS.sus Prediction Model

Based on the Haider drag coefficient model, the calculated ρS.sus was lower, so the calculation method for ρS.sus needs to be corrected. Based on the relationship between the predicted value and the experimental value, a correction coefficient K is introduced to achieve a better prediction effect. The following correction is made, as shown in Equation (20); the K value is 1.181.
ρ S . s u s = ρ b e d + 1.181 ρ S . d r a g
The optimized prediction effect of the single feeding particle ρS.sus model is shown in Figure 12. The confidence level increases from 45.99% to 48.08% when the prediction accuracy is 95%, up 2.09%; meanwhile, the confidence level increases from 82.93% to 85.72% when the prediction accuracy is 90%, up 2.79%. The accuracy of prediction is improved to a certain extent, which can more accurately predict the ρS.sus of single feeding particle separation.
The equation for the ρS.sus prediction model for the single feeding particle separation process is obtained as Equation (21):
ρ S . s e p = ρ b e d + 1.181 ρ S . d r a g ρ b e d = 0.9565 ρ s × 1 ε m f + ρ g × ε m f 1 ε b + ρ g ε b ρ S . d r a g = F d g V = 3 C D ρ f v g v p 2 4 g d p C D = 24 R e 1 + C 4 R e C 5 + C 6 / 1 + C 7 / R e C 4 = , exp 2.33 6.46 Φ + 2.45 Φ 2 C 5 = 0.096 + 0.556 Φ C 6 = , exp 4.90 13.89 Φ + 18.42 Φ 2 10.26 Φ 3 C 7 = , exp 1.47 + 12.26 Φ 20.73 Φ 2 15.89 Φ 3

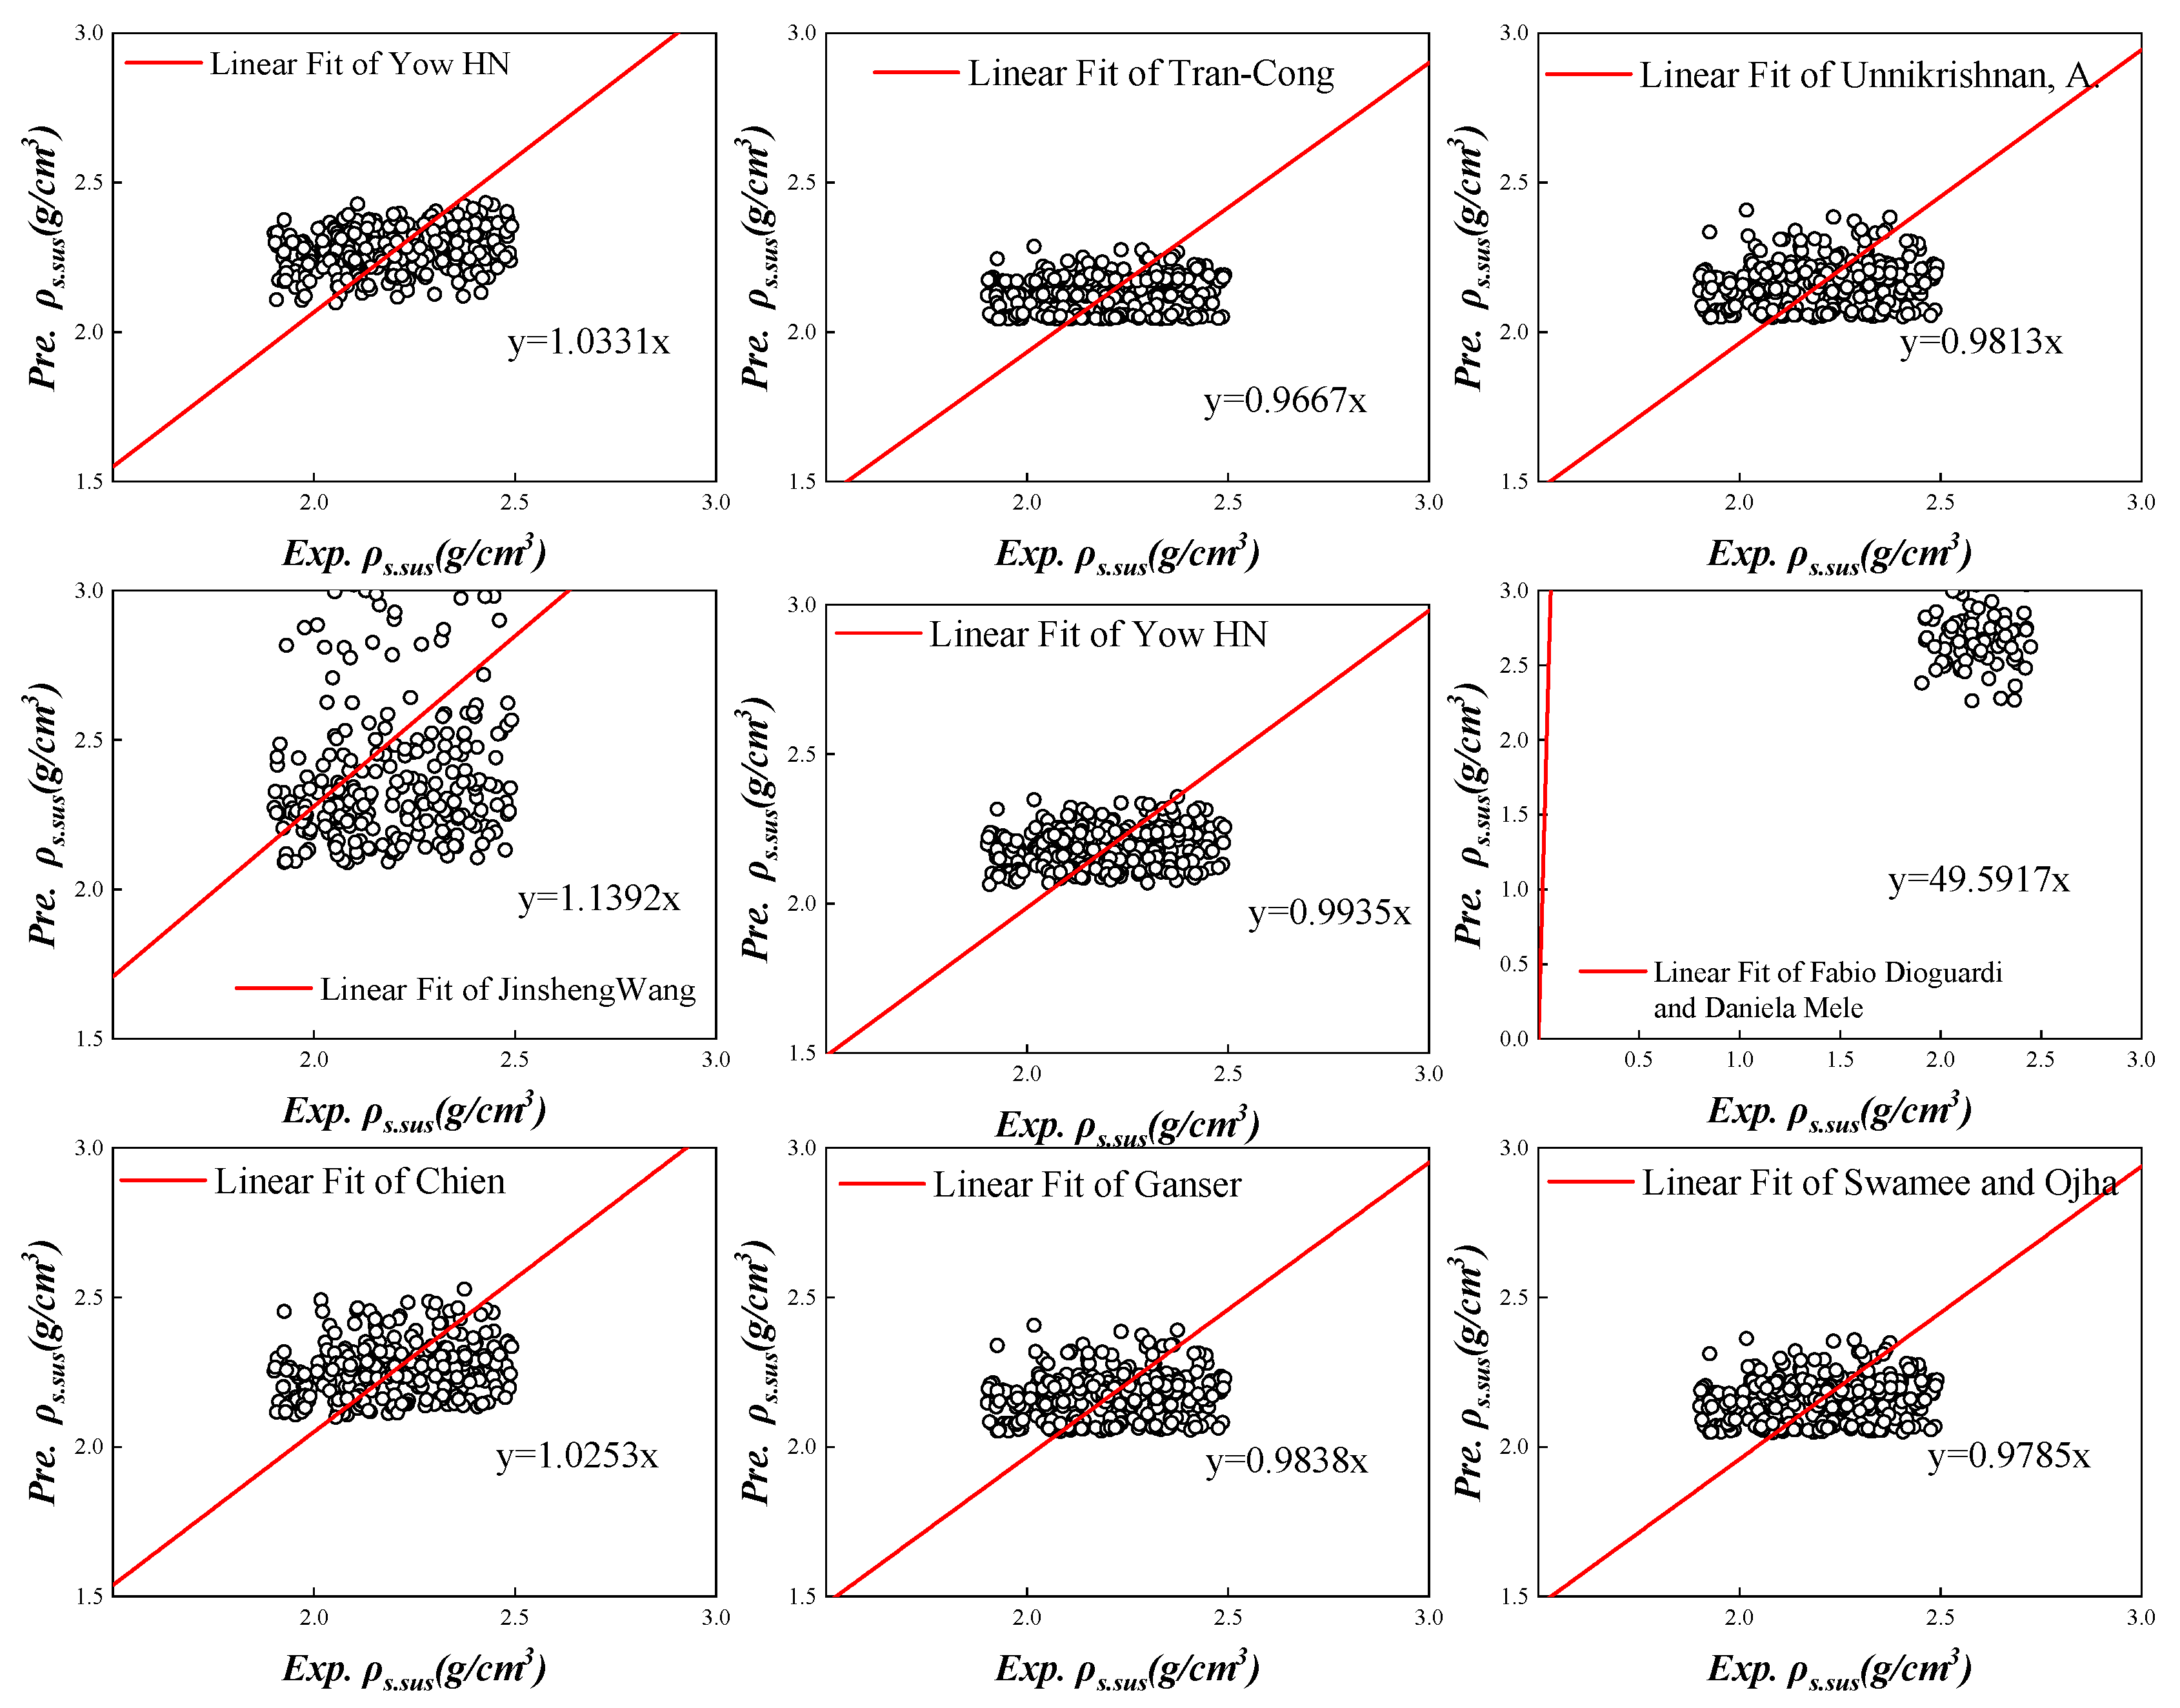
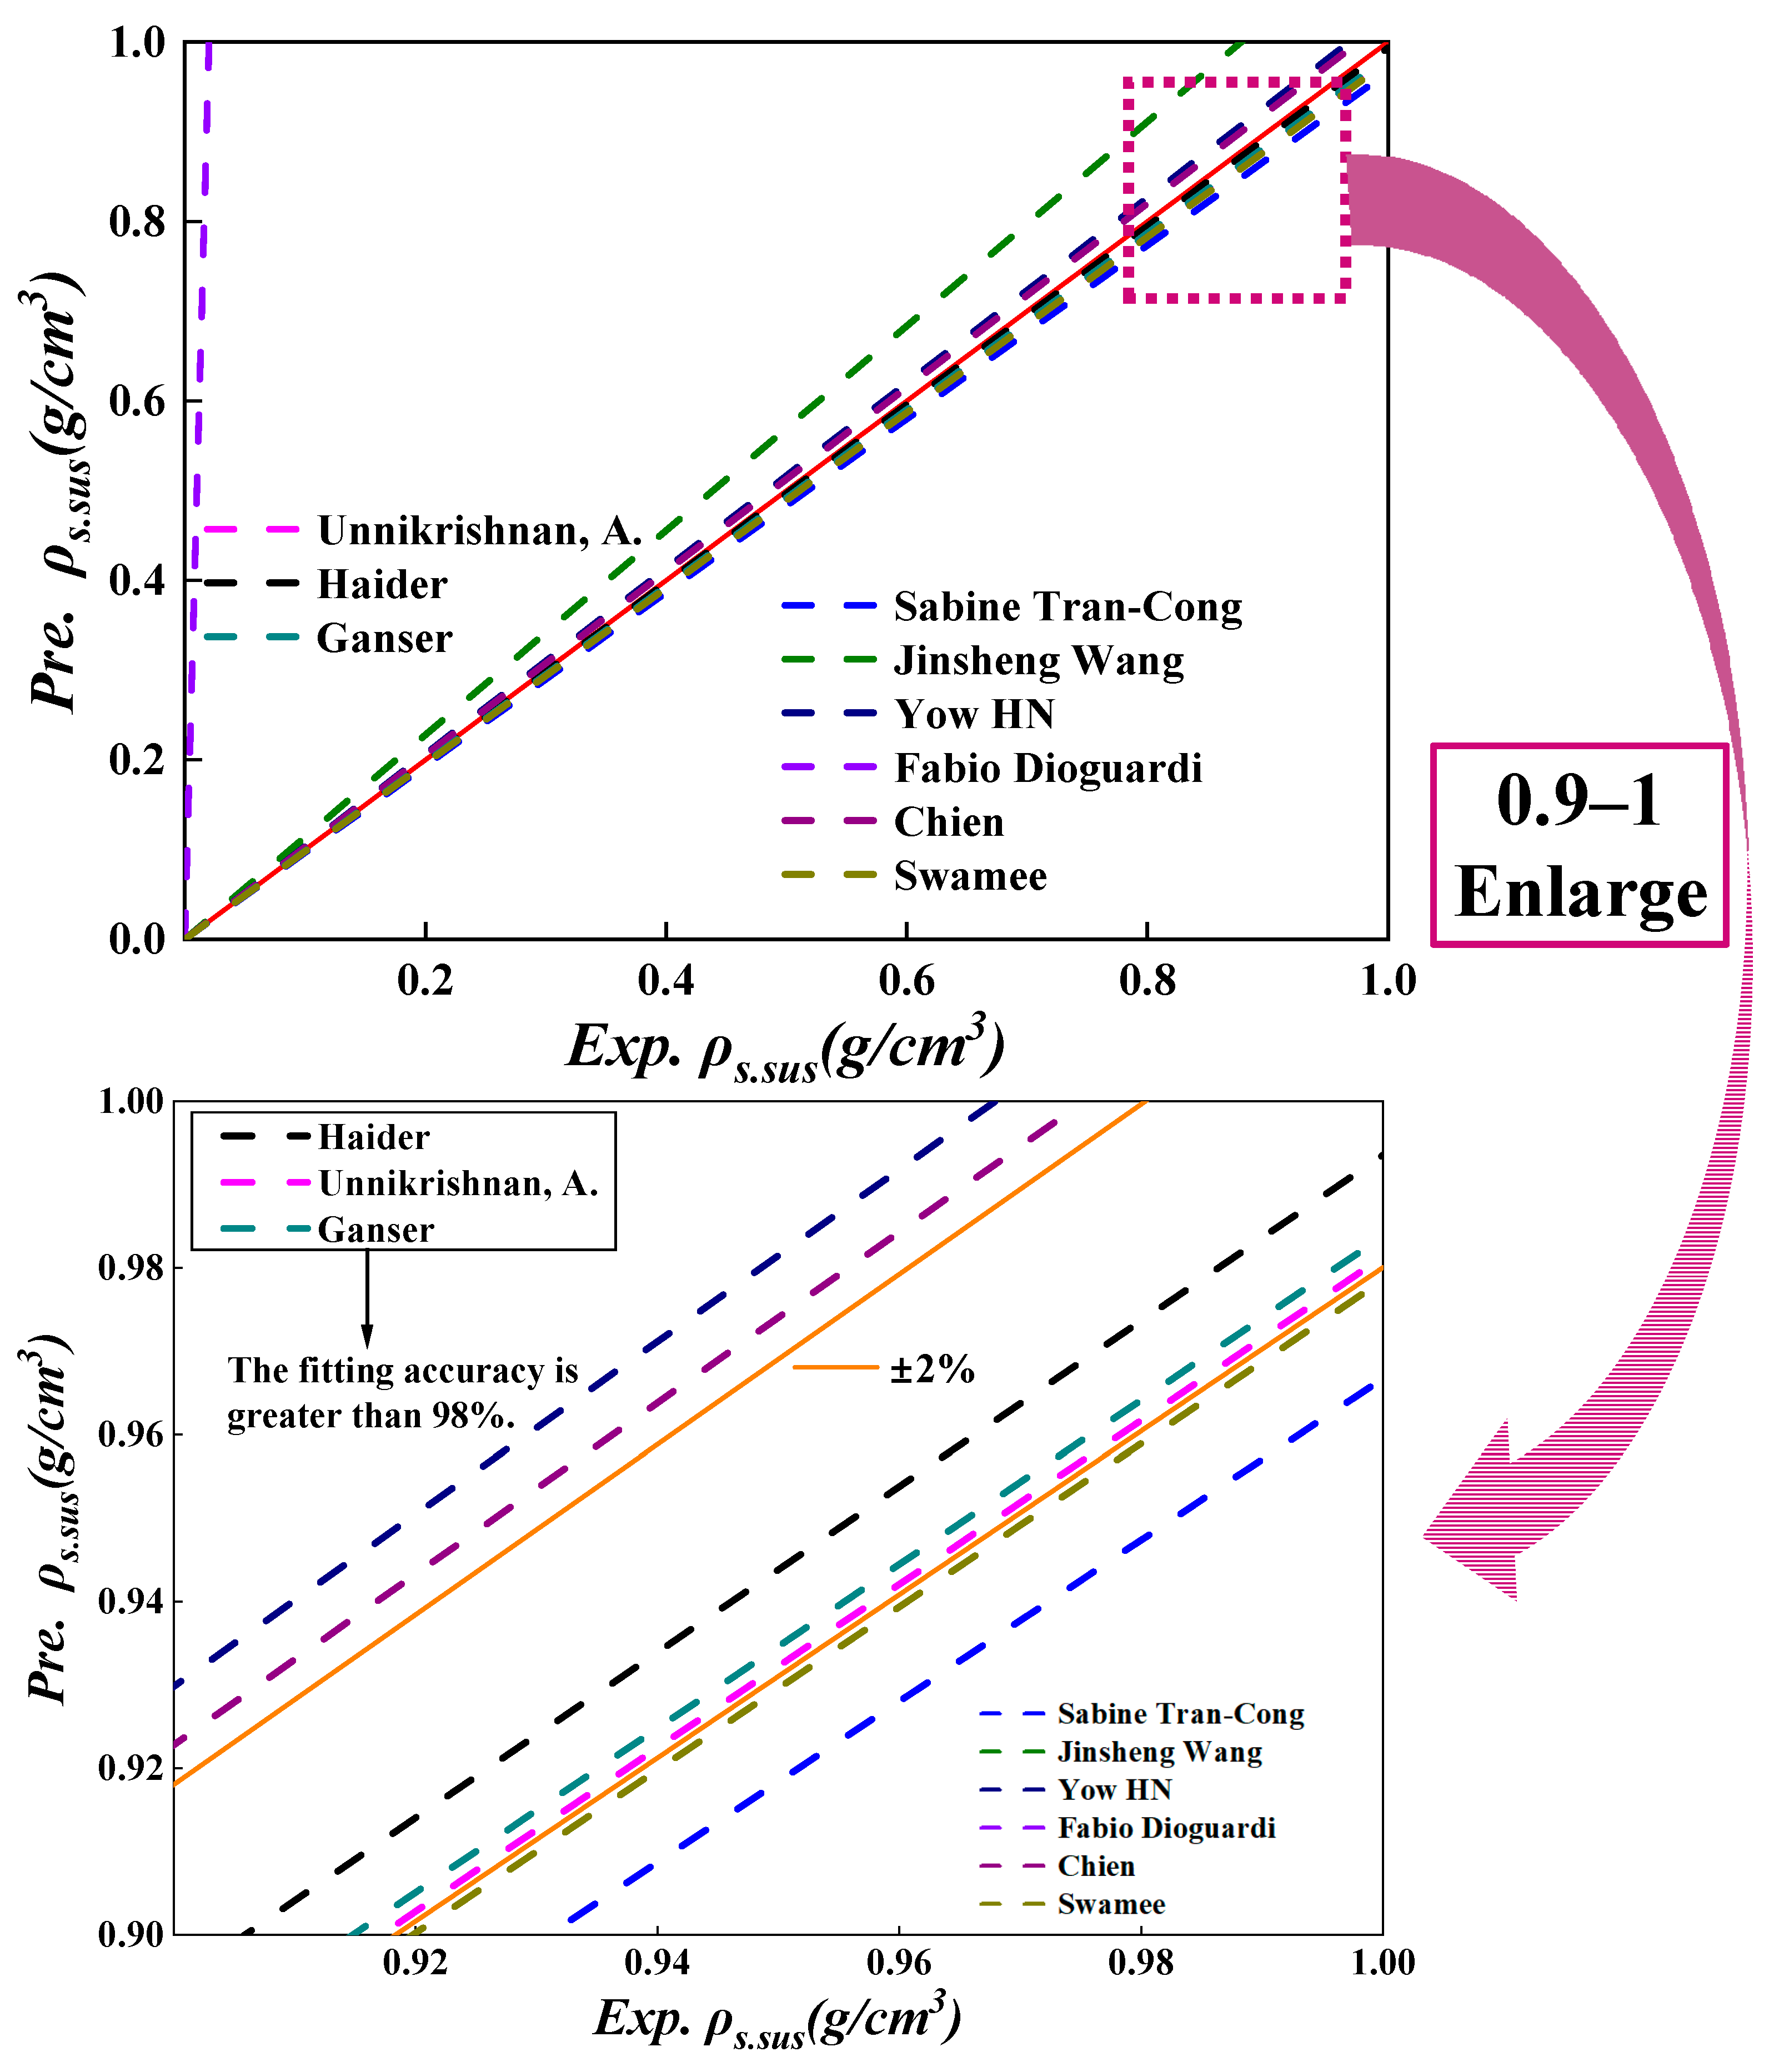
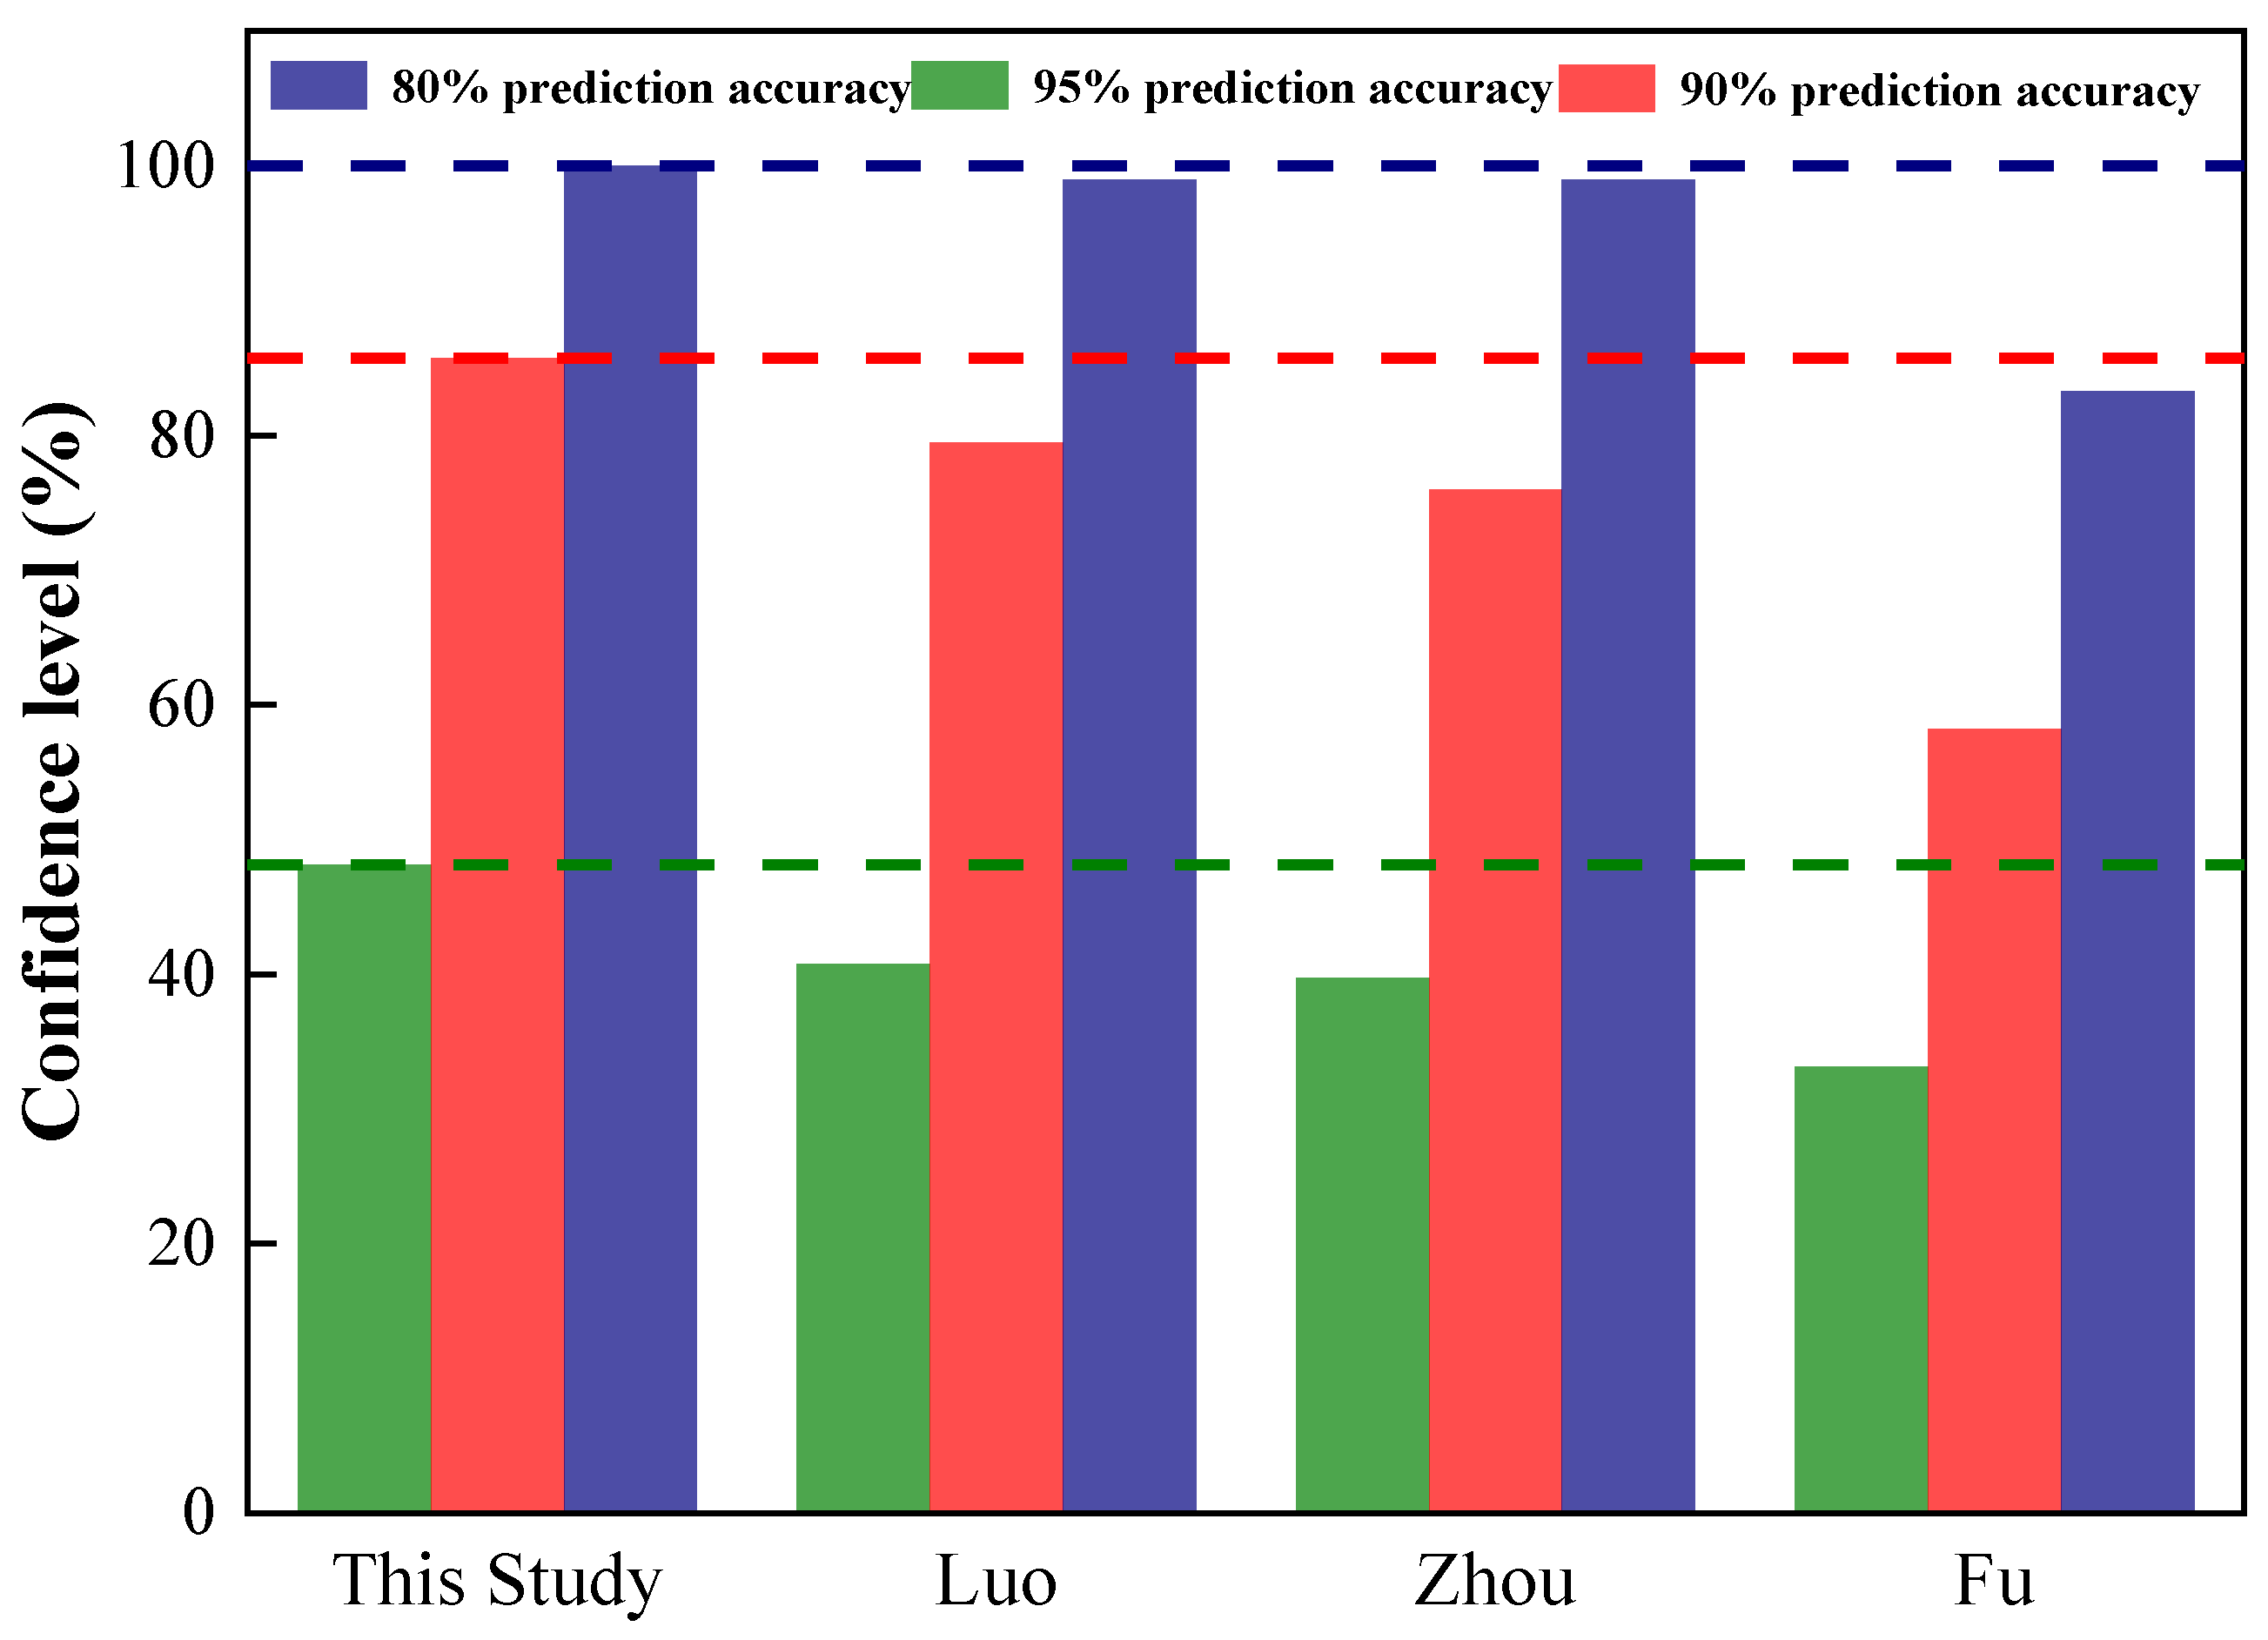
4.2.3. Model Validation

There is a lack of research on single particle movement in fluidized bed separation, especially in terms of the bed density when non-spherical single particles are suspended in the fluidized bed (ρS.sus). In order to further validate the accuracy of the ρS.sus prediction model presented in this study, three separation density prediction models for the other situations are provided.
According to Luo’s research, in the field of fluidized bed separation, the relative motion of particles and airflow is in the transition zone (1 < Re < 1000). The drag coefficient calculation method is shown in Equation (22) [23]:
C D = 24 Re 1 + 3 16 Re
Zhou [37] used Geldart A particles as the dense medium, and bed voidage is introduced into the prediction model. The calculation method (Equation (23)) is as follows:
ρ S . s u s = 0.85 ρ s ( 1 ε m f ) 1 Y ( u U m f ) u + ρ g Y ( u U m f ) u b + 18 μ u d p 2 g A r = ρ g ρ s ρ g g d s 3 u 2
Fu [44] used Ar to avoid the calculation of CD, and obtained the expression of ρS.sus as shown in Equation (24):
ρ S . s u s = 0.951 ρ s ρ g 1 ε m f Θ + ρ g + 1.878 Ω Θ = 1 Y 1 + 1.3 H 0 / 2 + 4 A f u U m f 0.8 Ω = 18 μ u 1 + 3 d p ρ g u 16 μ 0.5 g d p 2 Y = 1.72 A r 0.133 u U m f 0.02388 A r = ρ g ρ s ρ g g d s 3 u 2
A comparison of the results from the ρS.sus prediction models is shown in Figure 13. The confidence levels at 95% and 90% prediction accuracy of these three prediction models are all below 40% and 80%, respectively. Compared with previous research, the ρS.sus prediction model presented in this study has higher accuracy and precision.

5. Conclusions

In this study, the separation kinetics of non-spherical single feeding particles in a gas–solid separation fluidized bed were examined. Firstly, the spherical coefficient was introduced to evaluate the shape of non-spherical single particles during gas–solid fluidized bed separation. Through a theoretical analysis of the motion state of the single feeding particles, a calculation method for bed density, ρS.sus, when the single particles are suspended in the gas–solid separation fluidized bed was obtained. Simulated particles were used to study the effects of the particle density, bed height, gas velocity, and sphericity coefficient on the ρS.sus of single particle separation in a gas–solid separation fluidized bed. Representative single coal particles were selected for separation experiments to verify the applicability of the drag coefficient model for non-spherical single particle separation in a gas–solid separation fluidized bed. The drag coefficient model with the highest confidence level for the same prediction accuracy was used for ρS.sus prediction, and the prediction model was optimized to obtain the ρS.sus prediction model. Compared with the previously proposed model, the ρS.sus prediction model in this study has confidence levels of 48.08% and 85.72% when the prediction accuracy is 95% and 90%, respectively. This indicates that the model has higher reliability and accuracy in predicting experimental results. The ρS.sus of the single non-spherical feeding particle prediction model highlights a direction for improving the separation effect, provides a theoretical basis for the industrialization of gas–solid fluidized beds, and promotes the process of dry fluidized separation.

Author Contributions

Conceptualization, X.F.; methodology, Y.H.; software, Y.F.; validation, L.S.; formal analysis, X.F.; investigation, X.F.; resources, Y.F.; data curation, Y.F.; writing—original draft preparation, X.F.; writing—review and editing, Y.F. and Y.H.; visualization, L.S.; supervision, X.F.; project administration, L.S.; funding acquisition, X.F. All authors have read and agreed to the published version of the manuscript.

Funding

This research was funded by the Research Project Supported by Shanxi Scholarship Council of China (2024-128), the Taiyuan University of Science and Technology Scientific Research Initial Funding (20242017), the Fundamental Research Program of Shanxi Province (202403021212137), the Award Fund for Outstanding Doctors in Shanxi Province (20242092).

Data Availability Statement

We have no intention to open-source data for the time being.

Acknowledgments

The authors wish to thank the Taiyuan University of Science and Technology, China University of Mining and Technology and Shanxi Province for support.

Conflicts of Interest

The authors declare no conflicts of interest.

References

  1. Dindarloo, S.R.; Hood, M.M.; Bagherieh, A.; Hower, J.C. A statistical assessment of carbon monoxide emissions from the Truman Shepherd coal fire, Floyd County, Kentucky. Int. J. Coal Geol. 2015, 144, 88–97. [Google Scholar] [CrossRef]
  2. van Breugel, Y.; Cowan, A.K.; Tsikos, H. Geochemical Study of Weathered Coal, a Co-Substrate for Bioremediation of South African Coal Discard Dumps. Minerals 2019, 9, 772. [Google Scholar] [CrossRef]
  3. Wang, C.B.; Liu, H.M.; Zhang, Y.; Zou, C.; Anthony, E.J. Review of arsenic behavior during coal combustion: Volatilization, transformation, emission and removal technologies. Prog. Energy Combust. Sci. 2018, 68, 1–28. [Google Scholar] [CrossRef]
  4. Zhou, C.; Zhao, Y.; Liu, C.; Li, Y.; Gao, Z.; Fan, X.; Aleksandrova, T.; Duan, C. Fluidization expansion of novel generation dense medium and flow regime transition in gas-solid separation fluidized bed. Fundam. Res. 2023. [Google Scholar] [CrossRef]
  5. Yang, Y.W.; Yan, F.Y.; Yang, Y.H.; Chen, Y. Evaluating provincial carbon emission characteristics under China’s carbon peaking and carbon neutrality goals. Ecol. Indic. 2023, 156, 13. [Google Scholar] [CrossRef]
  6. Du, X.W. Thoughts on strategies and paths to achieve carbon peaking and carbon neutrality in China. Front. Energy 2023, 17, 324–331. [Google Scholar] [CrossRef]
  7. Liu, L.; Wang, X.; Wang, Z.G. Recent progress and emerging strategies for carbon peak and carbon neutrality in China. Greenh. Gases 2023, 13, 732–759. [Google Scholar] [CrossRef]
  8. Lu, Y.W.; Chen, S.L. Exploring the realization pathway of carbon peak and carbon neutrality in the provinces around the Yangtze river of China. J. Clean Prod. 2024, 466, 12. [Google Scholar] [CrossRef]
  9. Wei, Y.M.; Chen, K.Y.; Kang, J.N.; Chen, W.M.; Zhang, X.Y.; Wang, X.Y. Policy and Management of Carbon Peaking and Carbon Neutrality: A Literature Review. Engineering 2022, 14, 52–63. [Google Scholar] [CrossRef]
  10. China National Coal Association. 2023 Annual Report on the Development of the Coal Industry; China National Coal Association: Beijing, China, 2024. [Google Scholar]
  11. Zhao, Y.; Li, G.; Luo, Z.; Zhang, B.; Dong, L.; Liang, C.; Duan, C. Industrial Application of a Modularized Dry-Coal-Beneficiation Technique Based on a Novel Air Dense Medium Fluidized Bed. Int. J. Coal Prep. Util. 2017, 37, 44–57. [Google Scholar] [CrossRef]
  12. Firdaus, M.; O’Shea, J.P.; Oshitani, J.; Franks, G.V. Beneficiation of Coarse Coal Ore in an Air-Fluidized Bed Dry Dense-Medium Separator. Int. J. Coal Prep. Util. 2012, 32, 276–289. [Google Scholar] [CrossRef]
  13. Liu, C.G.; Zhou, C.Y.; Sun, Z.E.; Duan, C.L.; Zhu, J.; Zhao, Y.M. Geldart A-particles: Hydrodynamics of Geldart A magnetite powder with modulation by ultrafine coal particles in Gas-solid Fluidized Bed Coal Beneficiator (GFBCB). Powder Technol. 2022, 408, 10. [Google Scholar] [CrossRef]
  14. Zhou, C.Y.; Liu, X.B.; Zhao, Y.M.; Yang, X.L.; Li, Y.J.; Dong, L.; Duan, C.L.; Rao, Z.H. Recent progress and potential challenges in coal upgrading via gravity dry separation technologies. Fuel 2021, 305, 28. [Google Scholar] [CrossRef]
  15. Fan, X.; Zhou, C.; Zhao, Y.; Duan, C.; Liu, Q. Flow pattern transition and coal beneficiation in gas solid fluidized bed with novel secondary distributor. Adv. Powder Technol. 2018, 29, 1255–1264. [Google Scholar] [CrossRef]
  16. Fan, X.; Zhou, C.; Dong, L.; Zhao, Y.; Duan, C.; Zhang, B. Novel method of air distributor design for enhancing bed stability and reducing impurities in gas-solid fluidized bed system. Part. Sci. Technol. 2019, 37, 652–664. [Google Scholar] [CrossRef]
  17. Fan, X.; Zhou, C. Estimation of Bed Expansion and Separation Density of Gas-Solid Separation Fluidized Beds Using a Micron-Sized-Particle-Dense Medium. Separations 2021, 8, 242. [Google Scholar] [CrossRef]
  18. Dong, L.; Zhao, Y.; Luo, Z.; Duan, C.; Wang, Y.; Yang, X.; Zhang, B. A model for predicting bubble rise velocity in a pulsed gas solid fluidized bed. Int. J. Min. Sci. Technol. 2013, 23, 227–230. [Google Scholar] [CrossRef]
  19. Luo, Z.F.; Zhao, Y.M.; Lv, B.; Fu, Y.H.; Xu, X.; Chen, C.S. Dry coal beneficiation technique in the gas-solid fluidized bed: A review. Int. J. Coal Prep. Util. 2022, 42, 986–1014. [Google Scholar] [CrossRef]
  20. Zhang, Y.; Jia, Y.; Xu, J.; Wang, J.W.; Duan, C.L.; Ge, W.; Zhao, Y.M. CFD intensification of coal beneficiation process in gas-solid fluidized beds. Chem. Eng. Process. 2020, 148, 6. [Google Scholar] [CrossRef]
  21. Wang, Q.G.; Feng, Y.Q.; Lu, J.F.; Yin, W.D.; Yang, H.R.; Witt, P.J.; Zhang, M. Numerical study of particle segregation in a coal beneficiation fluidized bed by a TFM-DEM hybrid model: Influence of coal particle size and density. Chem. Eng. J. 2015, 260, 240–257. [Google Scholar] [CrossRef]
  22. Prusti, P.; Sahu, A.K.; Biswal, S.K. Prediction of the position of coal particles in an air dense medium fluidized bed system. Int. J. Min. Sci. Technol. 2015, 25, 421–427. [Google Scholar] [CrossRef]
  23. Luo, Z.; Zhao, Y. Separation Theory of Fluidization; China University of Mining and Technology Press: Xuzhou, China, 2002. [Google Scholar]
  24. Tran-Cong, S.; Gay, M.; Michaelides, E.E. Drag coefficients of irregularly shaped particles. Powder Technol. 2004, 139, 21–32. [Google Scholar] [CrossRef]
  25. Yow, H.N.; Pitt, M.J.; Salman, A.D. Drag correlations for particles of regular shape. Adv. Powder Technol. 2005, 16, 363–372. [Google Scholar] [CrossRef]
  26. Unnikrishnan, A.; Chhabra, R.P. An experimental study of motion of cylinders in newtonian fluids: Wall effects and drag coefficient. Can. J. Chem. Eng. 1991, 69, 729–735. [Google Scholar] [CrossRef]
  27. Wang, J.; Qi, H.; You, C. Experimental study of sedimentation characteristics of spheroidal particles. Particuology 2009, 7, 264–268. [Google Scholar] [CrossRef]
  28. Haider, A.; Levenspiel, O. Drag coefficient and terminal velocity of spherical and nonspherical particles. Powder Technol. 1989, 58, 63–70. [Google Scholar] [CrossRef]
  29. Dioguardi, F.; Mele, D. A new shape dependent drag correlation formula for non-spherical rough particles. Experiments and results. Powder Technol. 2015, 277, 222–230. [Google Scholar] [CrossRef]
  30. Chien, S.-F. Settling Velocity of Irregularly Shaped Particles. SPE Drill. Complet. 1994, 9, 281–289. [Google Scholar] [CrossRef]
  31. Ganser, G.H. A rational approach to drag prediction of spherical and nonspherical particles. Powder Technol. 1993, 77, 143–152. [Google Scholar] [CrossRef]
  32. Dogonchi, A.S.; Hatami, M.; Hosseinzadeh, K.; Domairry, G. Non-spherical particles sedimentation in an incompressible Newtonian medium by Padé approximation. Powder Technol. 2015, 278, 248–256. [Google Scholar] [CrossRef]
  33. Swamee Prabhata, K.; Ojha Chandra Shakhar, P. Drag Coefficient and Fall Velocity of nonspherical particles. J. Hydraul. Eng. 1991, 117, 660–667. [Google Scholar] [CrossRef]
  34. Karlsson, T.; Liu, X.M.; Pallarès, D.; Johnsson, F. Solids circulation in circulating fluidized beds with low riser aspect ratio and varying total solids inventory. Powder Technol. 2017, 316, 670–676. [Google Scholar] [CrossRef]
  35. Jiang, K.J.; Kong, Y.Q.; Xu, C.; Ge, Z.H.; Du, X.Z. Experimental performance of gas-solid countercurrent fluidized bed particle solar receiver with high-density suspension. Appl. Therm. Eng. 2022, 213, 14. [Google Scholar] [CrossRef]
  36. Geldart, D. Types of gas fluidization. Powder Technol. 1973, 7, 285–292. [Google Scholar] [CrossRef]
  37. Zhou, C.Y.; Liu, C.G.; Yuan, Y.; Fu, Z.J.; Zhu, J.S.; Duan, C.L. Separation density prediction of geldart A- dense medium in gas-solid fluidized bed coal beneficiators. Particuology 2024, 92, 251–262. [Google Scholar] [CrossRef]
  38. Wei, L.P.; Lu, Y.J.; Wei, J.J. Flow separation from a spherical particle in supercritical water. Chem. Eng. Res. Des. 2014, 92, 2273–2282. [Google Scholar] [CrossRef]
  39. Fan, X.; Ren, Y.; Dong, L.; Zhou, C.; Zhao, Y. Optimization of coal size for beneficiation efficiency promotion in gas–solid fluidized bed. Part. Sci. Technol. 2023, 41, 151–162. [Google Scholar] [CrossRef]
  40. Dellino, P.; Mele, D.; Bonasia, R.; Braia, G.; La Volpe, L.; Sulpizio, R. The analysis of the influence of pumice shape on its terminal velocity. Geophys. Res. Lett. 2005, 32. [Google Scholar] [CrossRef]
  41. Swanson, V.F. Free and hindered settling. Min. Metall. Explor. 1989, 6, 190–196. [Google Scholar] [CrossRef]
  42. Swanson, V.F. Settling equation for minerals and process applications. Min. Metall. Explor. 1999, 16, 8–13. [Google Scholar] [CrossRef]
  43. Zigrang, D.J.; Sylvester, N.D. An explicit equation for particle settling velocities in solid-liquid systems. AIChE J. 1981, 27, 1043–1044. [Google Scholar] [CrossRef]
  44. Fu, Z.J.; Zhu, J.S. Characterization of the Effective Density for the Separation of Immersed Objects in the Gas-Solid Fluidized Bed Coal Beneficiator. Ind. Eng. Chem. Res. 2023, 62, 17236–17242. [Google Scholar] [CrossRef]
Figure 1. Schematic of the experimental system with the gas–solid separation fluidized bed (air supply system with blue color, gas–solid separation fluidized bed with red color, measurement system and analysis system with green color).
Separations 11 00341 g001
Figure 2. Particle size distribution of dense medium.
Separations 11 00341 g002
Figure 3. Spherical coefficient and density of experimental coal particles. (a) Sphericity coefficient distribution of the selected feeding coal particles; (b) Density distribution of the selected feeding coal particles; (c) Geometric characteristics of representative particles; (d) Sphericity coefficient of representative particles.
Separations 11 00341 g003
Figure 4. Relationship between ρS.sus and feeding particle density.
Separations 11 00341 g004
Figure 5. Relationship between ρS.sus and bed height.
Separations 11 00341 g005
Figure 6. Relationship between ρS.sus and gas velocity.
Separations 11 00341 g006
Figure 7. Relationship between ρS.sus and sphericity coefficient.
Separations 11 00341 g007
Figure 8. Comparison between theoretical and actual ρS.sus of single feeding particle.
Separations 11 00341 g008
Figure 9. Summary of linear comparison results of ρS.sus.
Separations 11 00341 g009
Figure 10. ρS.sus error analysis of single feeding particle.
Separations 11 00341 g010
Figure 11. Comparison of prediction accuracy of ρS.sus model.
Separations 11 00341 g011
Figure 12. Optimization of single feeding particle ρS.sus model.
Separations 11 00341 g012
Figure 13. Comparison of ρS.sus prediction models.
Separations 11 00341 g013
Table 1. Properties of simulated particles.
ShapeLength
(mm)
Width
(mm)
Height
(mm)
Dp (mm)ΦDensity (g/cm3)
Cuboid45152230.500.452.0–2.3
22121519.630.47
25182126.230.42
39141625.550.49
30122325.100.45
48294047.380.36
Cube15151518.610.452.0–2.3
20202024.810.42
23232328.540.40
39393948.390.35
30303037.220.38
18181822.330.43
Cylinder45394549.110.352.0–2.3
44444450.370.34
29202025.910.42
47161626.230.51
20192022.510.42
24172424.490.42
45141423.650.46
Table 2. Drag coefficient of non-spherical particles.
No.ResearchCDParameters
1Yow HN et al. [25] C D = a 2 Re + b 2 Re + c 2 a 2 = 15.21 + 10.82 Φ 0.14 Φ 2
b 2 = 13.41 10.64 Φ 0.06 Φ 2
c 2 = 8.82 + 5.70 Φ + 0.23 Φ 2
2Sabine Tran-Cong et al. [24] C D = 24 Re d A d n 1 + 0.15 c 3 d A d n Re 0.687 + 0.42 d A d n 2 c 3 1 + 4.25 × 10 4 d A d n Re 1.16 d n = 6 V / π 3
d A = 4 A p / π
c 3 = π d A / P m p
3Unnikrishnan, A. et al. [26] C D = 17.5 Re 1 + 0.68 Re 0.43
4Jinsheng Wang et al. [27] C D = 24 Φ Re f ( Re ) f ( Re ) = 0.01 Re 1.07 + 8.54
5Haider et al. [28] C D = 24 Re 1 + C 4 Re C 5 + C 6 / 1 + C 7 / Re C 4 = , exp 2.33 6.46 Φ + 2.45 Φ 2
C 5 = 0.096 + 0.556 Φ
C 6 = , exp 4.90 13.89 Φ + 18.42 Φ 2 10.26 Φ 3
C 7 = , exp 1.47 + 12.26 Φ 20.73 Φ 2 15.89 Φ 3
6Fabio Dioguardi et al. [29] C D = C D W Y Re 2 Φ a Re 1.883 1 0.4826 C D W Y = 24 Re 1 + 0.15 Re 0.687
a = 0.6839 Re 0.1548 [32]
7Chien et al. [30] C D = 30 Re + 67.289 exp 5.03 Φ
8Ganser et al. [31] C D = 24 k S / Re 1 + 0.1118 Re k N / k S 0.6567 + 0.4305 k N / 1 + 3305 / Re k N / k S k S = 1 / 3 + 2 / 3 Φ
k N = 10 1.8148 log Φ 0.5743
9Swamee et al. [33] C D = 48.5 1 + 4.5 β 0.35 0.8 Re 0.64 + Re Re + 100 + 1000 β 0.32 1 β 18 + 1.05 0.8 1.25 β = d b d l d m d l > d m > d b
Disclaimer/Publisher’s Note: The statements, opinions and data contained in all publications are solely those of the individual author(s) and contributor(s) and not of MDPI and/or the editor(s). MDPI and/or the editor(s) disclaim responsibility for any injury to people or property resulting from any ideas, methods, instructions or products referred to in the content.

