Article

Determination of Topiramate and Carbamazepine in Plasma by Combined Dispersive Liquid–Liquid Microextraction and Gas Chromatography–Mass Spectrometry

by
Pamela Cabarcos-Fernández
*,
María Jesús Tabernero-Duque
,
Iván Álvarez-Freire
and
Ana María Bermejo-Barrera
Forensic Toxicology Service, Toxicology Sciences Institute, Faculty of Medicine, University of Santiago de Compostela, C/San Francisco s/n, 15782 Santiago de Compostela, Spain
*
Author to whom correspondence should be addressed.
Separations 2024, 11(2), 51; https://doi.org/10.3390/separations11020051
Submission received: 16 January 2024 / Revised: 1 February 2024 / Accepted: 5 February 2024 / Published: 7 February 2024
(This article belongs to the Section Chromatographic Separations)

Abstract

:
Dispersive liquid–liquid microextraction, an environmentally friendly extraction technique, followed by gas chromatography–mass spectrometry operating in selected ion monitoring (SIM) mode, is here presented for the simultaneous determination of two anticonvulsant drugs in plasma, Topiramate and Carbamazepine. Experimental parameters affecting the recovery of the proposed extraction method, such as the extraction and dispersion solvent, the extraction and dispersion volume, the sample amount, the pH of the aqueous phase, the ultrasound time, the centrifugation time and ionic strength, were investigated. The limits of detection for Topiramate and Carbamazepine were 0.01 and 0.025 µg mL−1, and the limits of quantification were 0.025 µg mL−1 and 0.05 µg mL−1, respectively. The method is shown to be selective, accurate, precise and linear over the concentration ranges of 0.025–8 µg mL−1 for Topiramate and 0.05–3 µg mL−1 for Carbamazepine. The extraction recovery of the analytes ranged from 91.5% to 113.9%. The analytical method was successfully applied to real plasma samples received by the Forensic Toxicology Service of the Forensic Science Institute of Santiago de Compostela.

1. Introduction

Epilepsy is a chronic brain disease which affects people of all ages. In fact, about 70 million people worldwide suffer from the condition, making it one of the most common neurological diseases globally. Data applied to the Spanish population (46 million) indicate that, currently, between 180,000 and 360,000 people suffer from epilepsy in this country [1]. Pharmacotherapy with anticonvulsant or antiepileptic drugs (AEDs) is currently the treatment of choice regarding epilepsy [2]. Several AEDs of the first generation and/or second generation can be used. The latter drugs are not necessarily more effective than traditional drugs but are safer and better tolerated than their classic counterparts, due to their improved tolerability profile, broader therapeutic ranges, linear pharmacokinetics and less interindividual variability [3]. There are several options in the world market, including Topiramate (TOP) and Carbamazepine (CBZ), both found quite frequently in the casuistry of the Forensic Toxicology Service of the University of Santiago de Compostela.
Topiramate, [2,3,4,5bis-O-(1-methylethylidene)-D-fructopyranose], is one of the most used second-generation AEDs. It exhibits multiple mechanisms of action [4]. In turn, Carbamazepine (5H-dibenzo [b,f] azepine-5-carboxamide) is a first-generation antiepileptic, being one of the most commonly used drugs in clinical practice [5].
Biological samples, such as plasma, usually contain some compounds that can interfere with the analytes of interest. Furthermore, the expected concentrations in these kinds of matrices are low. Therefore, the application of a reliable extraction technique becomes a must prior to chromatographic analysis. There are a wide range of sample preparation techniques which span from traditional procedures such as solid-phase extraction (SPE) [6,7,8,9,10] to newer techniques. At present, the trend is focused towards more innovative techniques such as dried blood spots (DBSs) or the so-called microextraction techniques, such as microextraction by packed sorbent (MEPS) [3,4,11,12]. These techniques require less samples and solvents and allow for greater specificity and selectivity in extraction [13]. Dispersive liquid–liquid microextraction (DLLME), a miniaturization of conventional liquid–liquid extraction, is used in this study. This technique is aimed at adapting to green chemistry standards, a current trend in analytical chemistry. Assadi et al. developed this technique in 2006. It is based on a three-solvent system in which the extraction and dispersion solvents are rapidly injected into the aqueous sample with a syringe and the turbidity of the solution is observed. Finally, the analytes are extracted in a droplet obtained by centrifugation [14]. The steps necessary to develop this technique have been described in a previous article [15]. Some of its advantages are the low volumes of samples and solvents used; its simplicity, the recovery rates which are comparable with or better than the traditional techniques; its environmental sustainability; and the shorter extraction times [14]. The extraction method described here does have some limitations, such as the possibility of drop breakage due to excessive agitation, the centrifugation time necessary for drop formation or the need to use extraction solvents with a density larger than that of water (normally chlorinated solvents) to achieve the formation of the drop at the bottom of the tube, thus achieving easier collection [14].
The methods commonly used to determine AEDs are high-performance liquid chromatography (HPLC) [2,16,17,18,19,20,21], gas chromatography–mass spectrometry (GC-MS) [4,7,8,10,11,12] or capillary electrophoresis (CE) [17,18].
The present work aims to develop a sensitive method able to simultaneously determine the plasma concentrations of TOP and CBZ for toxicological purposes. To date, there is no published method to determine both AEDs in plasma using DLLME and GC-MS. The validation of the method was developed according to the guidelines of the Food and Drug Administration (FDA) [19]. The method was then applied to 18 plasma samples received at the Forensic Toxicology Laboratory.

2. Materials and Methods

2.1. Chemicals

Acetonitrile, carbon tetrachloride, sodium chloride, methanol, acetone, chloroform, dichloromethane, 1-chlorobutane, 1,2-dichloroethane and sodium carbonate were purchased from Merck® (Darmstadt, Germany). Topiramate, Carbamazepine and Topiramate-D12, used as the internal standard, were obtained from Cerilliant® (Round Rock, TX, USA). Methanol was used to prepare the working solution. Distilled water was processed through a Milli-Q water system (Millipore, Bedford, MA, USA).

2.2. Plasma Samples

To carry out the validation, drug-free plasma samples obtained from the Blood Bank of Santiago de Compostela were used. On the other hand, plasma samples from real cases were stored in our laboratory at −20 °C. Plasma was obtained from whole blood by centrifugation (14,000 rpm, 5 min) and kept at 4 °C. The samples received at the Forensic Toxicology Service of the University of Santiago de Compostela were collected during the performance of the autopsies by the forensic doctors. Approval from Galicia’s Ethics Committee was not required because the toxicological data used in this work do not allow the identification of the subjects. Informed consent was obtained from all volunteers involved in the study.

2.3. Sample Preparation

In order to separate plasma from proteins, blood samples were centrifuged at 14,000 rpm for 5 min. For those samples in which this process was not enough, acetonitrile (1 mL) and further centrifugation for 10 min at 4000 rpm were subsequently used. To carry out the analysis, 1 mL aliquots were put into glass tubes and spiked with TOP-D12 (10 µL of solvent, 100 µg/mL). The pH of the plasma sample was alkalized by the dropwise addition of 1.25 mL of borate buffer (pH 9, 10 mM). DLLME was carried out using 40 µL of carbon tetrachloride as the extraction solvent and 0.5 mL of acetonitrile as the dispersive solvent. Prior to being injected into the samples with a micropipette or a syringe, these solvents were mixed. Then, the mixture was gently shaken for several seconds. This way, the extraction kinetics were improved, since the contact surface between the sample and the extraction solvent increased by dispersing the extraction solvent in the form of fine droplets in a turbid solution. The mixture was then sonicated for 10 min and finally centrifuged at 4000 rpm for 12 min. The drop formed was transferred to a conical tube with the aid of a 100 µL syringe. The evaporator was set at 40 °C to evaporate the elution solvent to dryness under a gentle stream of N2. Finally, the extracts were reconstituted with methanol and injected into the GC-MS system.

2.4. Study of DLLME Parameters

The optimization of the DLLME parameters, such as the type and volume of the extraction and dispersive solvents, the volume of the biological sample, the pH of the sample solution, the volume of the buffer solution, the ionic strength and the sonication time, was carried out. Stepwise optimization was used, fixing all but one variable in each experiment. This process is explained in detail in the Results section.

2.5. Instrumentation

The analyses were carried out using a model 7890B gas chromatograph from Agilent Technologies® (Santa Clara, CA, USA, EEUU) coupled to an Agilent 5977B mass spectrometer. The ionization source used was electron impact ionization with an energy of 70 eV. An HP5-MS capillary column (30 m × 250 µm inner diameter, 0.5 µm film thickness; Agilent Technologies®) was used to perform the chromatographic separation, using helium as the carrier gas (1 mL/min). The injector temperature was set at 250 °C and the purge time was 2 min. The extracts were injected using the splitless mode. The temperature program used was as follows: the temperature gradient started at 90 °C, maintained for 1 min, then it was progressively increased at 35 °C/min to 200 °C, and finally, the temperature was increased at 10 °C/min to 260 °C and held for 1 min. In order to clean the column, the temperature was increased to 280 °C for 5 min. The total chromatographic separation time was 10 min. The MSD was maintained at 300 °C, the ion source at 250 °C and the quadrupole at 150 °C. The SCAN mode was used to obtain the retention times and mass spectra of each compound. Once the compounds were identified, we proceeded to work in SIM (selected ion monitoring) mode in order to increase the sensitivity of the method.

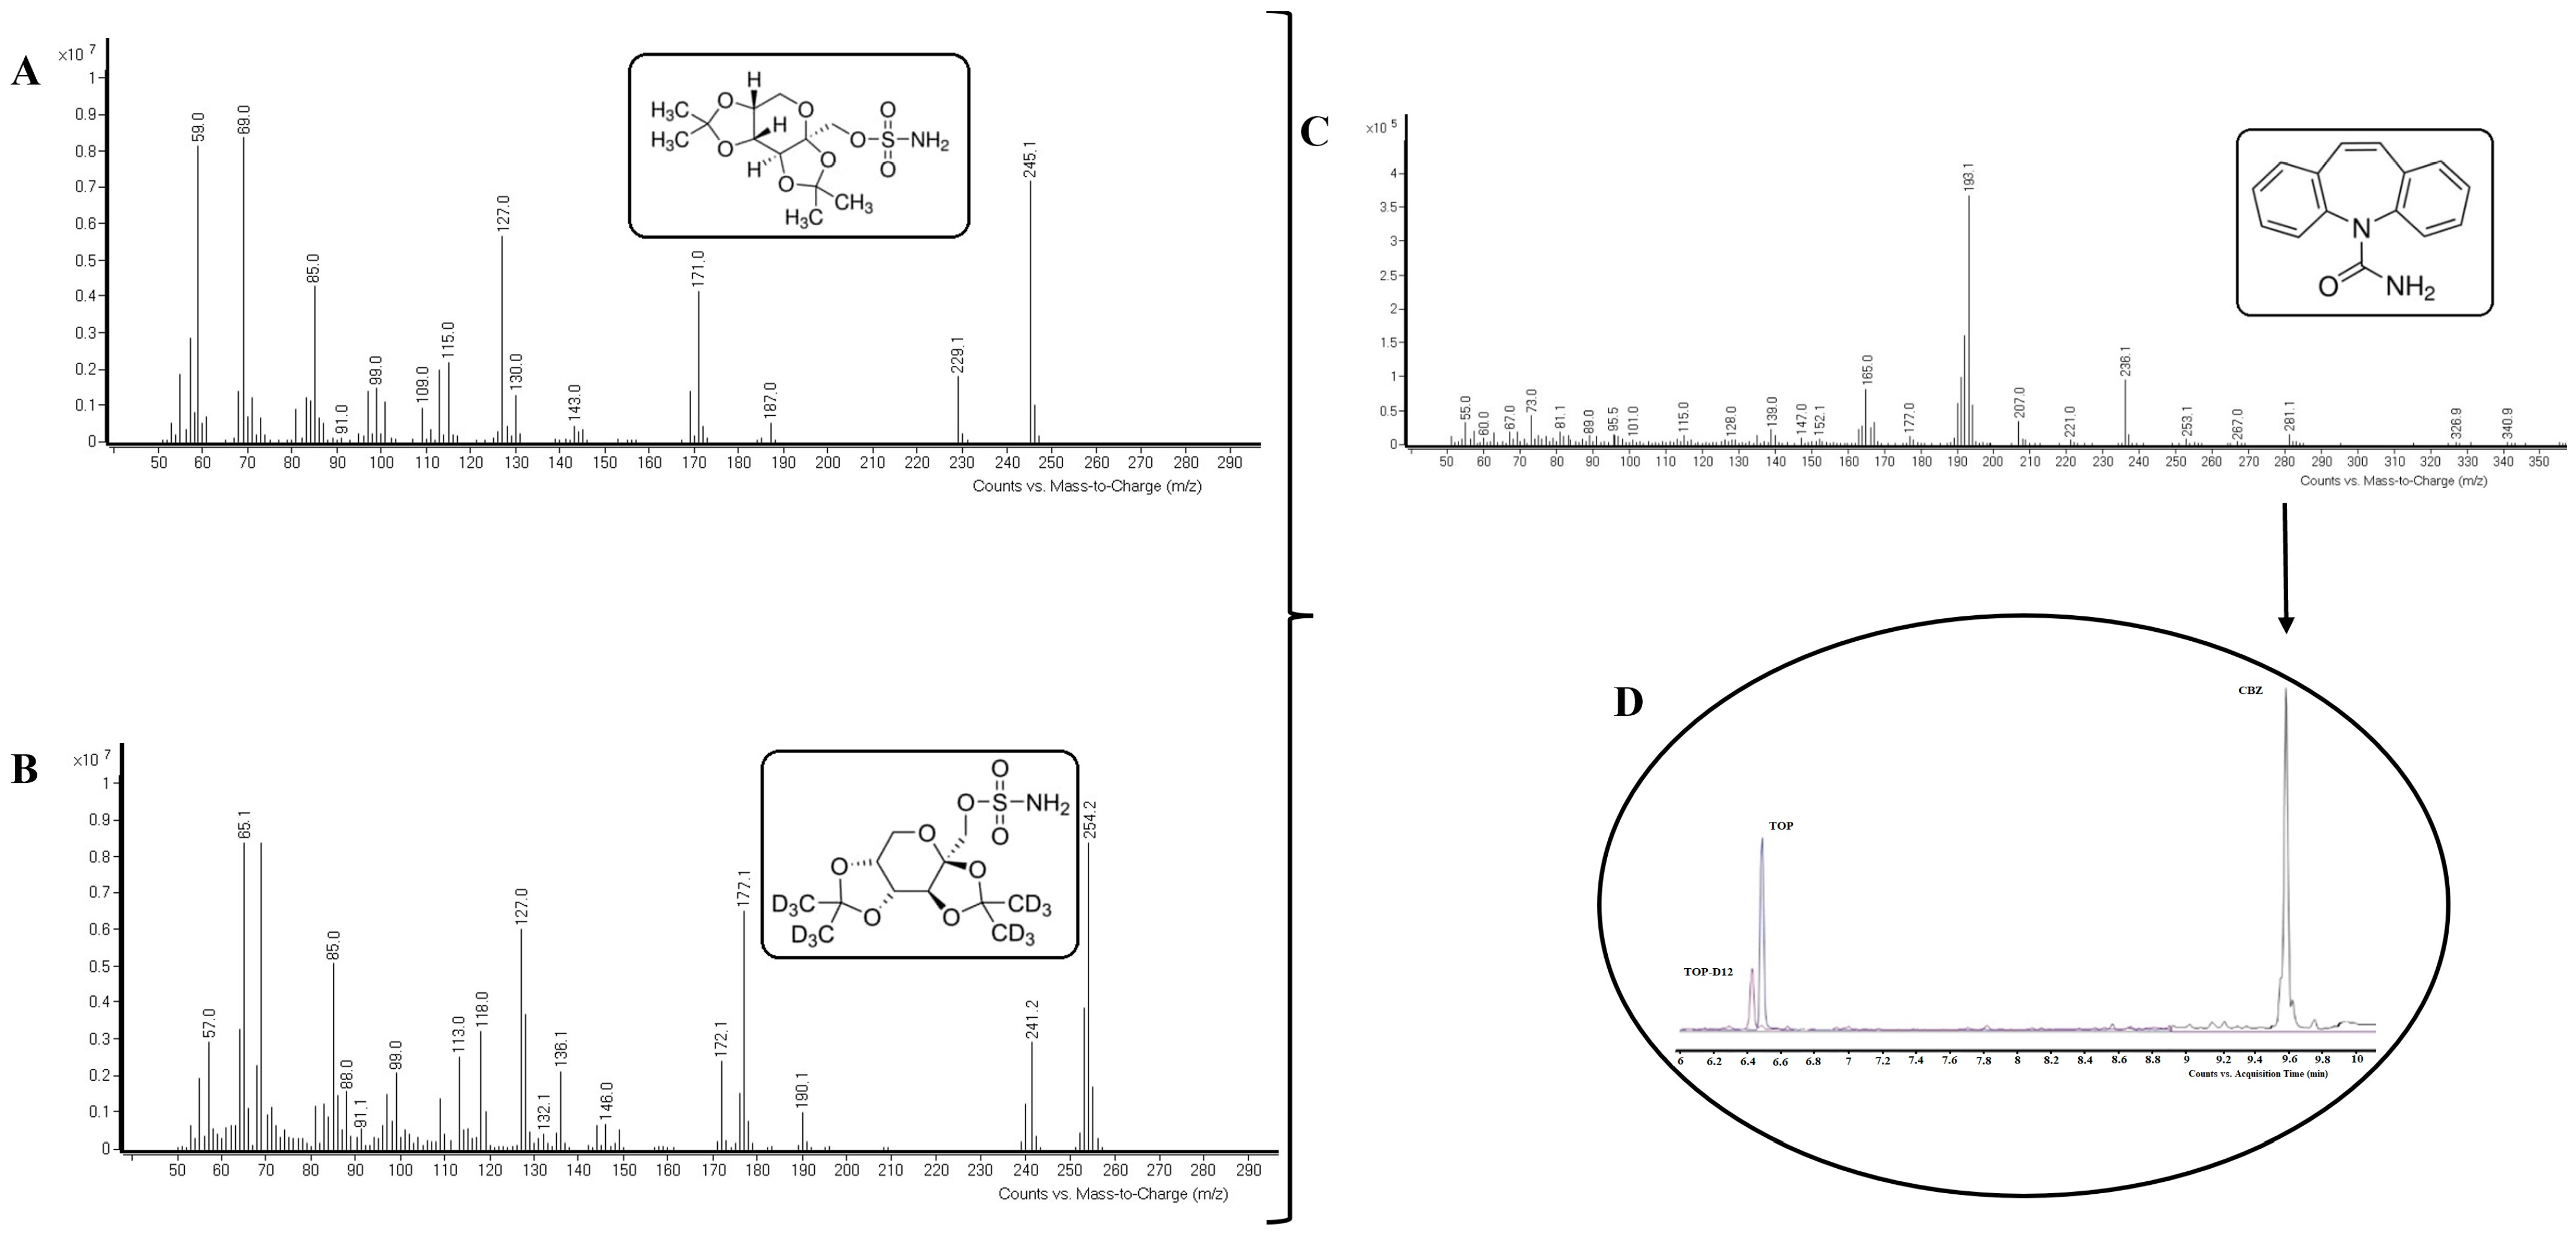
2.6. Identification of Compounds

The first step of performing the correct identification of the compounds consisted of the injection in SCAN mode (scanning from 40 to 550 amu) of all the pure standards (Figure 1A–C). The ions selected to work in SIM mode are shown as follows: 245 quantifier ions and 171 and 229 qualifier ions for TOP; 254 quantifier ions and 177 and 241 qualifier ions for TOP-D12; and 193 quantifier ions and 139 and 165 qualifier ions for CBZ. The selection of these ions was based on the abundances obtained in the fragmentation pattern, resulting from the SCAN work. The retention times for TOP and TOP-D12 were 6.52 and 6.45 min, respectively, with 9.6 min for CBZ. Figure 1D shows the GC-MS chromatograms of TOP and CBZ at a concentration of 0.5 µg mL−1.

2.7. Method of Validation

To carry out the validation, different parameters such as selectivity; linearity and sensitivity; precision and accuracy; and recovery were monitored following the FDA Bioanalytical Methods Validation Guide [19].
For the selectivity study, six drug-free plasma samples were analyzed. The linearity was evaluated on different days by calculating eight calibration curves with seven concentration levels, from the limit of quantification (LOQ) that is the lowest standard in the calibration curve: 0.025 µg mL−1 and 0.05 µg mL−1 for TOP and CBZ, respectively. The upper limit of quantification (ULOQ), namely, the highest standard in the calibration curve, was 8 µg mL−1 and 3 µg mL−1 for TOP and CBZ, respectively. A linear response was observed within the studied range, yielding a correlation coefficient in all cases better than 0.99. The determination of the limit of detection (LOD) and limit of quantification (LOQ) provides information on the sensitivity of the method. For the calculation of both parameters, the signal-to-noise ratio must be taken into account, being 3 for the LOD and 10 for the LOQ. The study of precision was evaluated by means of the relative standard deviation (%RSD). For its experimental determination, three concentrations were taken from the calibration line (low, medium and high point) and 5 replicates of each one were made on the same day (intraday precision), as well as on 5 different days (inter-day precision). For the study of accuracy, the relative error (%RE) was calculated following the same pattern as for the calculation of precision. The criteria established by the international guidelines [19] suggest that the error of accuracy and precision should not exceed 15% for each calibration standard, except for the LOQ, where a 20% error is accepted. To determine the recovery of an analyte, the response of the detector obtained after the extraction of the biological sample to which a known amount of the analyte under study has been added, as well as the response of the detector obtained after the injection of the pure standard, must be compared. Good recovery is indicative of efficient and reproducible extraction. It is not considered necessary to obtain 100% recoveries; however, the degree of recovery of an analyte and an internal standard must be consistent and reproducible [20]. It was also studied at three different concentration levels, five times, within three days.

3. Results

Following the principles of green chemistry, a microextraction technique (DLLME) was used for the quantitative determination of two drugs. The optimization of all the parameters involved in the selected technique was carried out step by step. The variables studied were the type and volume of the extraction and dispersion solvents, the sample amount, the pH of the aqueous phase, the ultrasound time and the ionic strength.

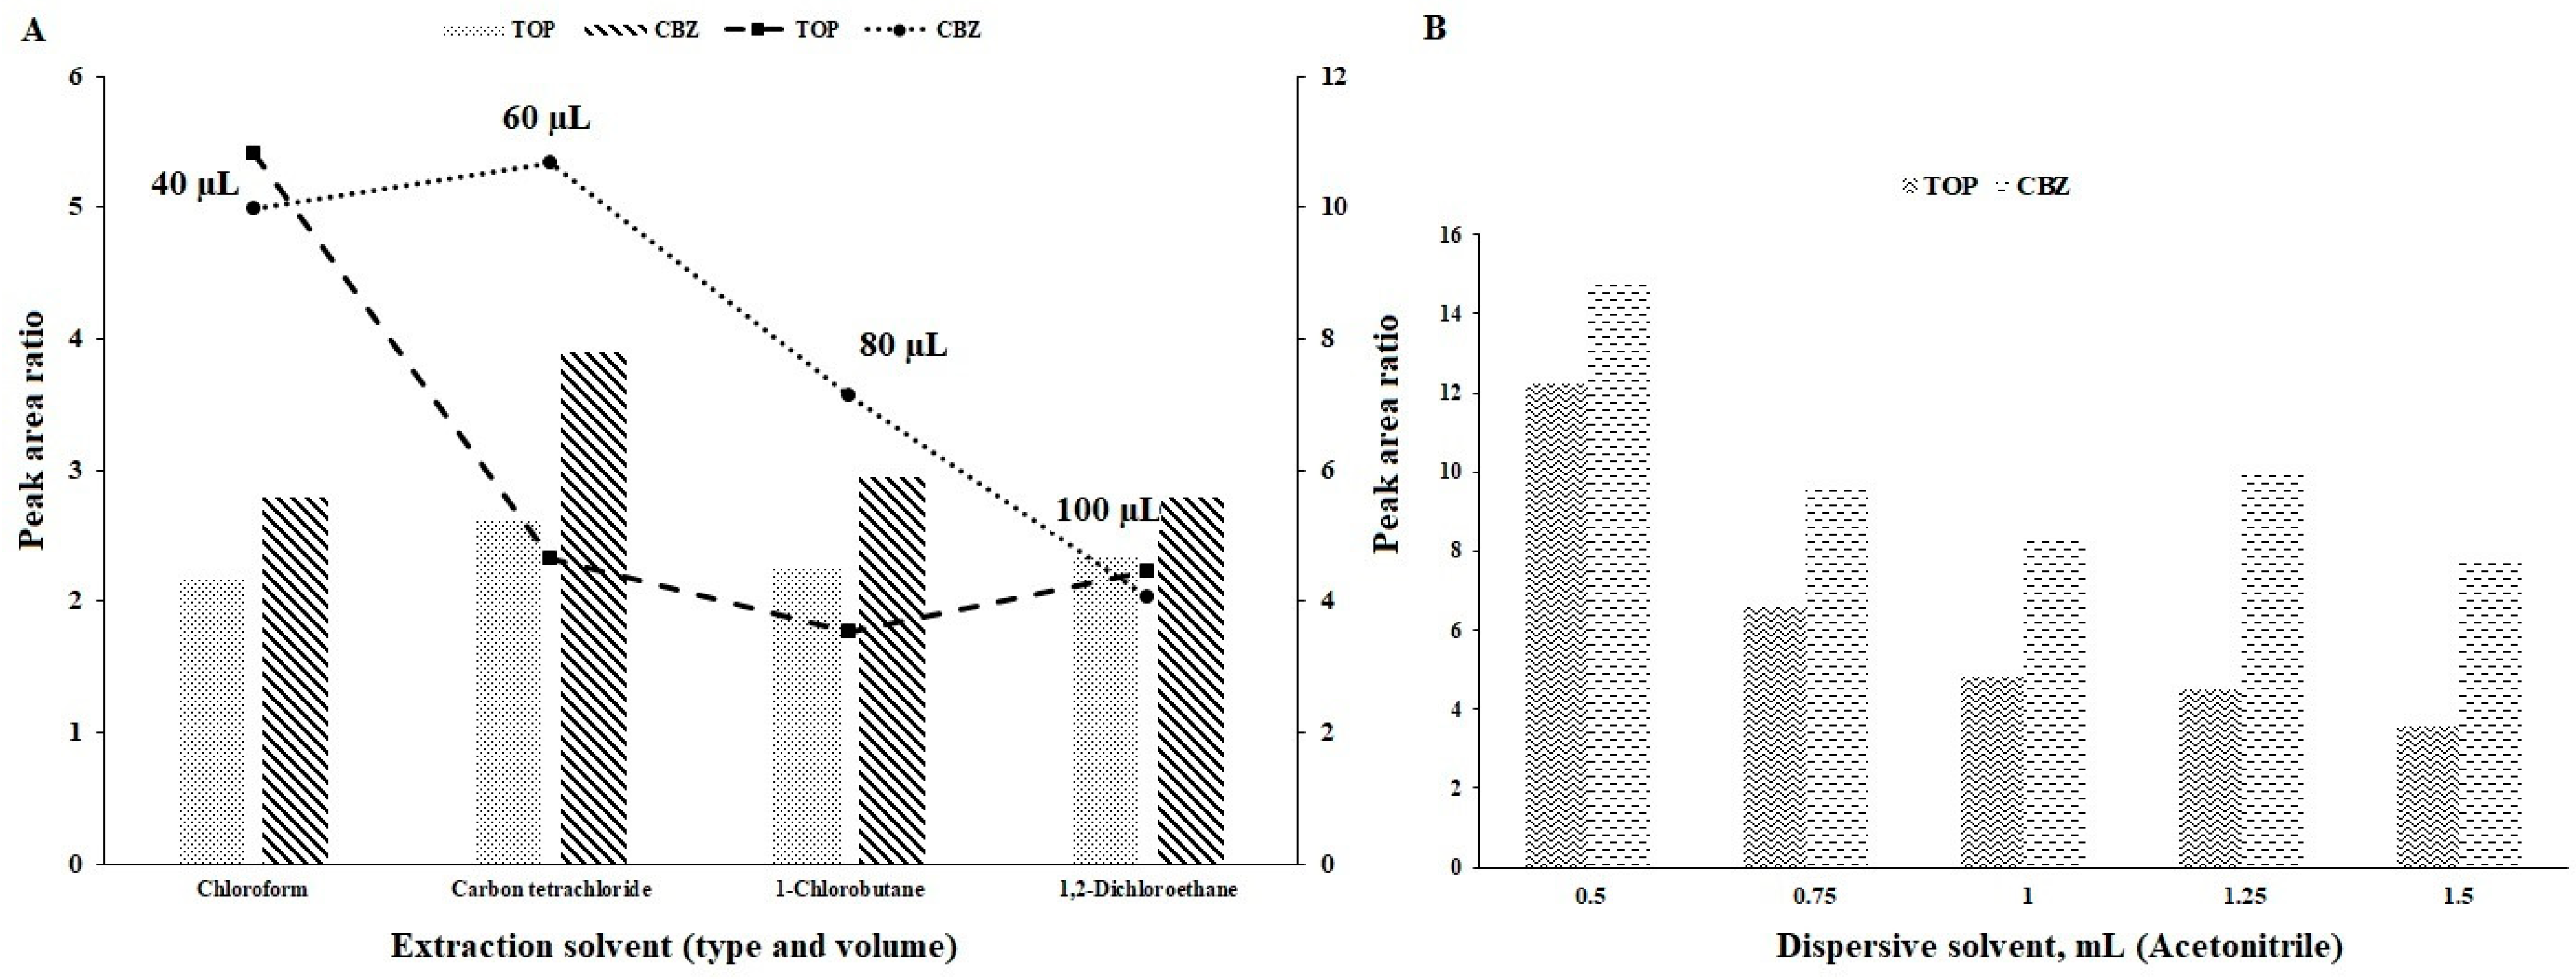
3.1. Type of Extraction and Dispersive Solvents

Two of the most noteworthy variables are the type and volume of the extraction and dispersion solvents. A wide variety of organic solvents can be used, but there are common requirements that should be fulfilled. Optimizing the conditions of the solvents can increase the recovery by two to three times. The extraction solvents must have low water-miscibility; otherwise, neither phase separation nor partitioning takes place. It also needs to be miscible with the disperser solvent and must be able to dissolve the analyte of interest. One way to study the suitability of an organic solvent for DLLME is through the partition coefficient (k), with optimal solvents having K > 500. However, this information is not always available, resorting, in these cases, to the octanol/water coefficient, Kow, which measures the degree of lipophilicity of an analyte. Organic solvents with higher partition coefficients (K > 500) are preferable. However, partition coefficient data are not always available for all compounds. In these cases, the reported Kow for octanol/water systems can be used as an indication of the lipophilicity of the analyte [21]. Maximum extraction efficiencies are usually observed at lower extraction volumes (20–200 µL). The most common dispersion solvents used are acetonitrile and methanol. In general, the use of a small volume, namely 200–1000 µL, is often enough to disperse the organic extractant in the sample. Due to the undesirable cosolvent effect that decreases the extraction efficiency, larger volumes of dispersers should be avoided [14,21,22].
Five solvents, including carbon tetrachloride (CCl4), chloroform (CHCl3), dichloromethane (CH2Cl2), 1-chlorobutane (C4H9Cl) and 1,2-dichloroethane (C2H4Cl2), were evaluated as extraction solvents, as well as acetonitrile (C2H3N), methanol (CH3OH) and acetone (C3H6O) as dispersion solvents. Among all those tested, acetonitrile showed the best results, since no drop was formed with the other solvents used. Regarding the extraction solvents, no cloudy solution was formed using dichloromethane, and therefore, it was eliminated from this study. According to the obtained results (Figure 2A), CCl4 resulted in the highest extraction efficiency for CBZ and TOP. Hence, CCl4 and acetonitrile were selected as the optimum solvents for the analytes of interest.

3.2. Volume of Extraction Solvent

The recovery of the analytes of interest were evaluated by using 1 mL of acetonitrile containing different volumes of CCl4 (40, 60, 80 and 100 µL). With the increase in the CCl4 volume, the recovery of both analytes decreased. Therefore, a volume of 40 µL was selected as the optimum extraction volume (Figure 2A).

3.3. Volume of Dispersive Solvent

Different acetonitrile volumes (0.5, 0.75, 1, 1.25 and 1.5 mL) containing 40 µL of CCl4 were used to find the optimal volume. The signal of the analytes decreased when the volume of acetonitrile increased. According to the results, 0.5 mL of acetonitrile was chosen (Figure 2B).

3.4. pH of the Sample Solution

The pH of the medium allows the analytes to be in a neutral or ionized state, which will affect their passage from the sample to the organic phase. For this reason, the plasma samples were buffered at a pH lower than the pKa of TOP and CBZ, 9.7 and 13.9, respectively. Therefore, the pH of the aqueous phase was adjusted in the range of 8–10. According to the data obtained (Figure 3A), the optimal pH for TOP is 8, with 10 for CBZ. Hence, it is necessary to reach the best compromise, so pH 9 was chosen.

3.5. Volume of Buffer Solution

Different volumes of buffer solution (0.25, 0.5, 1, 1.25, 1.5 and 2 mL) were used to find the optimal result. The signal of analytes increased up to 1.25 mL. From this value, the signal obtained remains constant. Therefore, the volume of 1.25 mL was chosen (Figure 3B).

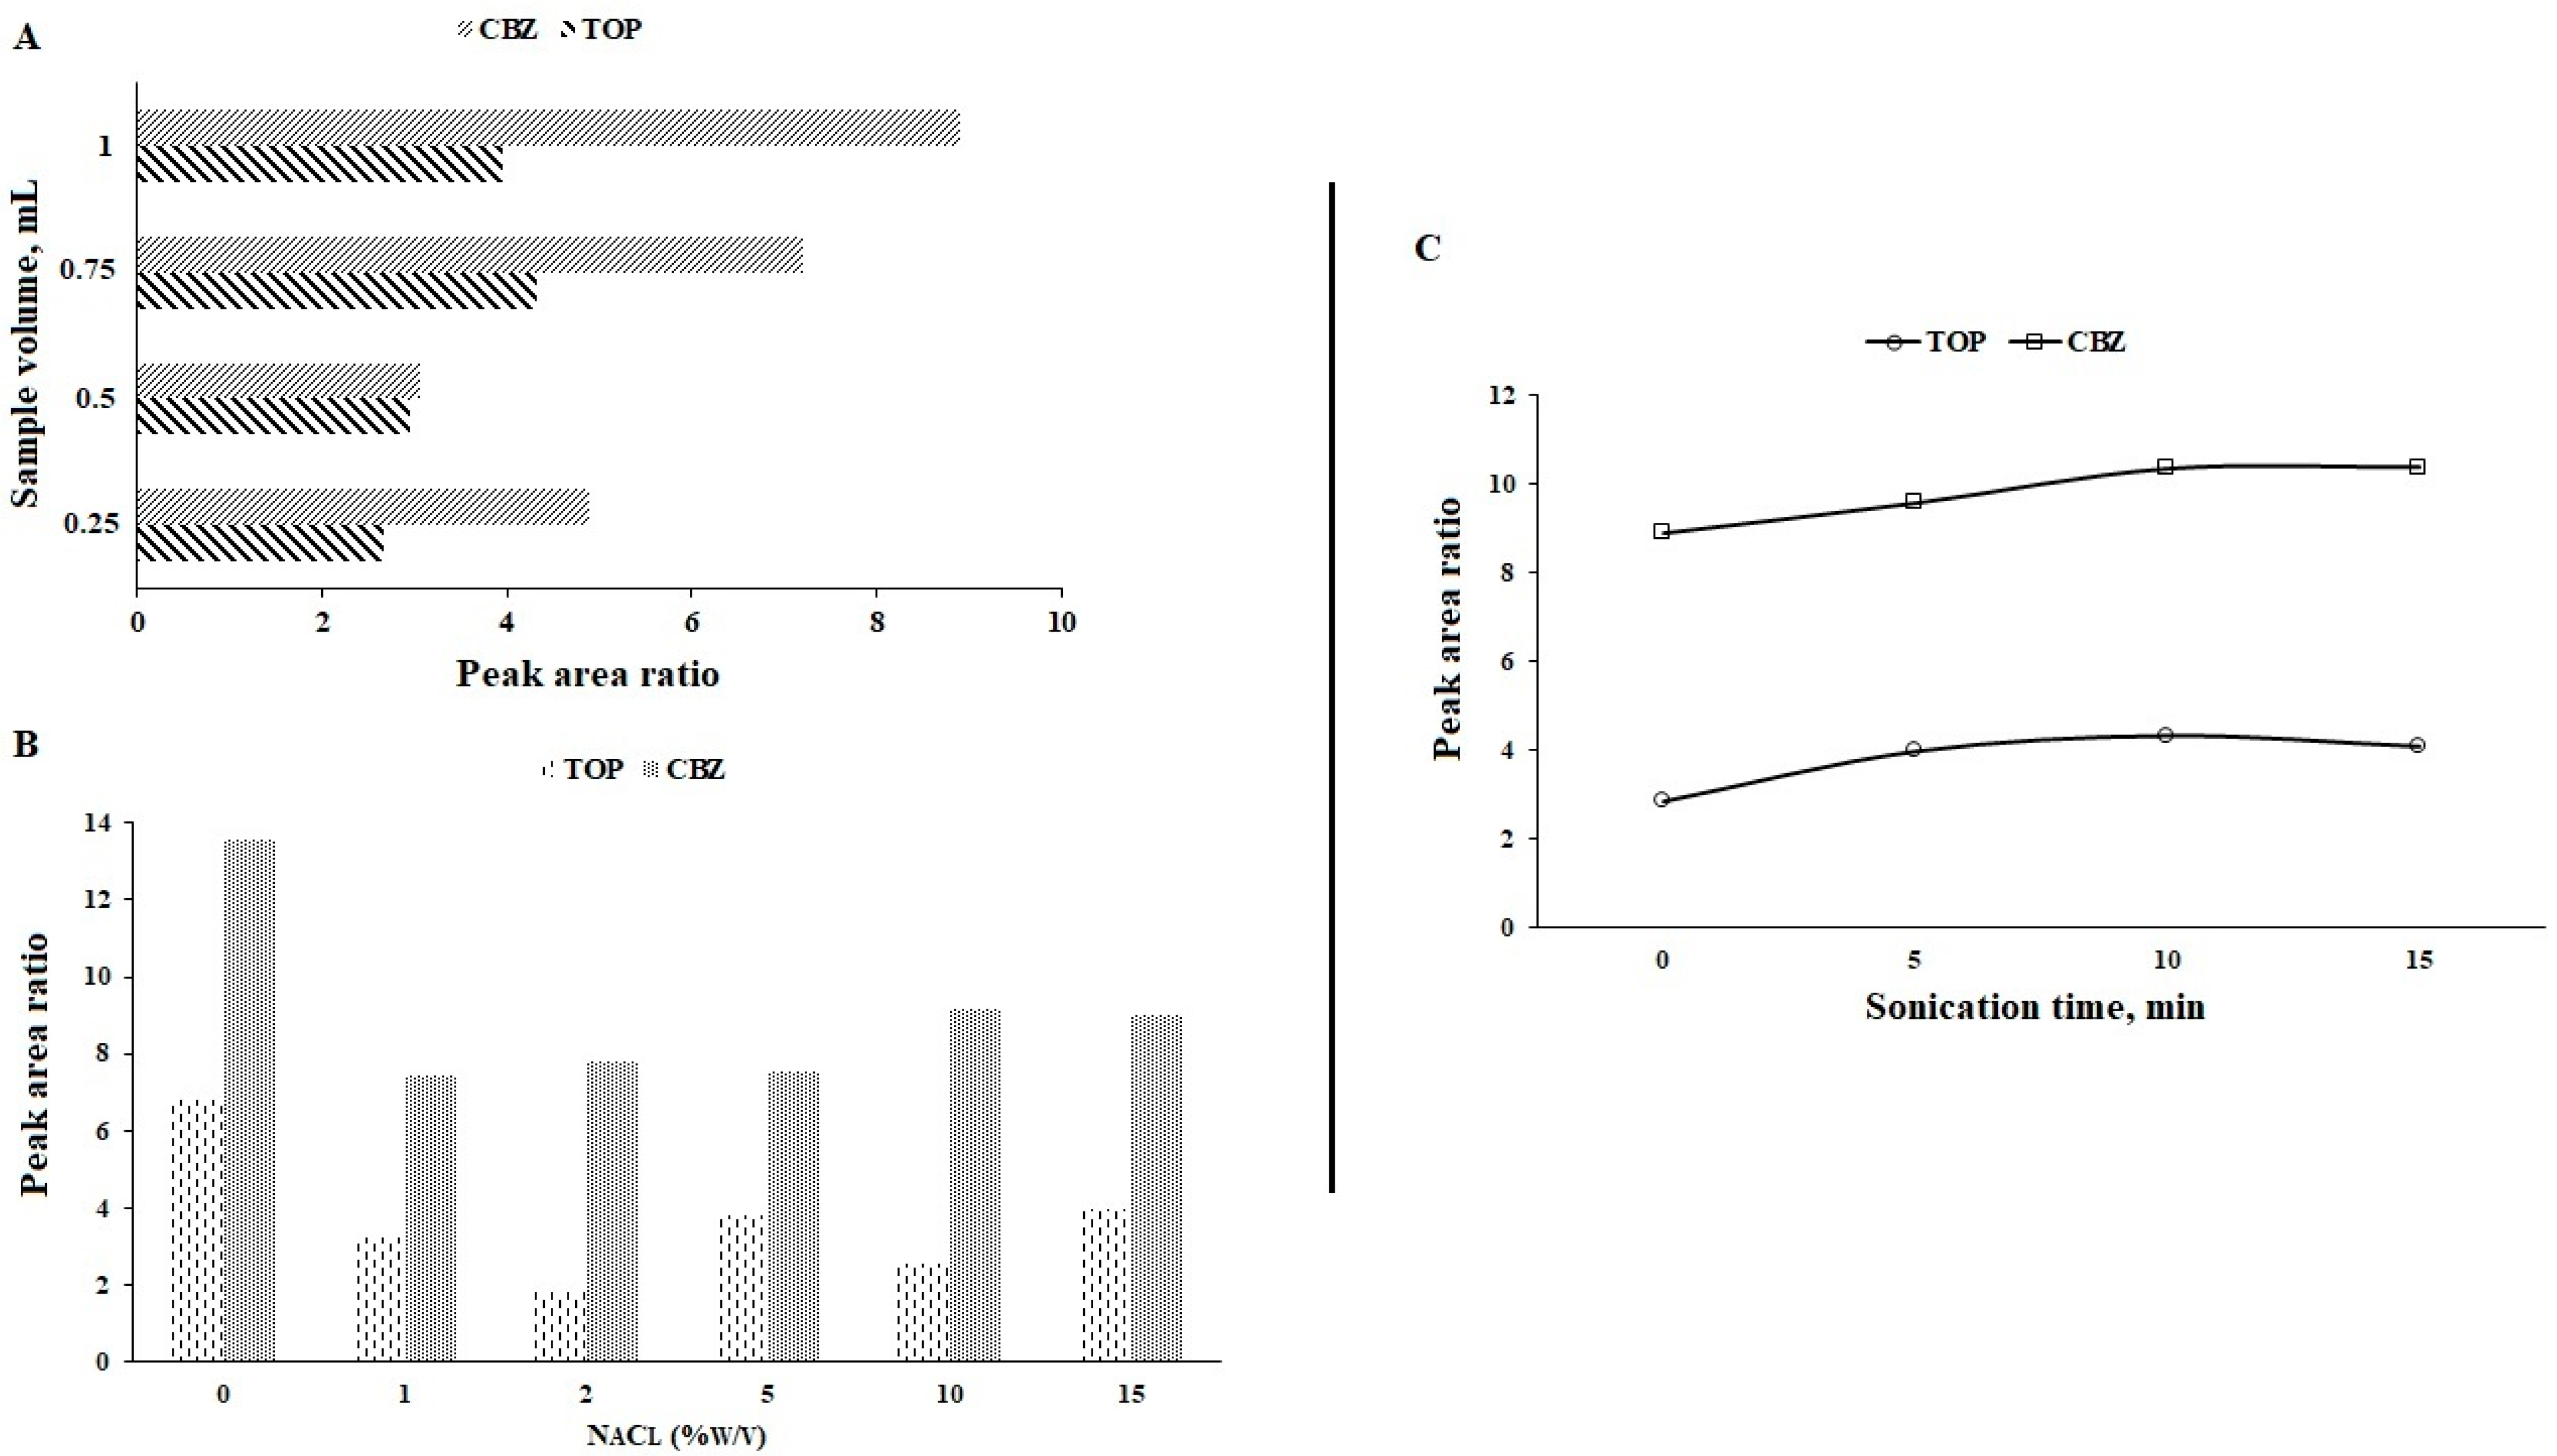
3.6. Volume of Sample

Different sample volumes were studied (0.25, 0.5, 0.75 and 1 mL). This variable was more significant for CBZ, showing a more constant area ratio for TOP. Finally, the optimal volume was defined in 1 mL of the sample (Figure 4A).

3.7. Ionic Strength

The addition of salt to the experiment may favor the passage of the analytes of interest from the aqueous phase to the organic phase by decreasing their solubility in the aqueous phase (ionic strength effect). To study this phenomenon, different concentrations of sodium chloride (0–15%, w/v) were added, and it was observed that by increasing the NaCl concentrations, the recoveries of TOP and CBZ decreased. A possible reason for this may be due to an increase in the viscosity of the aqueous phase, which generates a decrease in the diffusion coefficient of the analyte (salting-in effect). Therefore, the extraction procedure was established with no salt addition.

3.8. Sonication Time

This variable can be useful achieving a greater dispersion of the extraction solvent into the aqueous phase in order to reduce the extraction time. Several sonication times were studied (Figure 4C). Higher recoveries were obtained after sonicating for 10 min for both compounds.

3.9. Validation of the Optimized Method

The feasibility of the proposed method was studied by determining some analytical parameters described in Section 2.6. To do so, blank plasma samples were spiked with known concentrations of the analytes of interest.

3.9.1. Selectivity

Selectivity provides information on the possible presence of interfering substances at the same retention time as the analytes of interest. For this study, blank plasma samples from six different sources were analyzed. It was shown that there were no interfering peaks at the retention times of interest. The chromatogram of a blank plasma sample spiked with TOP-D12 is shown in Figure S1.

3.9.2. Linearity

A calibration curve was created using a blank sample spiked with TOP and CBZ at concentrations of 0.025–8 µg mL−1 and 0.05–3 µg mL−1, respectively. All samples were spiked with an internal standard (TOP-D12; 100 µg/mL). The curve was obtained by representing, on the x-axis, the concentrations of the compounds under study, and on the y-axis, the ratio of the peak areas of each compound (analyte peak area vs. IS peak area). The equation of the curve for TOP was y = 1.51443, x − 0.067483, and for CBZ, it was y = 10.765, x − 2.0072. The correlation coefficients (r2) were 0.9987 and 0.9922 for TOP and CBZ, respectively, demonstrating a good linearity.
The LODs, defined as the lowest concentration that the equipment can detect, giving a response of at least three times the signal-to-noise ratio, were 0.01 µg mL−1 and 0.025 µg mL−1 for TOP and CBZ, respectively. On the other hand, the LOQ, which corresponds to the lowest point of the calibration curve, is defined by an analyte response of at least ten times the signal-to-noise ratio. It was set at 0.025 µg mL−1 and 0.05 µg mL−1 for TOP and CBZ, respectively.

3.9.3. Precision and Accuracy

Table 1 shows the data obtained for the calculation of intraday and inter-day precision and accuracy, expressed in relative standard deviation, %RSD, and relative error, %RE. The intraday and inter-day precisions were all <15.5% for CBZ and <15.4% for TOP, and the intra- and inter-day accuracies were in the range of 2.6–18.2% for CBZ and 3.4–18.5% for TOP. The results satisfy the international validation rules defined by the FDA [19].

3.9.4. Recovery

Recovery was studied for three concentrations within the calibration range (low, medium and high), with five repetitions of each within three days. The results were compared with the theoretical concentration that represents 100% recovery. The values ranged from 90.3 to 116.7% for CBZ and 91.5 to 113.9% for TOP. The results are shown in Table 1.

3.9.5. Applicability of the Proposed Method

The capability of the proposed method for identifying and quantifying CBZ and TOP was tested on blood samples received at the Forensic Toxicology Service of the Institute of Forensic Science of Santiago de Compostela. These samples were previously collected from autopsies carried out by the IMELGA (Institute of Legal Medicine of Galicia) to clarify the cause of death. Biological samples are required to be collected in this type of legal case and are performed on request from the Ministry of Justice to our laboratory.
The results are displayed in Table 2, as well as information regarding the cases. None of the samples analyzed reached toxic levels according to different guidelines [23,24,25,26]. Figure 5 shows a chromatogram for real case number 2.

4. Discussion

Epilepsy is a common nervous system disease. The usual treatment for this condition is antiepileptic drugs [2]. Therefore, reliable methods of analysis are needed for their quantification in plasma samples. TOP and CBZ are two common drugs for the treatment of epilepsy.
Previous analytical methods for the quantification of both drugs within plasma samples have been described, including LC-MS/MS [2,16,27,28,29,30], HPLC–Fluorescence detection [31,32], LC-UV [6,33,34], HPLC-DAD [3,9], UPLC-MS/MS [35], CE [17,18], FO-BLI [5] or GC-FID [13] (Table 3). Here, however, we aimed to develop a procedure that was simple enough to be used as a routine analysis tool. Therefore, GC/MS was chosen as an instrumental technique, especially considering its lower cost and easier maintenance compared to other techniques such as LC-MS or LC-MS/MS. In addition, this technique also includes high sensitivity and selectivity, especially due to the greater number of theoretical plates and the requirement of volatile compounds, and does not require the preparation of buffers and mobile phases, reducing organic solvent waste [4,7,12]. Thus, this technique is commonly used in analytical and forensic toxicology laboratories. Hence, GC-MS is a good alternative as a working method.
To the best of our knowledge, this is the first article describing and validating a method for the simultaneous quantitative determination of TOP and CBZ by GC-MS. Chromatographic conditions were optimized to achieve a good resolution of the analytes under study as well as the IS, using the shortest running time possible. As it is a specific technique, the analytes were easily identified through their molecular ions obtained after injection in SCAN mode.
Nowadays, it is well established that the extraction technique used is one of the key factors. Thus, sample preparation is an important step in the analysis, as it protects the measurement equipment, increases sensitivity and improves selectivity by eliminating potential interfering substances [21]. Protein precipitation (PP) [2,17,35,36], solid-phase extraction (SPE) [6,7,9,10,18,32] and liquid–liquid extraction (LLE) [16,17,31,33] are some common methods used for the analysis of TOP and CBZ in biological samples. The dried blood spot (DBS) technique is also used for this determination [4,11,29,30,36] (Table 3), which allows for rapid collection, safe handling, greater stability and cost reduction. However, it is usually a poorly reproducible technique with low sensitivity, mainly due to factors that cannot be controlled in the handling of DBSs.
The standards of green analytical chemistry are becoming widely applied since it results in lowering the consumption of organic solvents in analytical procedures, making it more eco-friendly in nature. In this study, dispersive liquid–liquid microextraction (DLLME), a microextraction technique (MET), was chosen due to its benefits, such as miniaturization, low cost, speed and high recovery. Subsequently, different factors affecting the selected technique were optimized (types and volumes of solvents, salt concentration, pH of the sample solution, sample volume and sonication time). After an exhaustive bibliographic review, summarized in Table 3, it was observed that DLLME has been used on rare occasions for the determination and quantification of TOP and CBZ. Other authors have proposed variants of DLLME, such as Feriduni et al. [13]. They combined DLLME with a homogeneous liquid–liquid extraction method performed in a narrow tube for the determination of CBZ in urine by GC-FID. Moreover, the total run time is longer than that applied in our method. The second article listed in Table 3 using DLLME was published by Ranjbar et al. [34]. In this case, IL-DLLME and HPLC-UV were used for the determination of CBZ in plasma samples, with a higher LLOQ than that of the method proposed in this study.
In the reviewed scientific bibliography, articles were found that propose more sensitive techniques than the work presented here, such as LC-MS/MS and UPLC-MS/MS [2,16,27,28]. Additionally, the possible formation of strongly adducted ion peaks under first-order mass spectrometry should be considered [2], as well as the high consumption of organic solvents used in the mobile phases when LC-MS/MS is used.
Regarding the other works included in Table 3, there are no LOQ improvements, derivatization steps are included or greater total run times are used [3,4,5,6,7,9,10,11,17,18,30,31,32,33,34,35,36]. The method proposed by Rani et al. [12] achieved a lower LOQ than our method, but with a poor recovery using GC-MS.
On account of all of the above, the proposed method, using an environmentally friendly technique, DLLME, has proven to be a satisfactory procedure for the determination of TOP and CBZ in plasma samples, achieving good validation parameters.

5. Conclusions

In this study, the DLLME microextraction technique was developed together with the GC-MS detection technique for the simultaneous determination of two antiepileptic drugs in plasma samples. This miniaturized extraction procedure was shown to be simple and fast and makes use of low amounts of organic solvents. Based on optimized conditions and validated according to FDA guidelines, the proposed method showed high sensitivity, good linearity and satisfactory recovery. Finally, it was successfully applied to 18 real cases received at the Forensic Toxicology Laboratory of the University of Santiago de Compostela. Therefore, it can be successfully implemented in toxicology laboratories for routine analysis.

Supplementary Materials

The following supporting information can be downloaded at https://www.mdpi.com/article/10.3390/separations11020051/s1: Figure S1: Chromatogram of a blank plasma sample spiked with TOP-D12.

Author Contributions

Conceptualization, M.J.T.-D. and A.M.B.-B.; data curation, P.C.-F.; formal analysis, P.C.-F.; investigation, P.C.-F.; methodology, P.C.-F., M.J.T.-D., I.Á.-F. and A.M.B.-B.; resources, M.J.T.-D., I.Á.-F. and A.M.B.-B.; supervision, A.M.B.-B.; validation, P.C.-F. and I.Á.-F.; visualization, P.C.-F., M.J.T.-D., I.Á.-F. and A.M.B.-B.; writing—original draft, P.C.-F.; writing—review and editing, M.J.T.-D., I.Á.-F. and A.M.B.-B. All authors have read and agreed to the published version of the manuscript.

Funding

This research received no external funding.

Institutional Review Board Statement

Approval from Galicia’s Ethics Committee was not required because the toxicological data used in this work do not allow the identification of the subjects.

Informed Consent Statement

Informed consent was obtained from all volunteers involved in the study.

Data Availability Statement

The original contributions presented in the study are included in the article/supplementary material; further inquiries can be directed to the corresponding author.

Conflicts of Interest

The authors declare no conflicts of interest.

References

  1. Prevalencia e Incidencia de la Epilepsia. 2023. Available online: https://www.apiceepilepsia.org/prevalencia-e-incidencia-de-la-epilepsia/ (accessed on 17 July 2023).
  2. Qiu, E.; Yu, L.; Liang, Q.; Wen, C. Simultaneous determination of Lamotrigine, Oxcarbazepine, Lacosamide and Topiramate in rat plasma by ultra-performance liquid chromatography-tandem mass spectrometry. Int. J. Anal. Chem. 2022, 2022, 1838645. [Google Scholar] [CrossRef] [PubMed]
  3. Ferreira, A.; Rodriguez, M.; Oliveira, P.; Francisco, J.; Fortuna, A.; Rosado, L.; Rosado, P.; Falcao, A.; Alves, G. Liquid chromatography assay based on microextraction by packed sorbent for therapeutic drug monitoring of Carbamazepine, Lamotrigine, Oxcarbazepine, Fenobarbital, Phentoin and the active metabolites Carbamazepine-10,11-epoxide and Licarbazepine. J. Chromatogr. B 2014, 971, 20–29. [Google Scholar] [CrossRef] [PubMed]
  4. Zilles, R.; Venzon, M.A.; Costa, P.A.; Bordin, N.A.; Gasparin, S.V.; Linden, R. Determination of Topiramate in dried blood spots using single-quadropole gas chromatography-mass spectrometry after flash methylation with Trimethylanilinium hydroxide. J. Chromatogr. B 2017, 1046, 131–137. [Google Scholar]
  5. Bian, S.; Tao, Y.; Zhu, Z.; Zhu, P.; Wang, Q.; Wu, H.; Sawan, M. On-site biolayer interferometry-based biosensing of Carbamazepine in whole blood of epileptic patients. Biosensors 2021, 11, 516. [Google Scholar] [CrossRef]
  6. Serralheiro, A.; Alvez, G.; Fortuna, A.; Rocha, M.; Falcao, A. First HPLC-UV method for rapid and simultaneous quantification of Phenobarbital, Primidone, Phenytoin, Carbamazepine, Carbamazepine-10,11-epoxide, 10,11-trans-dihydroxy-10,11-dihydrocarbamazepine, Lamotrigine, Oxcarbazepine and Licarbazepine in human plasma. J. Chromatogr. B 2013, 925, 1–9. [Google Scholar]
  7. Conway, J.M.; Birnbaum, A.K.; Marino, S.E.; Cloyd, J.C.; Remmel, R.P. A sensitive capillary GC-MS method for analysis of Topiramate from plasma obtained from single-dose studies. Biomed. Chromatogr. 2012, 26, 1071–1076. [Google Scholar] [CrossRef]
  8. Beer, B.; Libiseller, K.; Oberacher, H.; Pavlic, M. A fatal intoxication case involving Topiramate. For. Sci. Int. 2010, 202, e9–e11. [Google Scholar] [CrossRef]
  9. Vermeij, T.A.C.; Edelbroek, P.M. Robust isocratic high performance liquid chromatographic method for simultaneous determination of seven antiepileptic drugs including Lamotrigine, Oxcarbazepine and Zonisamide in serum after solid-phase extraction. J. Chromatogr. B 2007, 857, 40–46. [Google Scholar] [CrossRef]
  10. Speed, D.J.; Dickson, S.J.; Cairns, E.R.; Kim, N.D. Analysis of six anticonvulsant drugs using solid-phase extraction, deuterated internal standards, and gas chromatography-mass spectrometry. J. Anal. Toxicol. 2000, 24, 685–690. [Google Scholar] [CrossRef]
  11. Kong, S.T.; Lim, S.H.; Lee, W.B.; Kumar, P.K.; Wang, H.Y.S.; Ng, Y.L.; Wong, P.S.; Ho, P.C. Clinical validation and implications of dried blood spot sampling of Carbamazepine, Valproic acid and Phenytoin in patients with epilepsy. PLoS ONE 2014, 9, e108190. [Google Scholar] [CrossRef]
  12. Rani, S.; Malik, A.K. A novel microextraction by packed sorbent-gas chromatography procedure for the simultaneous analysis of antiepileptic drugs in human plasma and urine. J. Sep. Sci. 2012, 35, 2970–2977. [Google Scholar] [CrossRef] [PubMed]
  13. Feriduni, B.; Farajzadeh, M.A.; Jouyban, A. Determination of two antiepileptic drugs in urine by homogenous liquid-liquid extraction performed in a narrow tube combined with dispersive liquid-liquid microextraction followed by gas chromatography-flame ionization detection. Iran. J. Pharm. Res. 2019, 18, 620–630. [Google Scholar] [PubMed]
  14. Cabarcos-Fernández, P.; Álvarez-Freire, I.; Tabernero-Duque, M.J.; Bermejo-Barrera, A.M. Quantitative determination of Clozapine in plasma using an environmentally friendly technique. Microchem. J. 2022, 180, 107612. [Google Scholar] [CrossRef]
  15. Cabarcos, P.; Cocho, J.A.; Moreda, A.; Míguez, M.; Tabernero, M.J.; Fernández, P.; Bermejo, A.M. Application of dispersive liquid-liquid microextraction for the determination of Phoshatidylethanol in blood by liquid chromatography tandem mass spectrometry. Talanta 2013, 11, 189–195. [Google Scholar] [CrossRef] [PubMed]
  16. van Rooyen, G.F.; Badenhorst, D.; Swart, K.J.; Hundt, H.K.L.; Scanes, T.; Hundt, A.F. Determination of Carbamazepine and Carbamazepine 10,11-epoxide in human plasma by tandem liquid chromatography-mass spectrometry with electrospray ionization. J. Chromatogr. B 2002, 769, 1–7. [Google Scholar] [CrossRef]
  17. Ishikawa, A.A.; da Silva, R.M.; Ferreira, S.M.; da Costa, E.R.; Sakamoto, A.C.; Carrilho, E.; de Gaitani, C.M.; Garcia, C.D. Determination of Topiramate by capillary electrophoresis with capacitively-coupled contactless conductivity detection: A powerful tool for therapeutic monitoring in epileptic patients. Electrophoresis 2018, 39, 2598–2604. [Google Scholar] [CrossRef]
  18. Mandrioli, R.; Musenga, A.; Kenndler, E.; de Donno, M.; Amore, M.; Raggi, M.A. Determination of Topiramate in human plasma by capillary electrophoresis with indirect UV detection. J. Pharm. Biomed. Anal. 2010, 53, 1319–1323. [Google Scholar] [CrossRef]
  19. U.S. Department of Health and Human Services; Food and Drug Administration. Bioanalytical Method Validation. Guidance for Industry. May 2018. Available online: https://www.fda.gov/files/drugs/published/Bioanalytical-Method-Validation-Guidance-for-Industry.pdf (accessed on 5 December 2023).
  20. Álvarez-Freire, I.; Marqués-Rodríguez, T.; Bermejo-Barrera, A.M.; Cabarcos-Fernández, P.; Tabernero-Duque, M.J. Determination of Levetirazetam in plasma: Comparison of gas chromatography-mass spectrometry technique and Abbot® Architect system. Microchem. J. 2021, 160, 105715. [Google Scholar] [CrossRef]
  21. Mansour, F.R.; Khairy, M.A. Pharmaceutical and biomedical applications of dispersive liquid-liquid microextraction. J. Chromatogr. B 2017, 1061–1062, 382–391. [Google Scholar] [CrossRef]
  22. Jouibari, T.A.; Fattahi, N.; Shamsipur, M. Rapid extraction and determination of Amphetamines in human urine samples using dispersive liquid-liquid microextraction and solidification of floating organic drop followed by high performance liquid chromatography. J. Pharm. Biomed. Anal. 2014, 94, 145–151. [Google Scholar] [CrossRef]
  23. Repetto, M.R.; Repetto, M. Tabla de Concentraciones de Xenobióticos en Fluidos Biológicos Humanos Como Referencia Para el Diagnóstico Toxicológico (Versión 2015), Ampliación de Toxicología de Postgrado; Depósito Legal: SE-182-07; Ilustre Colegio Oficial de Químicos: Sevilla, Spain, 2015; ISBN 13, 978-84-695-3142-6. [Google Scholar]
  24. Launiainen, T.; Ojanperä, I. Drug concentration in post-mortem femoral blood compared with therapeutic concentrations in plasma. Drug Test. Anal. 2014, 6, 308–316. [Google Scholar] [CrossRef]
  25. Musshoff, F.; Padosch, S.; Steinborn, S.; MadeaB. Fatal blood and tissue concentrations of more than 200 drugs. For. Sci. Int. 2004, 142, 161–210. [Google Scholar]
  26. Schulz, M.; Iwersen-Bergmann, S.; Andresen, H.; Schmoldt, A. Therapeutic and toxic blood concentrations of nearly 1000 drugs and other xenobiotics. Critical Care 2012, 16, R136. [Google Scholar] [CrossRef]
  27. Cui, H.Y.; Lü, C.X.; Shi, Y.H.; Yuan, N.; Liang, J.H.; An, Q.; Guo, Z.Y.; Yun, K.M. Detection of Carbamazepine and its metabolites in blood samples by LC-MS/MS. Fa Yi Xue Za Zhi 2023, 39, 34–39. [Google Scholar]
  28. Ni, Y.; Zhou, Y.; Xu, M.; He, X.; Li, H.; Haseeb, S.; Chen, H.; Li, W. Simultaneous determination of Phentermine and Topiramate in human plasma by liquid chromatography-tandem mass spectrometry with positive-negative ion-switching electrospray ionization and its application in pharmacokinetic study. J. Pharm. Biomed. Anal. 2015, 107, 444–449. [Google Scholar] [CrossRef] [PubMed]
  29. Popov, T.V.; Maricic, L.C.; Prosen, H.; Voncina, D.B. Development and validation of dried blood spots technique for quantitative determination of Topiramate using liquid chromatography-tandem mass spectrometry. Biomed. Chromatogr. 2013, 27, 1054–1061. [Google Scholar] [CrossRef] [PubMed]
  30. la Marca, G.; Malvagia, S.; Filippi, L.; Fiorini, P.; Innocenti, M.; Luceri, F.; Pieraccini, G.; Moneti, G.; Francese, S.; Dani, F.R.; et al. Rapid assay of Topiramate in dried blood spots by a new liquid chromatography-tandem mass spectrometric method. J. Pharm. Biomed. Anal. 2008, 48, 1392–1396. [Google Scholar] [CrossRef]
  31. Bahrami, G.; Mirzaeei, S.; Kiani, A. Sensitive analytical method for Topiramate in human serum by HPLC with pre-column fluorescent derivatization and its application in human pharmacokinetic studies. J. Chromatogr. B 2004, 813, 175–180. [Google Scholar] [CrossRef] [PubMed]
  32. Martinc, B.; Roskar, R.; Grabnar, I.; Vovk, T. Simultaneous determination of Gabapentin, Pregabalin, Vigabatrin and Topiramate in plasma by HPLC with fluorescence detection. J. Chromatogr. B 2014, 962, 82–88. [Google Scholar] [CrossRef]
  33. Bahrami, G.; Mirzaeei, S.; Mohammadi, B.; Kiani, A. High performance liquid chromatographic determination of Topiramate in human serum using UV detection. J. Chromatogr. B 2005, 822, 322–325. [Google Scholar] [CrossRef]
  34. Ranjbar, S.; Daryasari, A.P.; Soleimani, M. Ionic liquid-based dispersive liquid-liquid microextraction for the simultaneous determination of Carbamazepine and Lamotrigine in biological samples. Acta Chim. Slov. 2020, 67, 748–756. [Google Scholar] [CrossRef] [PubMed]
  35. Karinen, R.; Vindenes, V.; Hasvold, I.; Olsen, K.M.; Christophersen, A.S.; Oiestad, E. Determination of a selection of anti-epileptic drugs and two active metabolites in whole blood by reversed phase UPLC-MS/MS and some examples of application of the method in forensic toxicology cases. Drug Test. Anal. 2015, 7, 634–644. [Google Scholar] [CrossRef] [PubMed]
  36. El-Yazbi, A.F.; Wagih, M.M.; Ibrahim, F.; Barary, M.A. Spectrofluorimetric determination of Topiramate and Levetirazetam as single components in tablet formulations and in human plasma and simultaneous fourth derivative synchronous fluorescence determination of their co-adminstered mixture in human plasma. J. Fluoresc. 2016, 26, 1225–1238. [Google Scholar] [CrossRef]
  37. Das, S.; Fleming, D.H.; Mathew, B.S.; Winston, B.; Prabhakar, A.R.; Alexander, M. Determination of serum Carbamazepine concentration using dried blood spot specimens for resource-limited settings. Hosp. Pract. 2017, 45, 46–50. [Google Scholar] [CrossRef] [PubMed]
Figure 1. (A) Topiramate (TOP) (chemical structure and mass spectra); (B) Topiramate-D12 (TOP-D12) (chemical structure and mass spectra); (C) Carbamazepine (CBZ) (chemical structure and mass spectra); (D) chromatogram of TOP, TOP-D12 and CBZ in SIM mode.
Separations 11 00051 g001
Figure 2. (A) Optimization of extraction solvent type and volume (extraction conditions: sample volume, 1 mL; borate buffer (pH 9, 1 mL); dispersive solvent (Acetonitrile) volume, 1 mL). (B) Optimization of dispersive solvent volume (extraction conditions: sample volume, 1 mL; borate buffer (pH 9, 1 mL); extraction solvent (CCl4) volume, 40 µL).
Separations 11 00051 g002
Figure 3. (A) Optimization of buffer pH (extraction conditions: sample volume, 1 mL; dispersive solvent (ACN) volume, 0.5 mL; extraction solvent (CCl4) volume, 40 µL). (B) Optimization of buffer solution volume (extraction conditions: sample volume, 1 mL; dispersive solvent (ACN) volume, 0.5 mL; extraction solvent (CCl4) volume, 40 µL; borate buffer (10 mM, pH 9)).
Separations 11 00051 g003
Figure 4. (A) Optimization of sample volume (extraction conditions: dispersive solvent (ACN) volume, 0.5 mL; extraction solvent (CCl4) volume, 40 µL; borate buffer (10 Mm, pH 9), 1.25 mL). (B) Optimization of salt addition ( Extraction conditions: sample volume, 1 mL; dispersive solvent (ACN) volume, 0.5 mL; extraction solvent (CCl4) volume, 40 µL; borate buffer (10 Mm, pH 9), 1.25 mL). (C) Optimization of sonication time (extraction conditions: sample volume, 1 mL; dispersive solvent (ACN) volume, 0.5 mL; extraction solvent (CCl4) volume, 40 µL; borate buffer (10 Mm, pH 9), 1.25 mL).
Separations 11 00051 g004
Figure 5. Chromatogram of real case number 2.
Separations 11 00051 g005
Table 1. Intraday and inter-day assay for CBZ and TOP (%RSD: relative standard deviation; %RE: relative error; %R: recovery).
CarbamazepineTopiramate
Concentrations (µg mL−1) Concentrations (µg mL−1)
0.0523 0.02558
Intraday assay%RSD15.514.412.4Intraday assay%RSD15.46.46.3
%RE18.28.37.9%RE16.26.86.9
%R90.391.7107.9%R91.593.2113.9
Inter-day assay%RSD12.811.09.6Inter-day assay%RSD13.49.410.6
%RE16.514.72.6%RE18.53.45.4
%R90.5116.7102.6%R92.496.6105.4
Table 2. Real cases’ information (M: male; F: female; [CBZ]: concentration of CBZ; [TOP]: concentration of TOP).
Case N°Age (Sex)Etiology of Death[CBZ] (µg/mL)[TOP] (µg/mL)
131 (F)Accidental-1.34
245 (M)Suicide death-2.05
324 (M)Suicide death-1.81
435 (F)Accidental-2.62
548 (M)Suicide death-1.62
662 (M)Natural-1.09
752 (F)Overdose0.10-
842 (M)Suicide death0.31-
948 (M)Overdose0.20-
1059 (F)Natural0.25-
1137 (F)Accidental0.21-
1244 (M)Accidental0.44-
1360 (M)Accidental0.26-
1437 (M)Natural0.34-
1544 (F)Suicide death0.12-
1662 (M)Accidental0.4-
1741 (F)Sexual assault0.64-
1852 (M)Natural0.410.06
Table 3. Analytical figures of merit of available methodologies for the determination of CBZ and TOP in blood samples.
ReferencesBiological MatrixExtraction TechniqueDetection TechniqueDrugsData of Interest
D.J.S. et al., 2000 [10]Whole bloodSPEGC-MSCBZLR: 0.5–60
LOD: -
%R: 158
Total run: 15 min
Derivatization step
G.F.V.R. et al., 2002 [16]PlasmaLLELC-MS/MSCBZLR: 0.0008–6.6
LOD: -
%R: 95.1
Total run: 4 min
G.B. et al., 2004 [31]PlasmaLLEHPLC- FDTOPLR: 0.02–5.1
LOD: 0.001
%R: 98
Total run: 5 min
Derivatization step
G.B. et al., 2005 [33]PlasmaLLELC-UVTOPLR: 0.04–40
LOD: 0.005
%R: -
Total run: 7 min
Derivatization step
T.A.C.V. et al., 2007 [9]PlasmaSPEHPLC-DADCBZLR: 0.37–14.8
LOD: 0.018
%R: 100
Total run: 20 min
G.M. et al., 2008 [30]BloodDBSLC-MS/MSTOPLR: 0.5–50
LOD: -
%R: -
Total run: 3 min
R.M. et al., 2010 [18]PlasmaSPECETOPLR: 2–60
LOD: 0.8
%R: >92
Total run: 5 min
J.M.C. et al., 2012 [7]PlasmaSPEGC-MSTOPLR: 0.1–40
LOD: -
%R: 56.1
Total run: 6.5 min
* S.R. et al., 2012 [12]Plasma and urineMEPSGC-MSCBZLR: 0.0088–0.5
LOD: 0.0029
%R: 85.2
Total run: 16 min
A.S. et al., 2013 [6]PlasmaSPEHPLC-UVCBZLR: 0.1–50
LOD: 0.01
%R: 87.9
Total run: 16 min
T.V.P. et al., 2013 [29]Whole bloodDBSLC-MS/MSTOPLR: 0.01–2
LOD: -
%R: 93
Total run: 2 min
S.T.K. et al., 2014 [11]Whole bloodDBSGC-MSCBZLR: 0.5–120
LOD: 0.07
%R: 75–97
Total run: 14 min
A.F. et al., 2014 [3]PlasmaMEPSHPLC-DADCBZLR: 0.1–15
LOD: -
%R: 88.1
Total run: 16 min
R.K. et al., 2015 [35]Whole bloodPPUPLC-MS/MSCBZLR: 0.6–24
LOD: 0.12
LLOQ: 0.3
%R: 98
Total run: 6 min
TOPLR: 1.7–68
LOD: 0.11
LLOQ: 0.34
%R: 105
Total run: 6 min
B.M. et al., 2014 [32]PlasmaSPEHPLC- FDTOPLR: 0.5–20
LOD: -
%R: 95
Total run: 21 min
Derivatization step
Y.N. et al., 2015 [28]PlasmaPPLC-MS/MSTOPLR: 0.001–1
LOD: -
%R: 90
Total run: 8 min
A.F.E-Y. et al., 2016 [36]PlasmaPPHPLC-UVTOPLR: 0.15–1.2
LOD: 0.038
R (%): 98
Derivatization step
R.Z.H. et al., 2017 [4]PlasmaDBSGC-MSTOPLR: 0.05–30
LOD: -
LLOQ: 0.5
Total run: 10 min
Derivatization step
S.D. et al., 2017 [37]SerumDBSHPLCCBZLR: 2–20
%R: >90
A.A.I. et al., 2018 [17]PlasmaLLECETOPLR: 1–30
LOD: -
Total run: 2.5 min
B.F. et al., 2019 [13]UrineHLLE-DLLMEGC-FIDCBZLR: 0.04–100
LOD: 0.010
LLOQ: 0.033
Total run: 16 min
S.R. et al., 2020 [34]PlasmaIL-DLLMEHPLC-UVCBZLR: 0.1–20
LOD: 0.04
S.B. et al., 2021 [5]Whole blood-FO-BLICBZLR: 0.1–10
LOD: 0.01
Total run: 8 min
E.Q. et al., 2022 [2]Plasma ratPPUPLC-MS/MSTOPLR: 0.005–5
LOD: -
%R: 90.9
Total run: 6.5 min
H-Y.C. et al., 2023 [27]PlasmaUAELC-MS/MSCBZLLOQ: 0.008
LOD: 0.003
Proposed methodPlasmaDLLMEGC-MSCBZLR: 0.05–3
LOD: 0.025
%R: 90.3–116.7
TOPLR: 0.025–8
LOD: 0.01
%R: 91.5–113.9
Total run: 10 min
* Data of interest related to plasma sample. (HLLE-DLLME: homogenous liquid–liquid extraction–dispersive liquid–liquid microextraction; DBS: dried blood spot; MEPS: microextraction by packed sorbent; SPE: solid-phase extraction; LLE: liquid–liquid extraction; PP: protein precipitation; IL-DLLME: ionic liquid–dispersive liquid–liquid microextraction; GC-FID: gas chromatography–flame ionization detector; UAE: ultrasound-assisted extraction; GC-MS: gas chromatography–mass spectrometry; HPLC-DAD: high-performance liquid chromatography–diode-array detector; HPLC-UV: high-performance liquid chromatography–ultraviolet detection; UPLC-MS/MS: ultra-performance liquid chromatography–tandem mass spectrometry; FO-BLI: fiber-optic biolayer interferometry; CE: capillary electrophoresis; HPLC-FD: high-performance liquid chromatography–fluorescence detection; LR: liner range, µg mL−1; LOD: limit of detection, µg mL−1; LLOQ: lower limit of detection, µg mL−1; %R: recovery).
Disclaimer/Publisher’s Note: The statements, opinions and data contained in all publications are solely those of the individual author(s) and contributor(s) and not of MDPI and/or the editor(s). MDPI and/or the editor(s) disclaim responsibility for any injury to people or property resulting from any ideas, methods, instructions or products referred to in the content.

