Article

A New Ultra High-Performance Liquid Chromatography-Tandem Mass Spectrometry Method to Monitor 1-Amino-4-Methyl-Piperazine and 1-Methyl-4-Nitroso-Piperazine in Rifampicin Hydrolysis: A Standard Addition Approach to Quantify Nitrosamine in Rifampicin

National Centre for the Control and Evaluation of Medicines, Istituto Superiore di Sanità, Viale Regina Elena 299, 00161 Rome, Italy
*
Author to whom correspondence should be addressed.
Separations 2024, 11(2), 54; https://doi.org/10.3390/separations11020054
Submission received: 10 January 2024 / Revised: 1 February 2024 / Accepted: 6 February 2024 / Published: 7 February 2024
(This article belongs to the Section Chromatographic Separations)

Abstract

:
1-amino-4-methyl-piperazine (AMP) is both a starting material for the synthesis of rifampicin (RIF) and a degradation product of RIF hydrolysis. 1-methyl-4-nitroso-piperazine (MNP) is an oxidation product of AMP as well as a potentially genotoxic N-nitrosamine. The EMA and FDA have approved an ad interim limit of 5 ppm for MNP in RIF drug products. As in-house methods for the analysis of MNP in RIF use a wide range of conditions for mobile phases and sample diluents, we decided to investigate whether these conditions affect the formation of MNP and AMP. A UHPLC-MS/MS method was developed to simultaneously quantify AMP and MNP during RIF hydrolysis in buffered aqueous solutions at different pH levels. Analyses were performed in MRM mode; separations were carried out on an InfinityLab Poroshell HPH-C18 (100 mm, 2.1 mm i.d., particle size 1.9 μm). In aqueous RIF solutions, the content of AMP and MNP increases with time; at different pHs, the concentration of AMP increases much faster in acidic than in basic solutions; and the increase in MNP can be reduced by the addition of ascorbic acid. To avoid an overestimation of MNP, water should not be used as a diluent in RIF sample preparations. Methanol is a more suitable diluent than water. A standard addition method has been validated for the quantification of MNP in RIF drug substances.

1. Introduction

Awareness of the presence of nitrosamines in drugs was raised in mid-2008, when some N-nitrosamine impurities such as N-nitrosodiethylamine (NDEA) and N-nitrosodimethylamine (NDMA) were detected in several antihypertensive drugs known as “sartans”. N-Nitrosamines are a class of chemical compounds with the chemical structure (R1R2) N-N=O.
According to the “Agents classified by the IARC monographs”, N-nitrosamines may be carcinogenic to humans (Group 1); probably carcinogenic to humans (Group 2A); possibly carcinogenic to humans (Group 2B); and not classifiable as to their carcinogenicity to humans (Group 3) [1].
In November 2022, the European Pharmacopoeia (Ph.Eur.) Commission adopted the revised general monographs “Substances for pharmaceutical use” and “Pharmaceutical preparations”, which now include a paragraph explaining the Ph.Eur. approach to N-nitrosamine impurities [2,3]. In brief, marketing authorization holders should review their manufacturing processes for all products containing chemically synthesized or biologically active substances to identify and, if necessary, mitigate the risk of the presence of nitrosamine impurities. Manufacturers are required to have appropriate control strategies in place to prevent or limit the presence of these impurities and to improve their manufacturing processes where necessary [4]. The presence of N-nitrosamines may be related to the drug synthesis process, for example, from the water used in the process, from solvent recovery and from the catalyst. Nitrite and nitrate in excipients can promote their formation during drug formulation, but also during primary packaging, making the formation of N-nitrosamine impurities specific or non-specific to a product. Therefore, appropriate analytical methods are required to detect and to quantify N-nitrosamines in active substances and in medicinal products.
The general Chapter “N-Nitrosamines in Active Pharmaceutical Ingredients” of the Ph.Eur. describes a limit test for the most common N-nitrosamines, such as NDMA, NDEA (group 2A) NMBA, NEPA and NDiPA, in the active substance of “sartans” [5]. Unfortunately, the problem of N-nitrosamines is not limited to sartans, but also extends to other drugs such as ranitidine and metformin.
Rifampicin (RIF, Scheme 1) is an antibiotic and azomethine (-N=CH-) compound that has been used as an anti-tubercular agent since the late 1960s. It is also used to treat other serious infections such as blood infections and leprosy. The risk of the presence of N-nitrosamine in RIF is related to the final step of the chemical synthesis, which requires the reaction of 1-amino-4-methyl-piperazine (AMP) with 3-formyl-rifamycin. AMP can be oxidized to 1-methyl-4-nitroso-piperazine (MNP) either by atmospheric oxygen or by free nitrite derived from the hydrolysis of alkyl nitrite, which is also used in RIF synthesis [6]. Furthermore, AMP can be formed from the hydrolysis of RIF and then oxidized to MNP, which is classified as a group 2B N-nitrosamine (Scheme 1) [1].
Screening methods capable of detecting different N-nitrosamines in a single chromatographic run use water as the sample diluent, as described in the Ph.Eur. [5]. Such a diluent has been extended to the analysis of RIF. However, as previously reported, RIF is not stable in solution, especially in acidic solutions where the main degradation products are 3-formylrifamycin and AMP [7]. RIF is also unstable at alkaline pH [8]. In a previous study of the hydrolysis of RIF, the decrease in RIF concentration with time was monitored by HPLC-UV, but the appearance of AMP could not be monitored due to its UV transparency [9]. The easy oxidation of AMP to MNP makes the simultaneous monitoring of both analytes of utmost importance, not only during the shelf life of RIF but also in vivo.
Consequently, both MNP and AMP should be considered as impurities, although only MNP is potentially carcinogenic to humans. Therefore, appropriate detection methods should be developed for their assays. Due to the low concentration allowed for MNP (5 ppm, ad interim limit) [10] and the UV transparency of AMP, hyphenated techniques such as liquid mass spectrometry are the most appropriate.
To date, an official method for the determination of MNP concentration in RIF by LC-ESI-HRMS has been developed by the FDA [10]. This is a single-point test (limit test) and the MNP concentration in the sample is calculated based on a single-concentration solution. Few other papers have been published on the analysis of MNP in RIF, but to the best of our knowledge, there are no LC-MS methods available in the literature for the quantification of AMP [6,11,12,13].
Other in-house methods have been developed for the determination of MNP in RIF with a wide range of conditions, in particular, an acidic mobile phase with formic acid as a modifier or a basic mobile phase with either ammonium formate or ammonium bicarbonate, and with water and methanol as sample diluents. For this reason, we decided to investigate how these conditions affect the formation of AMP and MNP. Therefore, the aim of this study was to develop and to validate a new suitable UHPLC-MS/MS method to monitor the formation of AMP and MNP during the hydrolysis of RIF at different pH values. In addition, the effect of sample diluents on the formation of AMP and MNP was investigated. The same method was then applied to the analysis of MNP in various drug substances using a standard addition approach.

2. Materials and Methods

2.1. Chemicals and Reagents

All chemicals and reagents were of analytical grade. 1-amino-4-methyl-piperazine (AMP, purity 99.9%) was purchased from Sigma Aldrich. 1-methyl-4-nitroso-piperazine, in 10 mg vials (MNP, purity 99.78%), was purchased from Spectra 2000 S.r.l. (Rome, Italy); 1-methyl-4-nitroso-piperazine-d4 (MNP-d4, IS, C5H7D4N3O, isotopic purity 99.6%) was purchased from Toronto Research Chemicals, Canada. Rifampicin (RIF) active pharmaceutical ingredients were obtained from RIF Italian sites of production. Methanol hypergrade for LC-MS was purchased from Merck. Formic acid for LC-MS (98–100%) and ammonium formate (AF), eluent additive for LC-MS (purity 99%), were from Merck; and ascorbic acid (AA, purity 99%) and ammonium hydroxide solution (28.0–30.0%) were purchased from Sigma-Aldrich (Milan, Italy). HPLC-grade water was prepared using a Milli-Q water purification system.

2.2. LC-MS/MS Instrumentation and Conditions

A UHPLC system (Mod. 1260 Infinity II, Agilent, Santa Clara, CA, USA) equipped with a quaternary pump, a vacuum degasser, a column compartment and an autosampler, all with thermostat controls, was used for solvent and sample delivery. Separations were carried out on an InfinityLab Poroshell HPH-C18 (100 mm, 2.1 mm i.d., particle size 1.9 μm). The mobile phase consisted of (A) water (AF 5 mM; pH = 8.0 with ammonium hydroxide) and (B) methanol with a flow rate of 0.25 mL min−1. The elution gradient was 0.0–2.7 min, A: 90%; 2.7–3.0 min, A: 90–5%; 3.1–11 min, A: 5%; 11.1–23 min A: 90%. The injection volume was 1 μL. The sample rack compartment was maintained at 37 °C for kinetic study and at 10 °C for the MNP validation method. The column compartment was set at 40 °C. A QQQ Ultivo triple quadrupole mass spectrometer (Agilent, Santa Clara, CA, USA) with an ESI source was used for mass detection and analysis. Mass spectrometric analyses were carried out in positive ion mode (ESI+). The ESI source interface parameters were set as follows: nitrogen gas temperature 350 °C; gas flow 10 L min−1; nebulizer 55 psi; capillary voltage 2.0 kV. MRM acquisition was divided into two time segments, 0.6–2.0 min for AMP and 2.1–3.5 min for MNP and IS, with dwell time 200 ms. The diverter valve directed the chromatographic flow to waste for the first 0.6 min and at the end of acquisition (3.5 min). For each analyte, the appropriate MRM transitions, [M+H]+ precursor ions > product ions and the relative collision energies were selected based on the results obtained by the Agilent Optimizer software (Version 1.2.23). The two most abundant MRM transitions were chosen as the quantifier and as the qualifier in Agilent Mass-Hunter Quantitative Analysis (for QQQ) software used for data processing. The MS/MS selected parameters, MRM transitions and collision energies are listed in Table 1. Data acquisition was carried out by the Agilent MassHunter Workstation Data Acquisition software.

2.3. Standard Solutions and Sample Preparation

A 10.0 mg vial of MNP certified standard was dissolved and diluted to 10.0 mL with methanol (mother solution, 1 mg mL−1) and stored at −20 °C. Spiking solutions were prepared by diluting 10 μL of the mother solution in 10 mL (1 μg mL−1) of water in the study of MNP in buffered solution or in methanol for the study of the stability of RIF in methanol.
A 5.0 mg vial of MNP-d4 (IS) certified standard was dissolved and diluted to 2.0 mL with methanol and stored at −20 °C (mother solution, 2500 μg mL−1). Stock solutions were prepared by diluting 40 μL of the mother solution in 10 mL of methanol (10 μg mL−1). Spiking solutions were prepared by diluting 1.0 mL of stock solution to 10.0 mL (1 μg mL−1) with methanol. All solutions were stored at −20 °C.
AMP stock solutions were prepared by diluting 10 μL of standard solution in 10 mL of methanol (1 mg mL−1). AMP spiking solutions were prepared by diluting 10 μL of stock solutions in 10 mL (1 μg mL−1) in water, for the study of AMP in buffered solution, or in methanol for the study of the stability of RIF in methanol.
RIF active pharmaceutical ingredients (API) at 0.4 mg mL−1 in AF buffered solutions and in methanol were used to monitor AMP and MNP formation. AF (5 mM) was adjusted to pHs 2, 4, 6 and 8 with ammonium hydroxide or formic acid.
AA solutions in water (3.5 mg mL−1) were prepared daily.

2.4. Calibration Solutions

Calibration solutions were used to calculate MNP and AMP concentrations in AF buffered solutions and in methanol in the study of RIF hydrolysis in AF and in methanol, respectively. They were prepared by diluting AMP and MNP stock solutions in AF (pH = 8.0; 5 mM) or in methanol in two different ranges: 0.5–100 ng mL−1 for MNP in both AF and methanol and for AMP in methanol (seven points); 50–10,000 ng mL−1 for AMP in AF (nine points). Calibration equations were calculated by a linear regression of peak area (AMP and MNP) versus concentrations using Mass-Hunter Quantitative Analysis software. Concentrations of AMP and MNP in RIF solutions, monitored at different times, were calculated from the calibration equations using the same software. The LOQ was calculated in standard calibration solutions with S/N ≥ 10.

2.5. Method Validation Parameters for AMP and MNP Quantification in the RIF Hydrolysis Study

The IS was not used in this method. A system suitability test (SST) was performed at the beginning of each work session. The RSDs% of the RTs (AMP and MNP) and the RSD% of the peak area in six repeated injections of a calibration solution at 50 ng mL−1 were checked.
Specificity was ensured by checking for the absence of MRM interfering peaks in blank samples at the RTs of AMP and MNP. Linearity was examined using calibration solutions over six points on three different days in the range of 0.5–100 ng mL−1 for MNP in both AF and methanol and for AMP in methanol (seven points); 50–10,000 ng mL−1 for AMP in AF (nine points). The LOQ was calculated in standard calibration solutions with S/N ≥ 10.
Recovery was calculated from RIF spiked at three fortified levels for MNP (25 ng mL−1, 50 ng mL−1 and 75 ng mL−1), taking into account the content of MNP in the sample and for AMP (50 ng mL−1, 500 ng mL−1 and 2000 ng mL−1). Repeatability was determined at the same three fortified levels as the RSD% of the three spiked samples for each level. The intermediate precision was inferred from linearity experiments, performed in three days by two analysts and calculated, pooling the SD results at each level.

2.6. Monitoring of AMP and MNP Formation from RIF Hydrolysis in Buffered Solutions

The concentrations of AMP and MNP during RIF hydrolysis were monitored in AF (5 mM) at different pH (2, 4, 6, 8) with and without AA (3.5 mg mL−1) at 37 °C. RIF solutions were prepared at 0.4 mg mL−1, vortex-mixed for two minutes and sonicated for one minute.

2.7. Monitoring of RIF Hydrolysis in Methanol

AMP and MNP concentrations were monitored in methanol at 37 °C. RIF solutions were prepared at 0.4 mg mL−1 by vortex-mixing for two minutes and were sonicated for one minute.

2.8. Standard Addition Method for Quantification of MNP in API

All standards, spiking solutions and samples were prepared in methanol.

2.8.1. Sample Preparation

Briefly, 50 mg (±1 mg) of RIF, fortified with IS (20 ng mL−1), was solubilized in 5.0 mL of methanol, vortex-mixed and sonicated for one minute, filtered and transferred to a vial for analysis.
Then, 50 mg (±1 mg) of RIF fortified with IS (20 ng mL−1) and MNP standard solutions at the final concentrations of 5, 10, 20, 50 and 75 ng mL−1 were diluted with methanol to a final volume of 5.0 mL, vortex-mixed and sonicated for one minute, filtered and transferred to the vial for analysis.

2.8.2. System Suitability Test

An SST was performed at the beginning of each work session. The RSDs% of the RTs (IS and MNP) and the RSD% of the peak area ratio (MNP/IS) in six repeated injections of a calibration solution at 20 ng mL−1 were checked.

2.8.3. Specificity

Specificity was ensured by checking for the absence of MRM interfering peaks in blank samples at the RTs of MNP and IS and by checking for the absence of IS MRM interfering peaks in RIF solutions, as MNP was always present in RIF samples.
The ratio of qualifying/quantifying peaks of MNP and IS was always checked to be within the range of 80–120% of the same ratio calculated on the qualifying/quantifying peaks of the standards.

2.8.4. Linearity

Linearity was investigated at six points: one RIF sample spiked with IS only (20 ng mL−1) and the other five RIF samples spiked with IS and MNP standard at 5, 10, 20, 50 and 75 ng mL−1. In each working session, linearity was checked by preparing only the first four points as described above, in triplicate (12 samples). The linearity of the first day (six points) and the linearity of the other three days (three curves each day) were compared with a t-test (one tail, t.975) to verify that the linearity calculated over four points was comparable to the linearity calculated over six points.
Calibration curves were calculated by the linear regression of peak area ratio (MNP/IS) versus concentrations using MassHunter Quantitative Analysis software 10.2.

2.8.5. LOQ

The LOQ was calculated in standard calibration solutions with S/N ≥ 10.

2.8.6. Repeatability and Intermediate Precision

The repeatability was calculated as the RSD% on nine independent replicates (three samples in three working sessions). Intermediate precision was calculated as the RSD% on a total of nine independent replicates performed by two analysts over three days.

3. Results

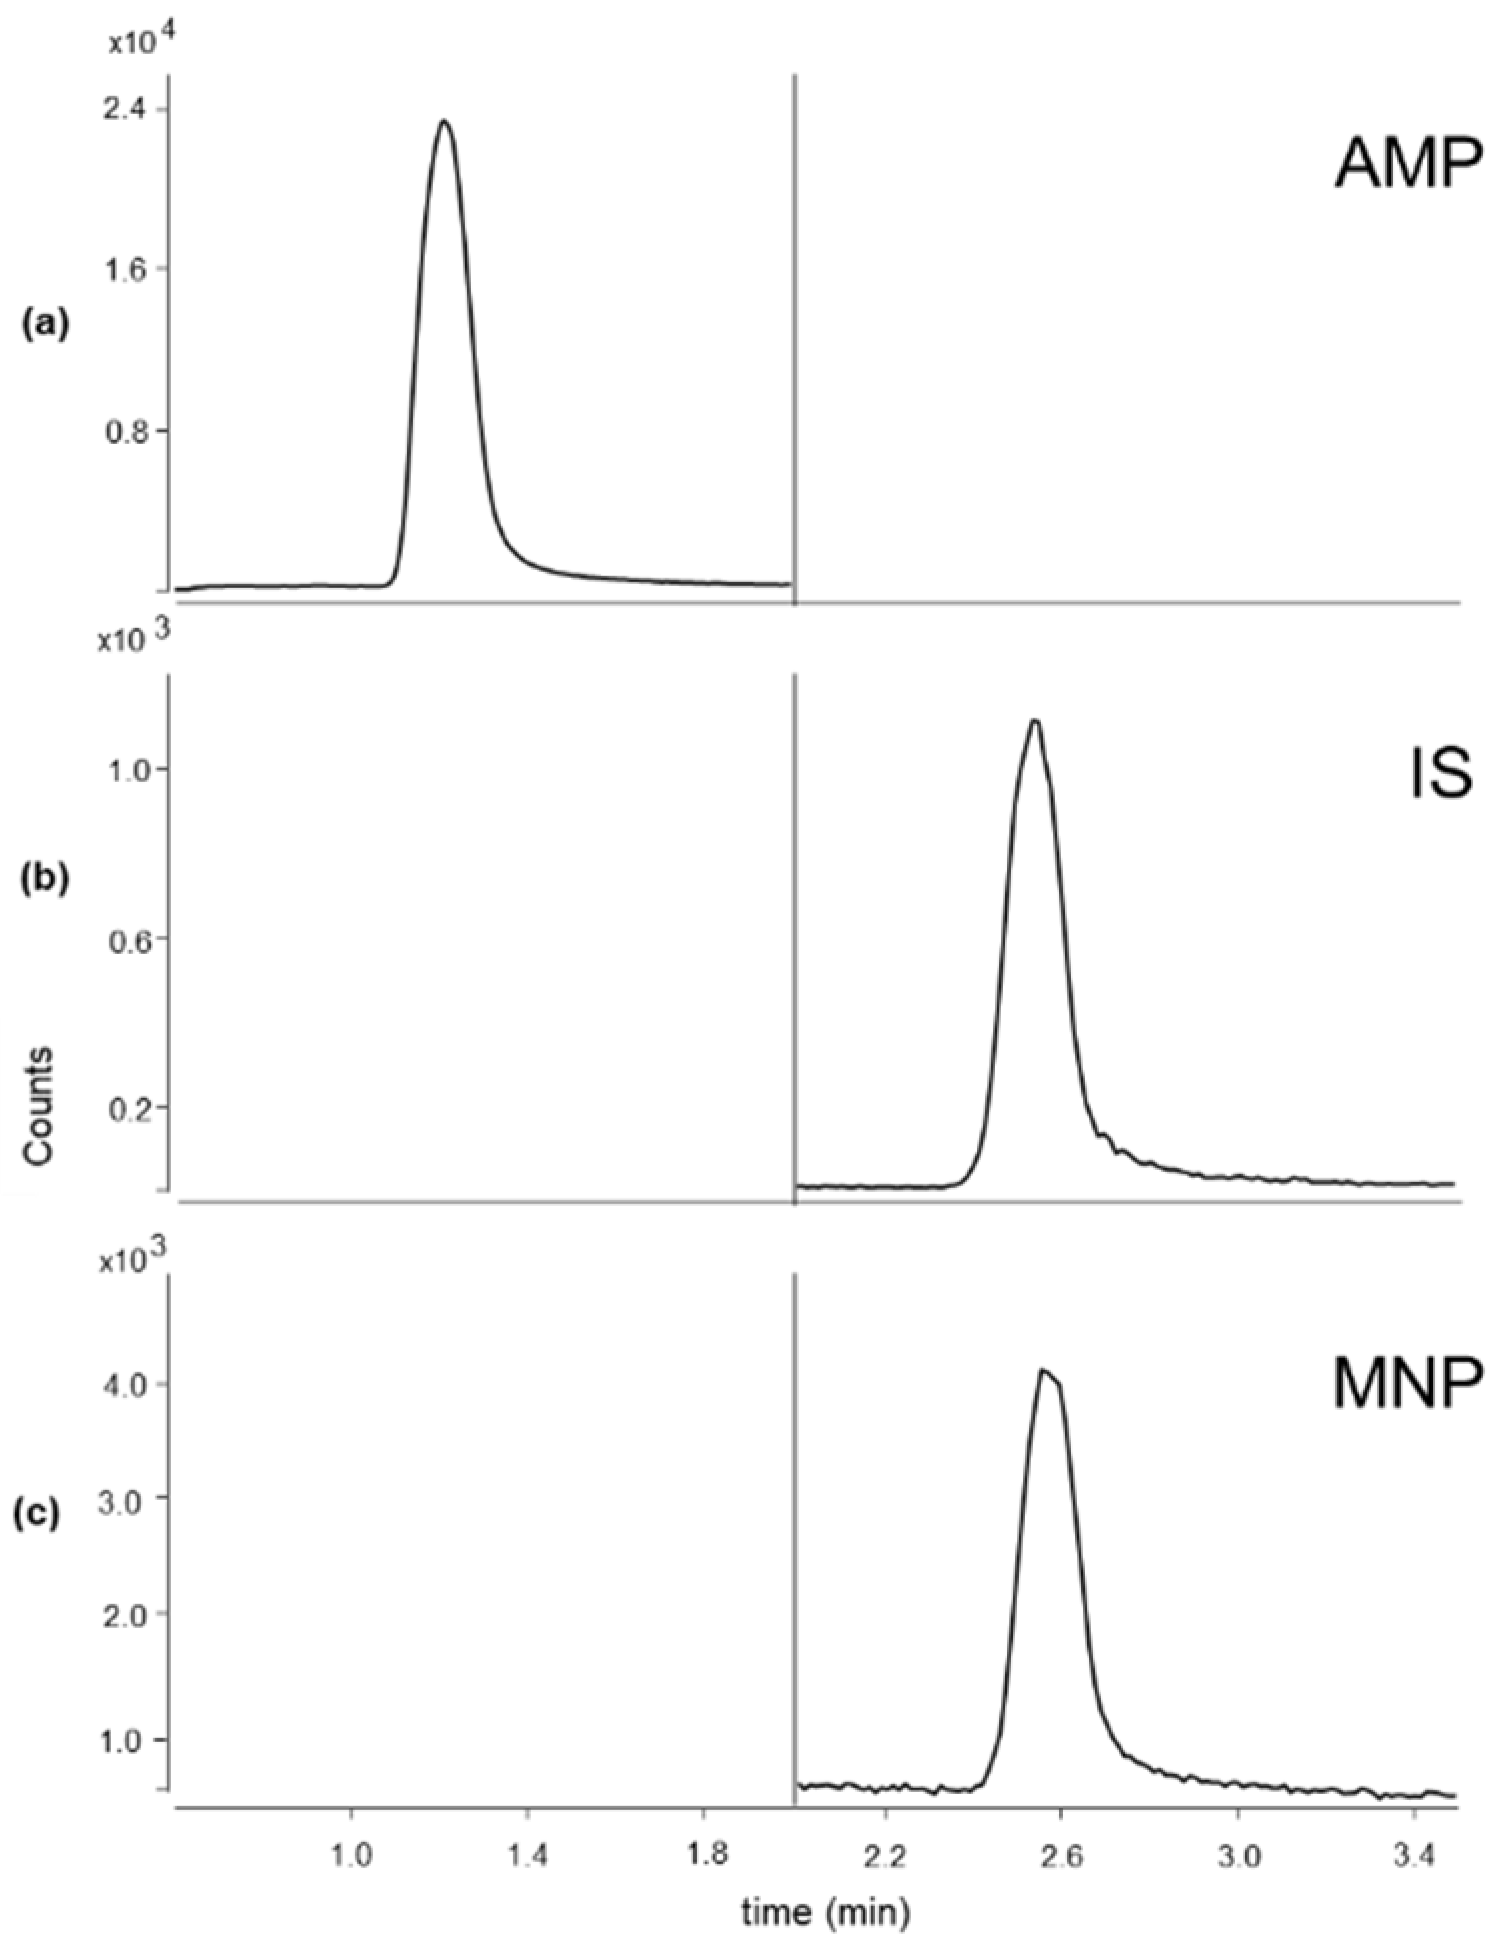
3.1. LC-MS/MS Conditions

The optimized LC-MS conditions were the result of preliminary experiments. Different modifiers in mobile phase A were tested. When formic acid (0.02%) was used instead of ammonium formate, AMP and MNP were not adequately retained; when ammonium carbonate (10 mM; pH = 9) was used, an increase in column backpressure and a worsening in the peaks’ area repeatability was observed. Elution gradients starting with different mobile phase A compositions in the range of 95–80% were also tested. The column temperature of 40 °C was chosen to reduce the column back pressure. Different RIF concentrations in the range of 30–10 mg mL−1 were also tested.
Figure 1 shows the MRM–extracted ion chromatograms (ESI+) of the quantitative transitions (listed in Table 1) of AMP and MNP (100 ng mL−1) and IS standards (20 ng mL−1) in methanol with the optimized conditions. The standards were separated within 3 min at the following RTs: AMP = 1.22 min, MNP = 2.54 min and IS = 2.56 min. This method was successfully applied to monitor AMP and MNP formation from RIF hydrolysis in buffered aqueous solutions and in methanol. In this study, the low concentration of RIF utilized (0.4 mg mL−1) made the use of IS unnecessary. On the other hand, when the same method was used for the study of MNP in RIF samples at the concentration of 10 mg mL−1, IS was added to the samples. Unfortunately, at 10 mg mL−1 the method could only be used to quantify MNP in RIF when methanol was used as a diluent. In fact, although AMP standard solutions in methanol (and in aqueous solution) showed symmetrical chromatographic peaks (Figure 1), the presence of the RIF matrix at higher concentrations caused an unacceptable tailing for AMP.

3.2. Validation Results of the Method for the Quantification of AMP and MNP in the RIF Hydrolysis Study

In each working session, in the SST performed on a calibration solution at 50 ng mL−1, the maximum values observed for the RSD% of RTs for MNP and AMP were 0.2% and 0.3%, respectively; the RSD% of the MNP and AMP peak areas were in the range of 3–10% and of 3–7%, respectively. The symmetry of AMP was always in the range of 1.0–1.5, while a lower symmetry in the range of 1.3–1.8 was observed for MNP. The method is specific as no interfering peaks of AMP and MNP were detected in blank samples.
The calibration equations for MNP and AMP in AF and in methanol calculated by the Agilent Mass-Hunter Workstation data acquisition software are shown in Table 2. Concentrations of AMP and MNP in RIF solutions, monitored at different times, were calculated from these calibration equations using the same software. Linearity was always r2 ≥ 0.99. In AF, the LOQ for MNP was 0.5 ng mL−1, while the LOQ for AMP was taken as 50 ng mL−1 as the lowest concentration studied, because it was not worthwhile to study a lower concentration. In methanol, a LOQ of 5 ng mL−1 was observed for MNP and 2.5 ng mL−1 for AMP.
The mean value of recovery at the three spiking levels for AMP and MNP was always in the range of 80–120%. The repeatability expressed as RSD% was always less than 11%. The pooled intermediate precision expressed as RSD% was 12%. The results are shown in Table 3.

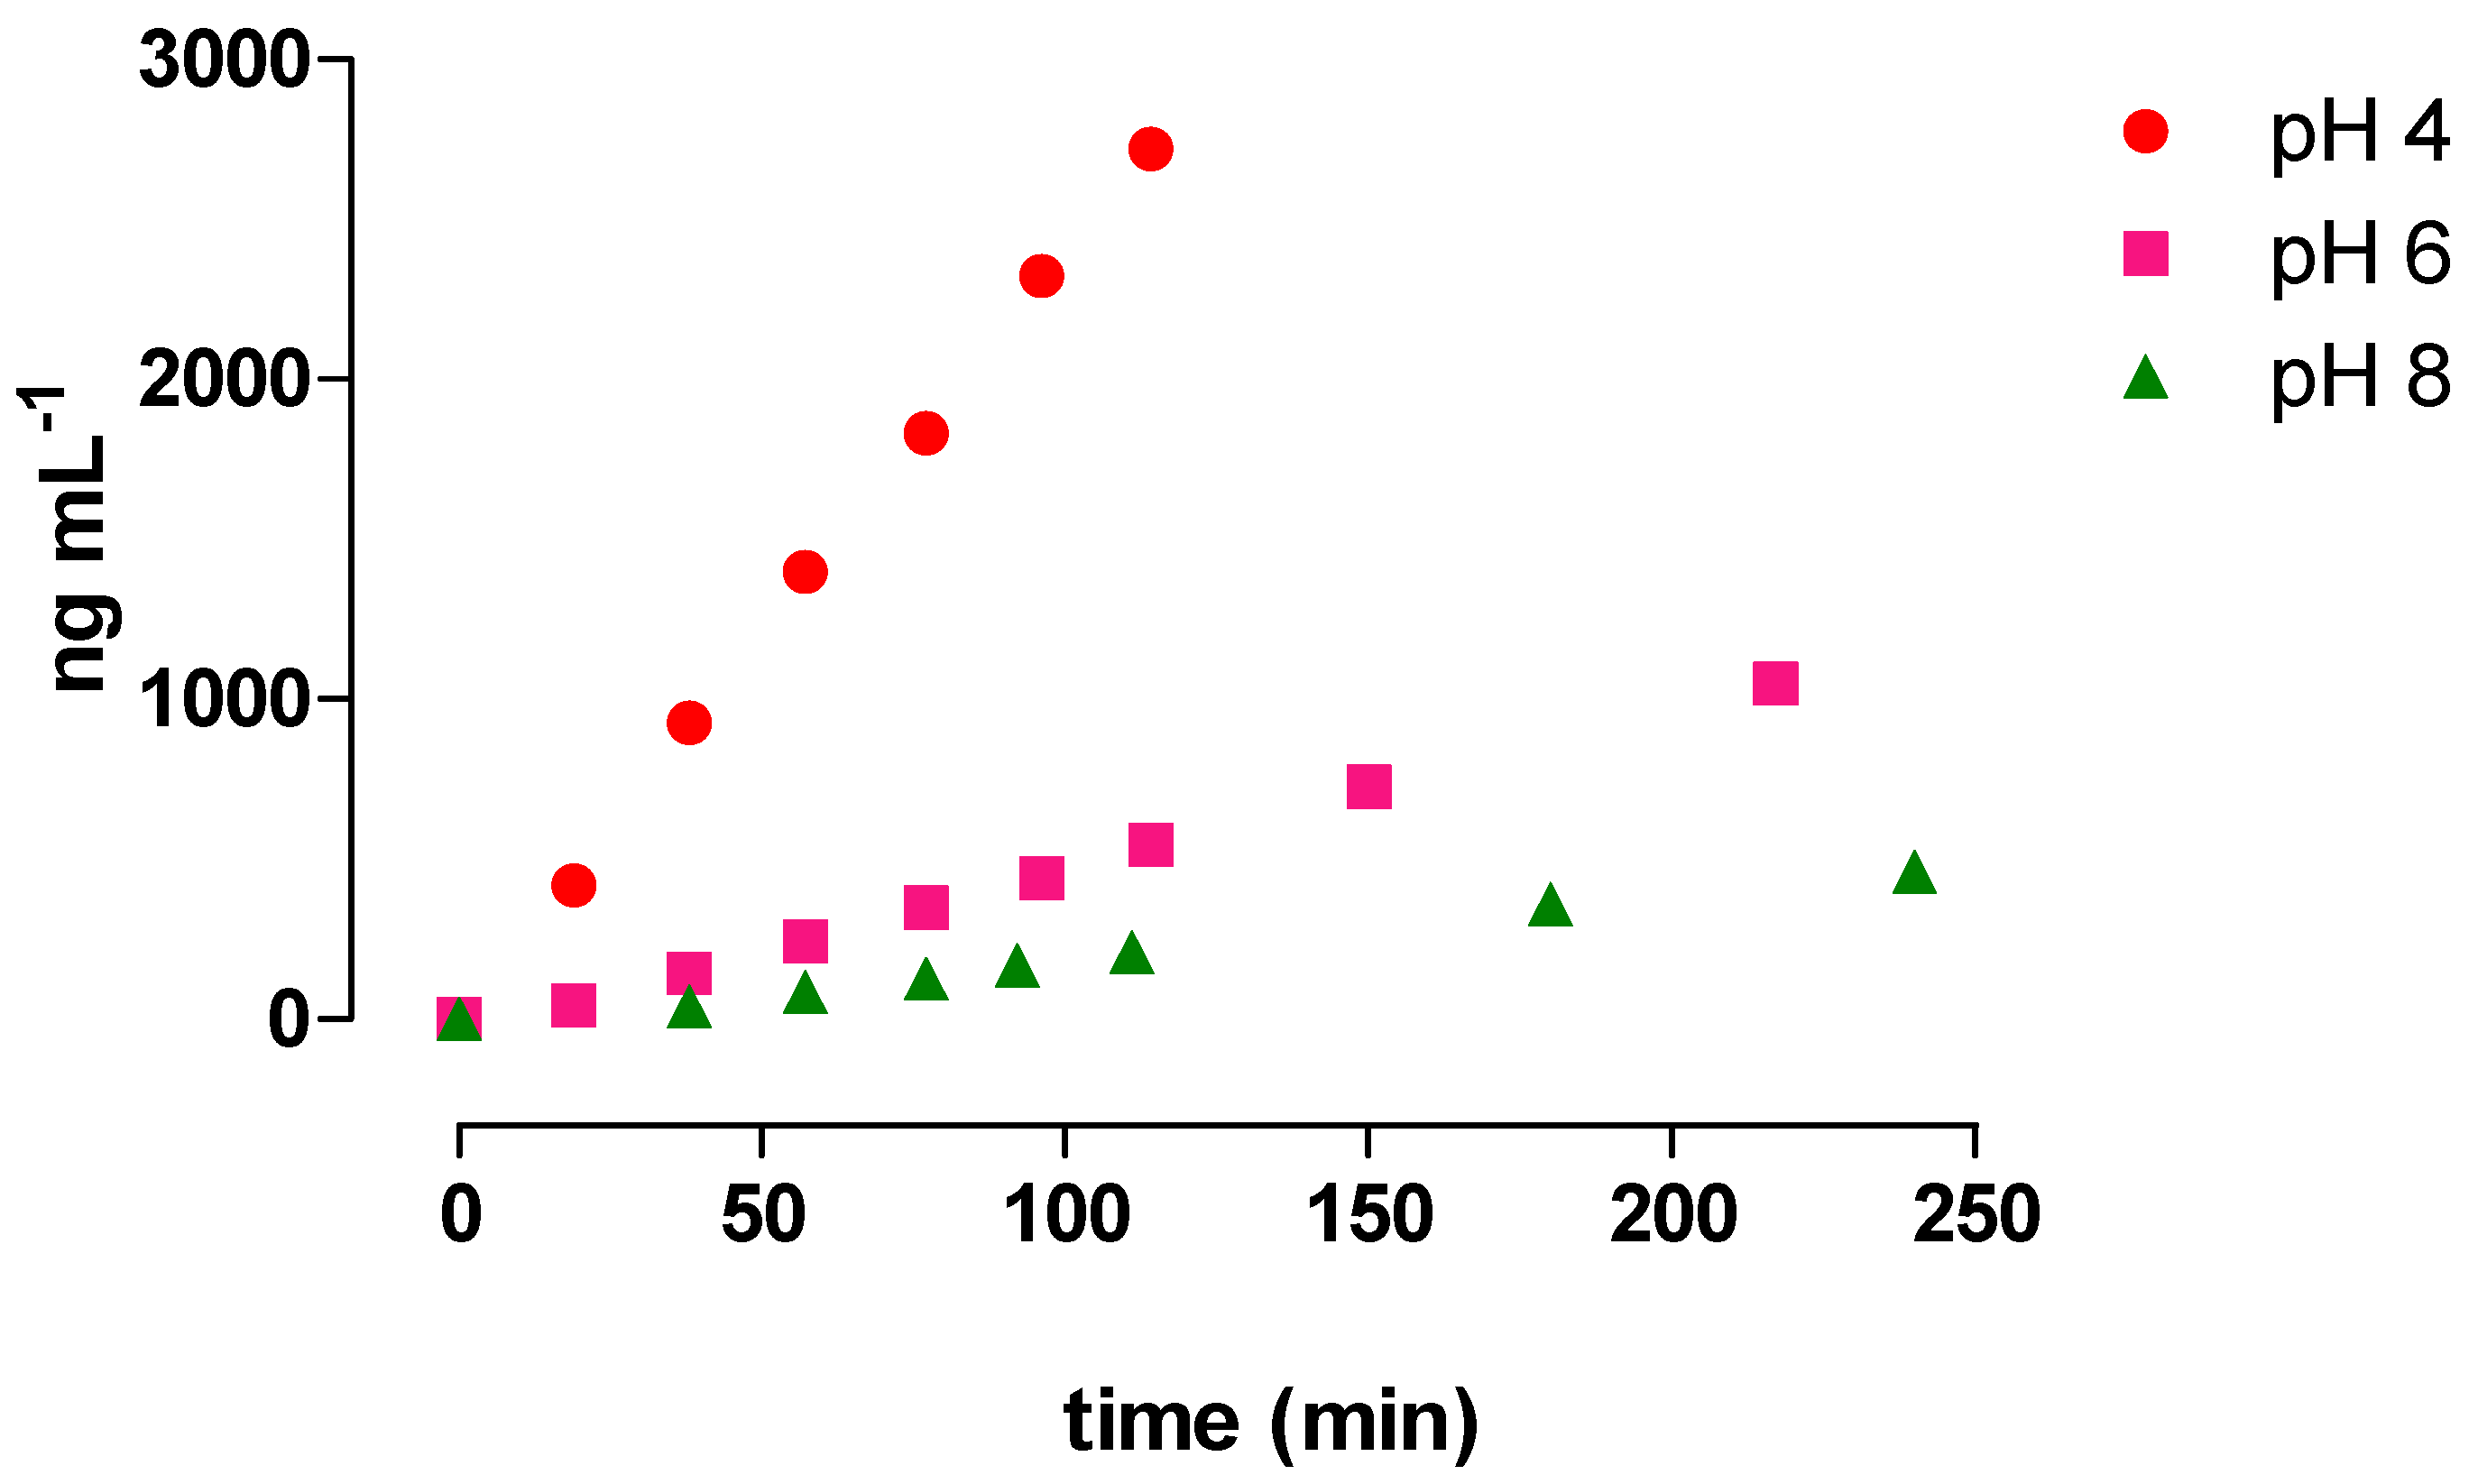
3.3. Monitoring AMP and MNP Formation from RIF Hydrolysis in Buffered Solutions

RIF is commercially available in various dosage forms such as tablets and capsules, either alone or in combination with other active ingredients. During a system suitability test, an increase in MNP concentration was observed in a drug product containing RIF and isoniazid as active ingredients, over six repeated injections of the same sample diluted with water. In particular, in a sample containing 25 mg mL−1 and 12.5 mg mL−1 of RIF and isoniazid, respectively, the MNP content increased by 18% in 75 min (from about 2.4 to 2.7 ppm). Although an increase in the degradation of RIF in the presence of isoniazid has been observed previously, the increase in MNP has not been reported previously [14]. This evidence suggested that the rapid MNP formation was preceded by a faster AMP production. As the quantification of AMP in RIF hydrolysis has never been reported before, we decided to monitor how the pH affects AMP formation in buffered solutions. Moreover, since the formation of MNP reduces the AMP concentration, and thus affects the AMP kinetics, we decided to monitor AMP in the presence of AA, which prevents the oxidation of AMP to MNP [15]. These experiments were performed with RIF alone without isoniazid at different pH values (range 2–8). RIF sample solutions were prepared at 0.4 mg mL−1 because at pH = 2 higher concentrations of RIF precipitated in the vial. On the other hand, at this concentration, RIF could not be monitored by LC-MS/MS because it was too concentrated. Consequently, the concentrations of the producing AMP and MNP were monitored instead of the residual RIF. The results are shown in Figure 2, where the concentration of AMP is plotted against time. Slower AMP formation was observed in the pH range 6–8, where the trend was linear for about 6 h. No variation in MNP concentration was observed in this time range due to the presence of AA. The fastest results at pH = 2 were not plotted because AMP exceeded the upper limit of the calibration range (10 μg mL−1) within 70 min and the concentration of 1.3 μg mL−1 was reached in 20 min. This result is interesting considering the low physiological pH and the time required for digestion. The higher stability was observed in the range of pH 6–8, which is the range of pH used for the mobile phase. The next step was to evaluate MNP formation in the presence and in the absence of AA. Figure 3 shows the plot of MNP concentration versus time obtained at 37 °C. In a solution of RIF at 0.4 mg mL−1 (pH = 8) without AA, the initial concentration of about 1 ng mL−1 reached concentrations of about 5, 12 and 20 ng mL−1 after about 4, 5 and 6 h, respectively. As expected, the presence of AA reduced the MNP formation. This can be seen in Figure 3, where the addition of AA delayed the increase in MNP while without AA the increase is more evident.

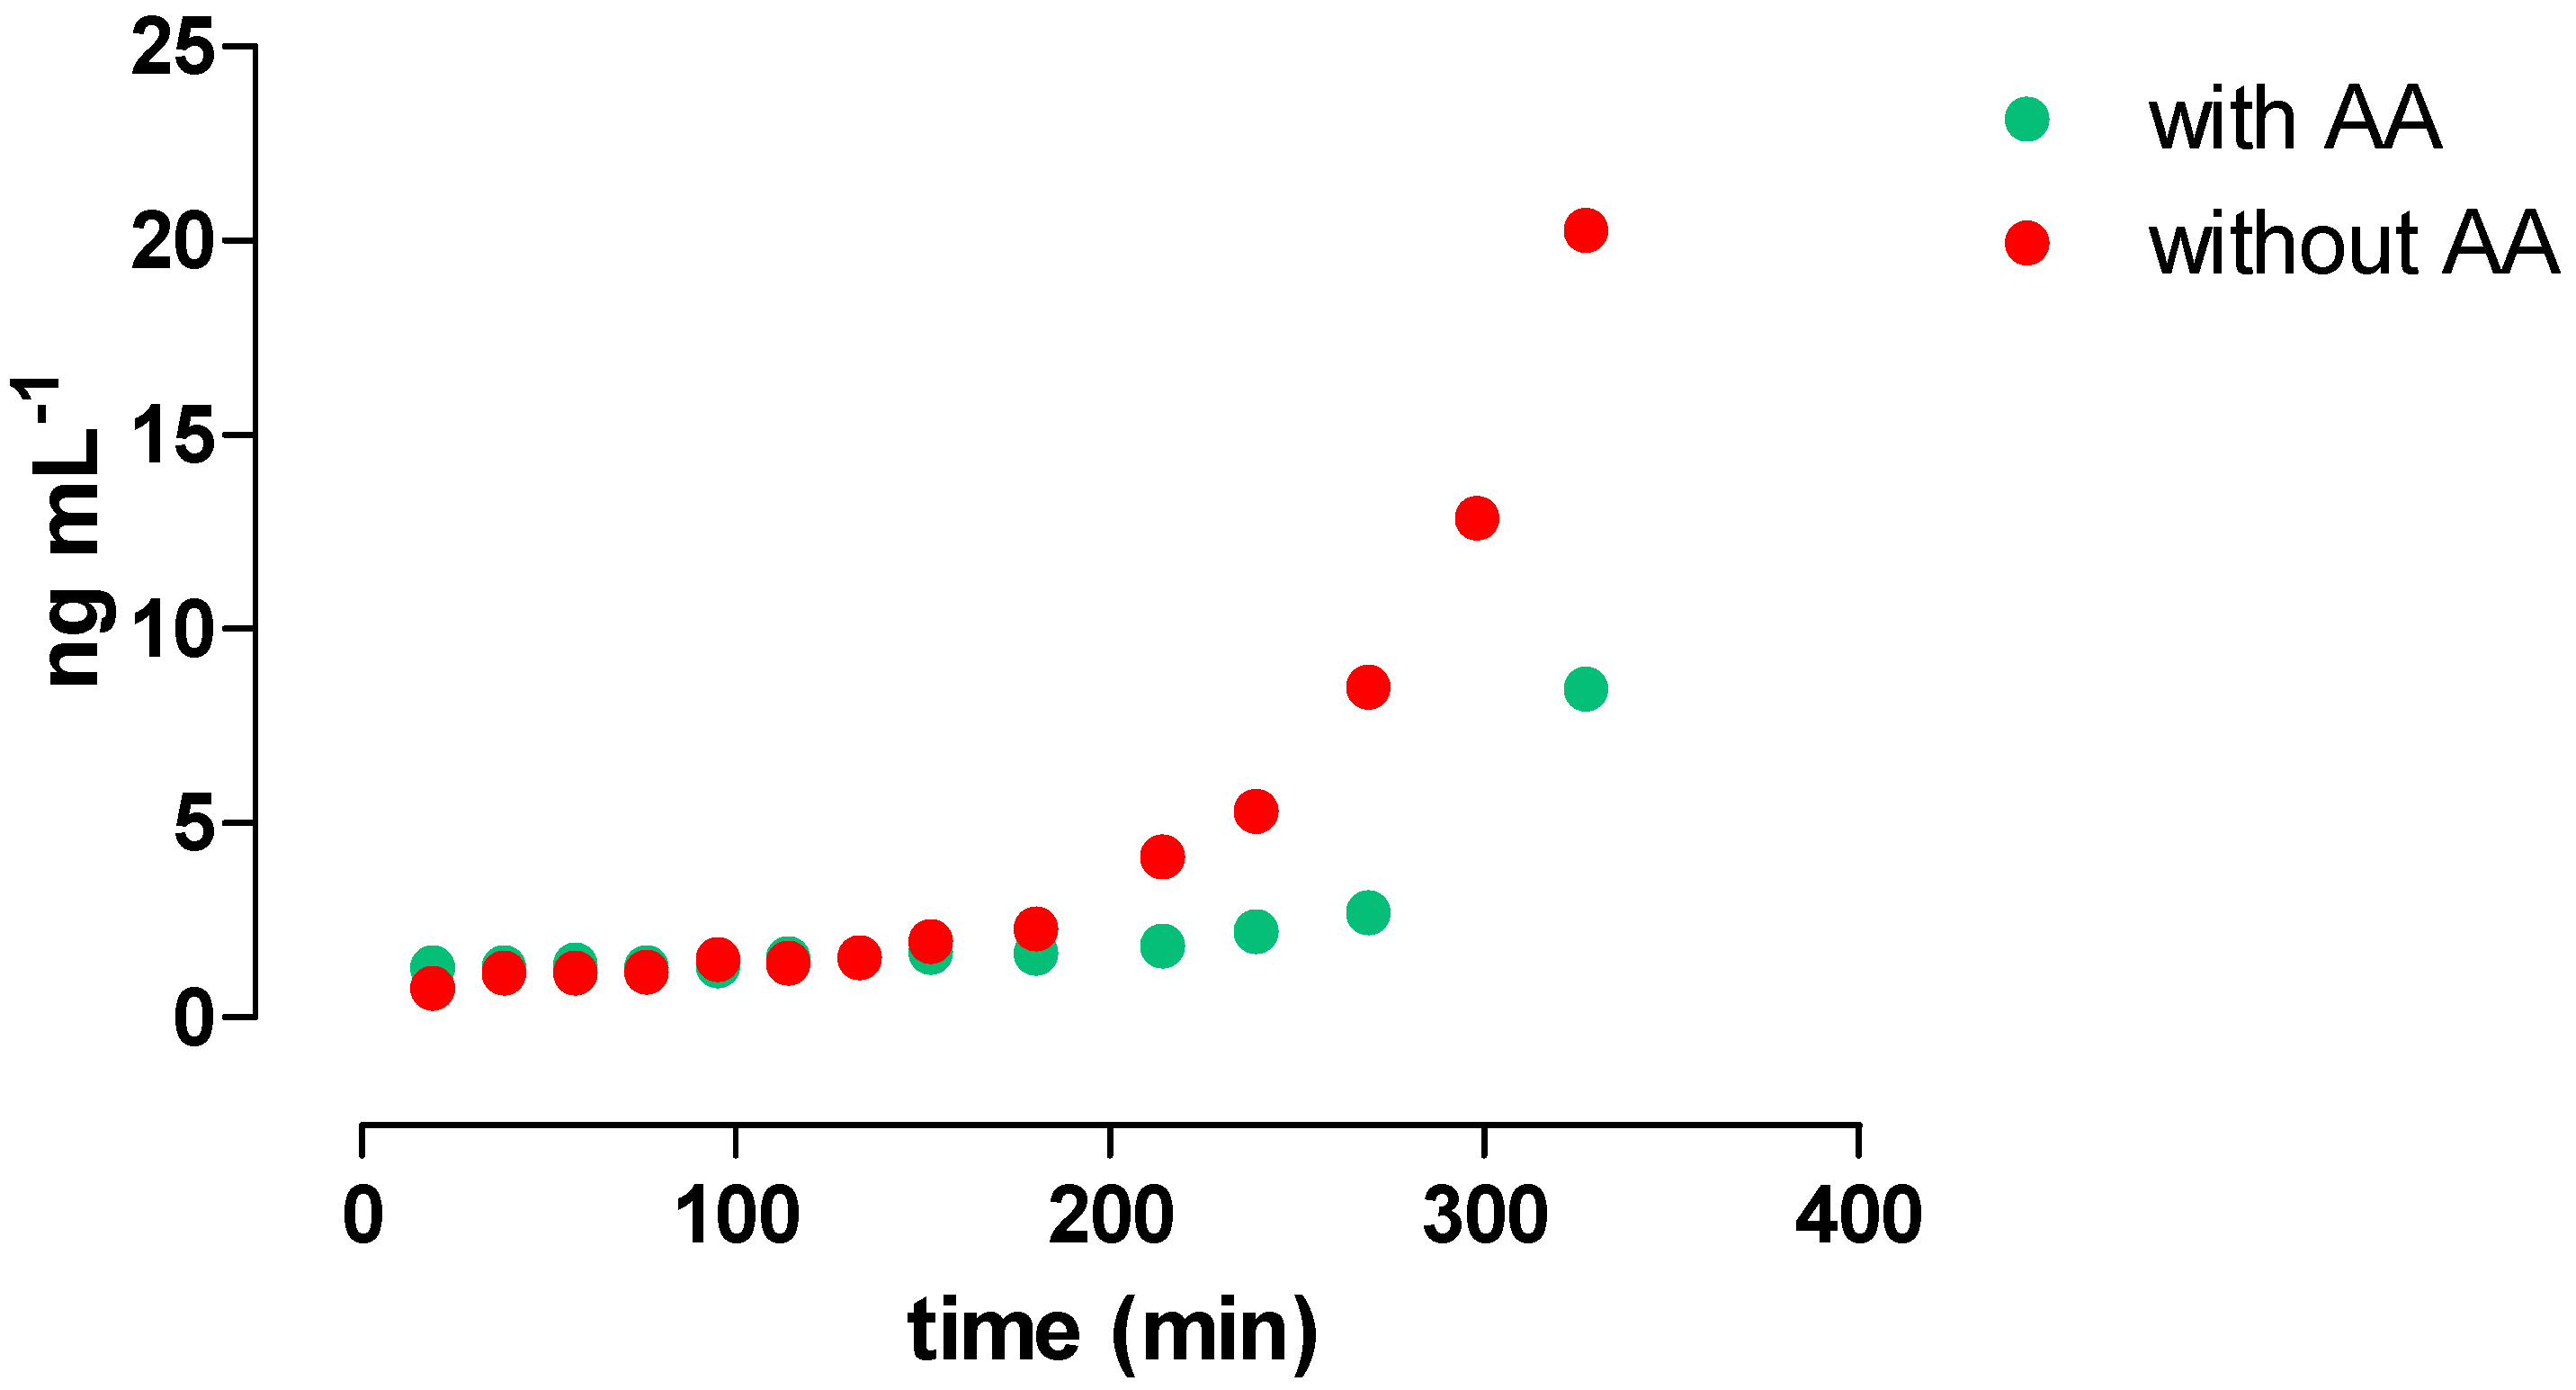
3.4. Monitoring RIF Hydrolysis in Methanol

As a final step in the degradation study, the hydrolysis of RIF in methanol was monitored. In RIF solutions at 0.4 mg mL−1, neither AMP nor MNP were detected after 20 h. To overcome the instability of RIF in aqueous solution, the use of methanol, as described in the FDA method, was confirmed.

3.5. Standard Addition Method for Quantitative Analysis of MNP in RIF

As an alternative approach to the single point analysis (limit test) published by the FDA and to the previously proposed external calibration [6,10,11,12,13], a standard addition method was used for the analysis of MNP in RIF in drug substances. This approach was preferred because all the RIF matrices analyzed contained MNP and the matrix effect cannot be ignored at the RIF concentration used for MNP analysis, which is 30 mg mL−1 in the FDA method and 27 mg mL−1 in recent studies, respectively [11,12,13]. In addition, this approach is more accurate than a limit test to quantify MNP when the concentration of MNP is required rather than simply meeting the 5 ppm limit. Due to an unacceptable tailing for AMP, already mentioned in Section 3.1, the validation was only applied to the analysis of MNP in three working sessions on three different days. Figure 4 shows the MRM–extracted ion chromatograms of the quantitative transitions (Table 1) of MNP and IS in an RIF sample in methanol (10 mg mL−1) spiked with IS only (20 ng mL−1). It corresponds to the first point of the linearity range (Section 2.8.1 and Section 2.8.4).

3.5.1. System Suitability Test
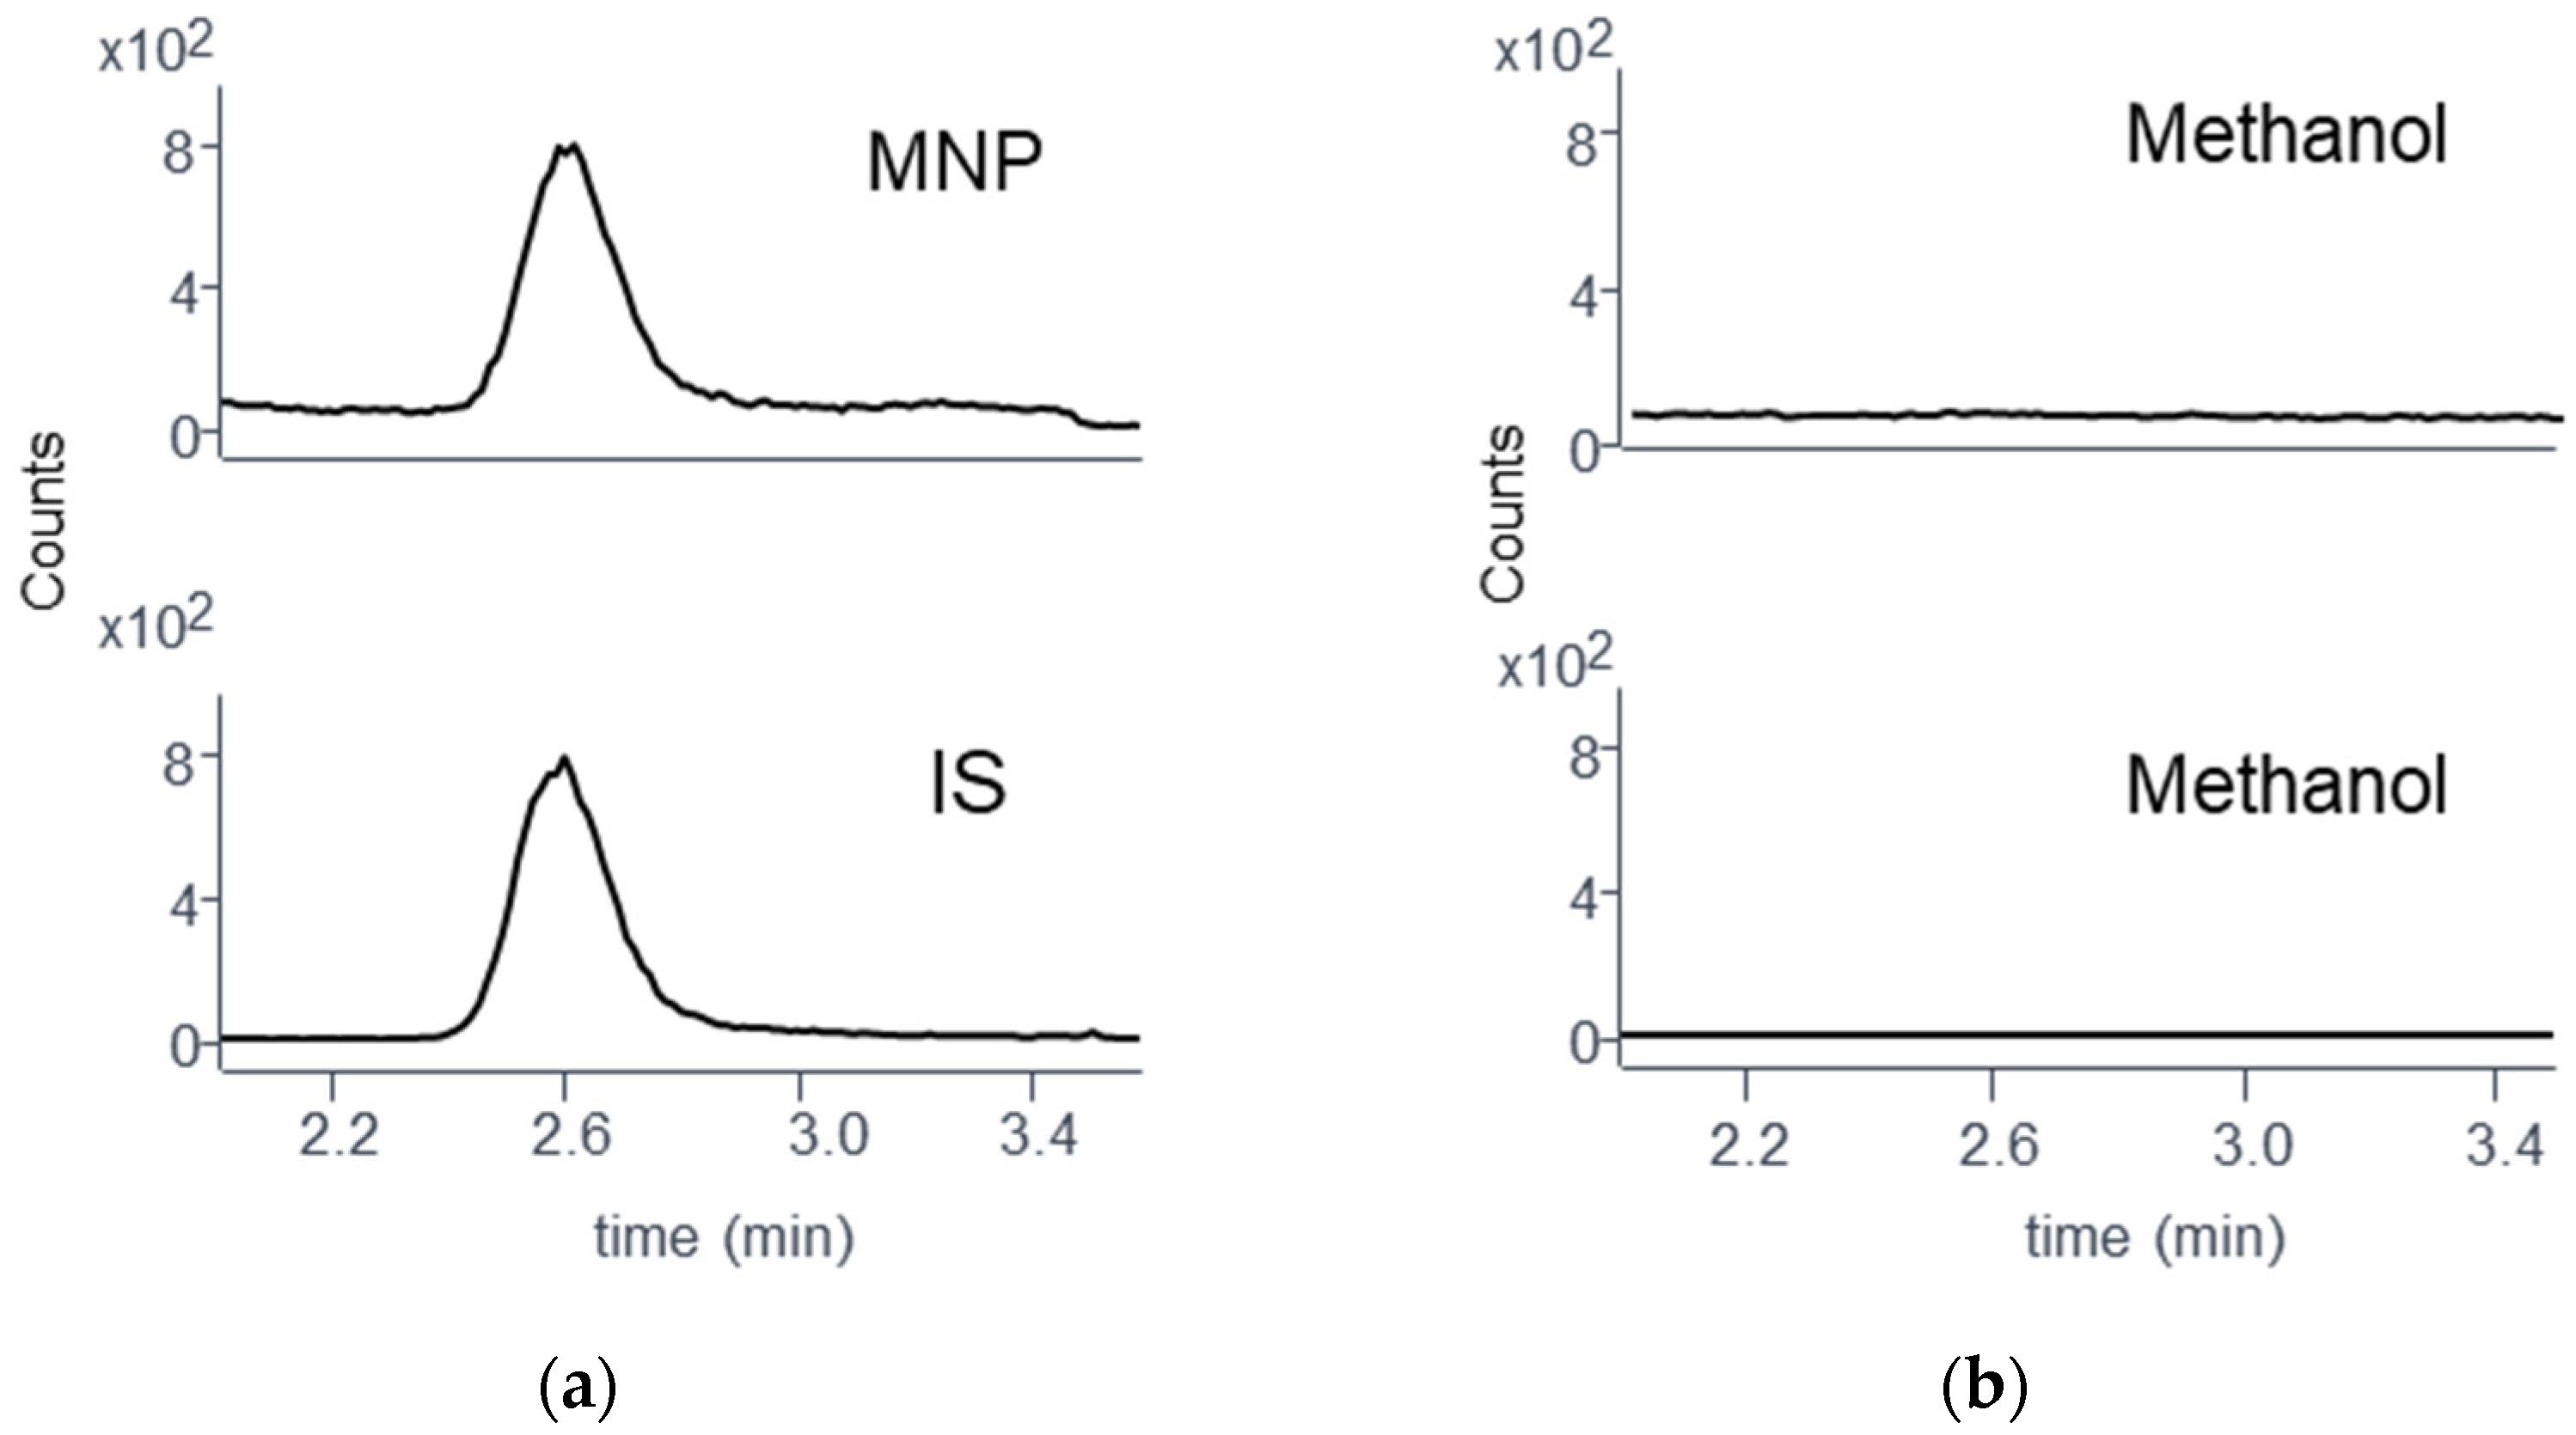
In six repeated injections of a calibration solution at 20 ng mL−1, the RSD% of RT was 0.2% and 0.3% for MNP and IS, respectively; the RSD% of the MNP/IS area was 2.0. The symmetry of both MNP and IS peaks were always in the range of 1.0–1.7.

3.5.2. Specificity

The method was specific as no interfering IS and MNP peaks were detected in blanks; no IS interfering peaks were detected in samples (Figure 5); and in all samples the ratio of quantification/qualification peaks was within the 80–120% ratio observed for quantification/qualification peaks of MNP and IS standards.

3.5.3. Linearity

Calibration equations and correlation coefficients were obtained by linear regression using MassHunter Quantitative Analysis software. The linearity of MNP (six points, Section 2.8.4) spiked in RIF in the range 0–75 ng mL−1, which can be described by the equation y = (0.0435 ± 0.0009)x + (0.8574 ± 0.0346) (r2 = 0.9983). This result was compared (t-test) with the three equations obtained each day in three working sessions (Table 4). The first calibration curve and each of the other nine (8 degrees of freedom) were comparable (t < 2.306). The concentration of the sample calculated as the mean value of nine samples with the four-points equations was 20.3 ng mL−1 (corresponding to 2.0 ppm, see Table 5), whereas the concentration of the same sample calculated with the seven-points equation was 19.7 ng mL−1 (corresponding to 2.0 ppm).

3.5.4. LOQ

The LOQ in methanol calculated from the calibration standard solutions for MNP was 5 ng mL−1 corresponding to 0.5 ppm, well below the 5 ppm limit. The chromatogram of MNP at the LOQ level is shown in Figure 5.

3.5.5. Repeatability and Intermediate Precision

High precision was achieved with this method. The repeatability, expressed as the RSD% of the concentration of nine samples analyzed (pooled RSD%) was 5.3. In Table 5, the precision of each day is reported as the RSD% of the three results (S1, S2, S3).
The intermediate precision, expressed as the RSD% of the concentration of the nine samples analyzed on three different days by two different analysts, was 6.4 (mean value of the nine results was 20.35 ng mL−1, corresponding to 2.0 ppm).

3.6. Comparison of the Two Methods

As shown, the standard addition approach gave very good results for all validation parameters. This is, reasonably, the best approach to quantify MNP in RIF because MNP is always present in the matrix and because the matrix effect is not negligible, although the RIF concentration used in this study was three times lower than previously used [10,11,12,13]. This method will be extended to the analysis of drug products where the matrix effect is usually higher. The disadvantage of this method is that samples must be weighed with high precision (±1 mg). On the other hand, the external calibration method also gave good validation results, although a worse repeatability was observed (see Table 3 and Table 5). Good recovery was obtained with the external calibration method, as shown in Table 3, while it was not calculated with the standard addition method where the analyte concentration was calculated on the sample itself.

4. Conclusions

In this study, a suitable UHPLC-MS/MS method was developed to quantify both AMP and MNP during RIF hydrolysis in buffered aqueous solutions and in methanol. It was shown that (i) in aqueous RIF solutions, the content of AMP and MNP increases with time; (ii) at different pHs, the concentration of AMP increases much faster in acidic than in basic solutions; and (iii) the increase in MNP can be reduced by the addition of AA.
Therefore, to avoid the overestimation of MNP, water should not be used as a diluent in RIF sample preparations.
Appropriate solvents such as methanol can be used to prevent RIF hydrolysis.
An alternative and more accurate method for the quantification of MNP in RIF using a standard addition approach has been developed, validated and applied to the analysis of various APIs. This method used a lower RIF concentration (10 mg mL−1) compared to the FDA method (30 mg mL−1). All samples showed the presence of MNP below 5 ppm.
In addition, due to the instability of RIF and its rapid hydrolysis in an acidic medium, the formation of MNP at low physiological pH should be considered.

Author Contributions

Analysis, A.P., P.R. and D.S.; validation, A.R.; writing—original draft preparation and revision, A.P. and A.R.; supervision, R.C. All authors have read and agreed to the published version of the manuscript.

Funding

This research received no external funding.

Data Availability Statement

Data are contained within the article.

Conflicts of Interest

The authors declare no conflicts of interest.

References

  1. Samet, J.M.; Chiu, W.A.; Cogliano, V.; Jinot, J.; Kriebel, D.; Lunn, R.M.; Beland, F.A.; Bero, L.; Browne, P.; Fritschi, L.; et al. The IARC Monographs: Updated Procedures for Modern and Transparent Evidence Synthesis in Cancer Hazard Identification. J. Natl. Cancer Inst. 2020, 112, 30–37. [Google Scholar] [CrossRef] [PubMed]
  2. Council of Europe. Substances for Pharmaceutical use (2034). In European Pharmacopoeia, 11th ed.; Supplement 11.3; EDQM: Strasbourg, France, 2022; Volume I, pp. 5085–5087. [Google Scholar]
  3. Council of Europe. Pharmaceutical Preparation (2619). In European Pharmacopoeia, 11th ed.; Supplement 11.3; EDQM: Strasbourg, France, 2022; Volume I, pp. 939–941. [Google Scholar]
  4. Nitrosamine impurities. Available online: https://www.ema.europa.eu/en/human-regulatory/post-authorisation/referral-procedures/nitrosamine-impurities#guidance-for-marketing-authorisation-holders-section (accessed on 6 January 2024).
  5. Council of Europe. 2.5.42 N-Nitrosoamines in Active Pharmaceutical Ingredient. In European Pharmacopoeia, 11th ed.; Supplement 11.3; EDQM: Strasbourg, France, 2022; Volume I, pp. 199–203. [Google Scholar]
  6. Wohlfart, J.; Scherf-Clavel, O.; Kinzig, M.; Sörgel, F.; Holzgrabe, U. The nitrosamine contamination of drugs, part 3: Quantification of 4-Methyl-1-nitrosopiperazine in rifampicin capsules by LC-MS/HRMS. J. Pharm. Biomed. Anal. 2021, 203, 114205. [Google Scholar] [CrossRef] [PubMed]
  7. Seydel, J.K. Physico-chemical studies on rifampicin. Antibiot. Chemother. 1970, 16, 380–391. [Google Scholar] [PubMed]
  8. Ratti, B.; Parenti, R.; Toselli, A.; Zerilli, L. Quantitative assay of Rifampicin and its main metabolite 25-desacetylrifampicin in human plasma by reversed-phase high-performance liquid-chromatography. J. Chromatogr. 1981, 225, 526–531. [Google Scholar] [CrossRef] [PubMed]
  9. Pranked, R.; Walters, J.; Parnes, J. Kinetics for degradation of Rifampicin, an azomethine-containing drug which exhibits reversible hydrolysis in acidic solutions. Int. J. Pharm. 1992, 78, 59–67. [Google Scholar] [CrossRef]
  10. U.S. Food & Drug Administration. Liquid Chromatography-High Resolution Mass Spectrometry (LC-ESI-HRMS) Method for the determination of MNP in Rifampin and CPNP in Rifapentine Drug Substance and Drug Product. 2020. Available online: https://www.fda.gov/media/142092/download (accessed on 6 January 2024).
  11. Tao, X.; Tian, Y.; Liu, W.; Yao, S.; Yin, L. Trace Level Quantification of 4-Methyl-1-nitrosopiperazin in Rifampicin Capsules by LC-MS/MS. Front. Chem. 2022, 10, 834124. [Google Scholar] [CrossRef] [PubMed]
  12. Witkowska, A.; Wolczynska, A.; Lis-Cieplak, A.; Stolarczyk, E. Development and Validation of LC-MS/MS Method for the Determination of 1-Methyl-4-Nitrosopiperazine (MNP) in Multicomponent Products with Rifampicin-Analytical Challenges and Degradation Studies. Molecules 2023, 28, 7405. [Google Scholar] [CrossRef] [PubMed]
  13. de Souza, G.; Matos, M.; Aglio, T.; Salles, A.J.; Rath, S. A comprehensive LC-UHPLC-MS/MS method for the monitoring of N-nitrosamines in lipophilic drugs: A case study with rifampicin. J. Pharm. Biomed. Anal. 2023, 236, 115685. [Google Scholar] [CrossRef] [PubMed]
  14. Shishoo, C.; Shah, S.; Rathod, I.; Savale, S.; Kotecha, J.; Shah, P. Stability of rifampicin in dissolution medium in presence of isoniazid. Int. J. Pharm. 1999, 190, 109–123. [Google Scholar] [CrossRef] [PubMed]
  15. Rao, B.S.; Murthy, K.V.R. Development of Dissolution Medium for Rifampicin Sustained Release Formulations. Indian J. Pharm. Sci. 2001, 63, 256–257. [Google Scholar]
Scheme 1. RIF degradation scheme: AMP as an intermediate in MNP formation.
Separations 11 00054 sch001
Figure 1. MRM–extracted chromatograms (ESI+) of quantitative transitions of a standard solution of AMP, MNP (100 ng mL−1) and IS (20 ng mL−1) in methanol. (a) AMP: m/z 116.1 > 99.1; (b) IS: m/z 134.1 > 104.1; (c) MNP: m/z 130.1 > 100.1.
Separations 11 00054 g001
Figure 2. AMP concentration (ng mL-−1) vs. time (min) at 37 °C with AA (3.5 mg mL-−1) in AF (5 mM) at different pHs (4, 6, 8).
Separations 11 00054 g002
Figure 3. MNP concentration (ng mL-−1) vs. time (min) at 37 °C with AA (3.5 mg mL-−1) and without AA in AF (5 mM) at pH = 8.
Separations 11 00054 g003
Figure 4. RIF sample (10 mg mL−1) spiked with IS (20 ng mL−1) in methanol. MRM–extracted ion chromatograms (ESI+) of the quantitative transitions. (a) MNP: m/z 130.1 > 100.1, top panel; IS: m/z 134.1 > 104.1, bottom panel. (b) Methanol: m/z 130.1 > 100.1, top panel; methanol: m/z 134.1 > 104.1, bottom panel.
Separations 11 00054 g004
Figure 5. MNP at LOQ level in methanol. MRM–extracted ion chromatograms (ESI+) of the quantitative transitions. (a) MNP: m/z 130.1 > 100.1, top chromatogram; IS: m/z 134.1 > 104.1, bottom chromatogram. (b) Methanol: m/z 130.1 > 100.1, top chromatogram; m/z 134.1> 104.1, bottom chromatogram.
Separations 11 00054 g005
Table 1. MS/MS parameters: compounds, retention time (RT, min), MRM transitions (SRM1 quantifier, SRM2 qualifier, m/z), fragmentor (Frag, V) and collision energy (CE, V).
CompoundRTSRM1SRM2CE1/CE2Frag
AMP1.22116.1 > 99.1116.1 > 56.24/1776
MNP2.54130.1 > 100.1130.1 > 58.04/1671
IS2.56134.1 > 104.1134.1 > 58.24/2071
Table 2. Calibration curves and correlation coefficient (r2) for AMP (50–10,000 ng mL−1) and MNP (0.5–100 ng mL−1) in AF (pH = 8; 5 mM); AMP and MNP (0.5–100 ng mL−1) in methanol.
AMPMNP
AFy = 1799x + 340,712   r2 = 0.998y = 431x − 68   r² = 0.999
Methanoly = 19,944x + 2249   r2 = 0.999y = 371x − 527   r² = 0.996
Table 3. Recovery and precision of AMP and MNP at the three spiking levels.
Fortification Level (ng mL−1)Recovery%Repeatability
501107
AMP500975
2000956
251198
MNP50977
7510411
Table 4. Slope (amean ± s.d) and intercept (bmean ± s.d) as the mean of the three equations for each day of validation.
Dayameanbmean
10.041 ± 0.0010.870 ± 0.006
20.046 ± 0.0010.941 ± 0.022
30.050 ± 0.0010.964 ± 0.020
Table 5. Concentration (ng mL−1) of the three samples analyzed (S1, S2 and S3) on each day of validation; mean of concentration of the same day (Smean) and RSD% of S1, S2 and S3.
Concentration (ng mL−1)
DayS1S2S3SmeanRSD%
120.6821.3122.2721.423.8
220.0019.2421.6120.286.0
319.7418.0320.2519.346.0
Disclaimer/Publisher’s Note: The statements, opinions and data contained in all publications are solely those of the individual author(s) and contributor(s) and not of MDPI and/or the editor(s). MDPI and/or the editor(s) disclaim responsibility for any injury to people or property resulting from any ideas, methods, instructions or products referred to in the content.

