Abstract
Due to the increasing consumer interest in wines with a controlled place of origin, PGI (Protected Geographical Indication) and PDO (Protected Designation of Origin), the most acute question is how to identify them. One of the most effective ways to confirm the place of origin of wine in global practice is a comprehensive study of the elemental profile using statistical analysis methods. In the period from 2020 to 2023, 152 grape samples of grapes were collected from various wineries in Crimea and Kuban. The grape must that was obtained from them was fermented in laboratory conditions. The elemental profile was determined in the prepared wines, which included 71 indicators. In the conducted work, it was revealed that wines from Crimea and Kuban differ statistically significantly in the concentration of the elements B, Ca, Cu, Mn, Na, Ni, Re, Si, Sn and U. At the same time, the contents of the elements U, Sn and Re prevail in wines from Crimea, and those of B, Ca, Cu, Mn, Na, Ni and Si prevail in wines from Kuban. At the same time, methods of univariate and multivariate statistics do not allow us to reliably classify wine samples from Crimea and Kuban by their place of origin. In order to reveal the non-linear dependence of the studied indicators in wines on the geographical place of grape growing, the method of a supervised learning Random Forest was used. After training the model on the dataset, the proportion of its correct predictions was 96%. The model used 61 parameters, among which the most important were Ni, Re, Ba, Rb, Na, U, Sb, Zn, Bi, Ag and Ti.
1. Introduction
Historically, the production of many food products has been inextricably linked to a specific geographical region. Food products were produced from local raw materials using traditional techniques and marketed locally. Such products were an integral part of people’s culture and everyday life. Today, with all the availability and variety of products, the food industry is experiencing a crisis of confidence. Consumers want to be sure that the products they buy are safe, of high quality and environmentally friendly.
Controlled-origin wines are in high demand among consumers due to their high quality, which is due to the specific soil and climatic conditions in which the grapes are grown, as well as the strictly regulated production technology. At the same time, wines in the PDO and PGI categories are particularly popular in market conditions. Such wines usually have a high value and bring a significant share of profit to producers. In the countries of the European Union, their production is regulated by Commission Regulation (EC) No 607/2009 of 14 July 2009. At the same time, many countries use their national quality marks to classify wines according to their geographical origin [1,2,3,4,5].
The combination of geographical, soil and climatic features of the Black Sea coast provides the necessary conditions for the cultivation of grapes and the production of high-quality wines. At the same time, the largest winemaking zones are Kuban, located on the eastern coast of the Black Sea, and the Crimean Peninsula, located on the northern coast. Kuban is the largest grape- and wine-growing zone of the Russian Federation. The area of vine plantations in this region is about 30 thousand hectares. The wide range of climatic conditions of Kuban determines the complexity of the soil cover. Thus, the largest areas of vineyards in Kuban are located on the Taman Peninsula, where southern chernozem prevails. Smaller areas of vineyards are located in Novorossiysk, Crimean and Gelen-dzhik districts, where sod-carbonate soils prevail. The Crimean Peninsula is unique in its soil and climatic conditions. The main three natural–climatic zones with unique soil–climatic factors have been identified for the cultivation of grape plants: Steppe, Piedmont and South Coastal. These zones include 12 winemaking districts, which makes it possible to produce a wide range of wine products. The soils are predominantly mountainous, brown and non-carbonate [6,7].
Due to the increasing number of cases of substitution of authentic products with wines produced from grapes of other winegrowing regions, the control of the authenticity of the geographical place of origin of wines is an important priority area that contributes to the protection of producers of high-quality products. Typically, methods for confirming the geographical place of origin of wine include the identification of “fingerprints” using instrumental and statistical methods. At present, studies aimed at investigating the elemental profile of wine have become widespread. Most of the mineral elements found in wine make their way into the grape through their absorption by the grape plant from the soils where the grapes are grown, which form the “mineralogical signature” associated with the wine’s terroir. The most effective method of studying the elemental profile of food products, including wines, is the ICP-MC method. This method allows you to measure the mass concentration of more than 70 elements in a sample, and it also has the highest sensitivity compared to other methods [8,9,10,11].
The identification of criteria for the authenticity of the geographical origin of wines is based on obtaining a dataset of various indicators and processing them analytically using various statistical methods. The most common methods of data analysis are analysis of variance (ANOVA), principal component analysis (PCA), linear discriminant analysis (LDA), soft independent modeling of class analogies (SIMCA) and the support vector method (SVM) [2,8,12].
Thus, researchers from Argentina were able to reliably distinguish four geographical regions based on five elements: Ba, As, Pb, Mo and Co [9]. In South African wines, successful classification was achieved in the Stellenbosch region, based on the elements B, Ba, Cs, Cu, Mg, Rb, Sr, Tl and Zn [10]. In Brazilian regions, Rb and Li were the most informative parameters for wine classification [2]. The differentiation of Romanian wines according to their regional origin was based on the following elements: Ni, Ag, Cr, Sr and Zn for the Valea Calugareasca region and Rb, Zn and Mn for the Murfatlar region [11]. More than 50 elements were investigated to establish the geographical origin of wines for three regions in China. The key elements were Ca, Al, Mg, B, Fe, K, Rb, Mn, Na, P, Co, Ga, As and Sr [8]. Using the elemental profile and machine learning techniques, wines were classified into four regions of France (Bordeaux, Burgundy, Languedoc-Rousselon and Rhône) with an accuracy of 98.2%. The most important parameters for the regional traceability of French wines were the elements Mg, Mn, Na, Sr, Ti and Rb [13].
Similar studies have also been conducted in Spain, Croatia, Germany, Chile, Uru-guay, Australia, the USA and other countries [14,15,16,17,18,19,20,21,22,23,24,25,26,27]. Studies of the isotopic characteristics of some metals have shown high efficiency. Studies conducted in Italy, Romania, Portugal, Canada and the USA have shown that analyzing the values of the 87Sr/86Sr, 207Pb/206Pb, 208Pb/206Pb, and 204Pb/206Pb isotope ratios also allows for making reliable conclusions about the belonging of wine to a certain terroir [28,29,30,31,32,33,34,35,36]. However, this research method requires rare and expensive equipment.
Thus, the purpose of this study was to develop a method for classifying wines from the Crimea and Kuban on the basis of their elemental profile data using statistical analysis methods. Studies to determine the geographical place of origin of wine are of interest to researchers in all countries of the world with a developed wine industry. Using various combinations of parameters and methods of statistical processing of results, scientists can identify wines from the studied wine regions with varying degrees of reliability.
2. Materials and Methods
2.1. Research Materials
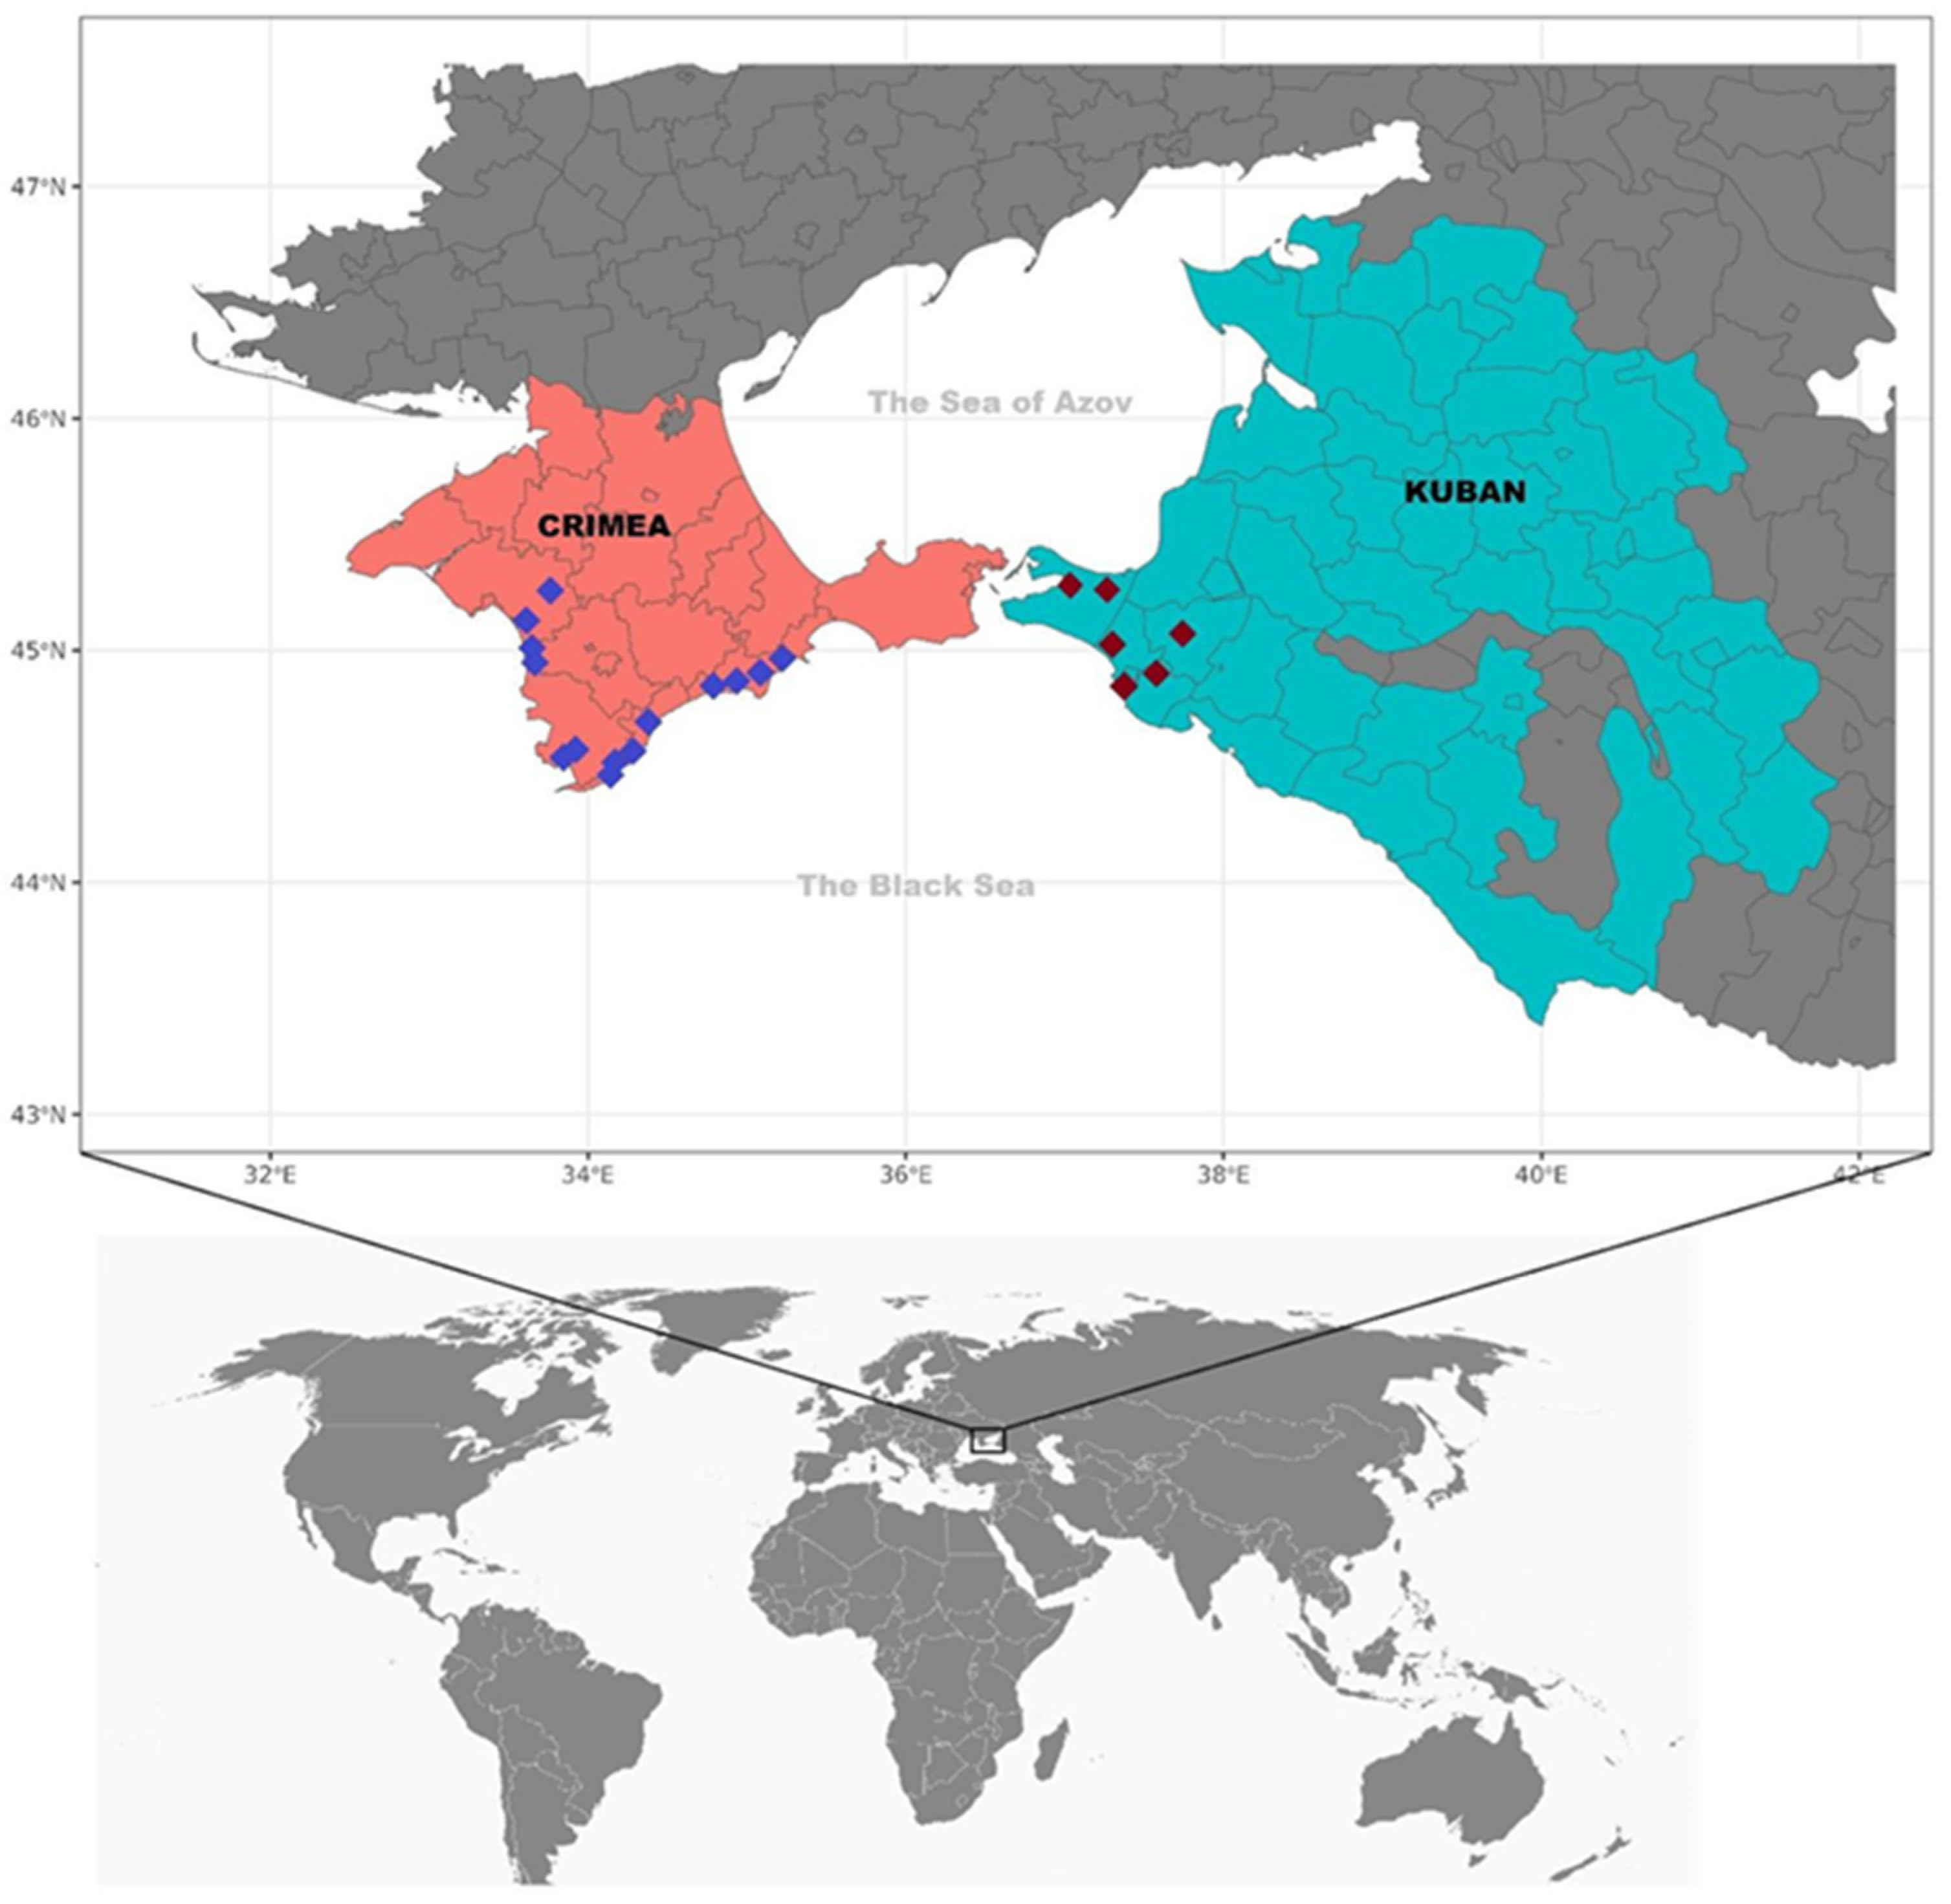
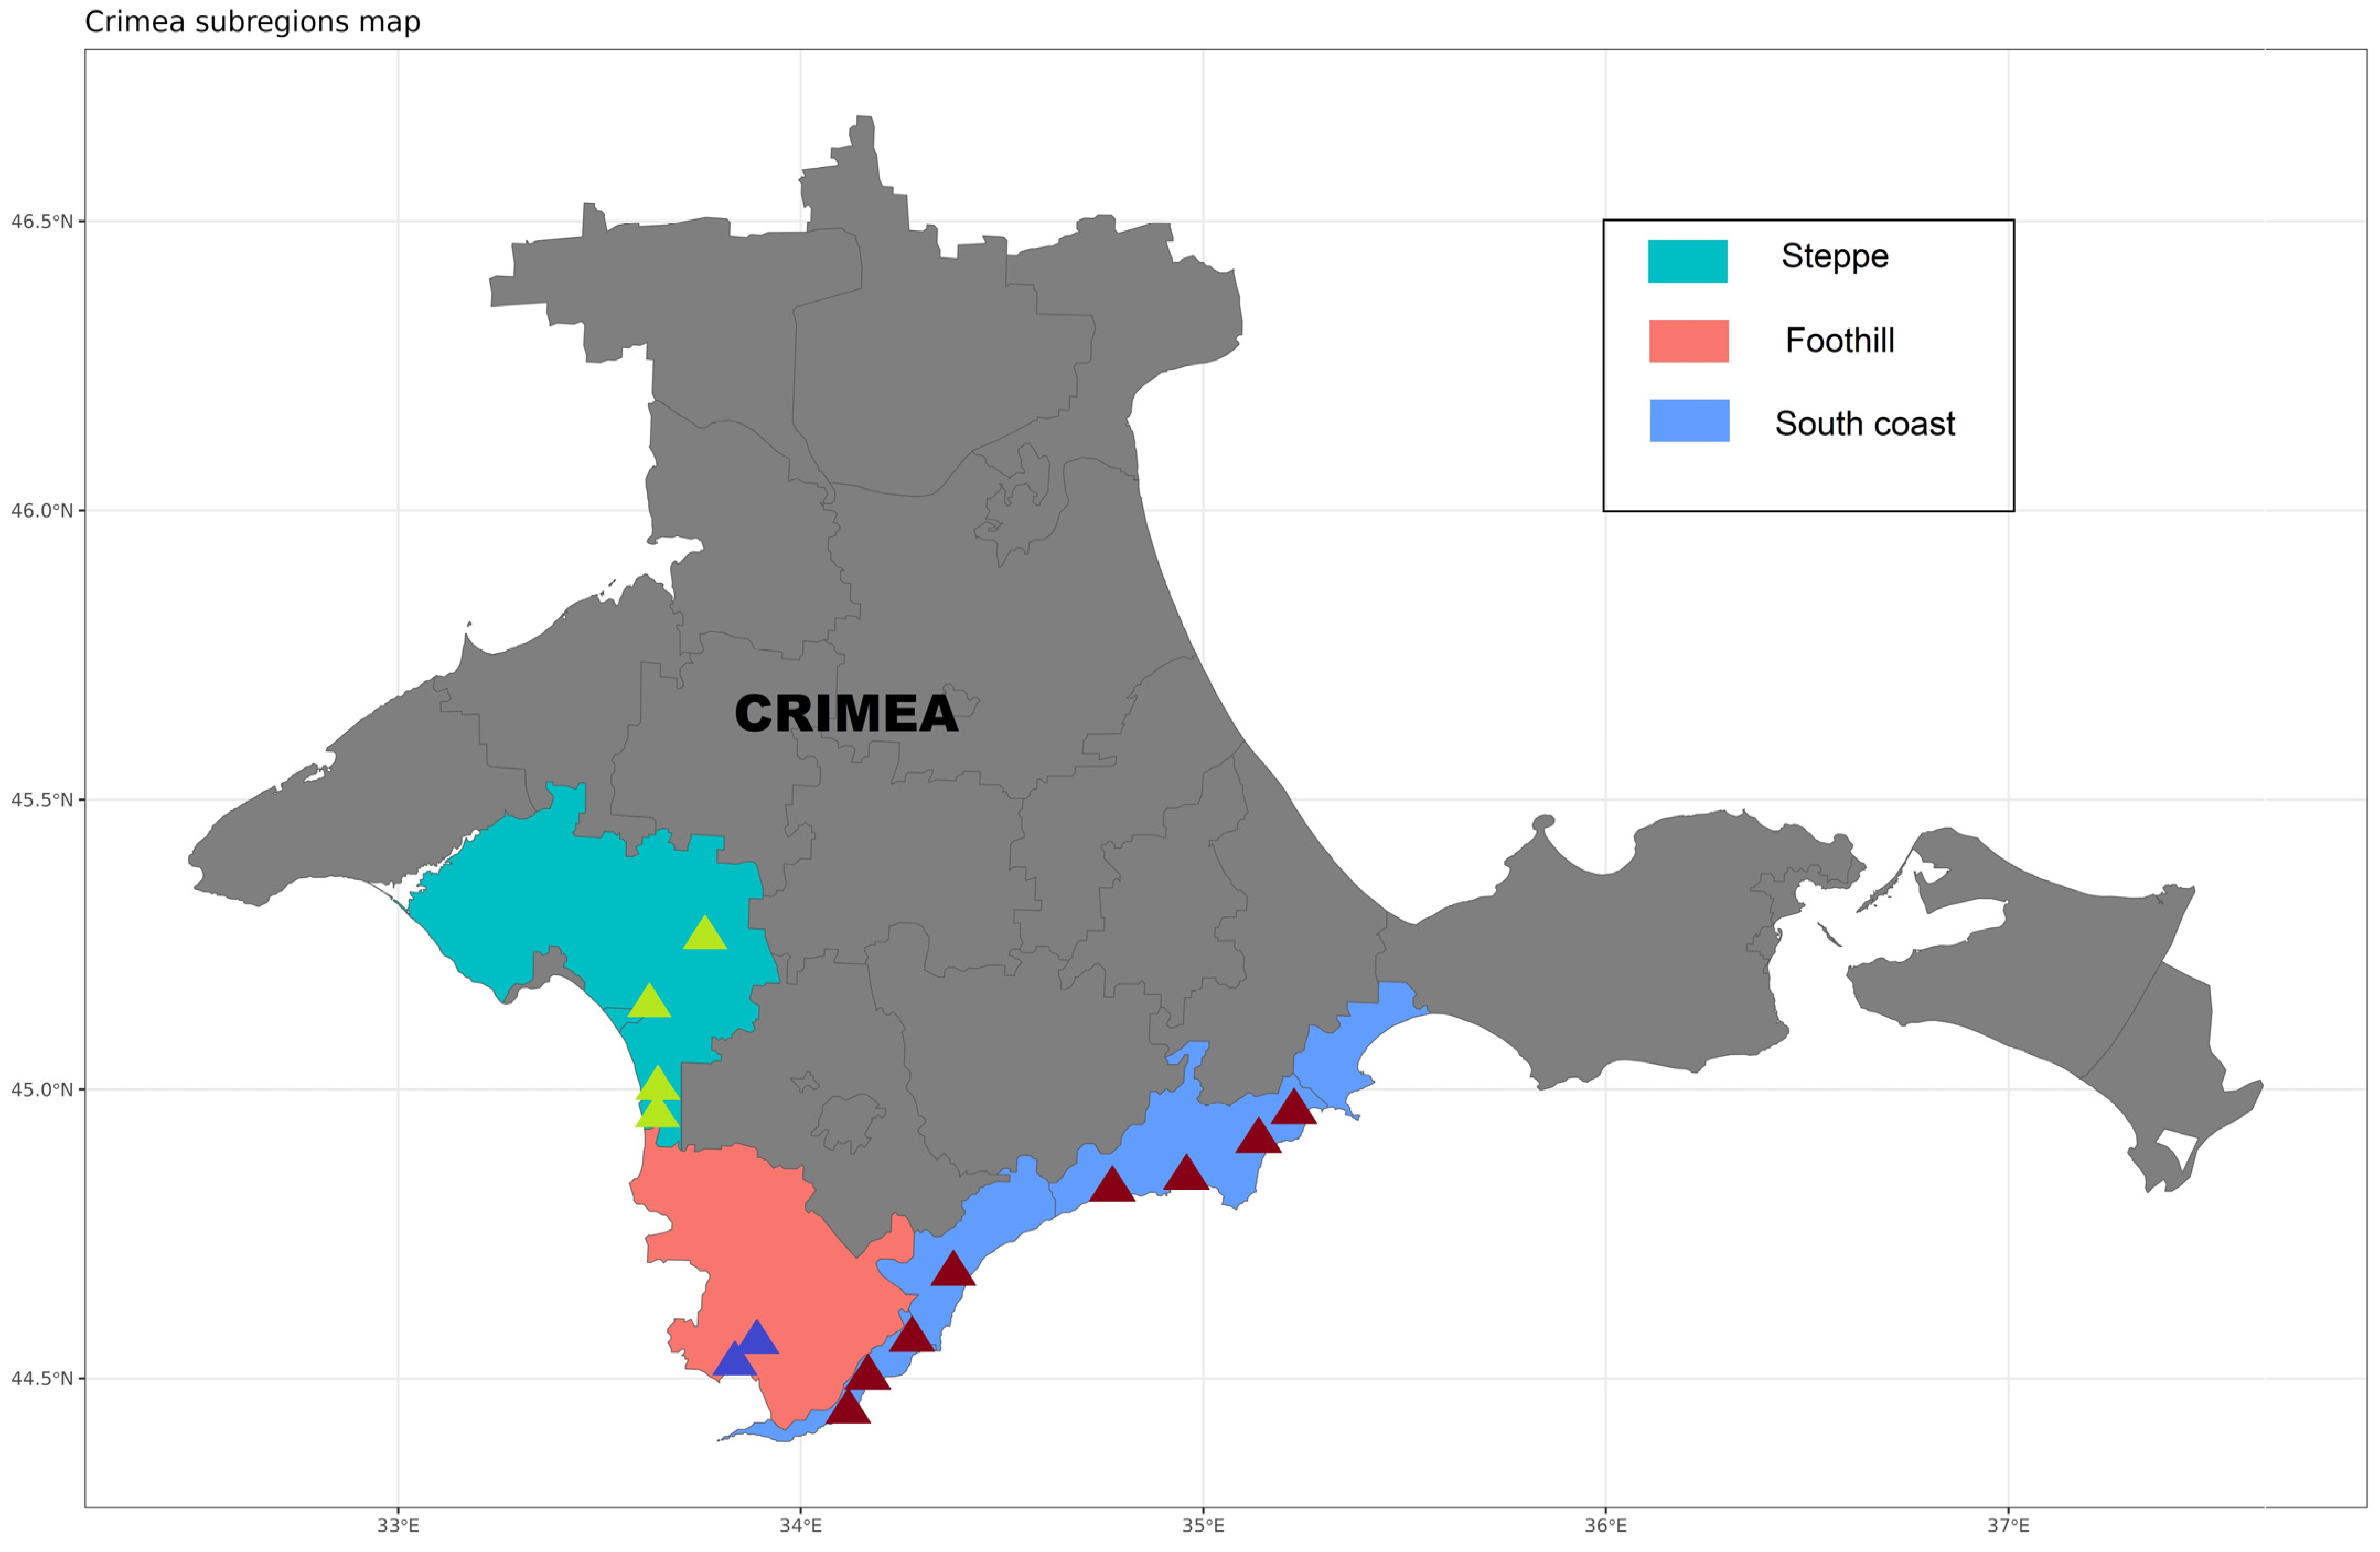
The objects of study were 152 grape samples, based on a representative sample. Grape samples from different wineries in Crimea and Kuban were collected from 2020 to 2023 (Figure 1 and Table 1).
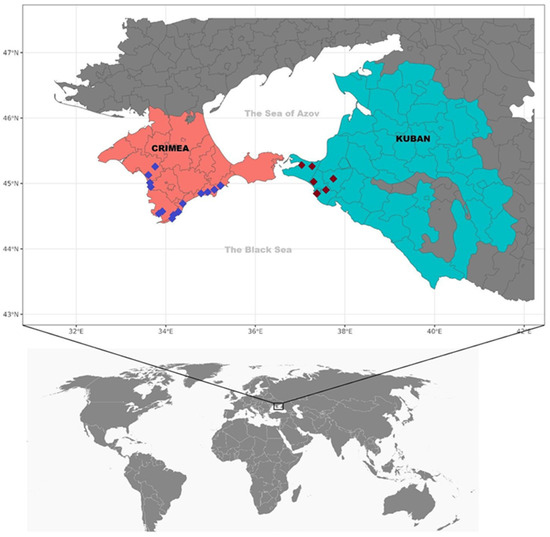
Figure 1.
Geographical zones of grape samples.

Table 1.
Wine samples.
The fermentation of white grape must was carried out in laboratory conditions, and red grape varieties were fermented on pulp. Fermentation was carried out at a temperature of 22 ± 2 °C, using dry wine yeast.
2.2. Research Methods
Elemental analysis was carried out in the obtained wines using ICP-AES and ICP-MS methods. To verify the correctness of the analysis, the results obtained by the two methods were compared for Li, Al, Mn, Cu, Zn, Sr and Ba.
In all cases, the differences in the contents of these elements determined by the two methods did not exceed the permissible errors of the methods. For analysis, 0.2 mL of concentrated HNO3 (Nitric acid 65% Suprapur, Merck) was added to 5 mL of sample and left for 8 h.
2.2.1. Atomic Emission Analysis (ICP-AES)
The contents of Li, B, Na, Mg, Al, Si, P, S, K, Ca, Ti, V, Mn, Fe, Co, Ni, Cu, Zn, Sr and Ba in the samples were determined by inductively coupled plasma atomic emission spectrometry (iCAP-6500, Thermo Scientific, Waltham, MA, USA). The determination was carried out under the following parameters of the spectrometer operation: generator output power—1200 W; reflected power < 5 W; atomizer type—concentric; Ar plasma flow rate—13 L/min; auxiliary Ar flow rate—0.8 L/min; Ar flow rate in the atomizer—0.8 L/min.
The determination of the element content in samples was carried out by a quantitative method using reference solutions containing 0.5 and 10 mg/l of the studied elements. The content of elements in the samples was calculated using the spectrometer software ITEVA. The relative standard deviation for all elements did not exceed 0.2 when measuring the content of these elements up to 5 × [error of determination] and did not exceed 0.1 when measuring the content > 5 × [error of determination].
2.2.2. Mass Spectral Analysis (ICP-MS)
The contents of Li, Be, B, Na, Mg, Al, Si, P, S, K, Ca, Sc, Ti, V, Cr, Mn, Fe, Co, Ni, Cu, Zn, Ga, Ge, As, Se, Br, Rb, Sr, Y, Zr, Mo, Nb, Ru, Rh, Ag, Cd, In, Sn, Sb, Te, Cs, Ba, La, Ce, Pr, Nd, Sm, Eu, Gd, Tb, Dy, Ho, Er, Tm, Yb, Lu, Hf, Ta, W, Re, Os, Ir, Pt, Au, Hg, Tl, Pb, Bi, Th and U were determined by ICPMS (X-7, Thermo Elemental, Waltham, MA, USA). The detector operation mode was dual (pulse-counting and analog); Survey Scan and Peak Jumping mode; concentric atomizer—Poly-Con; atomizing chamber—quartz, cooled (3 °C). The following settings were used: plasma Ar flow rate—13 L/min; auxiliary Ar flow rate—0.9 L/min; atomizer Ar flow rate—0.89 L/min; resolution—0.8 M. Determination of elements in samples was carried out by a quantitative method using reference solutions containing from 1 to 500 µg/L of the elements to be determined.
2.2.3. Statistical Methods of Analysis
Principal component analysis (PCA) with prescaling of the data was used to visualize the data. PCA allows a multivariate dataset to be displayed on a plane, keeping the distribution of observations partially reflecting the original multivariate distribution. The Shapiro–Wilk test (critical significance level = 0.05) was used to test for normality of the distribution. Due to the non-normal distribution of the data, the Mann–Whitney test was used to compare element concentrations between the two groups (critical significance level = 0.05). Correction for multiple comparisons was performed using the Benjamini–Hochberg correction (FDR = 5%). When comparing more than two groups, the Kraskell–Wallis test was used with a posteriori comparison using Dunn’s test with Bonferroni correction (FWER = 5%). Correction for multiple comparisons was also performed using the Benjamini–Hochberg correction (FDR = 5%).
Statistical analysis of the data was performed using the R 4.3.2 programming language and the libraries ggpubr 0.6.0, modelr 0.1.11, kableExtra 1.3.4.9000, Hmisc 5.1-0, gtsummary 1.7. 2, rstatix 0.7.2, broom 1.0.5, scales 1.2.1, plyr 1.8.8, factoextra 1.0.7, readxl 1.4.3, reshape_0.8.9, psych 2.3.6, lubridate 1. 9.2, forcats 1.0.0, stringr 1.5.0, dplyr 1.1.2, purrr 1.0.2, readr 2.1.4, tidyr 1.3.0, tibble 3.2.1, and tidyverse 2.0.0.
The libraries used for visualization were ggplot2 3.4.3 and ggbiplot 0.55 in R and the matplotlib 3.8.0 and seaborn 0.12.2 libraries from the Python programming language version 3.10.0.
A Random Forest model was created to classify wines according to their geographical origin. It is a supervised model that is capable of predicting the class of observations (region of origin) from the predictors (element concentrations) after training.
The model is based on an ensemble of simpler decision tree models, whose prediction results are combined to produce a more correct estimate. Before loading the data into the model, the data underwent scaling. For training, the data were split with stratification by region into training and test datasets. The first model was trained on 2020 and 2022 data subsets only. The second model was trained on all years in the dataset. A number of models with different combinations of hyperparameters were trained, among which the model with the highest accuracy was selected using grid search with cross-validation. The optimal hyperparameters were searched, and the model was built using the sklearn 1.3.0 library. Then, the contribution of each parameter to the prediction of the class of observations was evaluated and visualized using the SHAP (SHapley Additive exPlanations) method. The shap 0.42.1 library was used for this purpose.
3. Results and Discussion
3.1. Comparative Study of Elemental Profile of Wine Samples from Crimea and Kuban
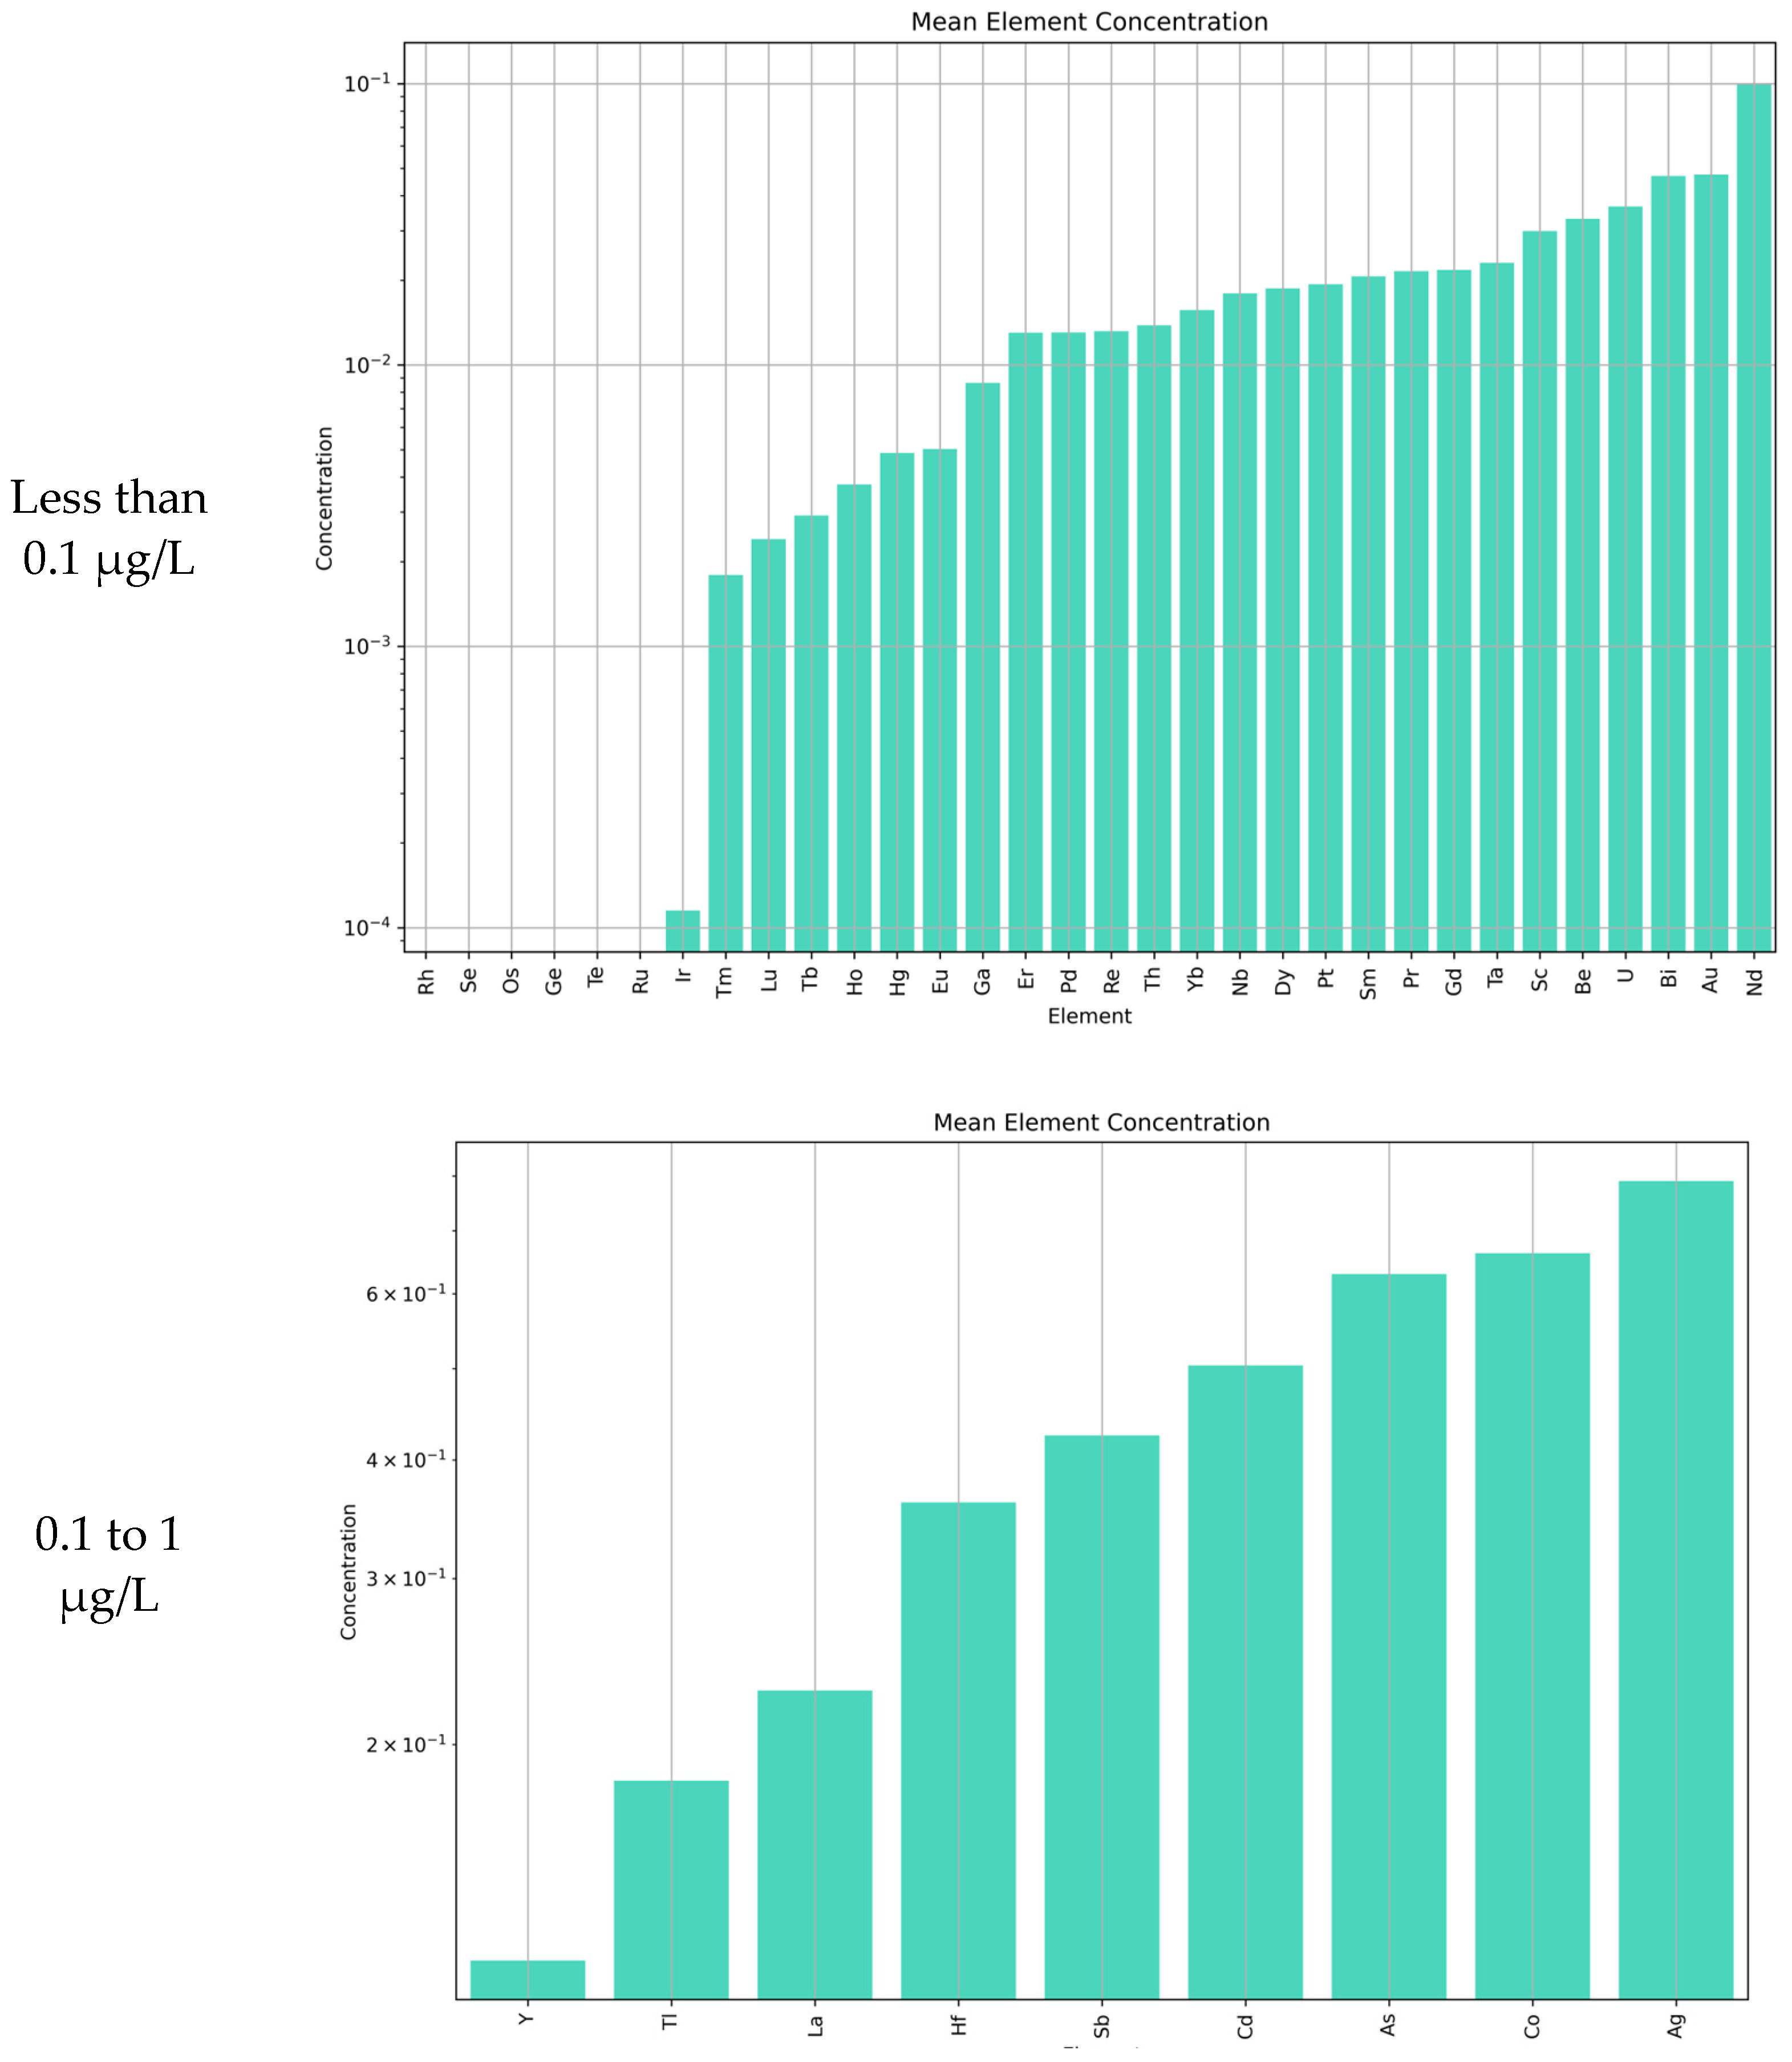
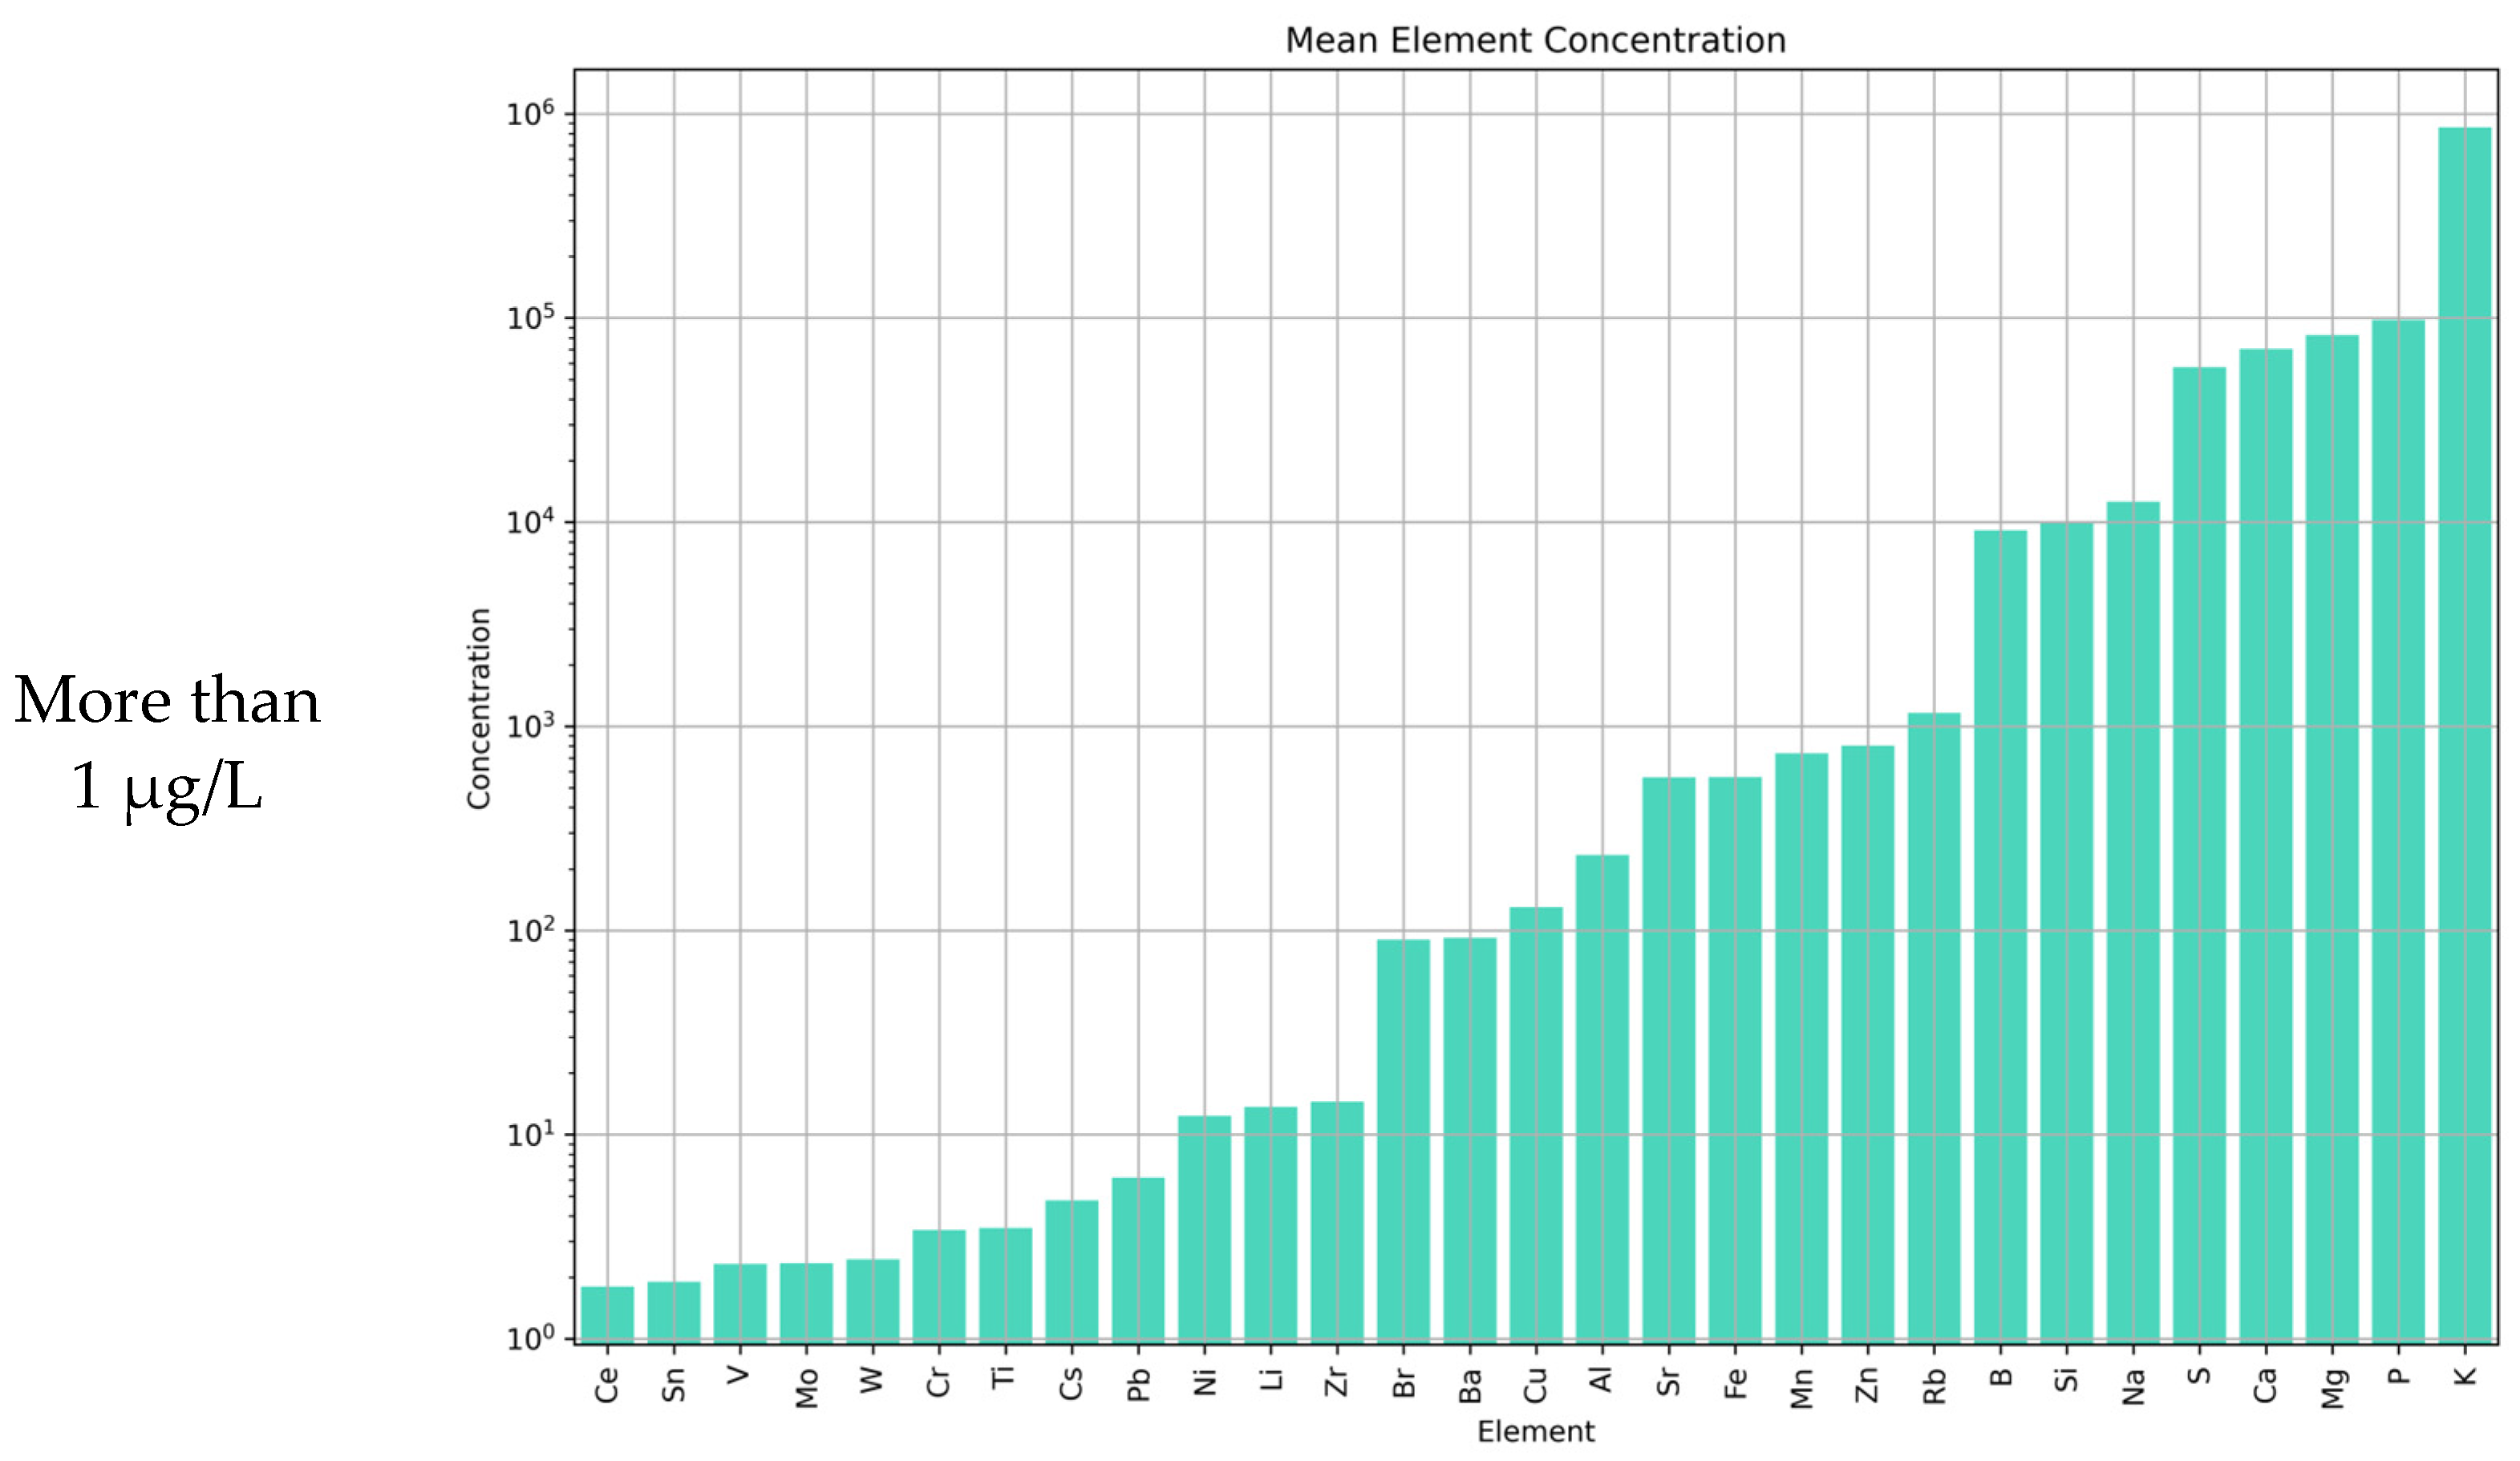
Between 2020 and 2023, 152 samples of fresh grapes from different farms on the Black Sea coast were collected during the grape harvesting and processing season (Supplementary Materials). Of these, 47 samples were collected in Kuban, and 105 samples were collected in Crimea. The elemental profile was determined in the obtained samples, which included 71 indicators of the mass concentrations of elements. Ranking of elements by their average concentration was carried out (Figure 2).
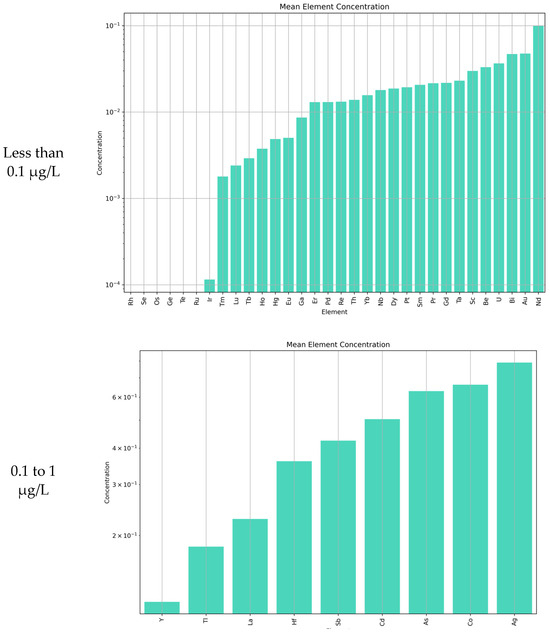
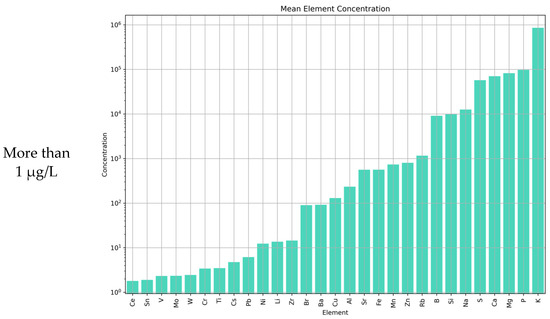
Figure 2.
Ranking of elements by their average concentration.
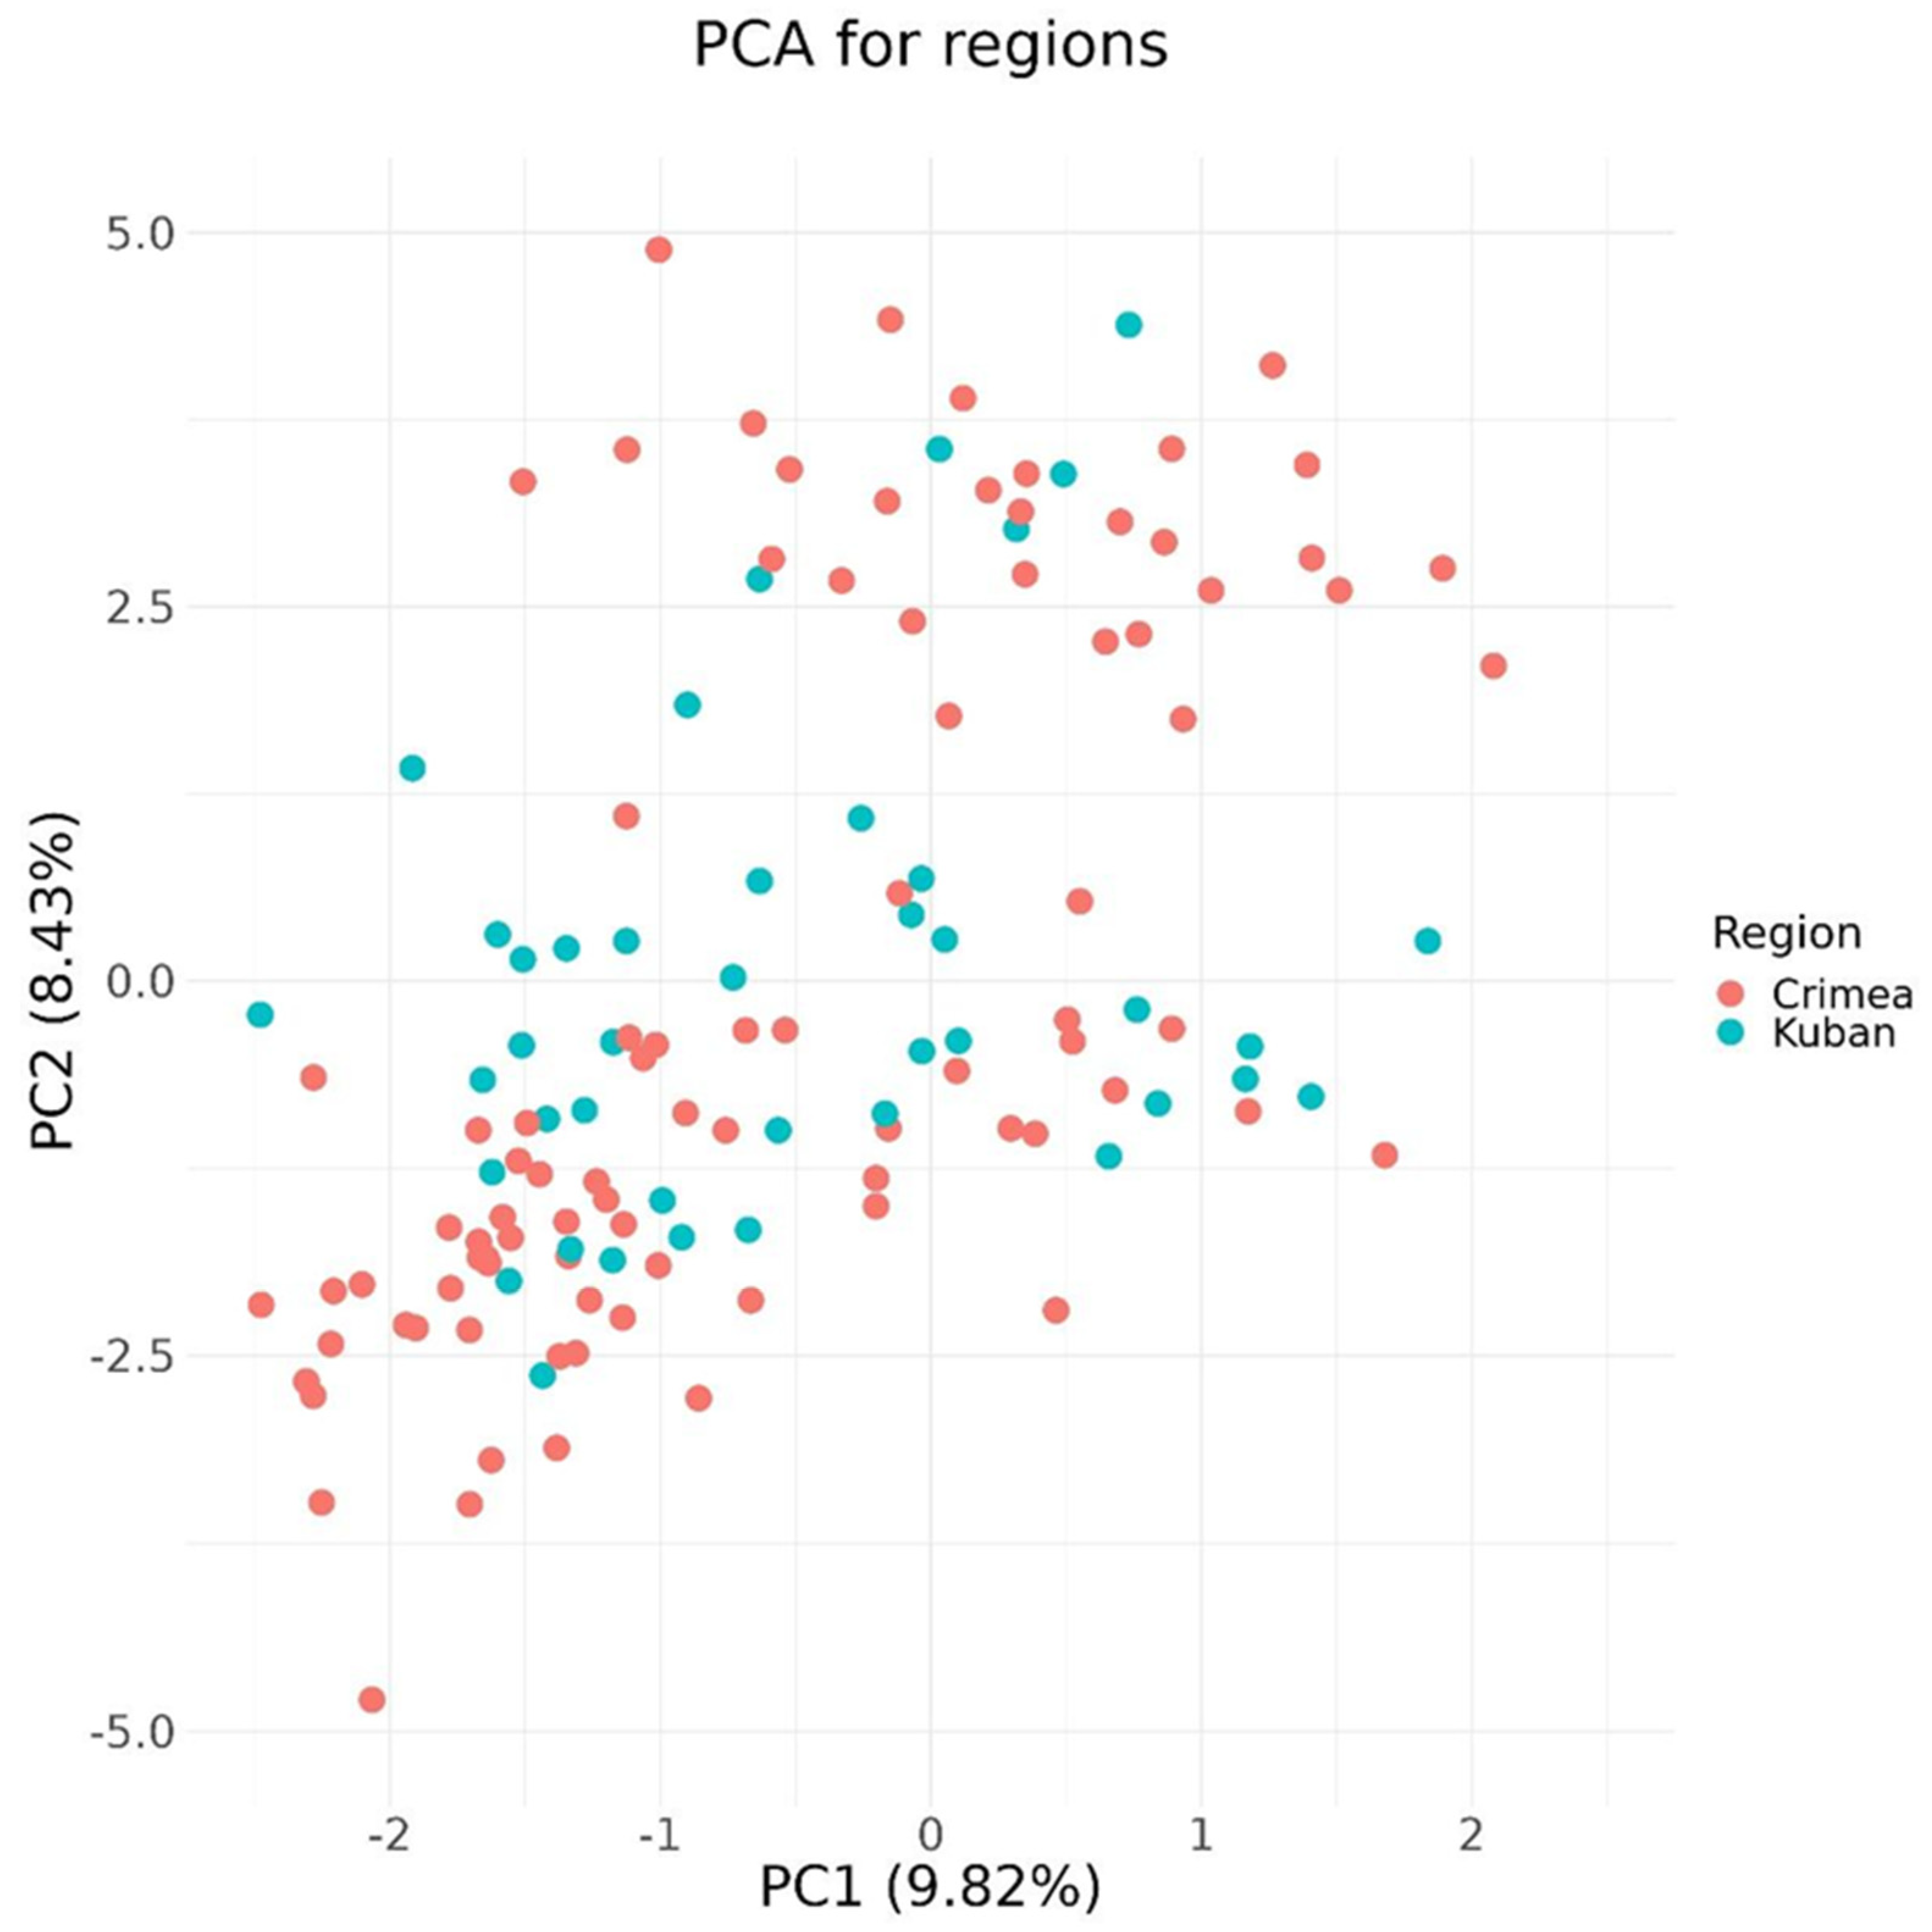
This distribution of elements is typical and is in agreement with data from the literature [21]. The principal component analysis (PCA) method was used to visualize the obtained dataset (Figure 3).
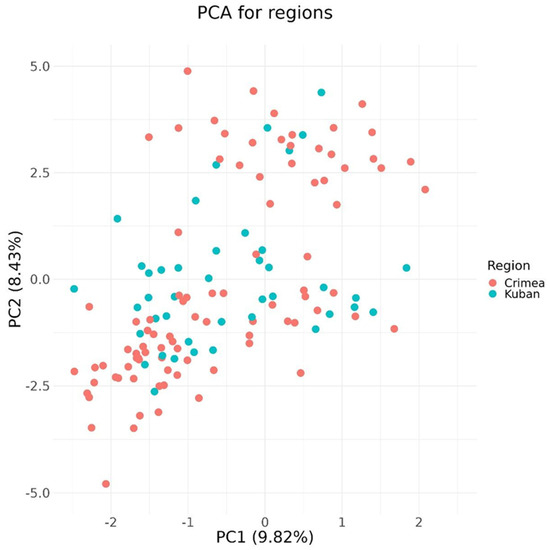
Figure 3.
PCA diagram of samples.
Figure 3 shows the distribution of samples in the feature space after clustering in two dimensions by the PCA method. The diagram shows that samples from different geographical areas (Crimea and Kuban) are predominantly clustered together. At the same time, some samples from Crimea are localized separately, which may indicate the presence of differences in the values of the parameters of some groups of samples. A rather small share of explained variance of the principal components should be noted. Thus, the PCA method in this case does not allow us to sufficiently describe the structure of the data and reliably classify the samples by geographical areas.
The data were analyzed to identify statistically significant differences in the values of the studied parameters between samples from different geographical areas. The Mann–Whitney test with Benjamini–Hochberg multiple comparison correction was used to identify significantly different elements between two geographical regions. In this regard, the Mann–Whitney test was used. The multiplicity of measurements was also corrected using the Benjamini–Hochberg correction. Ten elements were identified whose contents differ statistically significantly in the two winemaking zones. The statistics of the identified parameters are presented in Table 2.

Table 2.
Basic statistical data on the concentrations of the identified elements in wine samples (N = 152) [µg/L].
Thus, statistically significant differences in the mass concentrations of the elements B, Ca, Cu, Cu, Mn, Na, Ni, Re, Si, Sn and U were revealed for wine produced in Kuban and in Crimea. At the same time, the contents of the elements U, Sn and Re prevailed in wines from Crimea (and for the parameter U, emissions played a significant role), and the contents of the elements B, Ca, Cu, Cu, Mn, Na, Ni and Si prevailed in wines from Kuban.
It is worth noting that the mass concentration of some identified elements can undergo significant changes as a result of various technological operations. The transition of Ca, Mn, Ni and Cu from berry to wine is accompanied by a decrease in concentrations, as the highest concentrations of these elements are found in grape seeds and skin, which are removed during must separation. The decrease in the content of elements such as Ca and Cu in wines is caused by precipitation in the form of tartrates and oxalates. Cu, when interacting with phenolic substances and proteins, forms tannates or tannin–protein compounds that are difficult to dissolve and precipitate. A part of mineral substances is used by yeast in the process of life activity and are removed together with the yeast sediment [37,38]. At the same time, in a number of scientific works, the mass concentrations of the elements B, Ca, Cu, Mn, Ni, Na and U were found to be important in the classification of wines from different regions of South Africa, Romania, China, Spain and others [8,10,11,13,14].
3.2. Comparative Study of Elemental Profile of Wine Samples from Different Soil and Climatic Zones of Crimea
As was mentioned earlier, the winemaking regions of Crimea are located within the boundaries of three different climatic zones with unique soil conditions (south coastal, foothill and steppe). In this regard, it was of interest to compare the elemental composition of wines from different zones of Crimea (Figure 4).
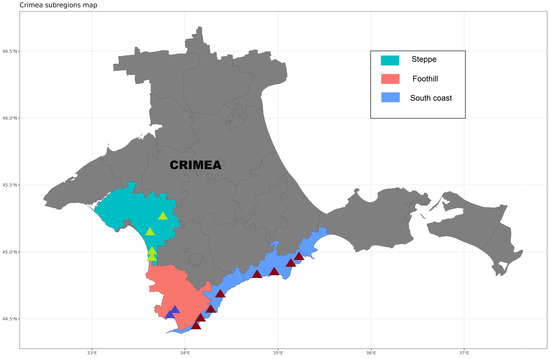
Figure 4.
Soil–climatic zones of Crimean samples.
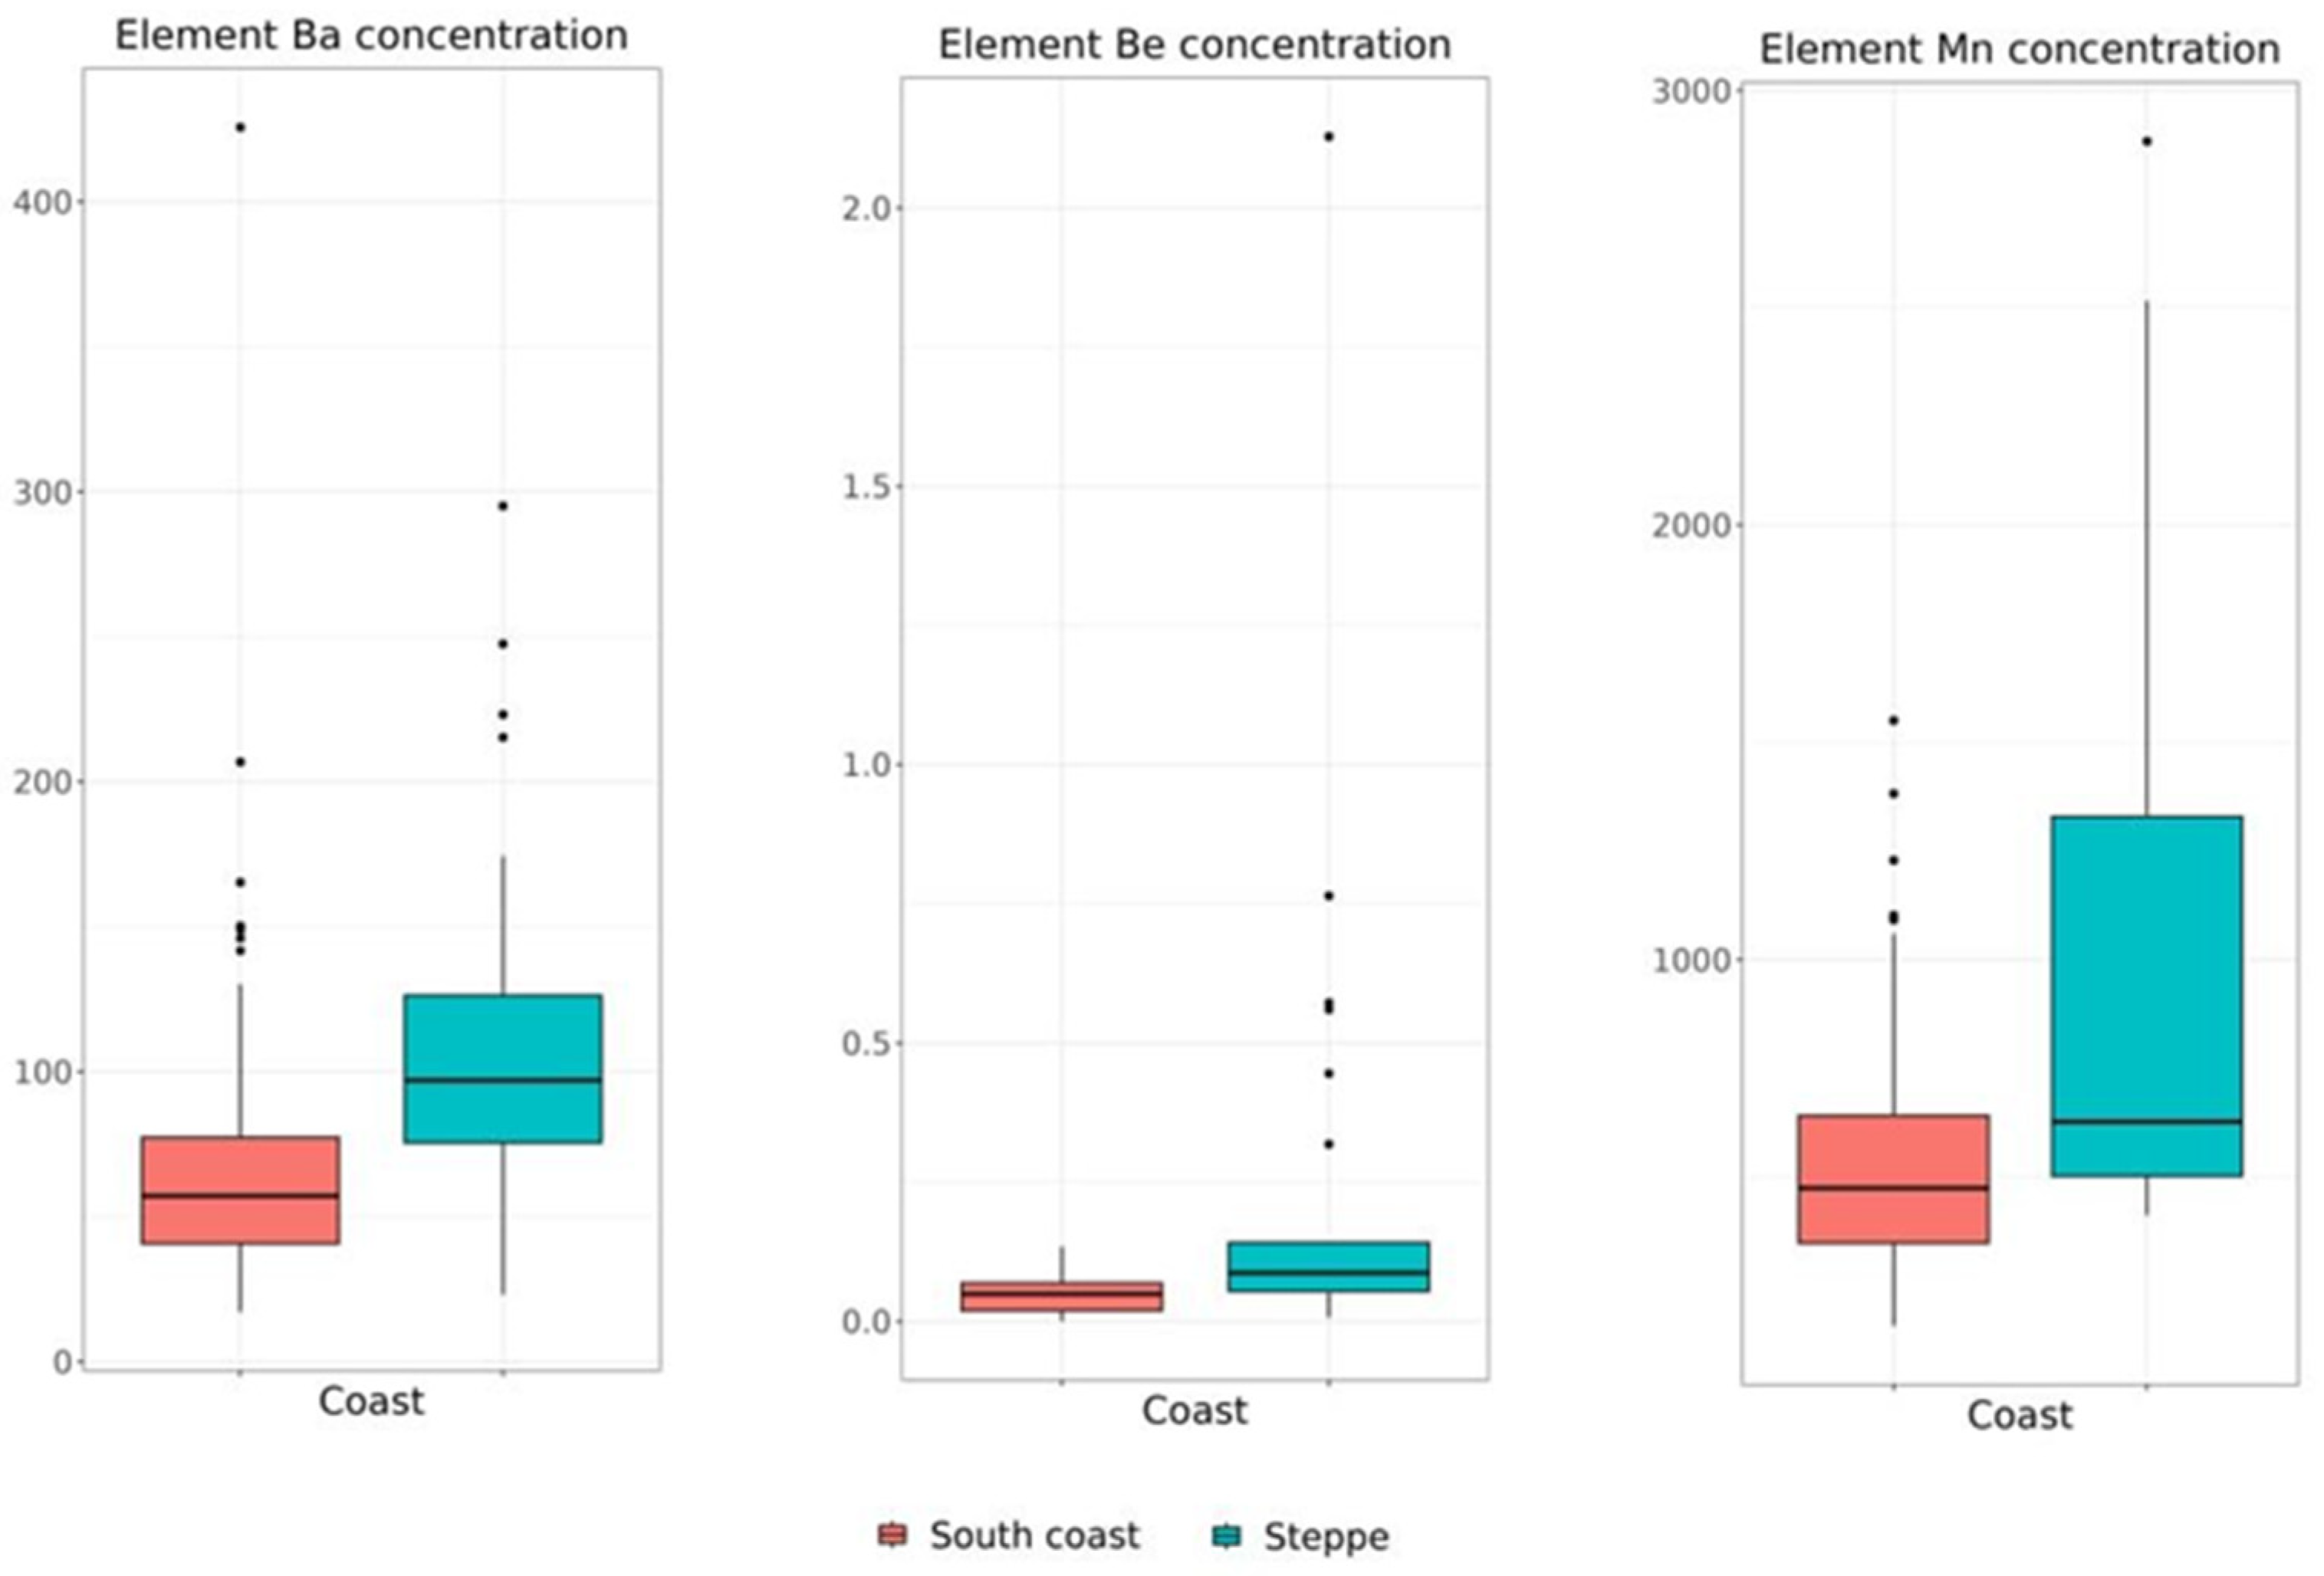
To identify statistically significant differences in the values between the samples, we used the Kraskell–Wallis test with a posteriori comparison using Dunn’s test with Bonferroni correction (FWER = 5%). It was revealed that samples from the foothill zone have no statistically significant differences in the values of the studied indicators with samples from other climatic zones. At the same time, the samples from the steppe and south coastal zones showed statistically significant differences in their concentrations of the elements Ba, Be and Mn. The results are presented in the form of a BoxPlot diagram in Figure 5.
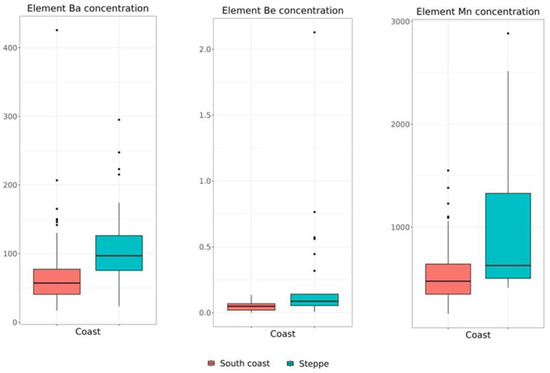
Figure 5.
Mass concentration of statistically significant elements in wine samples, µg/L.
The figure shows that wine samples from the steppe zone of Crimea have higher contents of the elements Ba, Be and Mn compared to samples from the south coastal zone. Despite the different soil and climatic conditions of the studied zones, the elemental profiles of the three wine samples have a similar character of element distribution. On the one hand, such a distribution of elements will significantly complicate the possibility of classifying wines from different regions of Crimea. On the other hand, it contributes to the identification of Crimean wines using fingerprinting.
3.3. Comparative Study of Elemental Profile of Wine Samples from Different Vintage Years
The grape plant primarily extracts mobile forms of elements from the soil, which on average make up about half of their total content. However, for some elements, this ratio can vary considerably. In addition, the diffusive movement in the soil is very slow, and as a result, zones of depletion may form around the roots [39]. Thus, the qualitative and quantitative composition of trace elements and rare earth metals in grape berries and subsequently in wine may tend to change over time. In this regard, it was of interest to study the changes in the elemental profile of wines produced from grapes of different harvest years.
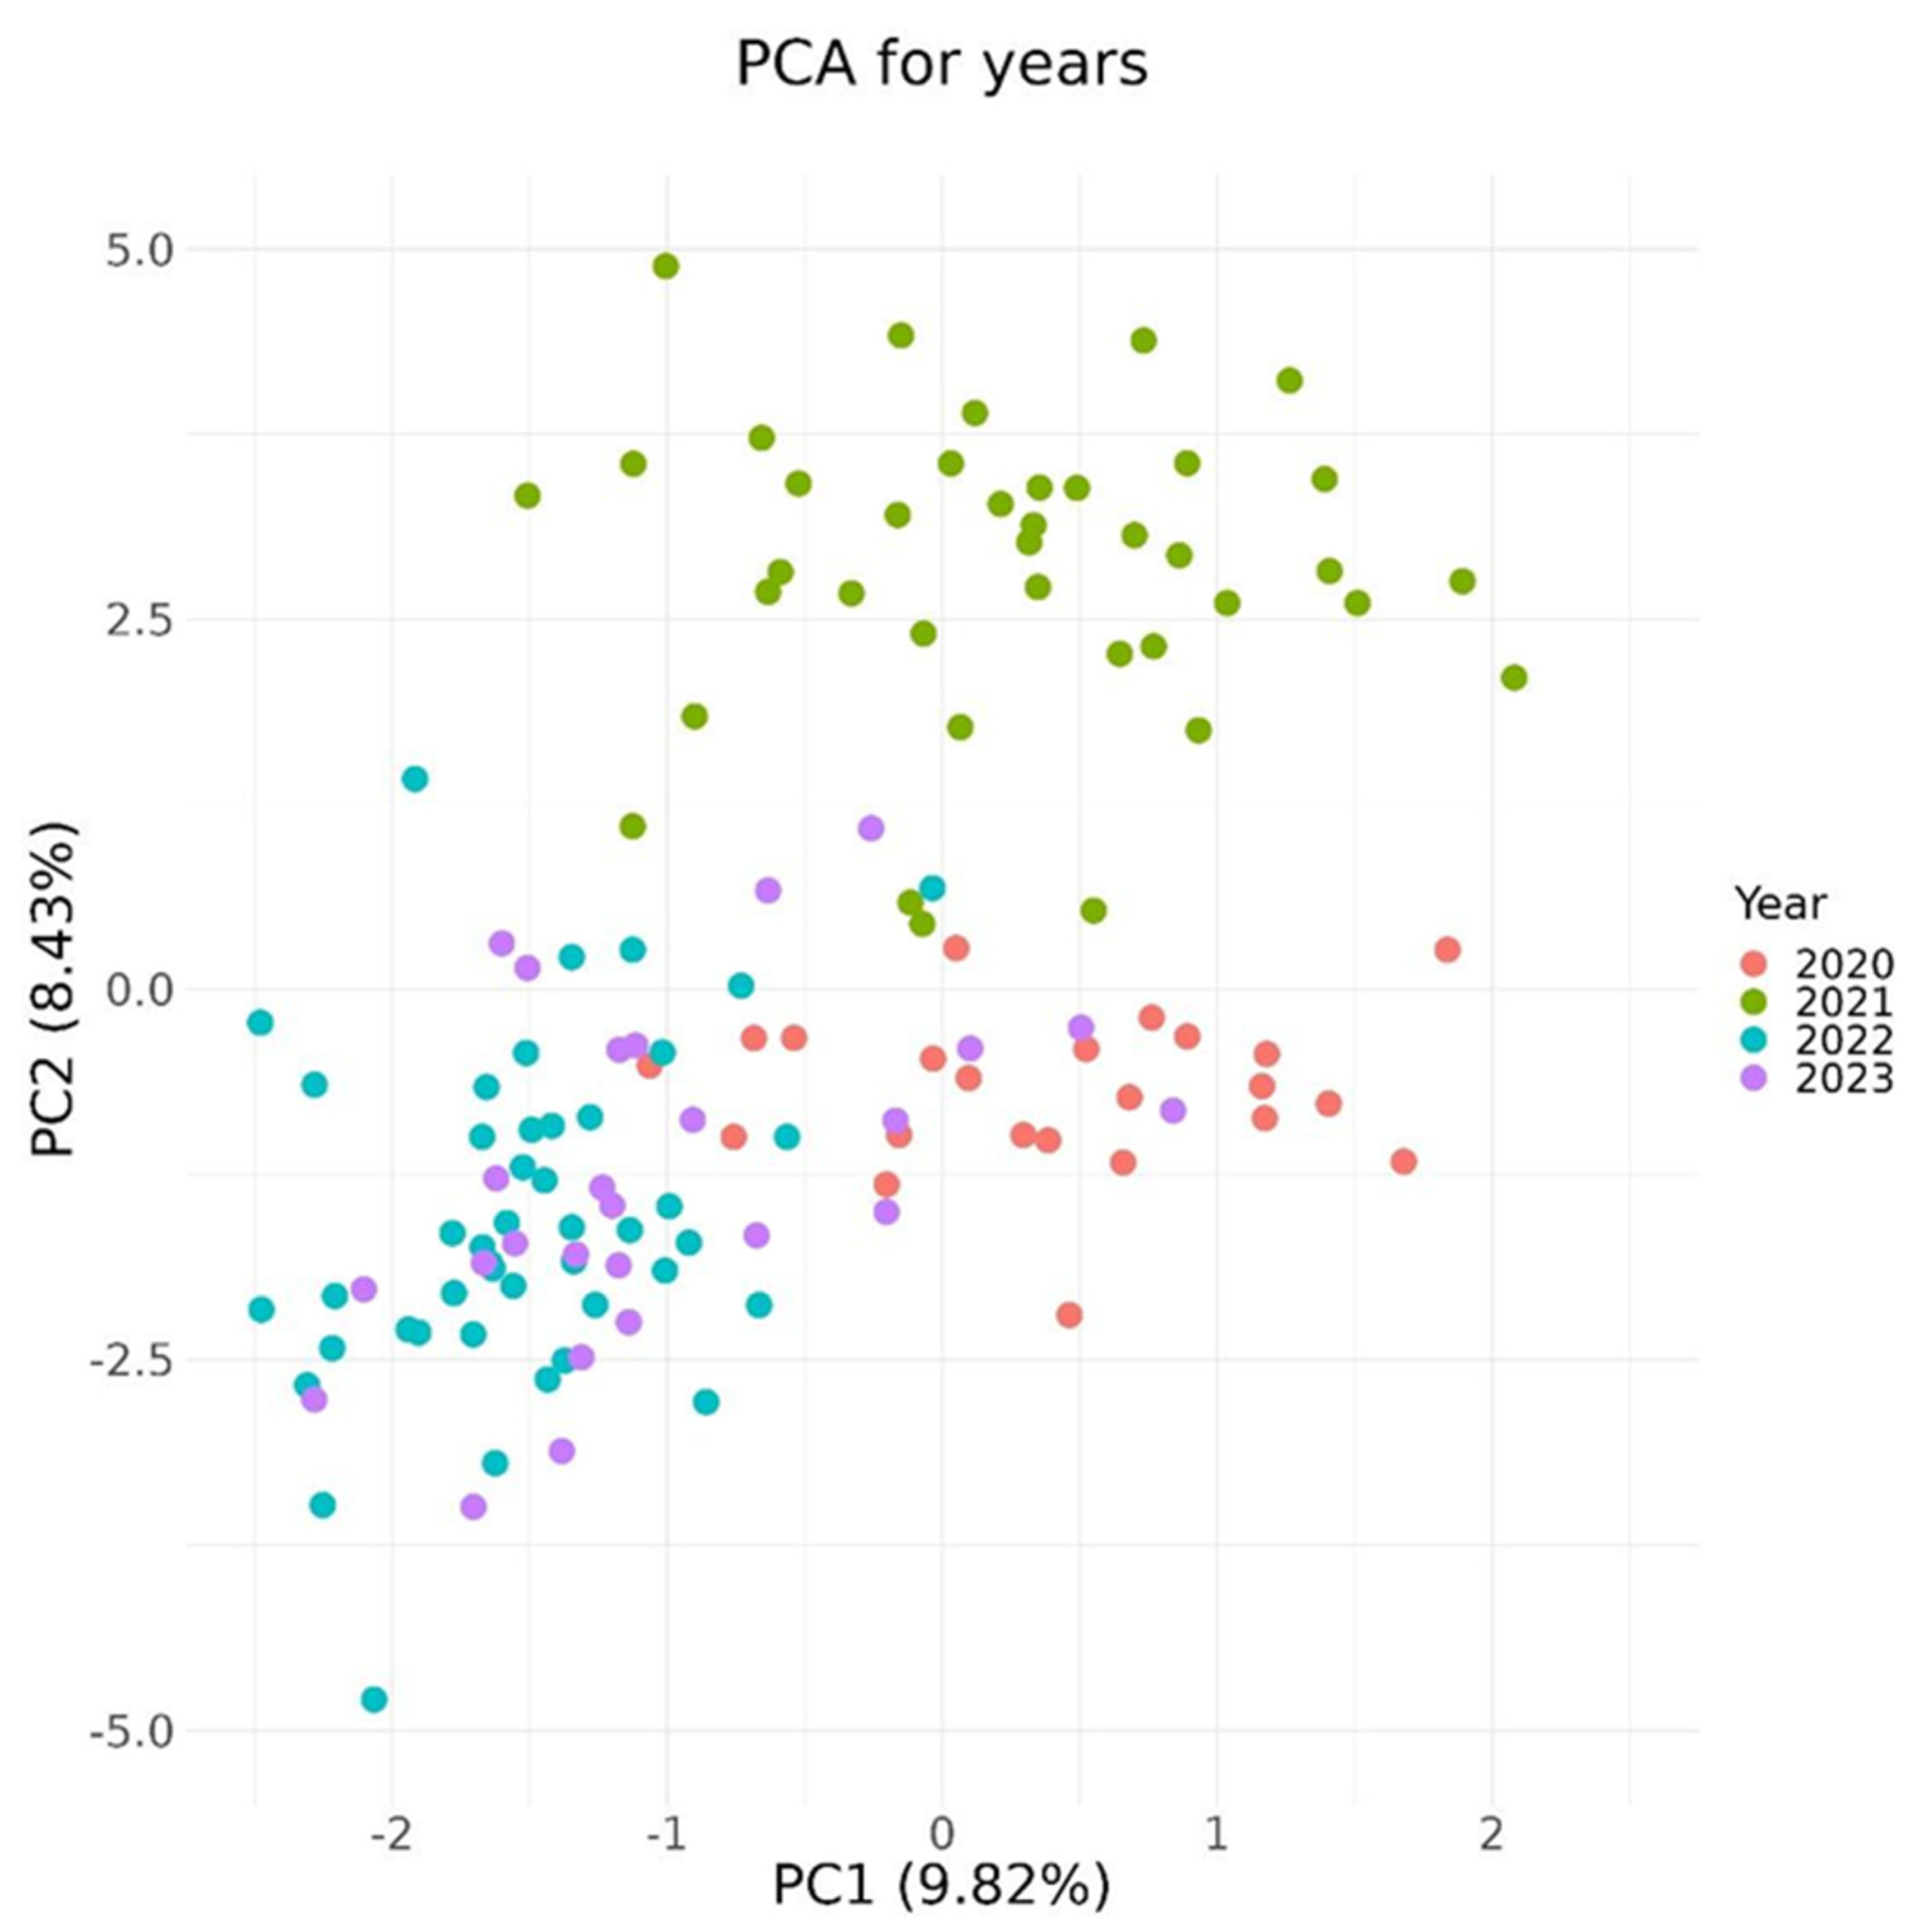
A comparative study of the elemental profile of wines made from grapes of different harvest years was carried out. The PCA diagram is presented in Figure 6.
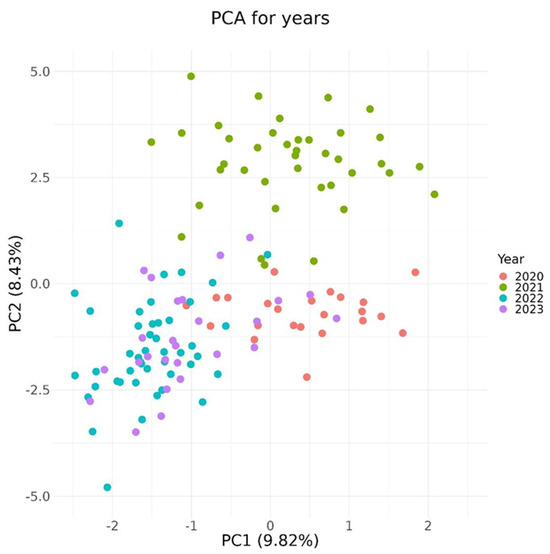
Figure 6.
PCA diagram of the distribution of wine samples from grapes of different vintage years, µg/L.
From the diagram shown in Figure 6, it can be seen that the data obtained for wines from grapes harvested in 2021 are isolated in the space of features from the other samples, which indicates differences in the structure of the data. This distribution of values may be related to the anomalously heavy and prolonged rains on the Black Sea coast in Crimea and Kuban during the 2021 season [40]. Samples from the year of 2020 are clustered separately from the samples from the year of 2022. At the same time, samples from the year of 2023 are clustered together with samples from the years of 2020 and 2022.
In 2020, the elements B, Cu, Re, and Sn had the highest median values for the entire time interval from 2020 to 2023 inclusive. In 2021, the elements Ca, Na and Si had the largest median values for the entire time interval from 2020 to 2023 inclusive. In 2021, the elements Mn, Ni and U had the highest median values for the entire time interval from 2020 to 2023 inclusive. Thus, monitoring annual changes in the elemental profile of wines from different regions is an important step in determining their place of origin.
3.4. Analyzing the Elemental Profile of Wines Using Machine Learning Methods
Based on the conducted research, it can be concluded that the usual methods of univariate and multivariate statistics do not allow us to reliably classify wine samples from Crimea and Kuban. In order to reveal the non-linear dependence of the studied indicators in wines on the geographical place of grape growing, the method of a supervised learning Random Forest was used, which is able to predict the class of observations by the values of variables after training. Random Forest is a collection of decision tree models, each of which is trained on a random subset of the dataset and outputs a customized set of rules to predict the class of observation. Before training the models, the concentrations of the elements Cu, Ca, Fe and S were removed from the dataset, because it is highly likely that their contents in wine may be due to anthropogenic factors. The search for the optimal hyperparameters of the model resulted in a Random Forest with the following characteristics:
- -
- Maximum depth of decision trees—2;
- -
- Maximum fraction of parameters used by each decision tree—0.2;
- -
- Maximum number of leaves—7;
- -
- Minimum number of samples in leaves—1;
- -
- Minimum number of samples in a node to perform split—5;
- -
- Number of trees in the ensemble—30.
The hyperparameters were searched, and the first model was trained on a training dataset containing data only for the years of 2020 and 2022. The year of 2021 was taken out of testing as a year with abnormal weather, and the year of 2023 was taken out as a year with typical weather. After training, the model showed an accuracy of 0.875 on the entire dataset. The accuracy of the model predictions on a portion of the dataset (the 2020 and 2022 samples on which the model was trained) was 0.94. The accuracy for the year of 2021 only (in which anomalous weather was observed) was 0.85. The accuracy for the year of 2023 only was 0.89.
Expectedly, the model achieved greater accuracy with the data on which it was trained. However, the decrease in accuracy when dealing with data that the model had not seen seems relatively small for the amount of data that was used for training.
The model was also built and trained on the entire population of data that was obtained. As a result of the selection of hyperparameters, the following combination proved to be the best:
- -
- Maximum depth of decision trees—4;
- -
- Maximum fraction of parameters used by each decision tree—0.2;
- -
- Maximum number of leaves—9;
- -
- Minimum number of samples in leaves—1;
- -
- Minimum number of samples in a node to perform split—6;
- -
- Number of trees in the ensemble—10.
After training the second model, the accuracy of its predictions was 0.93 on a test sample of the entire dataset. At the same time, for samples generated in different years, the accuracy was as follows:
- -
- All samples—0.96;
- -
- Sample for 2020—0.93;
- -
- Sample for 2021—0.93;
- -
- Sample for 2022—0.98;
- -
- Sample for 2023—1.
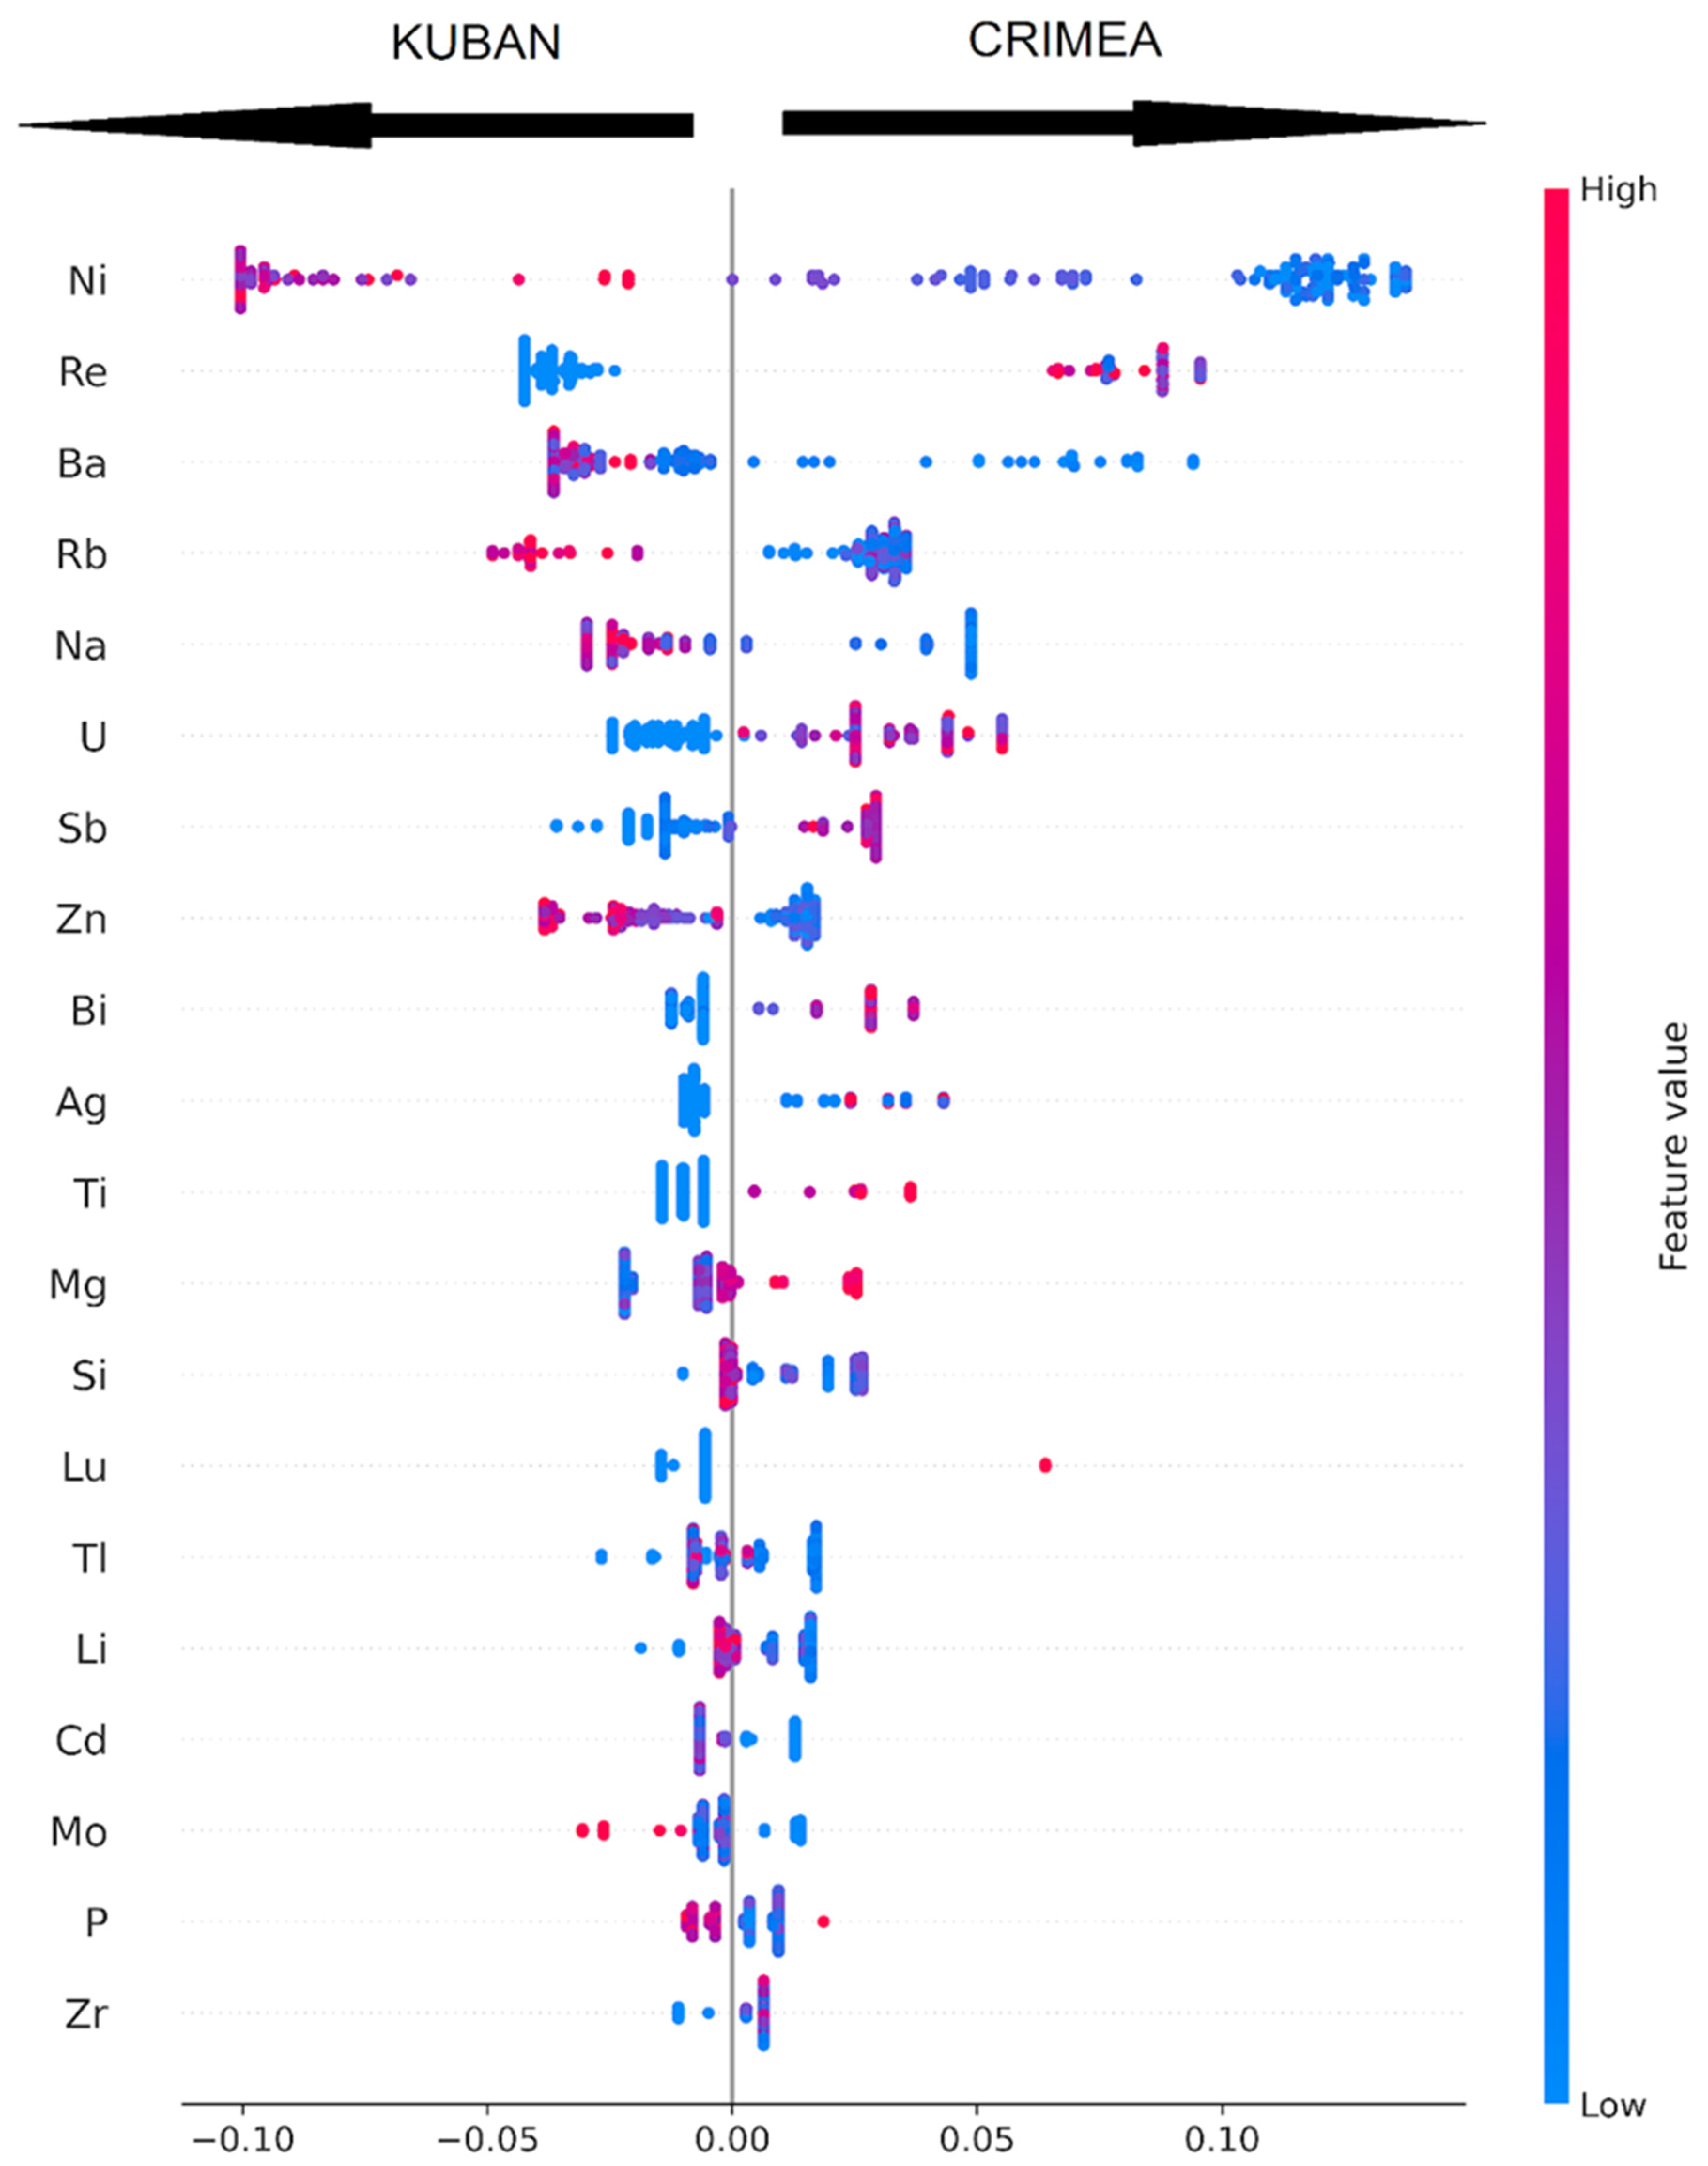
Based on the performance of the model, a list of important features was obtained and used to classify the samples. The results are presented in Figure 7 in the form of a SHAP diagram.
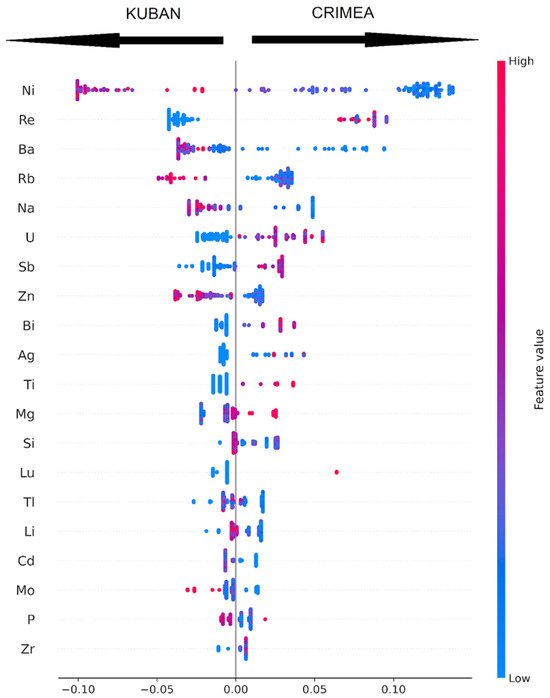
Figure 7.
Diagram of the importance of SHAP attributes profiles.
The graph (Figure 7) shows the parameters arranged in rows. Each parameter has a set of points (observations from the dataset). The parameters are arranged from top to bottom in decreasing order of their importance for the model. The color of a point corresponds to the value of this parameter for a particular observation: blue—low value of the parameter, red—high. The location of the point along the abscissa axis shows how important the parameter value was for model prediction. As the distance of values from the center line increases, the importance of this value for the model increases. When the points are localized in the left part of the graph, the model classifies the place of origin of wine as Kuban. On the other hand, localization to the right of the mid-line means that the sample’s origin was classified as Crimea. We can discern several groups of elements with different distribution patterns:
- Elements whose high and low concentrations unambiguously point to the origin of the sample. These elements provide the most explicit clue about the origin of the element. For instance, a high concentration of Ni is tipping the scales heavily towards Kuban, and obviously, a low concentration of Ni suggests a Crimean origin. Such elements include the following: high concentration for Kuban: Ni, Rb, Zn and Cd; and high concentration for Crimea: Re, U, Sb, Ti and Lu.
- Elements whose high or low concentrations point to the origin of the sample. Let us consider Ba: its high concentration unequivocally tells us that a sample has a Kuban origin. At the same time, a low concentration of Ba cannot be used alone to determine the origin, because both Kuban and Crimean samples can have a low Ba concentration. Elements from this group are the following: high concentration for Kuban: Ba, Na and Mo; low concentration for Kuban: Mg; high concentration for Crimea: Bi, Ag and Zr; and low concentration for Crimea: P.
- Mixed elements, the concentration of which alone cannot tell us with certainty the origin of the sample. For example, in the case of Si, most samples with a low Si concentration are located in Crimea, but nonetheless, a small number of samples with low Si were found in Kuban. Such elements include Si, Tl and Li. Therefore, a combination of elements from the first and second group can be used to determine whether the sample came from Kuban or from Crimea. A study of the elemental profile using machine learning is the most reliable method of classifying wines according to their place of origin. At the same time, an important stage is the annual monitoring of the elemental profile of wines in the studied regions and additional training of the model on new data.
4. Conclusions
The use of an array of data on the elemental profiles of wines, together with statistical methods of analysis, including machine learning methods, is one of the most reliable methods of their classification by place of geographical origin. In the conducted work, it was revealed that wines from Crimea and Kuban differ statistically significantly in their concentrations of the elements B, Ca, Cu, Mn, Na, Ni, Re, Si, Sn and U. Meanwhile, the contents of the elements U, Sn and Re prevail in wines from Crimea, and the contents of the elements B, Ca, Cu, Mn, Na, Ni and Si prevail in wines from Kuban. At the same time, the methods of univariate and multivariate statistics do not allow us to reliably classify wine samples from Crimea and Kuban by their place of origin. In order to reveal the non-linear dependence of the studied indicators in wines on the geographical place of grape growing, the method of a supervised learning Random Forest was used. After training the model on the dataset, the share of its correct predictions amounted to 96%. The model used 61 parameters, among which Ni, Re, Ba, Ba, Rb, Na, Na, U, Sb, Zn, Bi, Ag and Ti were the most important. At the same time, differences were found in the elemental contents of wine samples produced in different years. In some cases, these differences were significant. Thus, the most important steps are the annual monitoring of the elemental profile of wines in the regions under study, the expansion the geography of sampling, and the further training of the model on the basis of new data.
Supplementary Materials
The following supporting information can be downloaded at https://www.mdpi.com/article/10.3390/separations11050148/s1.
Author Contributions
Conceptualization and methodology, D.A.S. and A.L.P.; software, A.A.I.; validation and investigation, M.Y.G. and A.A.S.; resources, A.L.P. and L.A.O.; data curation, D.A.S. and M.Y.G.; writing—original draft preparation, D.A.S.; writing—review and editing and supervision, O.S.E. and D.R.A.; visualization, A.A.I.; project administration, A.L.P. and L.A.O. All authors have read and agreed to the published version of the manuscript.
Funding
This research received no external funding.
Data Availability Statement
Data are contained within the article and Supplementary Materials.
Conflicts of Interest
The authors declare no conflicts of interest.
References
- Camin, F.; Dordevic, N.; Wehrens, R.; Neteler, M.; Delucchi, L.; Postma, G.; Buydens, L. Climatic and geographical dependence of the H, C and O stable isotope ratios of Italian wine. Anal. Chim. Acta 2015, 853, 384–390. [Google Scholar] [CrossRef] [PubMed]
- Dutra, S.V.; Adami, L.; Marcon, A.R.; Carnieli, G.J.; Roani, C.A.; Spinelli, F.R.; Leonardelli, S.; Vanderlinde, R. Characterization of wines according the geographical origin by analysis of isotopes and minerals and the influence of harvest on the isotope values. Food Chem. 2013, 141, 2148–2153. [Google Scholar] [CrossRef] [PubMed]
- Dordevic, N.; Wehrens, R.; Postma, G.J.; Buydens, L.M.C.; Camin, F. Statistical methods for improving verification of claims of origin for Italian wines based on stable isotope ratios. Anal. Chim. Acta 2012, 757, 19–25. [Google Scholar] [CrossRef] [PubMed]
- Camin, F.; Bontempo, L.; Perini, M.; Tonon, A.; Breas, O.; Guillou, C.; Moreno-Rojas, J.M.; Gagliano, G. Control of wine vinegar authenticity through δ18O analysis. Food Control 2013, 29, 107–111. [Google Scholar] [CrossRef]
- Scheidegger, Y.; Saurer, M.; Bahn, M.; Siegwolf, R. Linking stable oxygen and carbon isotopes with stomatal conductance and photosynthetic capacity: A conceptual model. Oecologia 2000, 125, 350–357. [Google Scholar] [CrossRef] [PubMed]
- Sviridov, D.A.; Ganin, M.Y.; Il’in, A.A.; Shmigelskaya, N.A. Study of the features of the elemental profile of wines of the Bakhchisarai region of the Republic of Crimea. Food Ind. 2023, 8, 71–77. [Google Scholar] [CrossRef]
- Oganesyants, L.A.; Panasyuk, A.L.; Kuzmina, E.I.; Sviridov, D.A.; Likhovskoy, V.V.; Zagoruiko, V.A.; Shmigelskaya, N.A. Isotopic characteristics of Crimean collection wines. Food Syst. 2023, 6, 431–436. [Google Scholar] [CrossRef]
- Pepi, S.; Vaccaro, C. Geochemical fingerprints of “Prosecco” wine based on major and trace elements. Environ. Geochem. Health 2018, 40, 833–847. [Google Scholar] [CrossRef] [PubMed]
- Fan, S.; Zhong, Q.; Gao, H.; Wang, D.; Li, G.; Huang, Z. Elemental profile and oxygen isotope ratio (δ18O) for verifying the geographical origin of Chinese wines. J. Food Drug Anal. 2018, 26, 1033–1044. [Google Scholar] [CrossRef]
- Azcarate, S.M.; Martinez, L.D.; Savio, M.; Camiña, J.M.; Gil, R.A. Classification of monovarietal Argentinean white wines by their elemental profile. Food Control 2015, 57, 268–274. [Google Scholar] [CrossRef]
- Coetzee, P.P.; Jaarsveld, F.P.; Vanhaecke, F. Intraregional classification of wine via ICP-MS elemental fingerprinting. Food Chem. 2014, 164, 485–492. [Google Scholar] [CrossRef] [PubMed]
- Geana, I.; Iordache, A.; Ionete, R.; Marinescu, A.; Ranca, A.; Culea, M. Geographical origin identification of Romanian wines by ICP-MS elemental analysis. Food Chem. 2013, 138, 1125–1134. [Google Scholar] [CrossRef] [PubMed]
- Wu, H.; Lin, G.; Tian, L.; Yan, Z.; Yi, B.; Bian, X.; Jin, B.; Xie, L.; Zhou, H.; Rogers, K.M. Origin verification of French red wines using isotope and elemental analyses coupled with chemometrics. Food Chem. 2021, 339, 127760. [Google Scholar] [CrossRef] [PubMed]
- Garcia-Rodrigues, G.; Hernández-Moreno, D.; Soler, F.; Perez-Lopez, M. Characterization of “Ribera del Guadiana” and “Mintrida” Spanish red wines by chemometric techniques based on their mineral contents. J. Food Nutr. Res. 2011, 50, 41–49. [Google Scholar]
- Frías, S.; Trujillo, J.P.; Pena, E.; Conde, J.E. Classification and differentiation of bottled sweet wines of Canary Islands (Spain) by their metallic content. Eur. Food Res. Technol. 2001, 213, 145–149. [Google Scholar] [CrossRef]
- Gonzalvez, A.; Llorens, A.; Cervera, M.L.; Armenta, S.; Guardia, M. Elemental fingerprint of wines from the protected designation of origin Valencia. Food Chem. 2009, 112, 26–34. [Google Scholar] [CrossRef]
- Castiñeira, M.M.; Feldmann, I.; Jakubowski, N.; Andersson, J.T. Classification of German white wines with certified brand of origin by multielement quantitation and pattern recognition techniques. J. Agric. Food Chem. 2004, 52, 2962–2974. [Google Scholar] [CrossRef] [PubMed]
- Bentlin, F.R.S.; Pulgati, F.H.; Dressler, V.L.; Pozebon, D. Elemental analysis of wines from South America and their classification according to country. J. Braz. Chem. Soc. 2011, 22, 327–336. [Google Scholar] [CrossRef]
- Gajek, M.; Pawlaczyk, A.; Szynkowska-Jozwik, M.I. Multi-Elemental Analysis of Wine Samples in Relation to Their Type, Origin, and Grape Variety. Molecules 2021, 26, 214. [Google Scholar] [CrossRef]
- Bica, A.; Sánchez, R.; Todolí, J.-L. Evolution of the Multielemental Content along the Red Wine Production Process from Tempranillo and Grenache Grape Varieties. Molecules 2020, 25, 2961. [Google Scholar] [CrossRef]
- Ranaweera, R.K.R.; Gilmore, A.M.; Capone, D.L.; Bastian, S.E.P.; Jeffery, D.W. Authentication of the geographical origin of Australian Cabernet Sauvignon wines using pectrofluorometric and multi-element analyses with multivariate statistical modelling. Food Chem. 2021, 335, 127592. [Google Scholar] [CrossRef]
- Godshaw, J.; Hopfer, H.; Nelson, J.; Ebeler, S.E. Comparison of dilution, filtration, and microwave digestion sample pretreatments in elemental profiling of wine by ICP-MS. Molecules 2017, 22, 1609. [Google Scholar] [CrossRef]
- Martin, A.E.; Watling, R.J.; Lee, G.S. The multi-element determination and regional discrimination of Australian wines. Food Chem. 2012, 133, 1081–1089. [Google Scholar] [CrossRef]
- Rios-Reina, R.; Elcoroaristizabal, S.; Ocana-Gonzalez, J.A.; Garcia-Gonzalez, D.L.; Amigo, J.M.; Callejon, R.M. Characterization and authentication of Spanish PDO wine vinegars using multidimensional fluorescence and chemometrics. Food Chem. 2017, 230, 108–116. [Google Scholar] [CrossRef]
- Huang, X.-Y.; Jiang, Z.-T.; Tan, J.; Li, R. Geographical Origin Traceability of Red Wines Based on Chemometric Classification via Organic Acid Profiles. J. Food Qual. 2017, 2017, 2038073. [Google Scholar] [CrossRef]
- Mandrile, L.; Zeppa, G.; Giovannozzi, A.M.; Rossi, A.M. Controlling protected designation of origin of wine by Raman spectroscopy. Food Chem. 2016, 211, 260–267. [Google Scholar] [CrossRef]
- Martin, C.; Bruneel, J.-L.; Guyon, F.; Médina, B.; Jourdes, M.; Teissedre, P.-L.; Guillaume, F. Raman spectroscopy of white wines. Food Chem. 2015, 181, 235–240. [Google Scholar] [CrossRef]
- Orellana, S.; Johansen, A.M.; Gazis, C. Geographic classification of U.S. Washington State wines using elemental and water isotope composition. Food Chem. 2019, 1, 100007. [Google Scholar] [CrossRef]
- Bora, F.D.; Donici, A.; Rusu, T.; Bunea, A.; Popescu, D.; Bunea, C.I. Elemental profile and Pb-207/Pb-206, Pb-208/Pb-206, Pb-204/Pb-206, Sr-87/Sr-86 isotope ratio as fingerprints for geographical traceability of romanian wines. Not. Bot. Horti Agrobot. Cluj-Napoca 2018, 46, 223–239. [Google Scholar] [CrossRef]
- Geana, E.-I.; Sandru, C.; Stanciu, V.; Ionete, R.E. Elemental profile and Sr-87/Sr-86 isotope ratio as fingerprints for geographical traceability of wines: An approach on Romanian. Food Anal. Methods 2017, 10, 63–73. [Google Scholar] [CrossRef]
- Almeida, C.M.R.; Vasconcelos, M.T.S.D. Does the winemaking process influence the wine 87Sr/86Sr? A case study. Food Chem. 2004, 85, 7–12. [Google Scholar] [CrossRef]
- Durante, C.; Bertacchini, L.; Bontempo, L.; Camin, F.; Manzini, D.; Lambertini, P.; Marchetti, A.; Paolini, M. From soil to grape and wine: Variation of light and heavy elements isotope ratios. Food Chem. 2016, 210, 648–659. [Google Scholar] [CrossRef]
- Bejjani, J.; Balaban, M.; Rizk, T. A sharper characterization of the geographical origin of Lebanese wines by a new interpretation of the hydrogen isotope ratios of ethanol. Food Chem. 2014, 165, 134–139. [Google Scholar] [CrossRef]
- Tescione, I.; Marchionni, S.; Mattei, M.; Tassi, F.; Romano, C.; Conticelli, S. A Comparative 87Sr/86Sr Study in Red and White Wines to Validate its Use as Geochemical Tracer for the Geographical Origin of Wine. Procedia Earth Planet. Sci. 2015, 13, 169–172. [Google Scholar] [CrossRef]
- Vinciguerra, V.; Stevenson, R.; Pedneault, K.; Poirier, A.; Hélie, J.-F.; Widory, D. Strontium Isotope Characterization of Wines from the Quebec (Canada) Terroir. Procedia Earth Planet. Sci. 2015, 13, 252–255. [Google Scholar] [CrossRef]
- Durante, C.; Baschieri, C.; Bertacchini, L.; Bertelli, D.; Cocchi, M.; Marchetti, A.; Manzini, D.; Papotti, G.; Sighinolfi, S. An analytical approach to Sr isotope ratio determination in Lambrusco wines for geographical traceability purposes. Food Chem. 2015, 173, 553–563. [Google Scholar] [CrossRef]
- Redan, B.W. Processing Aids in Food and Beverage Manufacturing: Potential Source of Elemental and Trace Metal Contaminants. J. Agric. Food Chem. 2020, 68, 13001–13007. [Google Scholar] [CrossRef]
- Nicolini, G.; Larcher, R.; Pangrazzi, P.; Bontempo, L. Changes in the contents of micro- and trace elements in wine due to winemaking treatments. Vitis 2004, 43, 41–45. [Google Scholar] [CrossRef]
- Temerdashev, Z.A.; Abakumov, A.G.; Khalafyan, A.A.; Ageeva, N.M. Correlations between the elemental composition of grapes, soils of the viticultural area and wine. Ind. Lab. Diagn. Mater. 2021, 87, 11–18. [Google Scholar] [CrossRef]
- Oganesyants, L.A.; Panasyuk, A.L.; Kuz’mina, E.I.; Sviridov, D.A.; Shilkin, A.A.; Il’in, A.A. Dependence of the values of the δ18O index of the water component of russian wines on geoclimatic factors. Part 2. Food Ind. 2022, 10, 100–104. [Google Scholar] [CrossRef]
Disclaimer/Publisher’s Note: The statements, opinions and data contained in all publications are solely those of the individual author(s) and contributor(s) and not of MDPI and/or the editor(s). MDPI and/or the editor(s) disclaim responsibility for any injury to people or property resulting from any ideas, methods, instructions or products referred to in the content. |
© 2024 by the authors. Licensee MDPI, Basel, Switzerland. This article is an open access article distributed under the terms and conditions of the Creative Commons Attribution (CC BY) license (https://creativecommons.org/licenses/by/4.0/).

