Article

Early Identification of Olive Oil Defects throughout Shelf Life

by
Flávia Freitas
1,2,
Maria João Cabrita
3 and
Marco Gomes da Silva
1,*
1
LAQV/REQUIMTE, Department of Chemistry, NOVA School of Science and Technology, NOVA University Lisbon, 2829-516 Caparica, Portugal
2
MED-Mediterranean Institute for Agriculture, Environment and Development & CHANGE-Global Change and Sustainability Institute, Institute for Advanced Studies and Research, Universidade de Évora, Pólo da Mitra, Ap. 94, 7006-554 Évora, Portugal
3
MED-Mediterranean Institute for Agriculture, Environment and Development & CHANGE-Global Change and Sustainability Institute, Departamento de Fitotecnia, Escola de Ciências e Tecnologia, Universidade de Évora, Pólo da Mitra, Ap. 94, 7006-554 Évora, Portugal
*
Author to whom correspondence should be addressed.
Separations 2024, 11(6), 167; https://doi.org/10.3390/separations11060167
Submission received: 29 April 2024 / Revised: 16 May 2024 / Accepted: 20 May 2024 / Published: 27 May 2024
(This article belongs to the Section Analysis of Food and Beverages)

Abstract

:
The unique aroma and flavor of extra virgin olive oil (EVOO) are generally associated with its volatile composition, which includes a variety of components responsible for positive attributes as well as sensory defects which result from chemical oxidation processes and the action of exogenous enzymes. In this study, a robust analytical method, headspace solid-phase microextraction combined with gas chromatography–mass spectrometry (HS-SPME-GC/MS), was developed to tentatively identify volatile organic compounds (VOCs) as markers of positive and negative attributes, correlating them with relative percentages to estimate the risk of disqualification during the shelf life of EVOO. Significant differences (p < 0.05) were identified in the levels of VOCs over time, mainly those derived from the lipoxygenase (LOX) pathway. Principal component analysis (PCA) was applied to process the experimental data. The ratio of E-2-hexenal to acetic acid allowed for the prediction of the disqualification of monovarietal EVOO by the sensory panel.

1. Introduction

Olive oil (OO), derived from the olive tree (Olea europaea L.), is a fundamental element in the diet of Mediterranean countries and enjoys recognition as the most valued edible oil globally [1,2,3]. Its attractiveness stems mainly from the predominance of monounsaturated fatty acids, notably oleic acid, and the presence of minor compounds that contribute significantly to its high nutritional value [4,5].
Olive oil is highly prized for its characteristic flavor and pleasant aroma, mainly due to the wide variety and nature of various phenolic compounds and volatile organic compounds present in minor fractions [6].
Phenolic compounds in olive oil, such as phenolic acids and alcohols, lignans, flavones, and secoiridoids, have a significant influence not only on antioxidant activity but also on the ability to provide unique sensory descriptors. There is thus a positive correlation between the aroma and flavor of olive oil and its polyphenol content [7,8,9].
Other compounds of particular interest in influencing the flavor and aroma of olive oils are volatile organic compounds (VOCs). These compounds are produced by combinations of natural biochemical processes that mainly occur during olive maturation and oil extraction [10,11].
An example of a biochemical process is the lipoxygenase (LOX) biosynthetic pathway, responsible for the oxidation of polyunsaturated fatty acids, such as linoleic and linolenic acids, leading to the formation of C5–C6 VOCs, such as aldehydes, ketones, and alcohols, which contribute to the green and fruity aroma of olive oil [12,13,14,15,16].
However, volatile compounds can be related to both the positive attributes and sensory defects of olive oil [14,17,18]. While the pleasant characteristics of olive oil are predominantly influenced by endogenous plant enzymes through the LOX pathway, the presence of sensory defects is associated with chemical oxidation and the action of exogenous enzymes, often derived from microbial activity during storage. These defects are characterized by the low concentration or total absence of compounds from the LOX pathway, and the presence of monounsaturated aldehydes C7–C11, branched aldehydes of C5, and/or some C8 ketones [19,20,21].
The development of these VOCs and also phenolic compounds is mainly associated with the variety, quality, and ripeness of olives, pre- and post-harvest conditions, processing, and inadequate storage. The presence and quantity of these compounds can also be affected by other factors such as geographic origin, climate, and soil type [22,23,24,25,26,27].
Olive oil was the first food product for which a quality assessment by a certified and qualified sensory panel was legally required, as the sensory perception of aroma and taste plays a fundamental role in quality evaluation [28].
Positive sensory attributes include fruity, bitter, and pungent flavors. In addition to intensity, fruitiness can be classified as green or ripe. Bitterness is the characteristic bitter taste of olive oil, and pungency refers to the sensation of spiciness or burning in the throat [29].
Undesirable sensory attributes include defects such as rancid, vinegary, musty, metallic, and fusty flavors, among others [29]. When these defects are present, it is believed that inferior-quality olive oil is present, that there were problems in its production process, or that it has exceeded its shelf life [30,31,32,33].
The shelf life of olive oil can vary depending on the olive variety, production process, storage conditions, and the presence of deteriorating factors [34]. Olive oil has an extended shelf life compared to other vegetable oils due to its composition rich in natural antioxidants, such as polyphenols. Under ideal storage conditions, in a sealed bottle, away from excessive light and heat, extra virgin olive oil can be kept for about 12 to 18 months from the production date [35,36].
Thus, throughout this process, olive oil tasters are essential to provide valuable information about the quality, characteristics, and validity of olive oil, sensorially evaluating to obtain a classification within different categories, such as extra virgin (EVOO), virgin (VOO), or lampante, according to standards established by the International Olive Oil Council (IOOC) and European Union (EU) [37,38,39].
However, these sensory evaluations, which require specialized and trained individuals, may present some inconsistencies, as the result depends on the individual perception of each taster, leading to variations from one day to another, and even among the sensory panel itself [21,31,40,41]. In addition to sensory evaluation, other parameters of olive oil quality are regulated and should be considered to classify an oil, such as free acidity, peroxide value, UV absorbance, and ethyl esters of fatty acids [37,38,39].
Therefore, it is necessary to develop robust and reliable analytical methods that can support the evaluation performed by the sensory panel [42].
The good quality of EVOO is closely linked to its physicochemical and organoleptic characteristics, and consequently its volatile profile.
In recent years, solid-phase microextraction (SPME) has been widely used in the analysis of volatile organic compounds in olive oil, along with gas chromatography coupled with mass spectrometry (GC/MS) analysis [18,43]. SPME, besides being a simple, rapid, and low-cost method without the use of solvents, allows for the absorption and concentration of VOCs present in the matrix, facilitating their subsequent analysis and identification [44].
This study aimed to develop an HS-SPME-GC/MS methodology to determine the presence of VOCs as early markers for negative attributes such as rancidity, mustiness, and fustiness, establishing a correlation between compounds/concentrations/attributes in order to estimate the risk of disqualification during the shelf life of extra virgin olive oil.

2. Materials and Methods

2.1. Samples and Experimental Design

This study was divided into 3 major steps, represented graphically in Figure 1. The description of the samples is provided in Table 1.

2.2. Storage Conditions

All samples from different batches of the study, shown in Table 1, were stored in dark glass bottles and kept in a dry, dark place. Multiple bottles of the same sample type were stored so that throughout the study, new bottles were opened for analysis, thus replicating shelf storage conditions.
All samples were analyzed by HS-SPME-GC/MS in triplicate.

2.3. Physicochemical and Organoleptic Classification

The physicochemical and organoleptic classification was carried out following the criteria of Commission Regulation No. 1989/2003 of 6 November 2003, regarding the characteristics of olive oils and olive–pomace oils, as well as related analysis methods [38].
A sensory panel composed of a panel leader and eight selected and trained assessors was employed based on their ability to distinguish similar samples, following the IOOC manual on the selection, training, and monitoring of qualified virgin olive oil assessors [41]. All samples were analyzed by HS-SPME-GC/MS in triplicate.

2.4. Analytical Procedure

HS-SPME: 4 mL of each sample was subjected to Solid Phase Microextraction by Headspace (HS-SPME) with a 50/30 μm DVB/Carb/PDMS fiber of 1 cm in a 22 mL vial. The sample was equilibrated for 10 min at 50 °C and then extracted for 50 min at this temperature. Thermal desorption of analytes occurred by exposing the fiber to the GC injector at 260 °C for 3 min in splitless mode. Fiber blanks were periodically executed to verify the absence of contaminants and carryover.
GC/MS: A Bruker Scion TQ 456 GC-MS/MS (Bruker Corporation, Billerica, MA, USA) chromatograph equipped with a CTC-CombiPal autosampler (CTC Analytics AG, Zwingen, Switzerland) was used. Data were acquired with a Bruker MSWS 8.2 system and analyzed with Bruker MS Data Review 8.0 software. Chromatographic separation was performed on a DB-WAX PLUS capillary column (60 m × 0.32 mm i.d., 1 μm film thickness (df)). The temperature program started at 40 °C, was held for 5 min, and was then ramped at 4 °C/min to 240 °C and held for 5 min. Helium was used as the carrier gas, with a constant flow rate of 1.7 mL/min. The transfer line of the MS and the source were set at 240 °C and 220 °C, respectively.
Mass spectra were compared using the NIST MS Search Program Version 2.0. For electron ionization (EI), the ionization energy was set at 70 eV, and spectra were recorded between 40 and 450 Da.
The fiber type was chosen according to various procedures described for olive oil that validate the extraction method [42,45,46,47]. Samples were prepared following validated procedures without the addition of NaCl.
The identification of VOCs was based on the analysis of their mass spectra by comparison with reference spectra provided by the NIST library. Additionally, identifications were confirmed by comparison of the linear retention indices (LRIs) relative to the homologous series of n-hydrocarbons (C8–C20), calculated by the formula proposed by Van den Dool and Kratz [48].
A relative semi-quantitative determination was made by comparing peak area intensities.
The software Minitab 19.2 (Minitab Inc., State College, PA, USA) was used for statistical data processing. Analysis of variance (ANOVA) was conducted, and significant differences (p < 0.05) between samples with and without added defects were highlighted by the post hoc Fisher’s LSD test.
Principal component analysis (PCA) was used to characterize and classify the studied olive oils according to their volatile compounds and sensory panel classification. For this analysis, each peak was normalized to a percentage of the total chromatogram area. Calculation was performed with the Python programming language (Version 3.11.8) using the PCA class in the decomposition module of the Scikit-learn library (Version 1.4.2) [49].

3. Results and Discussion

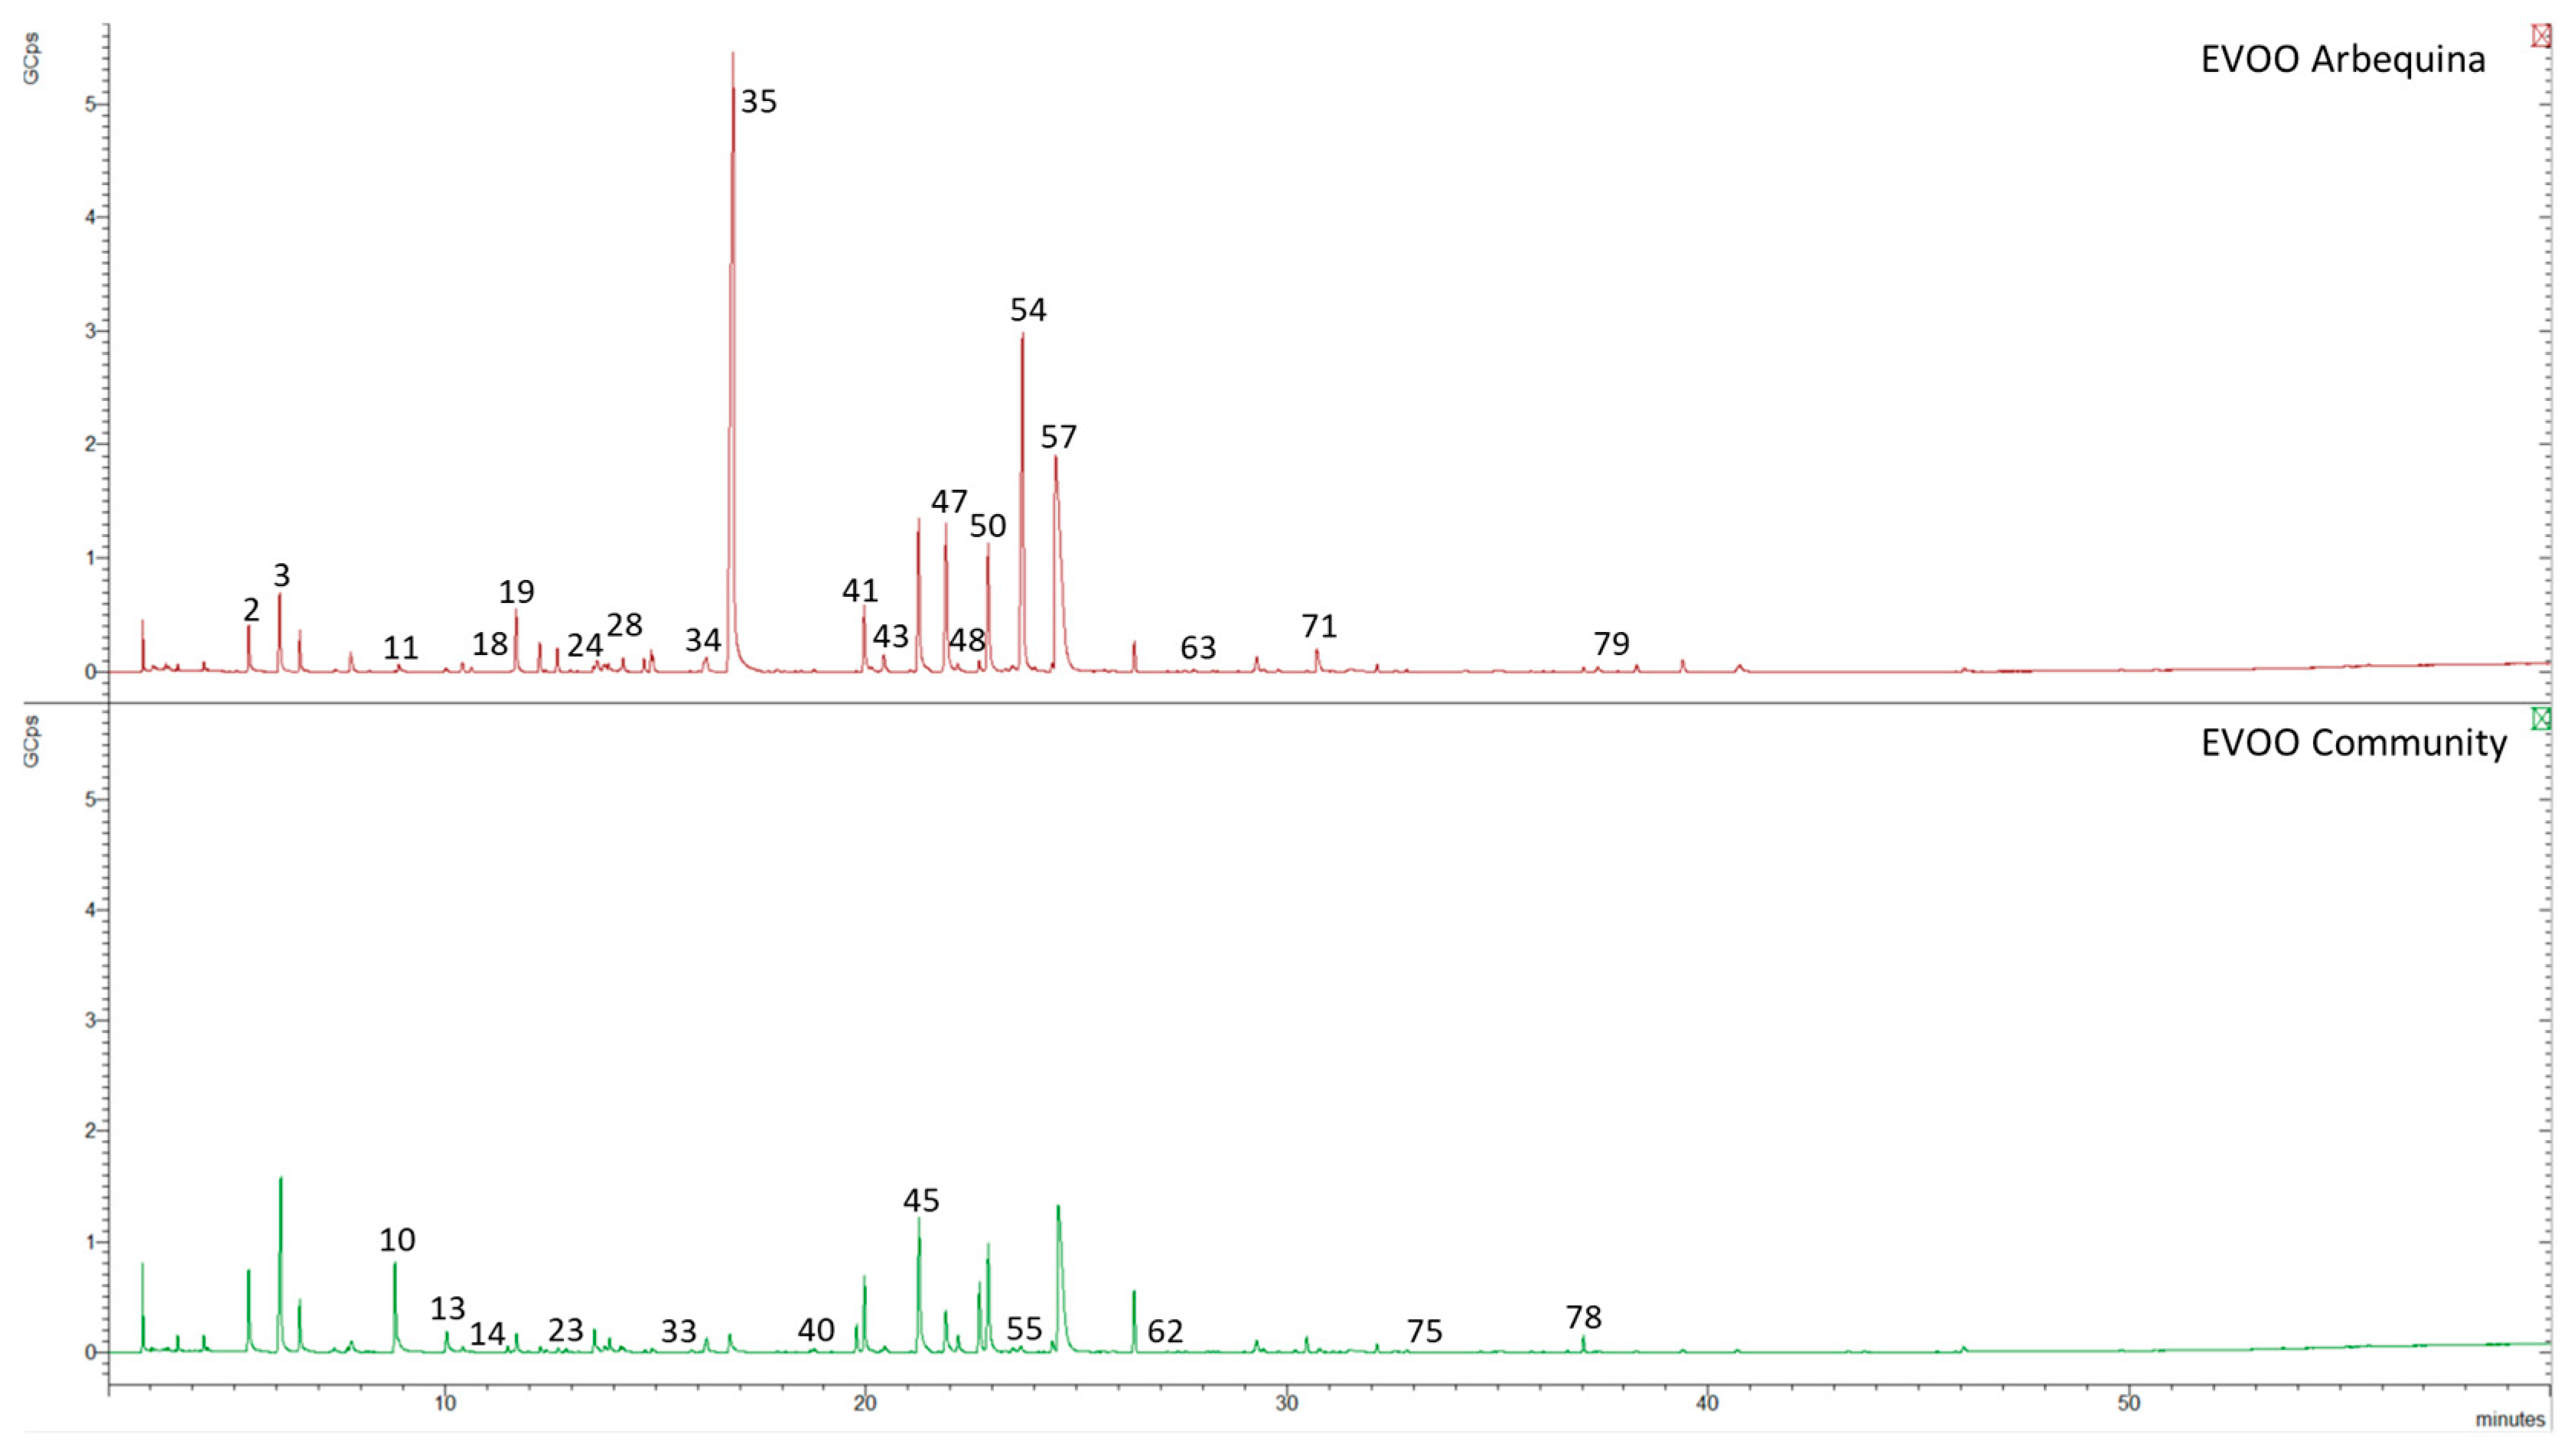
3.1. Monitoring of VOCs

For the monitoring of VOCs, mixtures of two different types of EVOO were used: a monovarietal olive oil of the Arbequina olive variety and a Community olive oil sourced from local producers. The term “Community EVOO” is referred to when it is composed of one or more unknown varieties.
According to the sensory panel, the Community EVOO was described as a more bitter and pungent oil, whereas the Arbequina EVOO was milder and fruitier, characteristic of this variety (Figure 2). Additionally, there was a difference in color, with the Arbequina displaying a lighter golden-green hue, while the Community EVOO had a darker golden-green color.
The chromatographic profile between the two samples also showed significant differences, with the profile of the Arbequina being much more intense than that of the Community olive oil (Figure 3).
Throughout this study, both chromatographic and sensory analyses were consistently conducted during the same period. Figure 4 presents the samples analyzed chromatographically and sensorially over 14 months, with indications in red showing months in which the sensory panel confirmed the presence of defects and downgraded the EVOOs to VOOs (more than 50% of the panel), and in yellow when the samples resulted in defects for part of the panel but without agreement (less than 50%). Samples that continued to be considered “suitable” and classified as EVOOs by the sensory panel are marked in green.
Despite the Community olive oil having a less rich and intense volatile profile, this EVOO took longer to be disqualified by the panel.
While the Community sample remained extra virgin throughout the 14 months, the Arbequina sample turned virgin before the 10-month mark of the study. This is likely due to it being a more bitter and pungent oil, positive attributes that may mask and overshadow some negative attributes. Samples to which olive oil with evident defects (5%) was added were downgraded 2 months earlier than their corresponding EVOO sample.
Olive oil is a highly complex matrix with a high concentration of volatile compounds with different physicochemical properties, such as volatility and polarity [50]. The HS-SPME-GC/MS technique used separated and tentatively identified around 80 volatile and semi-volatile compounds, highlighting the extreme complexity of olive oil aroma (Table 2).
Table 2. Tentatively identified VOCs and their respective relative percentages of each compound calculated by the percent ratio of their peak area to the total chromatogram area in samples of Arbequina and Community. Compound nr. refers to the elution order.
Compound nr.Compound aLRIcalc bLRIlit c% Arbequina% Community
Aldehydes
19Hexanal106710831.81 ± 0.041.12 ± 0.01
242-Pentenal (isomer)1108 0.06 ± 00 ± 0
253-Hexenal (isomer)1120 0 ± 00.25 ± 0.09
33Heptanal117511840.03 ± 00.06 ± 0
35E-2-Hexenal1192121633.53 ± 0.132.08 ± 0.16
42Octanal128112890.01 ± 00.05 ± 0
442-Heptenal (isomer)1299 0.05 ± 00.06 ± 0.01
512,4-Hexadienal (isomer)1358 0 ± 00.04 ± 0.01
522,4-Hexadienal (isomer)1358 0 ± 00 ± 0
56Nonanal138713910.21 ± 0.040.89 ± 0.11
60E,E-2,4-Heptadienal142714950 ± 00.1 ± 0.02
752-Decenal (isomer)1620 0 ± 00.09 ± 0.01
Alcohols
3Isopropyl Alcoholnc9272.49 ± 0.1212.81 ± 0.47
232-Pentanol109611190 ± 00.18 ± 0.01
281-Penten-3-ol (isomer)1131 0.36 ± 0.010.11 ± 0
34Isopentanol117812090.8 ± 0.011.31 ± 0.05
36Pentanol122012500.09 ± 00.1 ± 0.02
432-Penten-1-ol (isomer)1284 0.63 ± 0.010.39 ± 0.01
47Hexanol132113555.44 ± 0.063.48 ± 0.04
48E-3-Hexenol132913670.23 ± 01.14 ± 0.05
50Z-3-Hexenol134713824.88 ± 0.018.63 ± 0.15
54E-2-Hexenol1368140512.49 ± 0.030.45 ± 0
55Z-2-Hexenol137714160.07 ± 00 ± 0
581-Octen-3-ol (isomer)1399 0 ± 00 ± 0
59Heptanol140314530.05 ± 00 ± 0
622-Heptenol (isomer)1450 0 ± 00 ± 0
64Linalool148015470 ± 00.04 ± 0
65Octanol150615570 ± 00 ± 0
80Benzyl alcohol180418700.26 ± 00.08 ± 0
81Phenylethyl Alcohol184119060.49 ± 0.010.22 ± 0.01
Carboxylic acids
57Acetic acid1392144920.03 ± 0.2724.21 ± 0.54
61Formic acid144515030 ± 00 ± 0
63Propanoic acid147915350.09 ± 00 ± 0
66Isobutyric acid150915700.02 ± 00 ± 0
71Butanoic acid156416251.08 ± 0.130 ± 0
76Pentanoic acid167116220.03 ± 00 ± 0
79Hexanoic acid177318460.15 ± 00.05 ± 0
832-Hexenoic acid (isomer)1887 0.26 ± 0.010 ± 0
84Octanoic acid197920600 ± 00.05 ± 0
87Nonanoic acid208321710 ± 00 ± 0
Esters
1Methyl acetatenc8100.18 ± 00.65 ± 0.02
2Ethyl Acetatenc8801.24 ± 0.035.26 ± 0.39
8Ethyl isobutyratenc9610 ± 00.04 ± 0
9Methyl butyratenc9820.03 ± 00.03 ± 0
14Ethyl butyrate103510350.32 ± 00.33 ± 0.03
17Ethyl 2-methylbutyrate106210510 ± 00.32 ± 0.02
18Butyl acetate106610740.02 ± 00.06 ± 0
20Ethyl isovalerate107410680 ± 00.04 ± 0.01
38Ethyl hexanoate123912330 ± 00.07 ± 0.01
41Hexyl acetate126812720 ± 00 ± 0
453-Hexenyl Acetate (isomer)1304 5.58 ± 0.1710.89 ± 0.47
72Butyrolactone156616320 ± 00.88 ± 0.75
73Methyl benzoate157616120.04 ± 00.03 ± 0
Hydrocarbons
4Unknown hydrocarbonnc 0.95 ± 0.012.67 ± 0.22
12Toluene102210420.12 ± 00 ± 0
15Ethyl octadiene (isomer)1039 0.12 ± 00 ± 0
16Ethyl octadiene (isomer)1040 0 ± 00.04 ± 0.02
21Ethyl octadiene (isomer)1081 0.74 ± 0.020.32 ± 0.02
22Ethyl octadiene (isomer)1092 0.59 ± 0.020.25 ± 0.02
26Unknown alkane1122 0.13 ± 0.010.52 ± 0.06
27p-xylene113011380.03 ± 00.14 ± 0.04
29Ethyl octadiene (isomer)1142 0.3 ± 0.010.11 ± 0.01
30Ethyl octadiene (isomer)1147 0.79 ± 0.030.28 ± 0.01
31o-Xylene116911860.04 ± 00.11 ± 0.01
37Styrene121512610 ± 00 ± 0
49Unknown alkene1342 0.29 ± 0.024.23 ± 0.12
68Hexadecane160016000.06 ± 00.13 ± 0.04
74Unknown alkane1628 0.07 ± 0.010.14 ± 0.07
Ethers
10Hexyl methyl ethernc9410 ± 06.13 ± 0.34
133-Hexen-1-ol, methyl ether10259800 ± 01.54 ± 0.15
53Benzyl methyl ether136313940 ± 00.32 ± 0.01
Terpenes
40β-Ocimene125812500.56 ± 0.261.52 ± 0.17
69Unknown sesquiterpene1549 0 ± 00.14 ± 0.02
70Unknown sesquiterpene1558 0.05 ± 01.04 ± 0.08
77Unknown sesquiterpene1750 0 ± 00.13 ± 0
78α-Farnesene176217460.15 ± 0.010.95 ± 0
Ketones
6Pentanone (isomer)nc 0 ± 00.17 ± 0
7Pentanone (isomer)nc 0.72 ± 00.81 ± 0.08
111-Penten-3-one nc10190.27 ± 0.010 ± 0
322-Heptanone117111820 ± 00 ± 0
46Sulcatone131613380 ± 00.03 ± 0
Others
52-Ethylfurannc9500 ± 00 ± 0
39Acetoin124212840.07 ± 00.24 ± 0.02
67Dimethyl Sulfoxide152315730.6 ± 0.050.83 ± 0.24
82Unknown1886 0.12 ± 0.020.19 ± 0.01
85Dimethyl salicylate199520610 ± 00.06 ± 0.02
86Phenol, 3-ethyl-208321710.18 ± 0.050.35 ± 0.07
a Identification by NIST comparation; b linear retention indices calculated from C8 to C20 n-linear alkanes; c linear retention indices reported in NIST Chemistry WebBook for standard polar capillary column [51]; nc—not calculated because we had to take into account the solvent delay.
Within this vast group of compounds, we can predominantly find aldehydes, alkanes, alcohols, and ketones, among others, in different relative percentages for the two samples, as depicted in Figure 5.
After a thorough analysis of all chromatograms of the samples, it was found that most of the VOCs were common to all samples of the two varieties with different defects, being present in different relative proportions. Therefore, it was necessary to identify which compounds contributed to the differentiation between these samples throughout the shelf life.
The majority of these compounds are related to the organoleptic properties of olive oil, having sensory characteristics that contribute to flavor sensations [10,52,53].
As observed in Table 2, it is the C6 alcohols and aldehydes that predominate. These compounds, along with their corresponding esters, are considered essential in the aromatic profile of EVOOs, both qualitatively and quantitatively [14]. They play a crucial role in expressing sweet and green notes, contributing significantly to the overall aroma [12].
Compounds such as hexanal (19), Z-3-hexenal (25), E-2-hexenal (35), hexanol (47), Z-3-hexenol (50), E-2-hexenol (54), hexyl acetate (41), and Z-3-hexenyl acetate (45) comprise the majority of the volatile fraction, representing about 60% of the total area for the Arbequina EVOO and 30% for the Community EVOO. For the Community olive oil, these compounds are found in very similar relative proportions to each other. However, in the Arbequina variety, E-2-hexenal (35) stands out as a particularly prominent compound, representing about 30% of the total area of the chromatogram.
Therefore, the monovarietal Arbequina consists of approximately 36% of aldehydes versus 8% for the Community EVOO. Both EVOOs have approximately the same percentage of alcohols (28%). The Community EVOO exhibits a higher relative quantity of esters (19%) compared to the Arbequina variety (7%), mainly due to the greater presence of compounds such as ethyl acetate (2) and Z-3-hexenyl acetate (45).
According to the presented values, significant differences are observed, especially at the LOX pathway level for different cultivars, which leads to discrimination between the Arbequina EVOO and Community EVOO.
It is also worth considering that besides being sweet and fruity, these olive oils have bitter, pungent, and spicy attributes for the sensory panel, especially Community EVOO. These attributes are generally attributed to C5 compounds, such as 1-penten-3-one (11), which provides pungent sensations correlated with bitterness [54,55]. Despite C6 VOCs being in higher concentrations than C5, it does not necessarily mean they are the main contributors to the odor. For example, a concentration of 6770 μg/g of E-2-hexenal has an odor activity value corresponding to 16, while a concentration of 26 μg/g of 1-penten-3-one has a higher value of 36 [56].
In addition to these VOCs, these sensations are also attributed to phenolic compounds such as derivatives of oleuropein and ligstroside [57]. Therefore, all the VOCs found, whether major or minor, are responsible for the sensory notes and crucial in determining the quality of EVOO.
Even VOCs that are below their olfactory threshold and do not have a direct impact on aroma can play an important role in understanding the formation and degradation of volatile compounds that significantly contribute to aroma [12]. Additionally, these compounds can serve as useful quality markers. This fraction includes a variety of compounds such as carbonyl compounds, pentenols, hydrocarbons, ethers, and other minor compounds that are not the result of fatty acid transformations [58].
Some sesquiterpenes, such as α-farnesene (78) and ethyl octadiene isomers are present in both samples, whereas some ethers, such as hexyl methyl ether (10) and 3-hexen-1-ol methyl ether (13), are present only in the Community EVOO.
Another class of compounds with a notable presence in EVOOs and that do not derive from fatty acid transformation are carboxylic acids, mainly acetic acid (57) (about 20%). This compound has a natural origin and results from the fermentation process of sugars present in olives during maturation. It tends to increase over time due to continuous fermentation as well as the oxidation of the olive oil’s fatty acids, giving rise to some organoleptic defects such as wine–vinegar flavor [21,33].
The evolution of VOCs in olive oil influences the organoleptic classification and, consequently, the classification of olive oil by the sensory panel. Several processes can alter the initially pleasant aroma and flavor, resulting in unpleasant sensory notes known as off flavors [53]. Current official olive oil regulations classify the most common off flavors into four groups: musty, musty–humid, wine–vinegar, and rancid [29].
The presence of a fusty flavor often indicates that the olives used in the oil production process were at an advanced stage of fermentation. Musty–humid flavor is typical of olive oils from olives stored in damp conditions for an extended period, leading to the development of various types of fungi. The wine–vinegar flavor arises due to high concentrations of acetic acid, ethyl acetate, and ethanol. Rancidity is a common sensory characteristic of all oils and fats that have undergone auto-oxidation due to prolonged exposure to air [21,32,33,59].
The first three defects result from improper storage of the fruits before olive oil processing, while the latter occurs during olive oil storage. These sensory defects become more pronounced over the olive oil’s shelf life [33,60].

3.2. Evolution of VOCs over the Storage Time

In this study, Arbequina and Community EVOOs were both mixed with 5% of three different types of disqualified olive oil with distinct defects—musty, fusty, and rancid— and their evolution over 14 months was studied.
After the tentative identification of compounds (see Table 2), an analysis of variance (ANOVA) was conducted for the VOCs of the different varieties with and without disqualified olive oil added, comparing them over 14 months. This analysis revealed a set of 30 compounds that were significantly different among the samples (p < 0.05) responsible for the evolution and possible disqualification by the sensory panel (Table 3).
The evolution of acetic acid (57) and VOCs derived from the LOX pathway that showed significant differences (p < 0.05) during the storage of the samples is depicted in Figure 6.
All compounds derived from LOX were affected by storage. Considering that fatty acid levels in olive oil decrease over time due to oxidation, it is important to evaluate the compounds formed by the main transformation pathway, the LOX pathway.
As observed in Figure 6, the relative percentage of compounds derived from α-linolenic acid was higher than that of compounds from linoleic acid for both samples, consistent with other published studies [61,62].
In the monovarietal OO Arbequina, the E-2-hexenal/E-2-hexenol pathway stands out, which is associated with the predominance of Z-3-hexenal isomerization. On the other hand, in the Community sample, the Z-3-hexenol/Z-3-hexenyl acetate pathway prevails, which may be related to a low level of isomerase and a high level of alcohol dehydrogenase (ADH) [63,64].
Starting with compounds derived from linoleic acid, we observed an increasing trend in hexyl acetate resulting from the transformation of hexanal into hexanol.
On the other hand, compounds derived from α-linolenic acid, such as Z-3-hexen-1-ol and Z-3-hexenyl acetate, maintained a very similar relative percentage among themselves, both within the Arbequina and Community samples, making it difficult to discern a clear trend.
As for E-2-hexenal, one of the main VOCs originating from LOX and also a product of α-linolenic acid, it shows a clear decrease over time in both the Arbequina and Community samples. This is likely due to its conversion by ADH into E-2-hexenol, a compound that exhibits an increase over time for both samples.
The disqualification of EVOOs by the sensory panel is largely due to a decrease in E-2-hexenal, which is responsible for positive fruity and bitter notes [53,56]. With this decreasing trend, negative attributes become more pronounced, leading to the disqualification of the samples.
Another compound, not belonging to the LOX pathway but highlighted by its quantity in the olive oil, is acetic acid, which tends to increase over time.
With such an extensive universe of VOCs and numerous chemical reactions occurring simultaneously, including the LOX pathway, possible alcoholic and butyric fermentations of sugars, amino acid conversions, autooxidations, and homolytic cleavages of hydroperoxides, among others, principal component analysis (PCA) was applied in an attempt to differentiate between the Arbequina and Community samples classified as EVOO and the samples disqualified by the sensory panel (Figure 7 and Figure 8).
PCA was performed using the means of the relative percentages of the 30 VOCs that showed statistically significant differences (Table 3) between the samples with and without the addition of disqualified olive oil and time.
For the Arbequina variety, in Figure 7, it can be observed that the first and second components (PC1 and PC2) explained about 99% of the total variance of the system. There is a clear separation of samples over time, primarily discriminated along PC1, with emphasis on the compounds E-2-hexenal, acetic acid, and E-2-hexenol. This suggests that acetic acid and E-2-hexenol are the compounds responsible for the samples disqualified (highlighted in red) by the sensory panel, while E-2-hexenal is the compound responsible for maintaining the samples as extra virgin.
For the Community variety, in Figure 8, PC1 and PC2 explained about 80% of the total variance of the system, and it is the compounds E-2-hexenal, hexanal, acetic acid, and Z-3-hexenol that distinguished the EVOO samples from the disqualified samples along PC1. Acetic acid and Z-3-hexenol are the compounds responsible for the disqualified samples (highlighted in red).
Given that E-2-hexenol is derived from E-2-hexenal, the predominant compound in Arbequina EVOO, it is normal for E-2-hexenol to increase over time as E-2-hexenal decreases. The same applies to Z-3-hexenol, which originates from the LOX pathway and is significantly present in Community EVOO.
Thus, considering that E-2-hexenal is one of the compounds influencing the PCAs of both samples and has been described as responsible for positive attributes, it was found to be a potential marker for the early detection of oxidation onset and future disqualification by the sensory panel when its relative percentage decreases in the olive oil. Conversely, the same reasoning applies to acetic acid, a compound responsible for negative attributes, which characterizes disqualified samples by increasing its relative percentage, as observed along PC1 for both Arbequina and Community varieties.
With this in mind, an attempt was made to establish a correlation between these two compounds to predict the level of oxidation, supporting the sensory panel. By predicting through a ratio between both compounds, it may be possible to anticipate when different olive oil varieties will become disqualified while remaining on the shelf throughout their shelf life.

3.3. Monitoring the Ratio of E-2-Hexenal to Acetic Acid

The ratio of E-2-hexenal to acetic acid was calculated for the new Arbequina variety with the addition of olive oil disqualified by the sensory panel and with evident defects, plotting the ratio over its shelf life, as shown in Figure 9.
As observed in Figure 9, as the percentage of disqualified EVOO added increases, the ratio of E-2-hexenal to acetic acid decreases. When the ratio value was equal to 3.2, the sensory panel unanimously disqualified the blends in which the ratio was below this value.
The ratio values for different EVOOs may vary slightly, as they depend heavily on the variety of olive oil used, as well as its composition in E-2-hexenal.

3.4. Confirmation of the E-2-Hexenal/Acetic Acid Ratio

After estimating the ratio value for the sensory disqualification of the Arbequina monovariety, the same was applied to other varieties, as shown in Figure 10.
For the confirmation of the E-2-hexenal/acetic acid ratio deemed relevant for estimating EVOO shelf life, three different varieties of extra virgin olive oils (Irrigation Picual EVOO and Dryland EVOO, and two other Arbequina EVOOs) were used, as well as the same oils already disqualified by the panel, represented in Figure 5. The olive oils already disqualified by the panel showed a E-2-hexenal/acetic acid ratio value below 5 at the beginning of the study, so they were not further evaluated.
Although, as shown in Figure 9, the disqualification threshold for arbequina with mixed disqualified olive oil was 4.3, the later study that employed more varieties over 14 months showed a threshold of around 5, as can be seen in Figure 10. Thus, we were able to confirm this ratio of <5 for disqualified OO. Only Dryland Picual was disqualified by the sensory panel while still having a ratio slightly above 5.
However, it is necessary to always consider the variety of olive oil and the initial value of E-2-hexenal. Thus, one may consider that the higher the value of E-2-hexenal and the higher the ratio of E-2-hexenal to acetic acid, the greater the durability of the resulting mixture from a sensory standpoint.
It was not possible to establish a ratio value for the Community EVOO used in this study, as this EVOO had a very small amount of E-2-hexenal in its composition. The Community EVOO used came from local producers, and the variety or blend of varieties used is unknown. Therefore, it is necessary to find other compounds that can be correlated with each other for EVOOs which have a lower content of E-2-hexenal. Compounds derived from the LOX pathway, such as Z-3-hexenol and Z-3-hexenyl acetate may serve this purpose.

4. Conclusions

In this study, a sensory and analytical analysis over time was conducted on a monovarietal Arbequina EVOO and a Community EVOO with and without the addition of olive oil disqualified by the sensory panel due to evident defects such as mustiness, rancidity, and fustiness. A method using HS-SPME-GC/MS was established, allowing for the tentative identification of approximately 80 volatile organic compounds in these samples. Although the profiles of the two EVOOs were markedly different, the majority of compounds occurred in both oils.
The analysis of volatile profiles enabled the study of the impact of time and oxidation. Analysis of variance identified 30 compounds with significant differences between the respective samples and time, revealing that the evolution was primarily due to VOCs derived from the LOX pathway.
Through PCA, it was possible to differentiate the samples classified as EVOO from those disqualified by the sensory panel. The evolution of EVOOs over time was mainly attributed to compounds such as E-2-hexenal, E-2-hexenol, Z-3-hexenol, and acetic acid.
Compounds like E-2-hexenal and acetic acid were suggested as potential markers for early identification of the shelf life of an EVOO. A ratio between these two compounds was established and monitored over time for different olive oil varieties. The ratio of E-2-hexenal/acetic acid appears to be a good indicator of shelf life. Ratios lower than 5 indicate the possible disqualification of an monovarietal EVOO by the sensory panel.

Author Contributions

Conceptualization, M.J.C. and M.G.d.S.; Data curation, F.F.; Formal analysis F.F.; Funding acquisition, M.J.C. and M.G.d.S.; Investigation, F.F.; Methodology, F.F.; Project administration, M.J.C. and M.G.d.S.; Resources, M.J.C. and M.G.d.S.; Software, F.F., M.J.C. and M.G.d.S.; Supervision, M.G.d.S. and M.J.C.; Validation, F.F.; Roles/Writing—original draft, F.F.; Writing—review and editing, M.J.C. and M.G.d.S. All authors have read and agreed to the published version of the manuscript.

Funding

This research was supported by National Funds through the FCT—Foundation for Science and Technology under the Ph.D. Grant of Flávia Freitas (2020.08089.BD DOI 10.54499/2020.08089.BD).

Data Availability Statement

Data are contained within the article.

Acknowledgments

This work received support and help from FCT/MCTES through national funds: Associate Laboratory for Green Chemistry—LAQV (LA/P/0008/2020 DOI 10.54499/LA/P/0008/2020, UIDP/50006/2020 DOI 10.54499/UIDP/50006/2020 and UIDB/50006/2020 DOI 10.54499/UIDB/50006/2020); MED—Mediterranean Institute for Agriculture, Environment and Development (UIDB/05183/2020 DOI 10.54499/UIDB/05183/2020 and UIDP/05183/2020 DOI 10.54499/UIDP/05183/2020); CHANGE-Global Change and Sustainability Institute (LA/P/0121/2020 DOI 10.54499/LA/P/0121/2020). This research was also anchored by the RESOLUTION LAB, an infrastructure at NOVA School of Science and Technology.

Conflicts of Interest

The authors declare no conflicts of interest.

References

  1. Ferro-Luzzi, A.; Cialfa, E.; Leclercq, C.; Toti, E. The Mediterranean Diet Revisited. Focus on Fruit and Vegetables. Int. J. Food Sci. Nutr. 1994, 45, 291–300. [Google Scholar] [CrossRef]
  2. Tur, J.A.; Ngo de la Cruz, J.; Ribas, L. Olive Oil and the Mediterranean Diet: Beyond the Rhetoric. Eur. J. Clin. Nutr. 2003, 57, S2–S7. [Google Scholar] [CrossRef] [PubMed]
  3. Foscolou, A.; Critselis, E.; Panagiotakos, D. Olive Oil Consumption and Human Health: A Narrative Review. Maturitas 2018, 118, 60–66. [Google Scholar] [CrossRef]
  4. Bendini, A.; Cerretani, L.; Carrasco-Pancorbo, A.; Gómez-Caravaca, A.M.; Segura-Carretero, A.; Fernández-Gutiérrez, A.; Lercker, G. Phenolic Molecules in Virgin Olive Oils: A Survey of Their Sensory Properties, Health Effects, Antioxidant Activity and Analytical Methods. An Overview of the Last Decade Alessandra. Molecules 2007, 12, 1679–1719. [Google Scholar] [CrossRef] [PubMed]
  5. Boskou, D. Olive Oil: Chemistry and Technology, 2nd ed.; Taylor & Francis: Abingdon, UK, 2006. [Google Scholar] [CrossRef]
  6. Servili, M.; Taticchi, A.; Esposto, S.; Urbani, S.; Selvaggini, R.; Montedoro, G.F. Effect of Olive Stoning on the Volatile and Phenolic Composition of Virgin Olive Oil. J. Agric. Food Chem. 2007, 55, 7028–7035. [Google Scholar] [CrossRef] [PubMed]
  7. Servili, M.; Esposto, S.; Fabiani, R.; Urbani, S.; Taticchi, A.; Mariucci, F.; Selvaggini, R.; Montedoro, G.F. Phenolic Compounds in Olive Oil: Antioxidant, Health and Organoleptic Activities According to Their Chemical Structure. Inflammopharmacology 2009, 17, 76–84. [Google Scholar] [CrossRef] [PubMed]
  8. Favati, F.; Condelli, N.; Galgano, F.; Caruso, M.C. Extra Virgin Olive Oil Bitterness Evaluation by Sensory and Chemical Analyses. Food Chem. 2013, 139, 949–954. [Google Scholar] [CrossRef]
  9. Pedan, V.; Popp, M.; Rohn, S.; Nyfeler, M.; Bongartz, A. Characterization of Phenolic Compounds and Their Contribution to Sensory Properties of Olive Oil. Molecules 2019, 24, 2041. [Google Scholar] [CrossRef] [PubMed]
  10. Angerosa, F. Sensory Quality of Olive Oils. In Handbook of Olive Oil; Springer: Berlin/Heidelberg, Germany, 2000; pp. 355–392. [Google Scholar] [CrossRef]
  11. Angerosa, F.; Campestre, C. Sensory Quality: Methodologies and Applications. In Handbook of Olive Oil: Analysis and Properties; Springer: Berlin/Heidelberg, Germany, 2013; pp. 523–560. [Google Scholar] [CrossRef]
  12. Kalua, C.; Allen, M.; Bedgood, D., Jr.; Bishop, A.; Prenzler, P.; Robards, K. Rapid Communication Olive Oil Volatile Compounds, Flavour Development and Quality: A Critical Review. Food Chem. 2007, 100, 273–286. [Google Scholar] [CrossRef]
  13. Morales, M.T.; Aparicio, R.; Rios, J.J. Dynamic Headspace Gas Chromatographic Method for Determining Volatiles in Virgin Olive Oil. J. Chromatogr. A 1994, 668, 455–462. [Google Scholar] [CrossRef]
  14. Angerosa, F.; Servili, M.; Selvaggini, R.; Taticchi, A.; Esposto, S.; Montedoro, G. Volatile Compounds in Virgin Olive Oil: Occurrence and Their Relationship with the Quality. J. Chromatogr. A 2004, 1054, 17–31. [Google Scholar] [CrossRef] [PubMed]
  15. Vick, B.A.; Zimmerman, D.C. Oxidative Systems for Modification of Fatty Acids: The Lipoxygenase Pathway. In Lipids: Structure and Function; Academic Press: Cambridge, MA, USA, 1987; pp. 53–90. [Google Scholar] [CrossRef]
  16. Morales, M.T.; Tsimidou, M. The Role of Volatile Compounds and Polyphenols in Olive Oil Sensory Quality. In Handbook of Olive Oil; Springer: Berlin/Heidelberg, Germany, 2000; pp. 393–458. [Google Scholar] [CrossRef]
  17. Campestre, C.; Angelini, G.; Gasbarri, C.; Angerosa, F. The Compounds Responsible for the Sensory Profile in Monovarietal Virgin Olive Oils. Molecules 2017, 22, 1833. [Google Scholar] [CrossRef]
  18. Cecchi, L.; Migliorini, M.; Mulinacci, N. Virgin Olive Oil Volatile Compounds: Composition, Sensory Characteristics, Analytical Approaches, Quality Control, and Authentication. J. Agric. Food Chem. 2021, 69, 2013–2040. [Google Scholar] [CrossRef] [PubMed]
  19. Venkateshwarlu, G.; Let, M.B.; Meyer, A.S.; Jacobsen, C. Modeling the Sensory Impact of Defined Combinations of Volatile Lipid Oxidation Products on Fishy and Metallic Off-Flavors. J. Agric. Food Chem. 2004, 52, 1635–1641. [Google Scholar] [CrossRef] [PubMed]
  20. Salas, J.J.; Sánchez, C.; García-González, D.L.; Aparicio, R. Impact of the Suppression of Lipoxygenase and Hydroperoxide Lyase on the Quality of the Green Odor in Green Leaves. J. Agric. Food Chem. 2005, 53, 1648–1655. [Google Scholar] [CrossRef] [PubMed]
  21. Angerosa, F. Influence of Volatile Compounds on Virgin Olive Oil Quality Evaluated by Analytical Approaches and Sensor Panels. Eur. J. Lipid Sci. Technol. 2002, 104, 639–660. [Google Scholar] [CrossRef]
  22. Baccouri, O.; Bendini, A.; Cerretani, L.; Guerfel, M.; Baccouri, B.; Lercker, G.; Zarrouk, M.; Daoud Ben Miled, D. Comparative Study on Volatile Compounds from Tunisian and Sicilian Monovarietal Virgin Olive Oils. Food Chem. 2008, 111, 322–328. [Google Scholar] [CrossRef] [PubMed]
  23. Psomiadou, E.; Tsimidou, M. Stability of Virgin Olive Oil. 1. Autoxidation Studies. J. Agric. Food Chem. 2002, 50, 716–721. [Google Scholar] [CrossRef] [PubMed]
  24. Choe, E.; Min, D.B. Mechanisms and Factors for Edible Oil Oxidation. Compr. Rev. Food Sci. Food Saf. 2006, 5, 169–186. [Google Scholar] [CrossRef]
  25. Reboredo-Rodríguez, P.; González-Barreiro, C.; Cancho-Grande, B.; Simal-Gándara, J. Dynamic Headspace/GC–MS to Control the Aroma Fingerprint of Extra-Virgin Olive Oil from the Same and Different Olive Varieties. Food Control 2012, 25, 684–695. [Google Scholar] [CrossRef]
  26. Serrano, A.; De la Rosa, R.; Sánchez-Ortiz, A.; Cano, J.; Pérez, A.G.; Sanz, C.; Arias-Calderón, R.; Velasco, L.; León, L. Chemical Components Influencing Oxidative Stability and Sensorial Properties of Extra Virgin Olive Oil and Effect of Genotype and Location on Their Expression. LWT 2021, 136, 110257. [Google Scholar] [CrossRef]
  27. Benincasa, C.; De Nino, A.; Lombardo, N.; Perri, E.; Sindona, G.; Tagarelli, A. Assay of Aroma Active Components of Virgin Olive Oils from Southern Italian Regions by SPME-GC/Ion Trap Mass Spectrometry. J. Agric. Food Chem. 2003, 51, 733–741. [Google Scholar] [CrossRef] [PubMed]
  28. Procida, G.; Cichelli, A.; Lagazio, C.; Conte, L.S. Relationships between Volatile Compounds and Sensory Characteristics in Virgin Olive Oil by Analytical and Chemometric Approaches. J. Sci. Food Agric. 2016, 96, 311–318. [Google Scholar] [CrossRef] [PubMed]
  29. Sensory Analysis of Olive Oil: Method for the Organoleptic Assessment of Virgin Olive Oil. International Olive Council. Available online: https://www.internationaloliveoil.org/wp-content/uploads/2019/11/COI-T20-Doc.-15-REV-10-2018-Eng.pdf (accessed on 19 May 2024).
  30. Angerosa, F.; Lanza, B.; D’Alessandro, N.; Marsilio, V.; Cumitini, S. Olive Oil Off-Odour Compounds Produced by Aspergillus and Penicillium. Acta Hortic. 1999, 474, 695–699. [Google Scholar] [CrossRef]
  31. Aparicio, R.; Rocha, S.M.; Delgadillo, I.; Morales, M.T. Detection of Rancid Defect in Virgin Olive Oil by the Electronic Nose. J. Agric. Food Chem. 2000, 48, 853–860. [Google Scholar] [CrossRef]
  32. Angerosa, F.; Lanza, B.; Marsilio, V. Biogenesis of «fusty» Defect in Virgin Olive Oils. Grasas Aceites 1996, 47, 142–150. [Google Scholar] [CrossRef]
  33. Morales, M.T.; Luna, G.; Aparicio, R. Comparative Study of Virgin Olive Oil Sensory Defects. Food Chem. 2005, 91, 293–301. [Google Scholar] [CrossRef]
  34. Jimenez-Lopez, C.; Carpena, M.; Lourenço-Lopes, C.; Gallardo-Gomez, M.; Lorenzo, J.M.; Barba, F.J.; Prieto, M.A.; Simal-Gandara, J. Bioactive Compounds and Quality of Extra Virgin Olive Oil. Foods 2020, 9, 1014. [Google Scholar] [CrossRef]
  35. Kanavouras, A.; Hernandez-Munoz, P.; Coutelieris, F.A. Packaging of Olive Oil: Quality Issues and Shelf Life Predictions. Food Rev. Int. 2006, 22, 381–404. [Google Scholar] [CrossRef]
  36. Di Serio, M.G.; Giansante, L.; Di Loreto, G.; Di Giacinto, L. Shelf Life of Extra-Virgin Olive Oils: First Efforts toward a Prediction Model. J. Food Process. Preserv. 2018, 42, e13663. [Google Scholar] [CrossRef]
  37. Commission Implementing Regulation (EU) 2022/2105 of 29 July 2022 Laying down Rules on Conformity Checks of Marketing Standards for Olive Oil and Methods of Analysis of the Characteristics of Olive Oil. Off. J. Eur. Union. Available online: https://eur-lex.europa.eu/legal-content/EN/TXT/PDF/?uri=CELEX:32022R2105 (accessed on 19 May 2024).
  38. Commission Regulation (EC) No 1989/2003 of 6 November 2003 Regulation (EEC) No 2568/91 on the Characteristics of Olive Oil and Olive-Pomace Oil and on the Relevant Methods of Analysis. Off. J. Eur. Union. Available online: https://eur-lex.europa.eu/LexUriServ/LexUriServ.do?uri=OJ%3AL:2003:295:0057:0077%3AEN%3APDF (accessed on 19 May 2024).
  39. Commission Delegated Regulation (EU) 2022/2104 of 29 July 2022 Supplementing Regulation (EU) No 1308/2013 of the European Parliament and of the Council as Regards Marketing Standards for Olive Oil, and Repealing Commission Regulation (EEC) No 2568/91 and Commission Implementing Regulation (EU) No 29/2012. Off. J. Eur. Union. Available online: https://eur-lex.europa.eu/legal-content/EN/TXT/PDF/?uri=CELEX:32022R2104 (accessed on 19 May 2024).
  40. Aparicio, R.; Morales, M.T.; García-González, D.L. Towards New Analyses of Aroma and Volatiles to Understand Sensory Perception of Olive Oil. Eur. J. Lipid Sci. Technol. 2012, 114, 1114–1125. [Google Scholar] [CrossRef]
  41. Sensory Analysis of Olive Oil. Standard Guide for the Selection, Training and Quality Control of Virgin Olive Oil Tasters. Qualifications of Tasters, Panel Leaders and Trainers. International Olive Council. Available online: https://www.internationaloliveoil.org/wp-content/uploads/2022/10/COI-T.20-Doc-14-REV-7-2021-EN.pdf (accessed on 19 May 2024).
  42. Romero, I.; García-González, D.L.; Aparicio-Ruiz, R.; Morales, M.T. Validation of SPME–GCMS Method for the Analysis of Virgin Olive Oil Volatiles Responsible for Sensory Defects. Talanta 2015, 134, 394–401. [Google Scholar] [CrossRef] [PubMed]
  43. Morales, M.T.; Aparicio-Ruiz, R.; Aparicio, R. Chromatographic Methodologies: Compounds for Olive Oil Odor Issues. In Handbook of Olive Oil: Analysis and Properties; Springer: Berlin/Heidelberg, Germany, 2013; pp. 261–309. [Google Scholar] [CrossRef]
  44. Flamini, G. Headspace Analyses in Valuable and Functional Foods: Application of SPME in the Quality Control and Characterization of Olive Oils. Curr. Anal. Chem. 2007, 3, 149–159. [Google Scholar] [CrossRef]
  45. Oliver-Pozo, C.; Aparicio-Ruiz, R.; Romero, I.; García-González, D.L. Analysis of Volatile Markers for Virgin Olive Oil Aroma Defects by SPME-GC/FID: Possible Sources of Incorrect Data. J. Agric. Food Chem. 2015, 63, 10477–10483. [Google Scholar] [CrossRef]
  46. Martins, N.; Jiménez-Morillo, N.T.; Freitas, F.; Garcia, R.; Gomes da Silva, M.; Cabrita, M.J. Revisiting 3D van Krevelen Diagrams as a Tool for the Visualization of Volatile Profile of Varietal Olive Oils from Alentejo Region, Portugal. Talanta 2020, 207, 120276. [Google Scholar] [CrossRef]
  47. ben Hammouda, I.; Freitas, F.; Ammar, S.; Da Silva, M.D.R.G.; Bouaziz, M. Comparison and Characterization of Volatile Compounds as Markers of Oils Stability during Frying by HS–SPME-GC/MS and Chemometric Analysis. J. Chromatogr. B 2017, 1068–1069, 322–334. [Google Scholar] [CrossRef] [PubMed]
  48. Van Den Dool, H.A.N.D.; Kratz, P.D. A Generalization of the Retention Index System Including Linear Temperature Programmed Gas—Liquid Partition Chromatography. J. Chromatogr. A 1963, 11, 463–471. [Google Scholar] [CrossRef]
  49. Saracino, F.; Brinco, J.; Gago, D.; Gomes da Silva, M.; Boavida Ferreira, R.; Ricardo-Da-silva, J.; Chagas, R.; Ferreira, L.M. DCMC as a Promising Alternative to Bentonite in White Wine Stabilization. Impact on Protein Stability and Wine Aromatic Fraction. Molecules 2021, 26, 6188. [Google Scholar] [CrossRef] [PubMed]
  50. Da Silva, M.D.G.; Freitas, A.M.C.; Cabrita, M.J.B.; Garcia, R.; da Silva, M.D.R.G.; Freitas, A.M.C.; Cabrita, M.J.B.; Garcia, R. Olive Oil Composition: Volatile Compounds. In Olive Oil—Constituents, Quality, Health Properties and Bioconversions; IntechOpen: Rijeka, Croatia, 2012. [Google Scholar] [CrossRef]
  51. Linstrom, P.J.; Mallard, W.G. The NIST Chemistry WebBook: A Chemical Data Resource on the Internet. J. Chem. Eng. Data 2001, 46, 1059–1063. [Google Scholar] [CrossRef]
  52. Garcia-Oliveira, P.; Jimenez-Lopez, C.; Lourenço-Lopes, C.; Chamorro, F.; Pereira, A.G.; Carrera-Casais, A.; Fraga-Corral, M.; Carpena, M.; Simal-Gandara, J.; Prieto, M.A. Evolution of Flavors in Extra Virgin Olive Oil Shelf-Life. Antioxidants 2021, 10, 368. [Google Scholar] [CrossRef]
  53. Kiritsakis, A.K. Flavor Components of Olive Oil—A Review. JAOCS J. Am. Oil Chem. Soc. 1998, 75, 673–681. [Google Scholar] [CrossRef]
  54. Angerosa, F.; Mostallino, R.; Basti, C.; Vito, R. Virgin Olive Oil Odour Notes: Their Relationships with Volatile Compounds from the Lipoxygenase Pathway and Secoiridoid Compounds. Food Chem. 2000, 68, 283–287. [Google Scholar] [CrossRef]
  55. Tena, N.; Lazzez, A.; Aparicio-Ruiz, R.; García-González, D.L. Volatile Compounds Characterizing Tunisian Chemlali and Chétoui Virgin Olive Oils. J. Agric. Food Chem. 2007, 55, 7852–7858. [Google Scholar] [CrossRef]
  56. Reiners, J.; Grosch, W. Odorants of Virgin Olive Oils with Different Flavor Profiles. J. Agric. Food Chem. 1998, 46, 2754–2763. [Google Scholar] [CrossRef]
  57. Esti, M.; Contini, M.; Moneta, E.; Sinesio, F. Phenolics Compounds and Temporal Perception of Bitterness and Pungency in Extra-Virgin Olive Oils: Changes Occurring throughout Storage. Food Chem. 2009, 113, 1095–1100. [Google Scholar] [CrossRef]
  58. Angerosa, F.; Camera, L.; D’Alessandro, N.; Mellerio, G. Characterization of Seven New Hydrocarbon Compounds Present in the Aroma of Virgin Olive Oils. J. Agric. Food Chem. 1998, 46, 648–653. [Google Scholar] [CrossRef] [PubMed]
  59. Neugebauer, A.; Schieberle, P.; Granvogl, M. Characterization of the Key Odorants Causing the Musty and Fusty/Muddy Sediment Off-Flavors in Olive Oils. J. Agric. Food Chem. 2021, 69, 14878–14892. [Google Scholar] [CrossRef] [PubMed]
  60. Zhu, H.; Wang, S.C.; Shoemaker, C.F. Volatile Constituents in Sensory Defective Virgin Olive Oils. Flavour Fragr. J. 2016, 31, 22–30. [Google Scholar] [CrossRef]
  61. Manai, H.; Mahjoub-Haddada, F.; Oueslati, I.; Daoud, D.; Zarrouk, M. Characterization of Monovarietal Virgin Olive Oils from Six Crossing Varieties. Sci. Hortic. 2008, 115, 252–260. [Google Scholar] [CrossRef]
  62. Ilyasoglu, H.; Ozcelik, B.; Van Hoed, V.; Verhe, R. Cultivar Characterization of Aegean Olive Oils with Respect to Their Volatile Compounds. Sci. Hortic. 2011, 129, 279–282. [Google Scholar] [CrossRef]
  63. Angerosa, F.; Basti, C.; Vito, R. Virgin Olive Oil Volatile Compounds from Lipoxygenase Pathway and Characterization of Some Italian Cultivars. J. Agric. Food Chem. 1999, 47, 836–839. [Google Scholar] [CrossRef]
  64. Dhifi, W.; Angerosa, F.; Serraiocco, A.; Oumar, I.; Hamrouni, I.; Marzouk, B. Virgin Olive Oil Aroma: Characterization of Some Tunisian Cultivars. Food Chem. 2005, 93, 697–701. [Google Scholar] [CrossRef]
Figure 1. Graphical representation of the 3 main steps of the study.
Separations 11 00167 g001
Figure 2. Sensory classification of Arbequina variety and Community EVOO at the beginning of the study.
Separations 11 00167 g002
Figure 3. Chromatograms, on the same scale, of the Arbequina variety (top) versus Community (bottom). The compounds with significant differences over time are represented in the chromatograms. The peak numbers are identified in Table 2.
Separations 11 00167 g003
Figure 4. Samples analyzed with indication of when they are considered EVOO by the sensory panel (green), the moment the defect was detected (red) and the month in which part of the panel indicated the presence of the defect but without unanimity (yellow).
Separations 11 00167 g004
Figure 5. Graphical representation of the relative percentages for each functional group of Arbequina variety versus Community.
Separations 11 00167 g005
Figure 6. Evolution of compounds derived from the LOX pathway for the Arbequina and Community varieties with and without the addition of defects over 14 months. For each dataset, different letters above the bars indicate significant differences (p < 0.05) between time points.
Separations 11 00167 g006
Figure 7. PCA biplot of VOCs selected by statistical analysis for the Arbequina olive oil, with and without added defects, over 14 months. In red shade are the samples disqualified by the sensory panel. The loadings (compounds) were scaled by a factor of 12.3 for legibility.
Separations 11 00167 g007
Figure 8. PCA biplot of VOCs selected by statistical analysis for the Community olive oil, with and without added defects, over 14 months. In red shade are the samples disqualified by the sensory panel. The loadings (compounds) were scaled by a factor of 4.5 for legibility.
Separations 11 00167 g008
Figure 9. Variation in the E-2-hexenal/acetic acid ratio depending on the degree of mixing of EVOO Arbequina with declassified olive oil. Data on the values of the respective ratios are indicated. Mixtures that were disqualified by the sensory panel are red shaded.
Separations 11 00167 g009
Figure 10. Variation in the E-2-hexenal/acetic acid ratio over time for different EVOO varieties. Samples disqualified by the sensory panel are represented by a red marker, and by a yellow marker when on the threshold of disqualification. The red shaded area represents the ratio below 5.
Separations 11 00167 g010
Table 1. Description of the samples used in the study.
Description of Samples
Monitoring of VOCsArMonovarietal EVOO from the Arbequina olives
Ar mustyArbequina EVOO doped with 5% (v/v) of disqualified olive oil with evident musty defect
Ar rancidArbequina EVOO doped with 5% (v/v) of disqualified olive oil with evident rancidity defect
Ar fustyArbequina EVOO doped with 5% (v/v) of disqualified olive oil with evident fusty defect
CoCommunity EVOO from local producers
Co mustyCommunity EVOO doped with 5% (v/v) of disqualified olive oil with evident musty defect
Co rancidCommunity EVOO doped with 5% (v/v) of disqualified olive oil with evident rancidity defect
Co fustyCommunity EVOO doped with 5% (v/v) of disqualified olive oil with evident fusty defect
Monitoring of the
E-2-hexenal/Acetic Acid
0% DefMonovarietal EVOO from the Arbequina olives
20% DefArbequina EVOO doped with 20% (v/v) of disqualified Arbequina olive oil (OO)
30% DefArbequina EVOO doped with 30% (v/v) of disqualified Arbequina OO
40% DefArbequina EVOO doped with 40% (v/v) of disqualified Arbequina OO
50% DefArbequina EVOO doped with 50% (v/v) of disqualified Arbequina OO
60% DefArbequina EVOO doped with 60% (v/v) of disqualified Arbequina OO
70% DefArbequina EVOO doped with 70% (v/v) of disqualified Arbequina OO
80% DefArbequina EVOO doped with 80% (v/v) of disqualified Arbequina OO
100% DefDisqualified Arbequina OO
Confirmation of the
E-2-hexenal/Acetic Acid
PiRIrrigation Picual EVOO
Arb aArbequina EVOO
PiDDryland Picual EVOO
Arb bArbequina EVOO
HojHojiblanca EVOO
Hoj xDisqualified Hojiblanca OO
Arb xDisqualified Arbequina OO
PiD xDisqualified Dryland Picual OO
PiR xDisqualified Irrigation Picual OO
Table 3. Compounds with statistical differences (p < 0.05) determined by ANOVA.
Compound No.Compound Name
2Ethyl Acetate
3Isopropyl Alcohol
10Hexyl methyl ether
111-Penten-3-one
133-Hexen-1-ol, methyl ether
14Ethyl butyrate
18Butyl acetate
19Hexanal
232-Pentanol
242-Pentenal
281-Penten-3-ol
33Heptanal
34Isopentanol
35E-2-Hexenal
40β-Ocimene
41Hexyl acetate
432-Penten-1-ol
453-Hexenyl Acetate
47Hexanol
48E-3-Hexenol
50Z-3-Hexenol
54E-2-Hexenol
55Z-2-Hexenol
57Acetic acid
622-Heptenol
63Propanoic acid
71Butanoic acid
75Z-2-Decenal
78α-Farnesene
79Hexanoic acid
Disclaimer/Publisher’s Note: The statements, opinions and data contained in all publications are solely those of the individual author(s) and contributor(s) and not of MDPI and/or the editor(s). MDPI and/or the editor(s) disclaim responsibility for any injury to people or property resulting from any ideas, methods, instructions or products referred to in the content.

