Article

Remediation of Methyl Orange Dye in Aqueous Solutions by Green Microalgae (Bracteacoccus sp.): Optimization, Isotherm, Kinetic, and Thermodynamic Studies

by
Ahmad Al Shra’ah
1,*,
Abdullah T. Al-Fawwaz
2,
Mohammed M. Ibrahim
1 and
Eid Alsbou
3
1
Department of Chemistry, Faculty of Science, Al al-Bayt University, P.O. Box 130040, Al-Mafraq 25113, Jordan
2
Department of Biological Sciences, Al al-Bayt University, P.O. Box 130040, Al-Mafraq 25113, Jordan
3
Department of Chemistry, Al-Hussein Bin Talal University, Ma’an P.O. Box 71111, Jordan
*
Author to whom correspondence should be addressed.
Separations 2024, 11(6), 170; https://doi.org/10.3390/separations11060170
Submission received: 8 May 2024 / Revised: 21 May 2024 / Accepted: 28 May 2024 / Published: 30 May 2024
(This article belongs to the Special Issue Adsorption and Remediation of Emerging Pollutants from Water and Soil)

Abstract

:
This study aims to assess the ability of old, immobilized fresh, and free fresh green microalgae (a Bracteacoccus sp.) to remove methyl orange (MO) dye from aqueous solutions. The effects of four factors, including initial MO concentration (5–25 mg L−1), adsorbent dose (0.02–0.10 g mL−1), temperature (4–36 °C), and contact time (5–95 min), were examined. The Box–Behnken design (BBD) was used to determine the number of required experiments and the optimal conditions expected to provide the highest removal percentage of MO dye from aqueous solutions. The experimental data were applied to four isotherm models (Langmuir, Freundlich, Dubinin–Radushkevich (D–R), and Temkin isotherm models) and three kinetic models (pseudo–first–order, pseudo–second–order, and Elovich kinetic models). The results indicate that the highest removal of MO (97%) could be obtained in optimal conditions consisting of an initial MO concentration of 10.0 mg L−1, an adsorbent dose of 0.10 g mL−1, a temperature of 20 °C, and a contact time of 75 min. Moreover, the experimental data were best fitted by the Langmuir and Temkin isotherm models and followed a pseudo-second-order kinetic model. The interaction between MO and the Bracteacoccus sp. was confirmed by UV and ESI/MS analyses, indicating that MO removal occurred via both sorption and degradation processes.

1. Introduction

Industrial activities are significantly increasing, resulting in the discharge of massive amounts of effluent into the environment. This leads to water pollution, a critical issue that requires significant attention [1]. Many industries, such as textile, cosmetic, leather, paper, plastic, printing, rubber, and pharmaceutical industries, produce effluents containing synthetic dyes [2]. These synthetic dyes are classified into ionic (cationic and anionic) and nonionic (vat and disperse) dyes. In terms of toxicity, ionic dyes are more toxic because they are more reactive and carcinogenic [3]. Methyl orange (MO) dye is an example of ionic dye and is widely used in the textile industry and in research laboratories as an indicator in acid–base titrations [4]. MO dye can cause skin allergies, death (in the case of exposure to a high MO concentration), vomiting, and diarrhea [5]. Therefore, the uptake of synthetic dyes from contaminated water is a necessary step to protect the aquatic environment from pollution. Several techniques, such as membrane filtration, coagulation–flocculation, ozonation, photocatalytic oxidation, electrochemical oxidation, and adsorption, have been used to remove synthetic dyes from aqueous media [6]. Among these techniques, adsorption is considered the most appropriate for its several advantages, such as simplicity, low cost, environmental friendliness, effectiveness, and ease of use [7].
In general, the adsorbents used for adsorption of MO dye from aqueous solutions include biosorbents, activated carbon, biochar, minerals and clays, resins and polymers, nanoparticles, and composites [8]. Among them, biosorbents are preferred for being easily available, environmentally friendly (they do not form intermediate products), highly efficient, regeneratable, and low-cost. Based on biosorbent sources, biosorbents can be classified into (i) natural biosorbents (e.g., straw, peels, chitosan, zeolites, etc.); (ii) microbial biomass (e.g., algae, bacteria, yeasts, and fungi); (iii) agricultural and industrial wastes (e.g., wheat bran, sawdust, etc.) [9]. Using algae in bioremediation has been described as an attractive and promising method because algae grow quickly and are highly effective in removing pollutants from aquatic systems. [10]. In previous studies, algal biosorbents such as Fucus vesiculosus [11], Oedogonium subplagiostomum-AP1 [12], Chlorella species, and algal blooms [13] were used to remove MO from aqueous solutions with reasonable removal efficiency (>50%). However, the optimization of MO removal to obtain a high removal efficiency at room temperature within a short time, the confirmation of MO removal/degradation, and the study the effect of immobilization of a biosorbent on the efficiency of MO removal from aqueous solutions require further investigation. In the literature, there are few studies related to the use of green microalgae for the treatment of wastewater polluted by dyes. Therefore, the current study adds new results regarding MO removal using green microalgae (a Bracteacoccus sp.) as a green method for the treatment of wastewater containing synthetic dyes.
In fact, adsorptive removal mainly depends on factors such as initial adsorbate concentration, adsorbent dose, temperature, and contact time [14]. Therefore, the optimization of these experimental variables is an essential step that can be achieved by the traditional experimental method (i.e., studying the effect of each factor while keeping the other factors constant), but the main drawbacks of this strategy are ignoring the interactions between the variables and needing a larger number of experiments as the number of variables increases. Consequently, an alternative experimental strategy is using response surface methodology (RSM) as a statistical and mathematical tool to design the experiments. RSM takes into account the interactions between the experimental variables and easily determines the optimum conditions that can provide the best response [15]. RSM can use a full or fractional factorial design, a central composite design (CCD), a Box–Behnken design (BBD), and a Doehlert matrix design (DMD) [16]. Amongst them, the BBD is favored for achieving better results [17]; therefore, it was used in the current study.
The main objectives of the current study were (i) to evaluate the ability of the Bracteacoccus sp. (old, fresh, and immobilized) to remove MO dye from aqueous solution; (ii) to optimize the experimental variables, including initial MO concentration, adsorbent dose, temperature, and contact time using the BBD; (iii) to describe the equilibrium and the adsorption kinetics of MO removal by a Bracteacoccus sp.; (iv) to investigate the reusability of the Bracteacoccus sp. for MO removal from aqueous solutions.

2. Materials and Methods

2.1. Materials

All chemicals used in the current study were of analytical grade and were used without further purification. MO dye (Table 1) was selected as a model anionic dye and purchased from Sigma Aldrich. A stock solution of MO dye (1000 mg L−1) was prepared by dissolving a precise amount (1.000 g) of MO dye in 1000 mL of distilled water and was then used to prepare a set of MO diluted solutions with concentrations in the range of 5–25 mg L−1. A calibration curve using the MO solutions in the concentration range of 5–25 mg L−1 was established.

2.2. Sampling of Green Microalgae

Green microalgae samples were collected from ground water in the west part of Mafraq city in Jordan and directly transferred to the laboratory. Subsequently, green microalgae cultivation was carried out in flasks containing Bold Basal Medium (BBM). Furthermore, the isolation of algal colonies was conducted by establishing a series of subcultures in BBM agar plates. A pure culture was prepared from algal colonies and then examined microscopically. Routine cultivation was conducted at 25 ± 2 °C under a light intensity of 20.25 µEm−2s−1 for 25 days. A pure culture was chosen and was identified as consisting of a Bracteacoccus sp.

2.3. Immobilization of the Bracteacoccus sp.

The immobilization of the Bracteacoccus sp. was accomplished based on the procedure described in a previous study [19]. In detail, a solution of sodium alginate (3%) was well mixed with a suspension of the Bracteacoccus sp. in a 2:1 ratio (v/v). The mixture was then transferred dropwise into a calcium chloride (CaCl2) solution (0.03 M) to form adsorbent beads, remaining for 30 min into the CaCl2 solution to become more solid. Thereafter, the beads were washed three times with distilled water and stored in the fridge at 4 °C for later use.

2.4. Characterization of the MO Solutions

The analysis of the MO dye solutions before and after adding the Bracteacoccus sp. was accomplished using (i) a UV Vis diode-array spectrophotometer (Specord S 600-Molecular Spectroscopy, Germany) operated in the wavelength range of 210–790 nm, with a quartz cuvette; (ii) a high-resolution TOF-MS/MS system (impact II Bruker, Bruker Daltonik, Bremen, Germany) and an impact II ESI-Q-TOF system equipped with a Bruker Daltonik Elute UPLC system (Bremen, Germany), as shown in Supplementary Materials.

2.5. Adsorption Experiments

The experiments of MO adsorption from an aqueous solution using the free fresh Bracteacoccus sp. were conducted in batch mode. The effect of several experimental factors, such as initial MO concentration, adsorbent dose, temperature, and contact time, on MO removal from aqueous solutions was investigated. In detail, 20.0 mL of MO solution (5–25 mg L−1) was transferred to a 50.0 mL test tube, and then a desired adsorbent dose (0.02–0.10 g mL−1) was added at a specific temperature in the range of 4–36 °C. The mixture was kept in a dark place on the lab bench for a desired time (5–95 min), and then a small portion (~2.0 mL) of the mixture was withdrawn, and its absorbance was measured at 464 nm. All the experiments were conducted in triplicate. The initial pH of the MO solutions was 4, which was described as the optimum pH value for acquiring the highest removal % of MO from aqueous solutions [11].
Subsequently, the removal efficiency percentage (R%) of MO dye and the adsorption capacity ( q m ), which represents the amount of dye that can be absorbed by 1.0 g of adsorbent (mg g−1), was calculated using Equations (1) and (2), respectively [20].
R % = C o C t C o × 100 %
q m = ( C o C t ) V m
where C o (mg L−1) is the initial concentration of the MO dye solution, C t (mg L−1) is the concentration of the MO dye solution at time t, V (L) is the volume of the MO dye solution, and m (g) is the adsorbent amount used.
Design Expert version 8 was used to determine the required experiments, and a BBD based on RSM with a quadratic model was used. These experiments allowed for studying the effects of four experimental variables, namely, initial MO concentration (A), adsorbent dose (B), temperature (C), and contact time (D), each set at three levels (−1, 0, +1), as summarized in Table 2. Consequently, the overall required experiments were 29, as shown in Table 3, and the number of experiments (N) was determined using the following equation (Equation (3)) [21]:
N = 2K(K − 1) + Mo
where K and Mo are the number of experimental variables and the center points, respectively.

2.6. Isotherm Study

Four common isotherm models, namely, Langmuir [22] (Equation (4)), Freundlich [23] (Equation (6)), Dubinin–Radushkevich (D-R) [24] (Equation (7)), and Temkin [25] (Equation (10)), were applied to the experimental data.
C e q e = 1 K L q e m a x + C e q e m a x
R L = 1 1 + K L C o
where q e (mg g−1) is the MO amount adsorbed at equilibrium, q e m a x is the maximum adsorption capacity (mg g−1), K L (L mg−1) is the Langmuir constant related to the adsorbent–adsorbate affinity and associated with sorption energy, and RL, expressed in Equation (5), is a dimensionless equilibrium constant used to describe the adsorption process as irreversible (RL = 0), linear (RL = 1), favorable (0 < RL < 1), or unfavorable (RL > 1). The parameters q e m a x and KL are calculated by plotting a linear relationship between Ce/qe and Ce to obtain a slope of 1/ q e m a x and an intercept of 1/(KL q e m a x ).
l o g q e = l o g K f + 1 n l o g C e
where K f ((mg g−1)(L mg−1)1/n) is the Freundlich isotherm constant, and n represents the heterogeneity factor (i.e., the non-linearity degree between the concentration of the dye solution and the absorption process), with the adsorption process being favorable when n > 1 [26]. By plotting a linear relationship between logCe and l o g q e , the n and Kf values are calculated from the slope and intercept, respectively.
l n q e = l n q m + K D   ε 2
E = 1 2 K D
ε = R T l n   ( 1 + 1 C e )
where KD is the absorption energy constant (mol2/kJ2) used to calculate the average of sorption free energy E (KJ mol−1) provided by Equation (8), with adsorption being physical (E < 8 KJ mol−1), based on ion exchange (E = 8–16 KJ mol−1), or chemisorption (E = 20–40 KJ mol−1) [27]. In Equation (9), ε is the Polanyi potential (KJ mol−1), R is the universal gas constant (8.314 × 10⁻³ KJ mol−1), and T is the temperature (K). By plotting a linear relationship between lnqe and ε2, the slope (K) and intercept (lnqm) are obtained.
q e = R T b T l n A T + R T b T l n C e
B T = R T b T
where bT is the Temkin constant and refers to the sorption heat (J mol−1), and AT is the Temkin isotherm constant (L g−1). The AT, BT, and bT values can be calculated by plotting a liner relationship between qe and lnCe to obtain the slope (BT) and the intercept (BTlnAT).

2.7. Kinetic Study

The experimental data were analyzed using three common kinetic models, namely, the pseudo–first–order (Equation (12)) [28], pseudo–second–order (Equation (13)) [29], and Elovich (Equation (14)) [30] kinetic models.
ln q e q t = ln q e t K 1
t q t = 1 K 2 q e 2 + t q e
q t = 1 β ln α · β + 1 β ln t
where q t (mg g−1) is the MO amount adsorbed at time t (min), K1 is the adsorption rate constant of the pseudo–first–order model (min−1), K2 is the adsorption rate constant of the pseudo–second-order model (g mg−1 min−1), β is the desorption constant (g mg−1), and α is the initial adsorption rate (mg g−1 min−1).

2.8. Thermodynamics

Three common thermodynamic parameters, namely, the standard changes in Gibbs free energy (ΔG°), enthalpy (ΔH°), and entropy (ΔS°) were determined to identify the adsorption type [31]. Therefore, the ΔG° value of MO adsorption by the Bracteacoccus sp. at three different temperatures (4, 20, and 36 °C) could be calculated by Equation (15) while keeping the other three factors constant at their optimum values (i.e., Co = 10 mg L−1, adsorbent dose = 0.10 g mL−1, and contact time = 75 min). In addition, the ΔH° and ΔS° values were determined using the Van’t Hoff equation (Equation (16)) by plotting lnkd vs. 1/T, and ΔG° could be calculated at a specific temperature using Equation (17) [28].
Δ G ° = R T l n K d
l n k d = Δ S o R + Δ H ° R T
Δ G ° = Δ H ° T Δ S °
where R is the universal gas constant (8.314 J mol−1 K−1), T is the absolute temperature in kelvin (K), and K d is the distribution coefficient, which equals the ratio between the amount of MO dye adsorbed and the MO concentration at equilibrium ( K d = qe/Ce).

2.9. Regeneration

The reusability of an adsorbent is a significant factor in reducing the cost of the removal process [32]. Therefore, the Bracteacoccus sp. used in the current study was reused up to five times after its separation from an aqueous solution by centrifugation and washing for three times with distilled water.

3. Results

3.1. UV-Vis Analysis

The MO concentration before and after treatment with the Bracteacoccus sp. could be easily quantified using UV-vis spectrophotometry. Herein, the mixture containing the MO dye solution and the Bracteacoccus sp. was left on the lab bench in the dark for a sufficient contact time of 75 min. Then, the mixture was centrifuged, filtered, and analyzed using a UV spectrophotometer in continuous mode in the range of 200–800 nm at 10 nm wavelength intervals. The analysis results are shown in Figure 1, indicating maximum absorbance of MO at 464 nm and a great reduction in the area under the curve at 464 nm for the MO solution after treatment with the Bracteacoccus sp. (i.e., the 464 nm peak vanished). In addition, clear changes were observed for the 230 and 270 nm peaks associated with benzene ring absorption, with the 230 nm peak disappearing, and the 270 nm peak becoming broader. These findings could be due to the destruction of the azo bond in the MO molecules and the formation of intermediate compounds comprising benzene rings [33]. Another crucial observation was that the color of the MO solution that initially was reddish orange gradually changed after the addition of the Bracteacoccus sp., and the solution became entirely colorless after 75 min. Therefore, the decolorization of the MO solution by the Bracteacoccus sp. could occur as a result of both degradation and sorption processes (binding of the dye molecules by functional groups such as hydroxyl, carboxylate, phosphate, amino, and sulfate groups on the algal surface) [19].
In addition, a microscopic view of the Bracteacoccus sp. before and after the addition of MO dye is shown in Figure 2. Before MO absorption, the surface morphology of the Bracteacoccus sp. was clear and homogeneous, but after MO absorption, the surface morphology became rough and heterogenous.

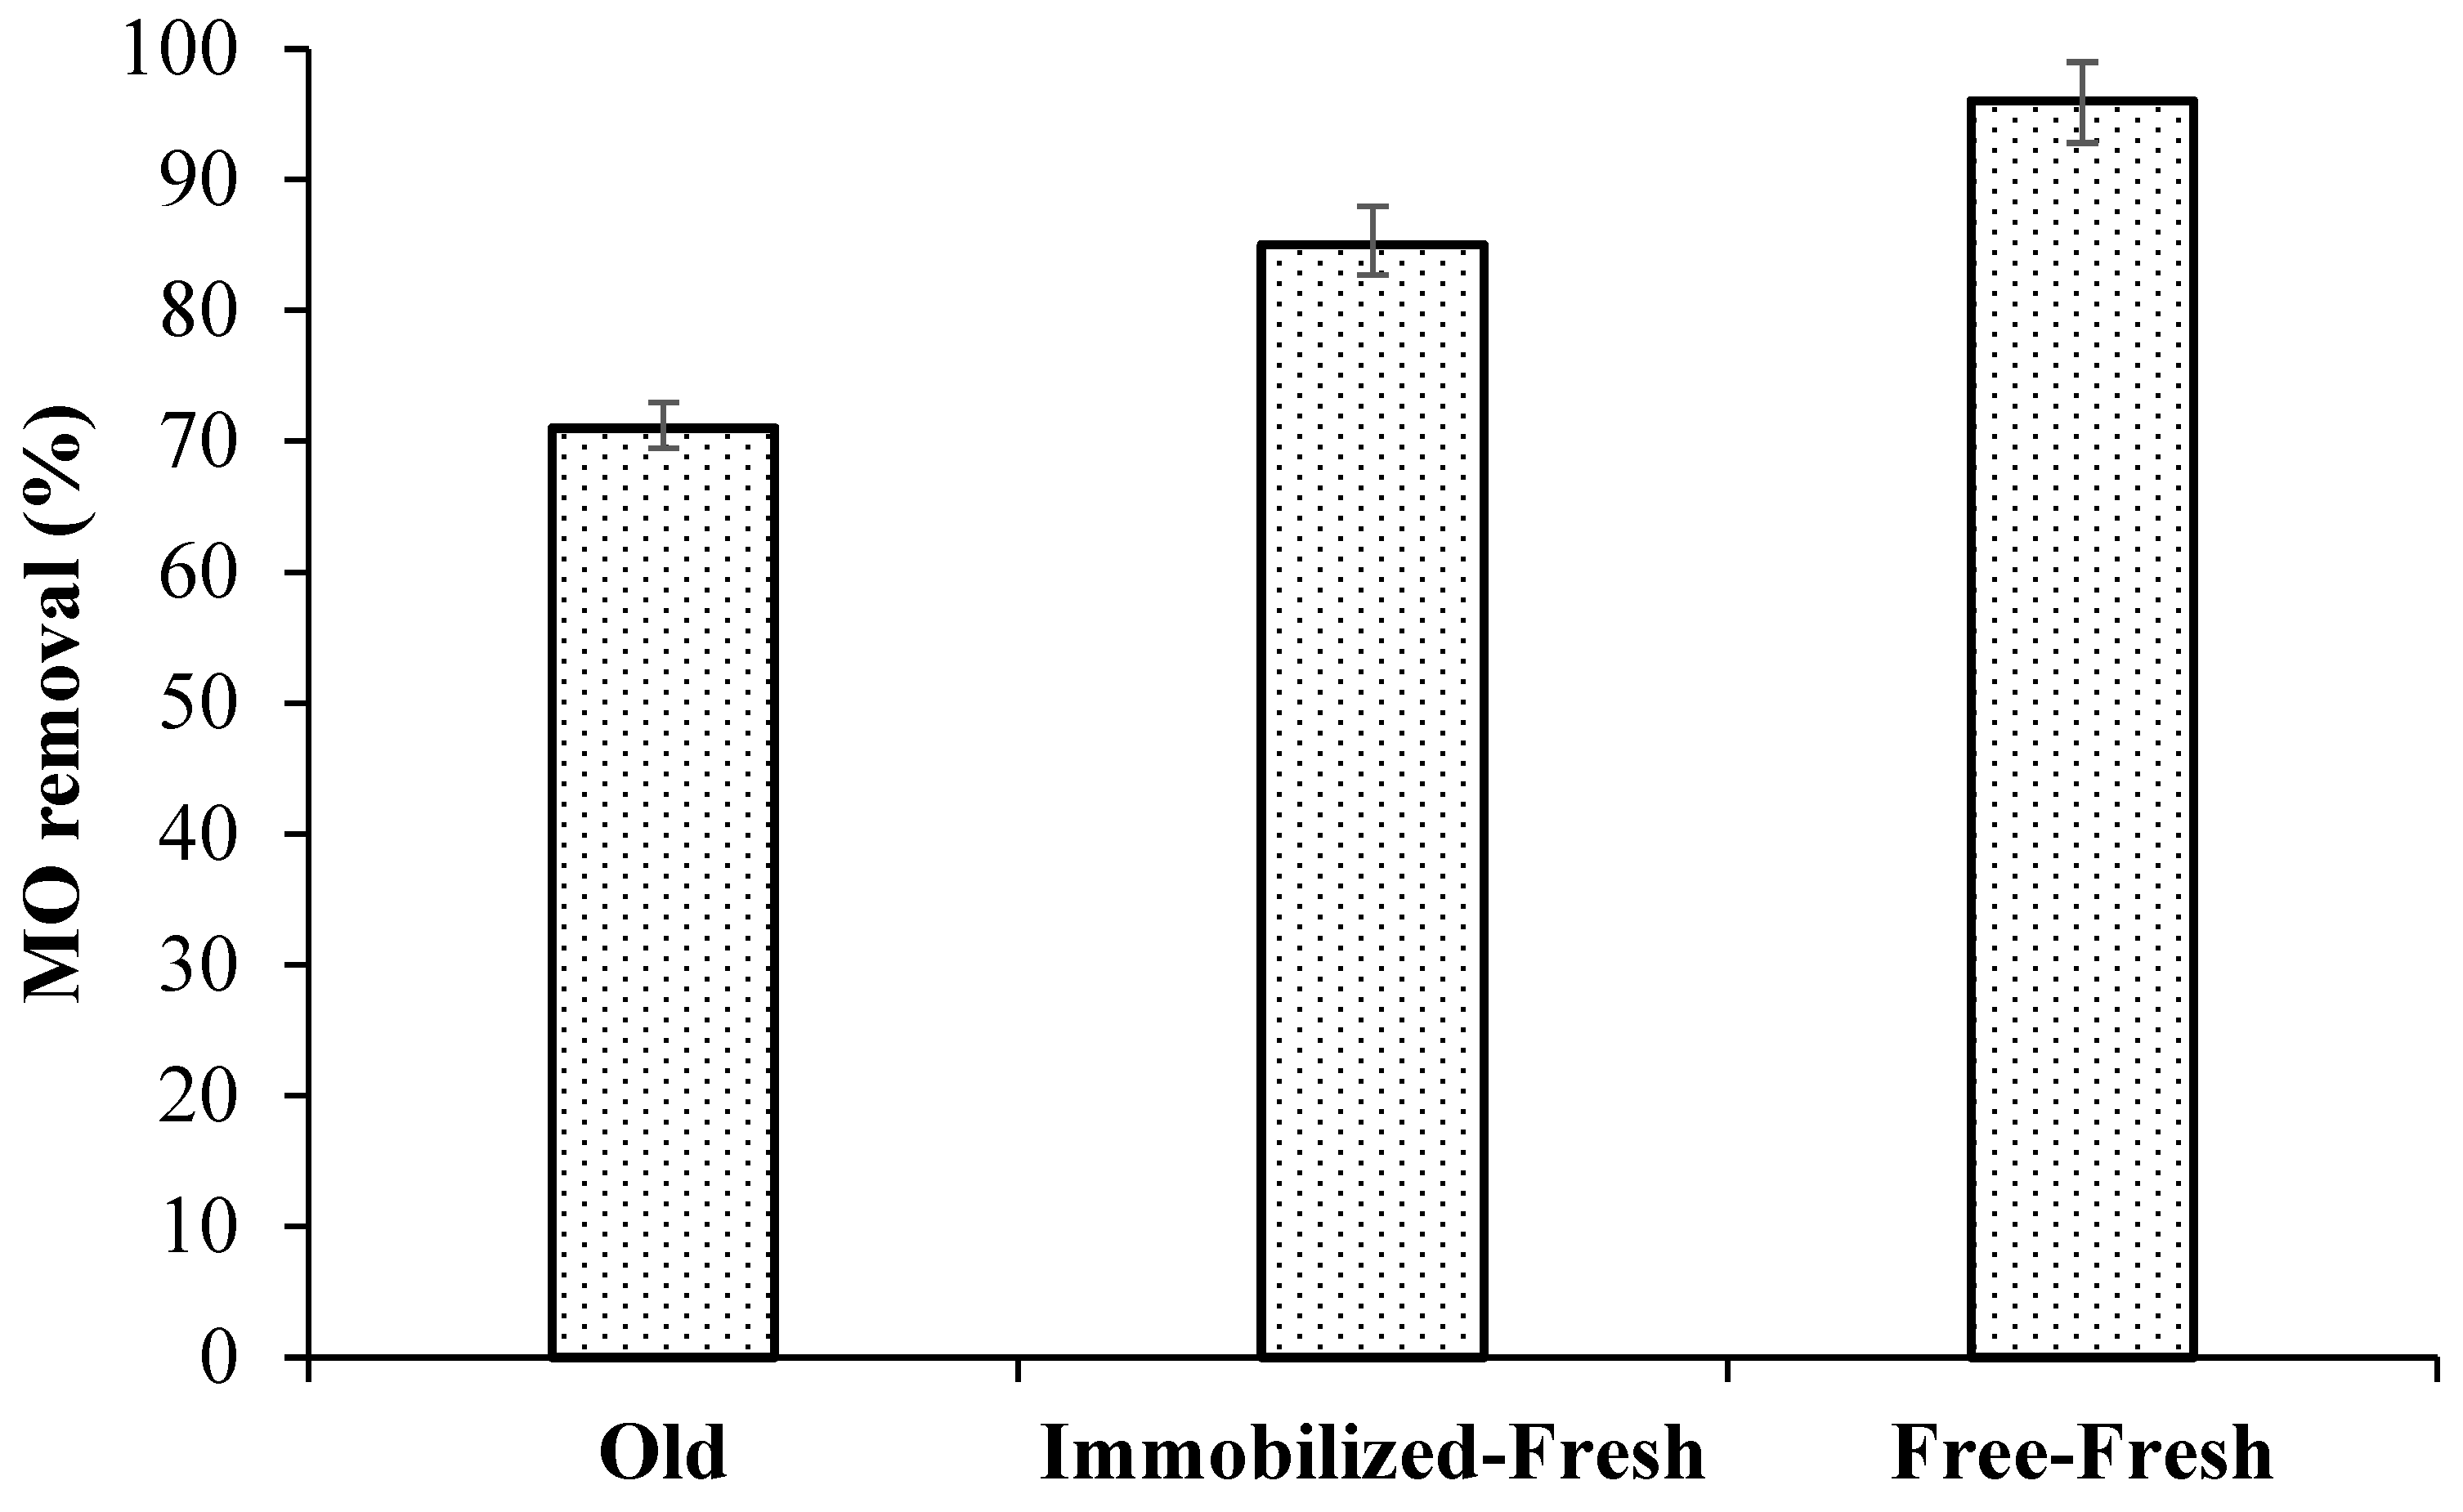
3.2. A Comparison between Old, Immobilized Fresh, and Free Fresh Bracteacoccus sp.

The Bracteacoccus sp. as a biosorbent was used in three statuses, namely, old, immobilized fresh, and free fresh, to investigate its ability to remove the MO dye from aqueous solutions. Based on Figure 3, the free fresh Bracteacoccus sp. achieved the highest removal efficiency of MO (97%) from aqueous solutions, followed by the immobilized fresh (85%) and the old (71%) Bracteacoccus sp., respectively. This behavior may be due to the high ability of the free fresh Bracteacoccus sp. to interact with the MO dye molecules. In contrast, the immobilized fresh Bracteacoccus sp. showed a lower removal efficiency because the Bracteacoccus sp. molecules were shielded on the beads, which hindered the direct interaction between the MO molecules and the Bracteacoccus sp., resulting in a lower efficiency of MO removal. The old Bracteacoccus sp. achieved the lowest removal efficiency, as its removal activity was lower, and that adversely reflected on its ability to remove MO from the aqueous solutions.

3.3. Optimization of Experimental Factors Using a BBD

The results of the experiments are listed in Table 4. The analysis of the experimental data related to MO dye removal using the free fresh Bracteacoccus sp. was achieved using Design Expert version 8, which provided a plot for each factor, displayed in Figure 4. In addition, 3D plots, including illustrations of the interactive effects of the experimental variables, are shown in Figure 5. The effects of these experimental factors can be explained in more detail as follows.

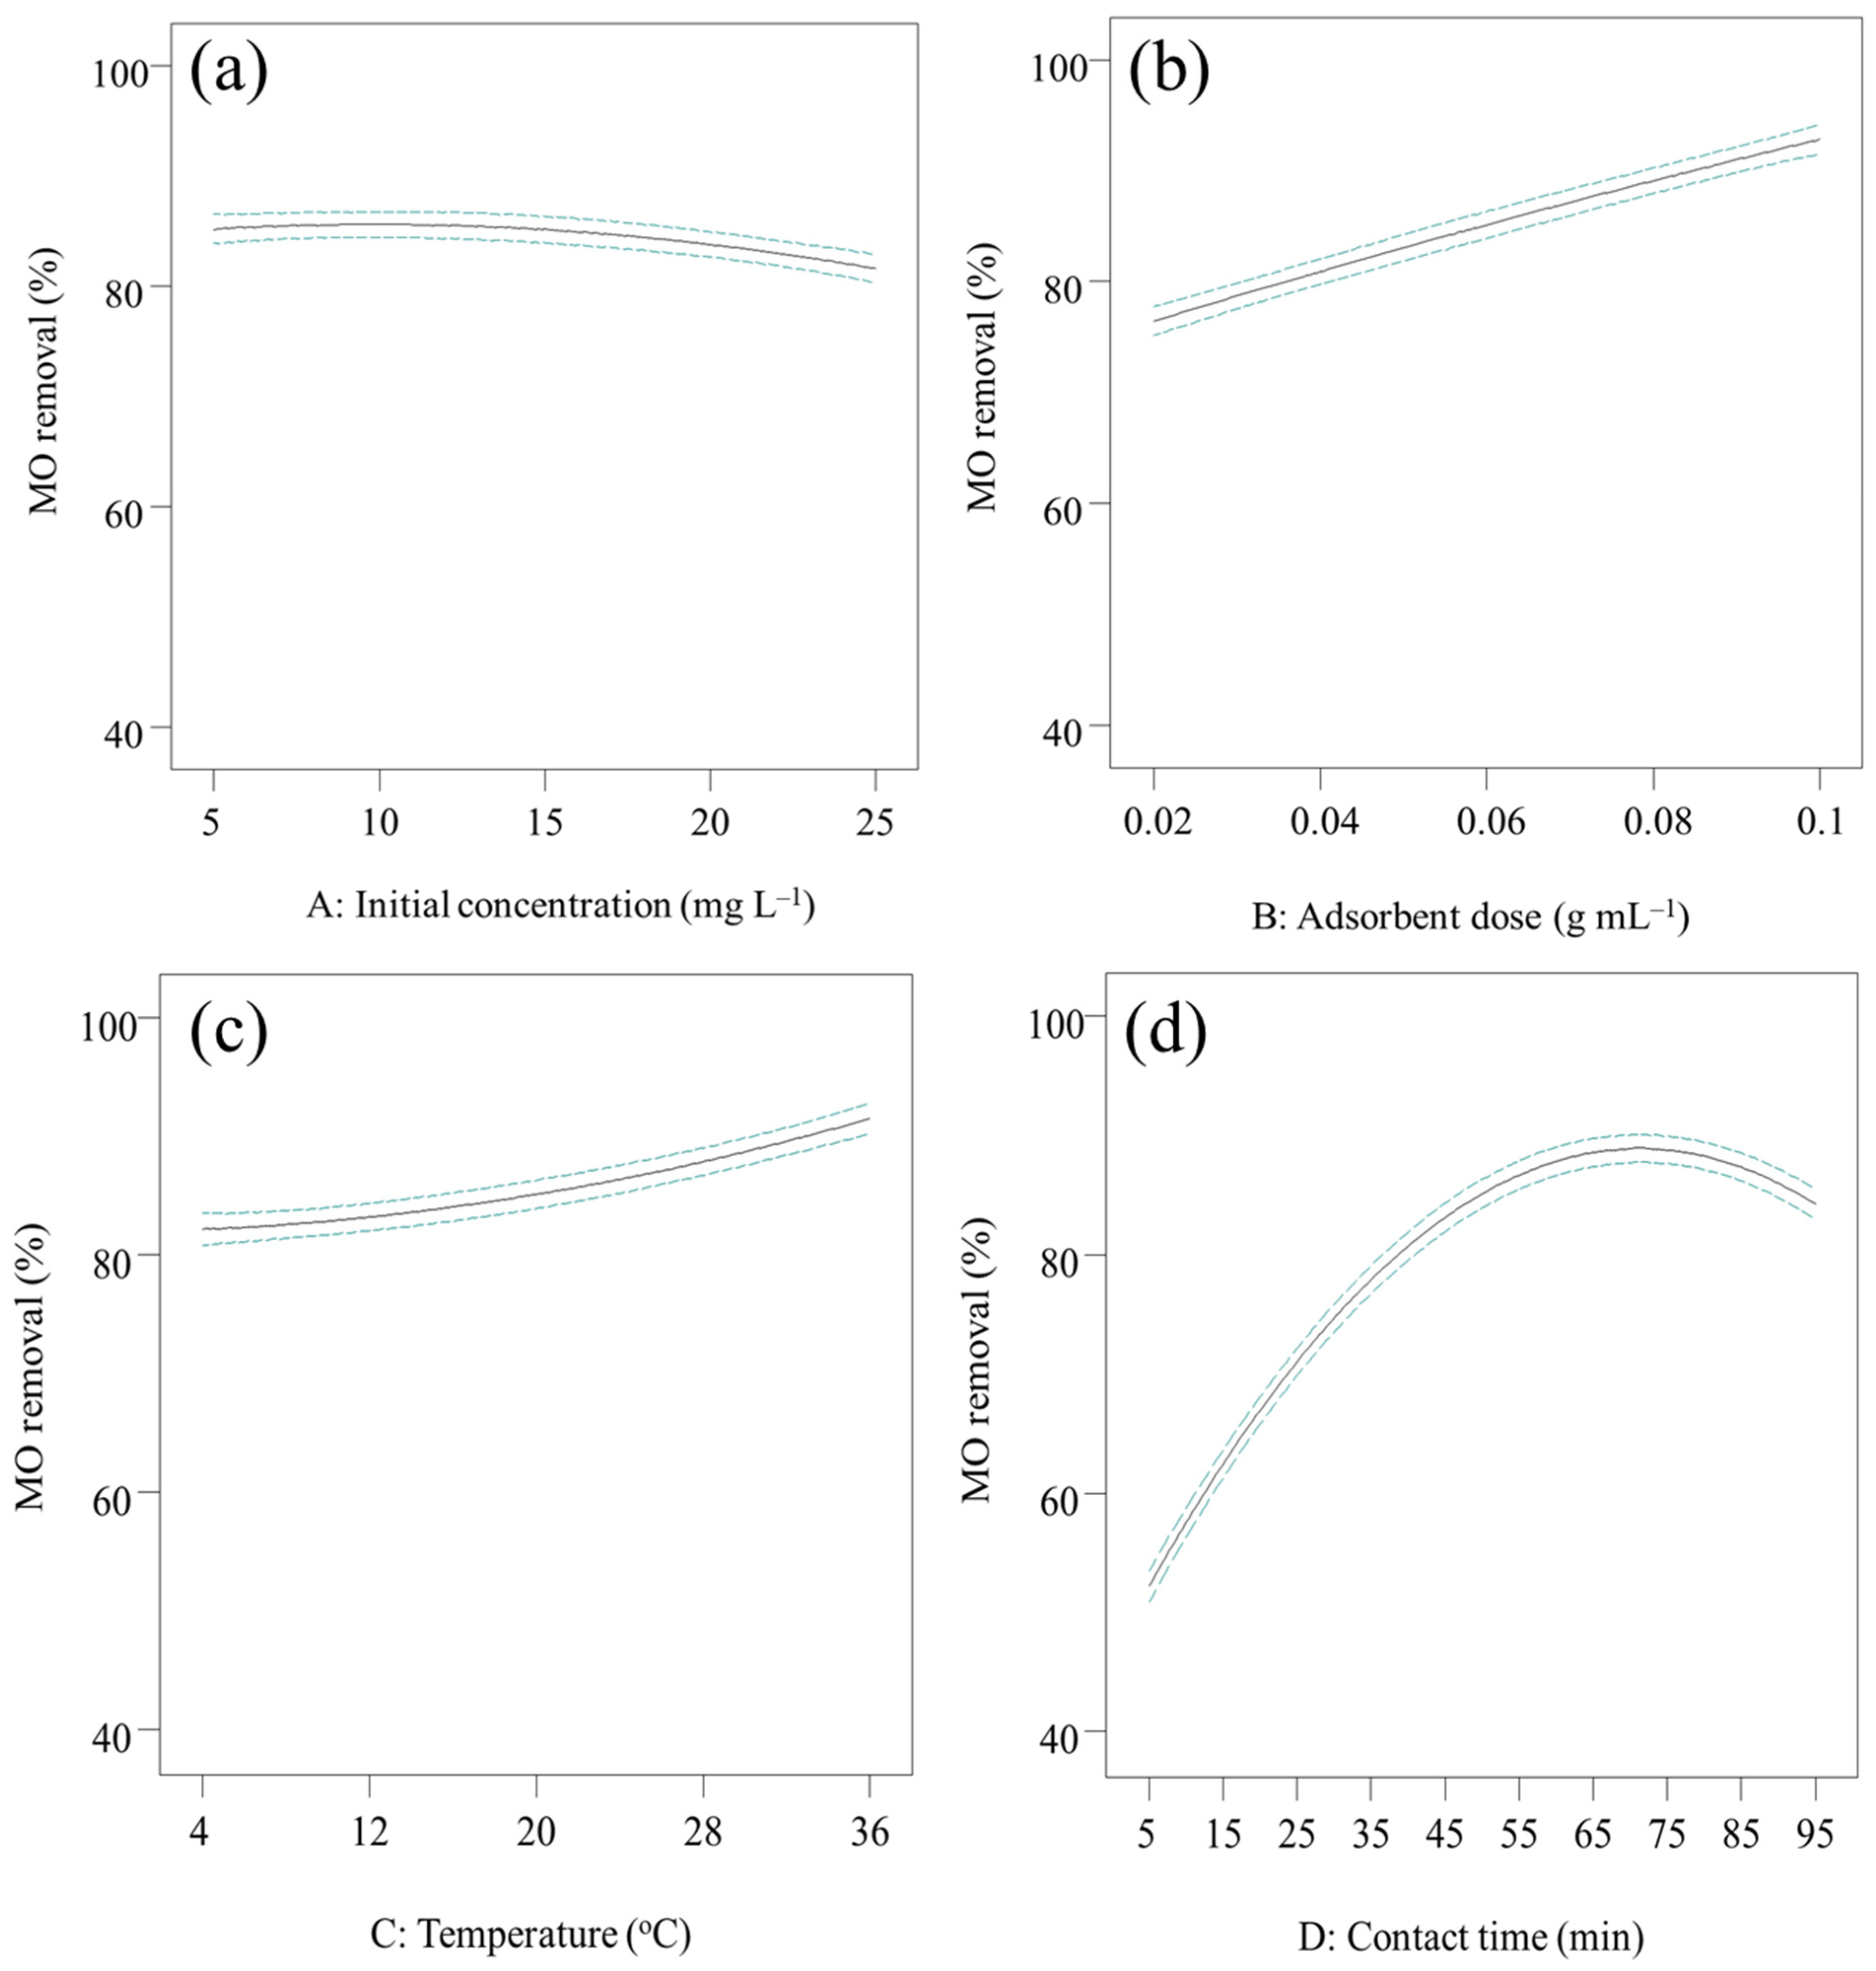
3.4. Effect of the Initial MO Concentration

Figure 4a shows the effect of the initial MO concentration on the removal percentage of MO dye from aqueous solutions. Clearly, an increase in the initial concentration of MO in the range of 5–15 mg L−1 did not lead to any significant changes in removal %, and the MO removal efficiency (~85%) remained approximately constant. In contrast, a slight decrease in removal % was observed when the MO concentration was in the range of 15–25 mg L−1, which might be due to the saturation of the active sites onto the adsorbent surface by the adsorbate molecules [34]. In addition, the interactive effect between the initial MO concentration and temperature, adsorbent dose, and contact time is shown in Figure 5a,b,e, respectively. The general trend indicated that a decrease in the MO concentration in the presence of a higher adsorbent dose, a higher temperature, and a longer contact time up to 75 min increased the removal of MO dye. Similar trends were described for MO removal in previous studies [35,36].

3.5. Effect of the Adsorbent Dose

The adsorbent dose has a clear effect on both the process cost and the removal % [7]. Therefore, studying the effect of the adsorbent dose to determine the optimal adsorbent dose is an essential step in the optimization process. In Figure 4b, the removal % of MO increases from 77 to 94% with an increasing adsorbent dose from 0.02 to 0.10 g mL−1. This can be attributed to the increase in available sites on the adsorbent, as the adsorbent dose increases [37]. In contrast, the adsorption capacity decreases from 3.45 to 0.9 mg g−1 with an increasing adsorbent dose from 0.02 to 0.10 g. This behavior is due to the fact that the adsorption sites remain unsaturated during adsorption, and there is a less than proportional increase in adsorption due to the lower adsorptive capacity of the adsorbent, though the amount of adsorbent is increased [38]. These results are in agreement with results reported in previous studies [39,40].

3.6. Effect of the Temperature

The temperature affects the chemical composition of a solution, as an increase or a decrease in temperature may increase or decrease the adsorption % [41]. Based on Figure 4c, an increase in temperature from 4 to 36 °C increased the removal % of MO dye from 81 to 90%. This behavior is also shown in Figure 5a,d,f to explain the interactive effect between temperature and the remaining three factors (initial MO concentration, adsorbent dose, and contact time). In general, increasing the temperature up to 36 °C in the presence of a higher adsorbent dose and with sufficient contact time resulted in a high removal of MO from the aqueous solutions. This behavior could be due to several reasons, accompanied by high temperatures, which are (i) the increasing swelling of the dye molecules into the adsorbent structure [42]; (ii) the increasing solubility of the dye; (iii) the increasing collisions between the adsorbent and the adsorbate molecules; (iv) the increasing pore size in the adsorbent [43]. This finding related to the effect of temperature on MO removal is similar in trend to that reported in previous studies for MO removal using Zn-Al layered double hydroxide [42] and Bacillus stratosphericus SCA1007 [37].

3.7. Effect of the Contact Time

Figure 4d shows the influence of the contact time on MO removal from aqueous media using the Bracteacoccus sp. The removal % was low in the beginning (~40%), then it gradually started to increase, reaching the maximum removal (~90%) after 75 min. Initially, the number of available sites of adsorption was large; therefore, the adsorption rate was large, but with the time passing, these adsorptive sites became saturated, and the adsorption rate decreased; a plateau was observed at equilibrium [44]. In addition, the interactive effect between the contact time, adsorbent dose, initial MO concentration, and temperature is shown in Figure 5c,e,f.

3.8. Analysis of Variance (ANOVA)

In fact, the F-value and p-value are crucial to determining the significance of the used model, and a model with a high F-value and a low p-value (<0.05) is significant [45]. The results of the ANOVA analysis of the surface quadratic model for MO removal using the Bracteacoccus sp. are listed in Table 5, which evidently indicates a high F-value (286.71), a low p-value (<0.0001), and a non-significant lack of fit. Adequate precision, which represents the ratio of signal to noise, had a value of 62.028, indicating a desirable ratio (i.e., an adequate signal), being higher than 4 [46]. In addition, the adjusted R2 of 0.9930 was in reasonable agreement with the predicted R2 of 0.9815, with a difference of less than 0.2. Therefore, the quadratic model used in the current study is valid.
Considering the effects of the different factors, the following equation can be used to determine the predicted value of the removal % of MO given the values of the experimental factors:
MO removal = + 17.83024
                + 1.26629 × Initial concentration
               + 272.75347 × Adsorbent dose
               + 0.34388 × Temperature
               + 1.18298 × Contact time
                        − 6.81250 × Initial concentration × Adsorbent dose
                        − 0.025781 × Initial concentration × Temperature
                          − 6.77242 × 10⁻¹⁸ × Initial concentration × Contact time
                       + 2.14844 × Adsorbent dose × Temperature
                       + 0.55556 × Adsorbent dose × Contact time
                       − 1.25000 × 10⁻³ × Temperature × Contact time
                 − 0.017342 × Initial concentration2
                 − 302.60417 × Adsorbent dose2
                + 6.70247 × 10⁻³ × Temperature2
                − 8.35021 × 10⁻³ × Contact time2

3.9. Desirability Function

The desirability function is used as an optimization method; the desirability range is 0–1 (1 is the favored value of the response, while 0 means that the response is far from the accepted one) [47]. Figure 6 shows the optimal predicted values of the experimental variables to obtain the best response (removal %). The results of the desirability function are shown in Figure 6, where the maximum response is displayed with all experimental factors varying in the indicated ranges (i.e., Co = 5–25 mg L−1, temperature = 4–36 °C, and contact time = 5–95 min). Consequently, the maximum removal of MO (99%) could be achieved at the predicted values of 10 mg L−1 as the initial MO concentration, 0.10 g L−1 as the adsorbent dose, 20 °C, and 75 min of contact time. These predicted values were experimentally tested in triplicate, and the MO removal was 97%, which indicated that the experimental result was in agreement with the predicted value, with a 2% relative error. Thus, these optimum conditions were used in the subsequent isotherm, kinetic, and thermodynamic experiments.

3.10. Isotherm Study
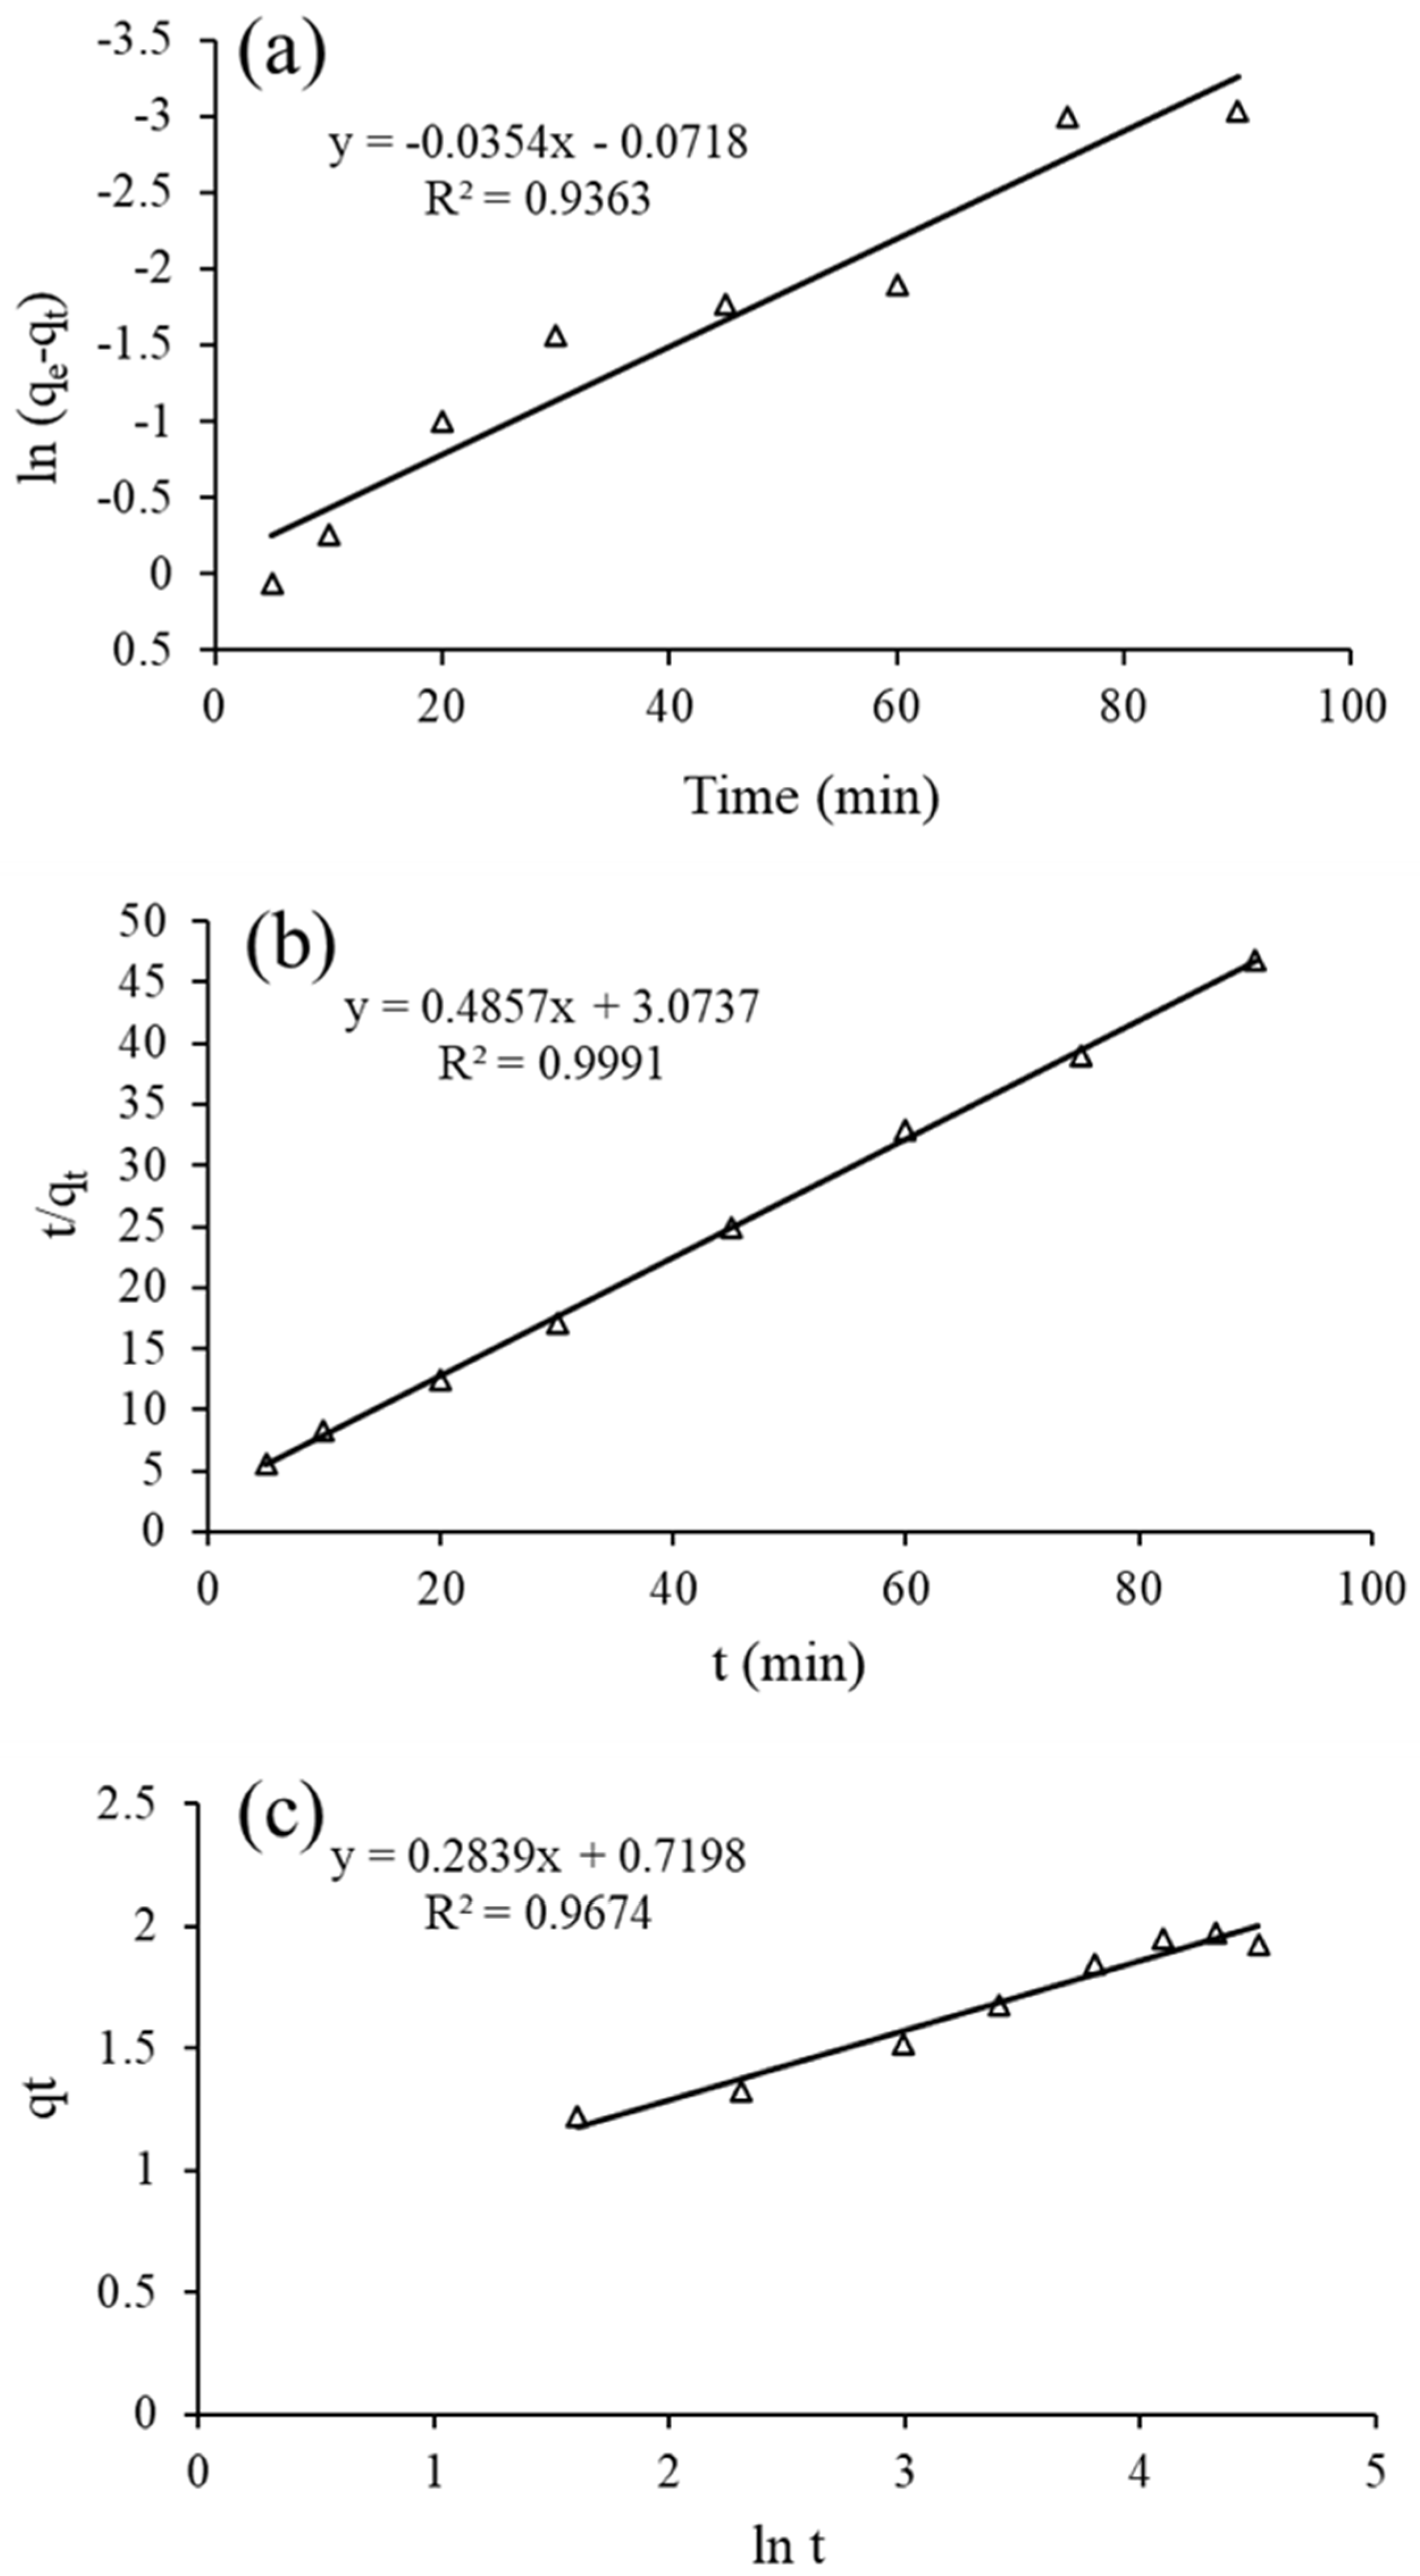
The aim of isotherm models is to understand the mechanisms of interaction between adsorbent and adsorbate molecules at constant temperature [48]. Herein, the results of the isotherm study using the Langmuir, Freundlich, D–R, and Temkin isotherm models are shown in Figure 7. Additionally, the calculated values of the isotherm models’ parameters are listed in Table 6, where the experimental data obeying the Langmuir and Temkin isotherm model indicated R2 of > 0.99 and small RMSE values (RMSE < 1). Note that the Langmuir isotherm model indicated that the adsorbate (MO dye) molecules were adsorbed onto the homogeneous surface of the adsorbent (the Bracteacoccus sp.), forming a monolayer of adsorbate molecules [22]. The value of qm was 5.4171 mg g−1, BT was 1.1639 J mol−1, and bT was 3225.58 J mol−1. Moreover, MO adsorption onto the Bracteacoccus sp. algae was favorable (RL = 0.07635, between 0 and 1). These findings are in agreement with the results described in previous studies [4,29]. Considering the D-R mode results, the value of E was 2.7671 J mol−1, i.e., <8 J mol−1; therefore, MO adsorption by the Bracteacoccus sp. can be considered physisorption. The n value in the Freundlich isotherm model was 2.8514 (n > 1), which confirmed that the sorption of MO by the Bracteacoccus sp. was adequate.

3.11. Kinetic Study

The kinetic study helped to understand the adsorption mechanism, calculate the adsorption rate constant, and evaluate the adsorption capacity. The results obtained after applying the pseudo–first–order, pseudo–second–order, and Elovich kinetic are depicted in Figure 8, and the calculated values of the corresponding kinetic parameters are summarized in Table 7. Obviously, the experimental data were best fitted by the pseudo-second-order model (R2 = 0.9999 and RMSE = 0.0457). This finding is in agreement with previous studies of MO removal using Oedogonium subplagiostomum AP1 [12] and Chlorella species [13]. The adsorption capacity was 2.0588 mg g−1, and the rate constant K2 was 0.0766 g mg−1 min−1. Compared to the pseudo-second-order kinetic model, the Elovich kinetic model achieved a lower fit (R2 = 0.9363) for MO adsorption onto the Bracteacoccus sp., indicating that the MO adsorption mechanism diverged from chemisorption [49]. Among these kinetic models, the pseudo-first-order kinetic model provided the lowest value.
Algae mainly consist of polysaccharides, including three groups, namely, polycolloids, alginates, and carrageenans, which have a key role in binding pollutants to the algal surface [50]. For example, the Bracteacoccus sp., a green alga, consists of protein and cellulose groups bonded to polysaccharides in the wall of cells [51]. Therefore, the adsorptive removal of a pollutant (e.g., MO) from aqueous solutions using a biosorbent (e.g., the Bracteacoccus sp.) can occur through two approaches as follows: (i) surface sorption, in which the adsorbate molecules migrate from the bulk aqueous solution toward a surrounding layer on the adsorbent surface, then establishing a direct interaction with the functional groups on the adsorbate surface; (ii) interstitial sorption, where the adsorbate molecules enter the pores in the adsorbent [52]. Consequently, the proposed mechanism for dye adsorption onto green microalgae (e.g., the Bracteacoccus sp.) includes the interaction between the functional groups (e.g., amine, hydroxyl, carbonyl, carboxyl, phosphate, and sulfate) of the green microalgae and the dye molecules [53]. Thus, the biosorption of MO may occur via H-bonding, electrostatic, ion exchange, and π-π interactions [54].

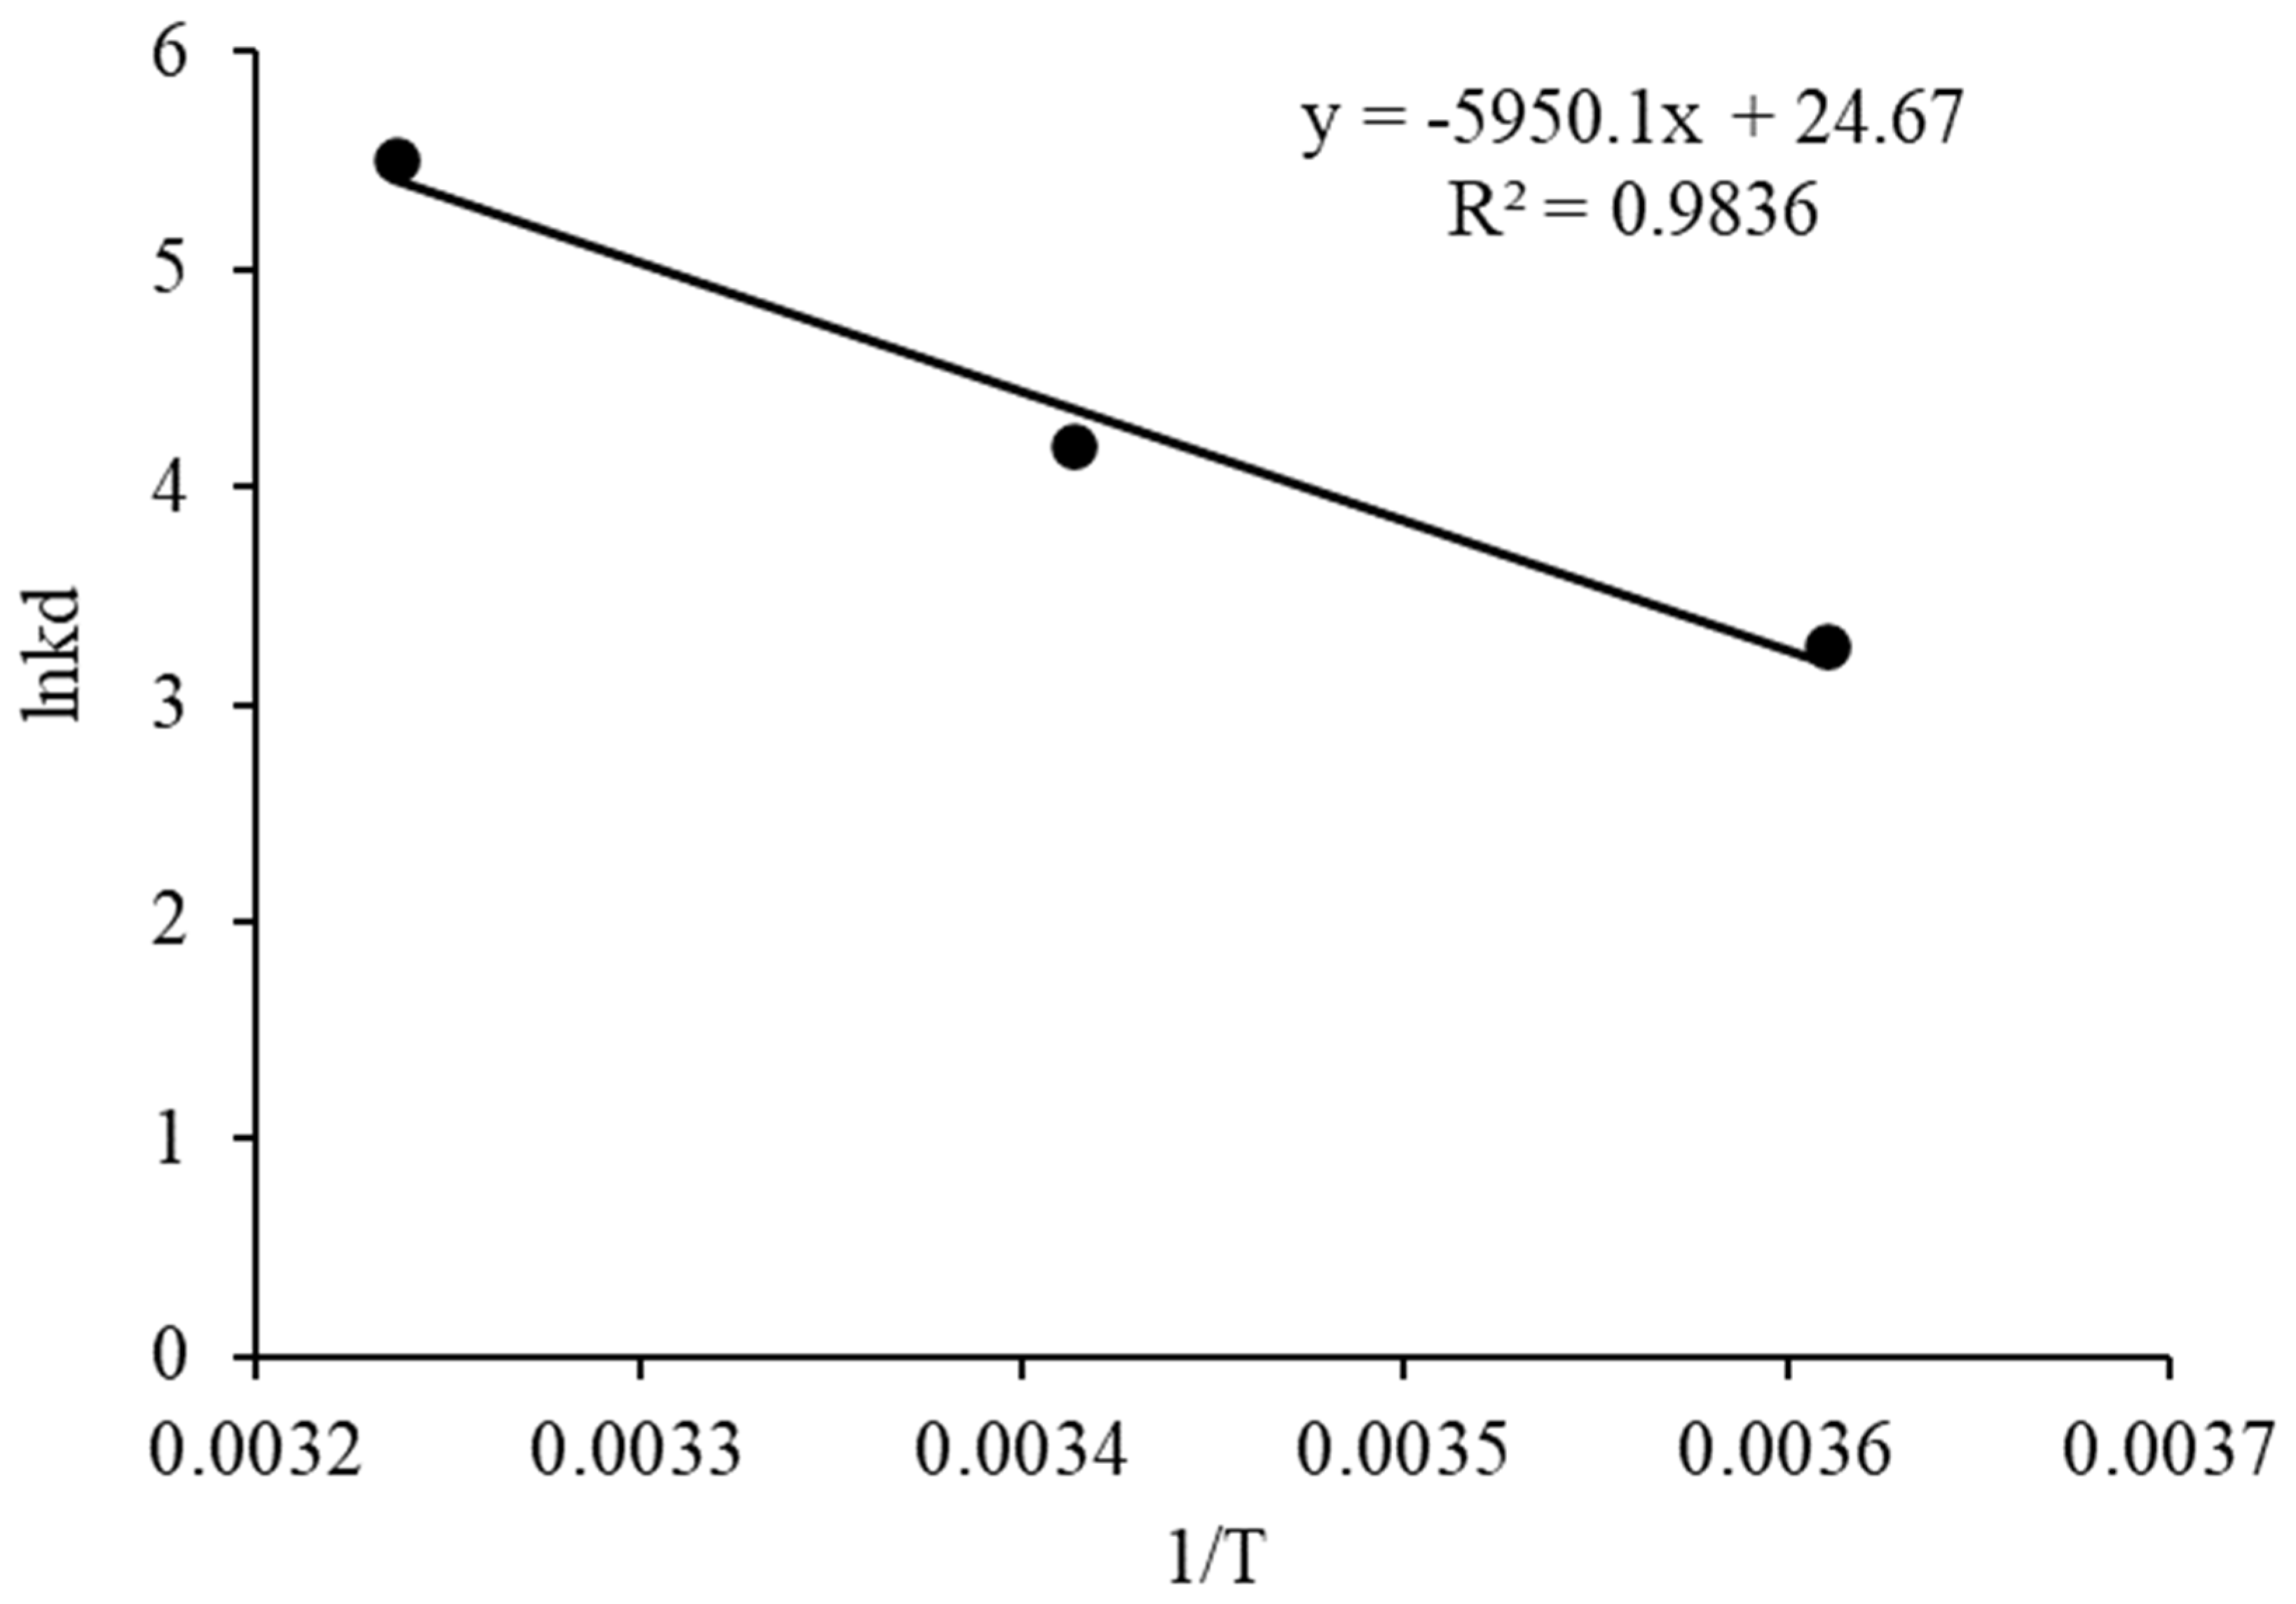
3.12. Thermodynamic Study
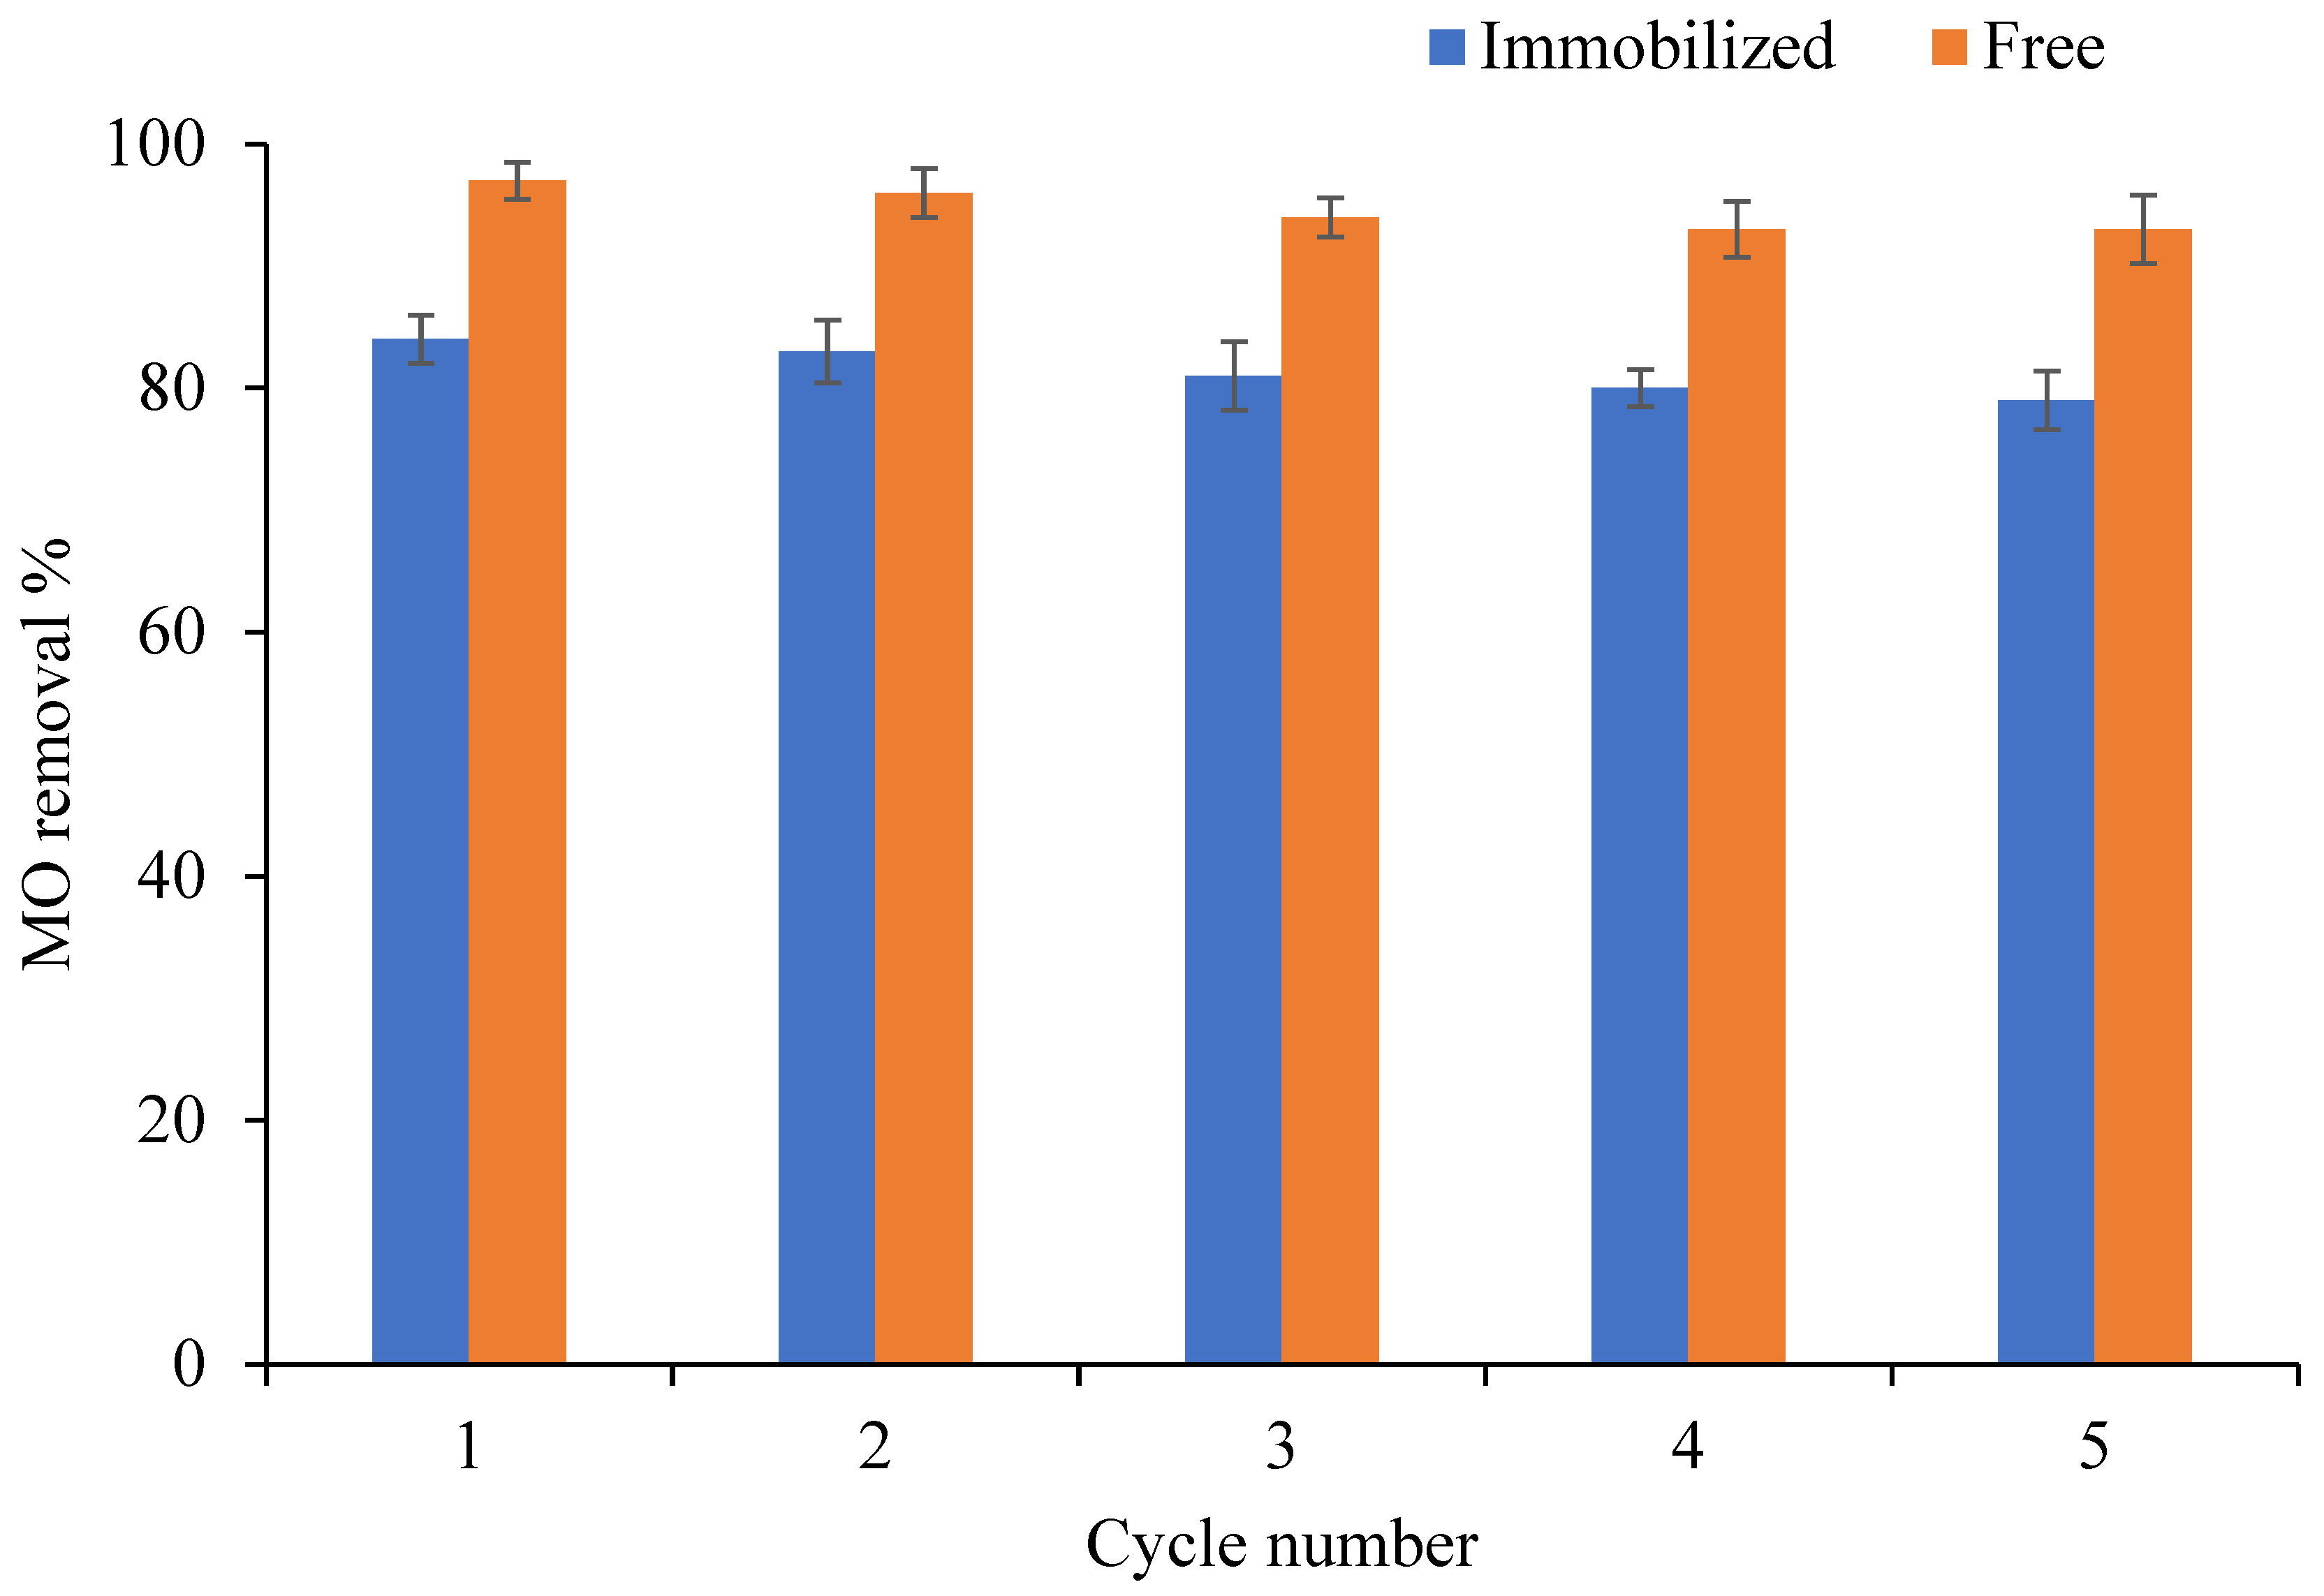
The thermodynamic study of the current work was carried out at three different temperatures: 4 °C (277 K), 20 °C (293 K), and 36 °C (309 K). The thermodynamic results are depicted in Figure 9, and the values of the thermodynamic parameters are listed in Table 8. The positive ΔH° and the negative ΔG° values indicated that MO adsorption by the Bracteacoccus sp. was endothermic and spontaneous, respectively. The absolute value of ΔG° increased with increasing temperature, and the maximum value of ΔG° was −13.909 KJ mol−1, in the range from 0 to −20 KJ mol−1; therefore, MO adsorption by the Bracteacoccus sp. is physisorption [55]. In addition, the positive value of ΔS° indicated an increase in entropy (randomness) at the solid–solution interface during MO adsorption [56]. Similar trends were reported in previous studies of MO adsorption using activated carbon [57] and magnetic resin in chitosan microspheres [55].

3.13. Regeneration

The reusability of the Bracteacoccus sp. is an important property that should be investigated to estimate the cost effectiveness of MO removal from aqueous solutions, especially if the current procedure is applied on a large scale. Therefore, five regeneration and reusability cycles of the immobilized and free fresh Bracteacoccus sp. were performed to remove MO from aqueous solutions. The results are shown in Figure 10 and indicate that the Bracteacoccus sp. can be reused up to five times without any significant deficiency in the removal efficiency of MO from aqueous solutions, considering that the free fresh Bracteacoccus sp. removed approximately 96% of MO from the aqueous solutions, while the removal efficiency of the immobilized alga was lower (~83%).

3.14. Comparison with Other Adsorbents

Based on previous studies, some biosorbents such as algae (e.g., Fucus vesiculosus [11], Chlorella species [13], and Oedogonium subplagiostomum AP1 [12]) and microbial cultures (e.g., of M. yunnaenensis [58] and Bacillus stratosphericus SCA1007 [37] and anaerobic–aerobic microbial culture/coconut fiber systems [59]) are effective in removing/degrading MO dye (Table 9). Algae (e.g., Fucus vesiculosus) have a reasonable efficiency (50%) of MO removal in 60 min. In addition, the highest MO removal (>95%) was observed with Oedogonium subplagiostomum AP1, M. yunnaenensis, and Bacillus stratosphericus SCA1007, but the required contact time was relatively high and varied based on the adsorbent used, in the following order: Oedogonium subplagiostomum AP1 (5.5 days) > M. yunnaenensis (5.0 days) > Bacillus stratosphericus SCA1007 (1/2 days).
In contrast, the Bracteacoccus sp. used in the current study needed a shorter contact time (~75 min) to remove 97% of MO dye from an aqueous solution. Therefore, the Bracteacoccus sp. is an effective biosorbent, able to extensively remove MO dye from an aqueous medium within a relatively short time.

4. Conclusions

The Bracteacoccus sp. (green microalga) showed a high efficiency (97%) of MO dye removal from aqueous solutions in a relatively short time (75 min). The Box–Behnken design (BBD)-based response surface methodology (RSM) is a useful mathematical tool that can be successfully used to optimize MO removal from aqueous solutions and reduce the operation cost. Experimental factors such as initial MO concentration, adsorbent dose, temperature, and contact time have clear effects on MO removal using the Bracteacoccus sp. MO is adsorbed and forms a monolayer onto the Bracteacoccus sp. surface in an endothermic and spontaneous process. Compared to old and immobilized fresh Bracteacoccus sp. algae, free fresh Bracteacoccus sp. algae showed a higher efficiency of MO removal from aqueous solutions. The mechanism of MO removal using the Bracteacoccus sp. was found to include both sorption and degradation processes, where MO is converted to smaller compounds. The Bracteacoccus sp. can be regenerated and reused up to five times to remove MO from aqueous solutions with a high removal efficiency. Moreover, the removal process of MO from an aqueous solution using the Bracteacoccus sp. has several advantages, such as simplicity, low cost, ease of use, and use of an environmentally friendly adsorbent. Thus, the current procedure is a promising method in environmental remediation for protecting water sources from pollution by synthetic dyes, using an abundant natural biosorbent (e.g., the Bracteacoccus sp.).

Supplementary Materials

The following supporting information can be downloaded at: https://www.mdpi.com/article/10.3390/separations11060170/s1, Figure S1: ESI/MS spectra of MO solutions before and after treatment by the green microalgae (Bracteacoccus sp.); Table S1: Proposed chemical structures based on the ESI/MS spectra of the MO solutions shown in Figure S1 (notice the proposed chemical structures of intermediates derived from MO degradation reported in a previous study [60].

Author Contributions

Conceptualization, A.A.S. and A.T.A.-F.; methodology, A.A.S., A.T.A.-F. and M.M.I.; software, A.A.S.; validation, A.A.S. and E.A.; formal analysis, A.A.S. and A.T.A.-F.; investigation, A.A.S. and A.T.A.-F.; resources, A.A.S., A.T.A.-F., M.M.I. and E.A.; data curation, A.A.S. and A.T.A.-F.; writing—original draft preparation, A.A.S.; writing—review and editing, A.A.S., A.T.A.-F., M.M.I. and E.A.; visualization, A.A.S. and A.T.A.-F. All authors have read and agreed to the published version of the manuscript.

Funding

This research received no external funding.

Data Availability Statement

The data that support the findings of this study are available from the corresponding author upon reasonable request.

Acknowledgments

The authors thank Al al-Bayt University (Mafraq, Jordan) for providing financial support and laboratory facilities to perform this work.

Conflicts of Interest

The authors declare no conflicts of interest.

References

  1. Ahmed, M.A.; Ahmed, M.A.; Mohamed, A.A. Synthesis, Characterization and Application of Chitosan/Graphene Oxide/Copper Ferrite Nanocomposite for the Adsorptive Removal of Anionic and Cationic Dyes from Wastewater. RSC Adv. 2023, 13, 5337–5352. [Google Scholar] [CrossRef] [PubMed]
  2. Aljuaid, A.; Almehmadi, M.; Alsaiari, A.A.; Allahyani, M.; Abdulaziz, O.; Alsharif, A.; Alsaiari, J.A.; Saih, M.; Alotaibi, R.T.; Khan, I. G-C3N4 Based Photocatalyst for the Efficient Photodegradation of Toxic Methyl Orange Dye: Recent Modifications and Future Perspectives. Molecules 2023, 28, 3199. [Google Scholar] [CrossRef] [PubMed]
  3. Hosny, N.M.; Gomaa, I.; Elmahgary, M.G. Adsorption of Polluted Dyes from Water by Transition Metal Oxides: A Review. Appl. Surf. Sci. Adv. 2023, 15, 100395. [Google Scholar] [CrossRef]
  4. Wang, K.; Kou, Y.; Wang, K.; Liang, S.; Guo, C.; Wang, W.; Lu, Y.; Wang, J. Comparing the Adsorption of Methyl Orange and Malachite Green on Similar yet Distinct Polyamide Microplastics: Uncovering Hydrogen Bond Interactions. Chemosphere 2023, 340, 139806. [Google Scholar] [CrossRef] [PubMed]
  5. Hasan, I.; Albaeejan, M.A.; Alshayiqi, A.A.; Al-Nafaei, W.S.; Alharthi, F.A. In Situ Hydrothermal Synthesis of Ni1−xMnxWO4 Nanoheterostructure for Enhanced Photodegradation of Methyl Orange. Molecules 2023, 28, 1140. [Google Scholar] [CrossRef] [PubMed]
  6. Ali, F.; Mehmood, S.; Ashraf, A.; Saleem, A.; Younas, U.; Ahmad, A.; Bhatti, M.P.; Eldesoky, G.E.; Aljuwayid, A.M.; Habila, M.A.; et al. Ag-Cu Embedded SDS Nanoparticles for Efficient Removal of Toxic Organic Dyes from Water Medium. Ind. Eng. Chem. Res. 2023, 62, 4765–4777. [Google Scholar] [CrossRef]
  7. Alardhi, S.M.; Fiyadh, S.S.; Salman, A.D.; Adelikhah, M. Prediction of Methyl Orange Dye (MO) Adsorption Using Activated Carbon with an Artificial Neural Network Optimization Modeling. Heliyon 2023, 9, e12888. [Google Scholar] [CrossRef]
  8. Iwuozor, K.O.; Ighalo, J.O.; Emenike, E.C.; Ogunfowora, L.A.; Igwegbe, C.A. Adsorption of Methyl Orange: A Review on Adsorbent Performance. Curr. Res. Green Sustain. Chem. 2021, 4, 100179. [Google Scholar] [CrossRef]
  9. Yaashikaa, P.R.; Kumar, P.S.; Saravanan, A.; Vo, D.V.N. Advances in Biosorbents for Removal of Environmental Pollutants: A Review on Pretreatment, Removal Mechanism and Future Outlook. J. Hazard. Mater. 2021, 420, 126596. [Google Scholar] [CrossRef]
  10. Lin, Z.; Li, J.; Luan, Y.; Dai, W. Application of Algae for Heavy Metal Adsorption: A 20-Year Meta-Analysis. Ecotoxicol. Environ. Saf. 2020, 190, 110089. [Google Scholar] [CrossRef]
  11. El-Naggar, N.E.A.; Hamouda, R.A.; Saddiq, A.A.; Alkinani, M.H. Simultaneous Bioremediation of Cationic Copper Ions and Anionic Methyl Orange Azo Dye by Brown Marine Alga Fucus Vesiculosus. Sci. Rep. 2021, 11, 3555. [Google Scholar] [CrossRef] [PubMed]
  12. Maruthanayagam, A.; Mani, P.; Kaliappan, K.; Chinnappan, S. In Vitro and In Silico Studies on the Removal of Methyl Orange from Aqueous Solution Using Oedogonium Subplagiostomum AP1. Water Air Soil Pollut. 2020, 231, 232. [Google Scholar] [CrossRef]
  13. Doshi, H.; Ray, A.; Kothari, I.L.; Gami, B. Spectroscopic and Scanning Electron Microscopy Studies of Bioaccumulation of Pollutants by Algae. Curr. Microbiol. 2006, 53, 148–157. [Google Scholar] [CrossRef] [PubMed]
  14. Rápó, E.; Tonk, S. Factors Affecting Synthetic Dye Adsorption; Desorption Studies: A Review of Results from the Last Five Years (2017–2021). Molecules 2021, 26, 5419. [Google Scholar] [CrossRef] [PubMed]
  15. Saleh, B.; Fathi, R.; Abdalla, M.A.A.; Radhika, N.; Ma, A.; Jiang, J. Optimization and Characterization of Centrifugal-Cast Functionally Graded Al-SiC Composite Using Response Surface Methodology and Grey Relational Analysis. Coatings 2023, 13, 813. [Google Scholar] [CrossRef]
  16. Williamson, E.M.; Sun, Z.; Mora-Tamez, L.; Brutchey, R.L. Design of Experiments for Nanocrystal Syntheses: A How-To Guide for Proper Implementation. Chem. Mater. 2022, 34, 9823–9835. [Google Scholar] [CrossRef]
  17. Osuchukwu, O.A.; Salihi, A.; Abdullahi, I.; Abdulkareem, B.; Salami, K.A.; Osayamen Etinosa, P.; Nwigbo, S.C.; Mohammed, S.A.; Obada, D.O. A Pedagogical Approach for the Development and Optimization of a Novel Mix of Biowastes-Derived Hydroxyapatite Using the Box-Behnken Experimental Design. Heliyon 2024, 10, e23092. [Google Scholar] [CrossRef] [PubMed]
  18. Song, S.; Hao, C.; Zhang, X.; Zhang, Q.; Sun, R. Sonocatalytic Degradation of Methyl Orange in Aqueous Solution Using Fe-Doped TiO2 Nanoparticles under Mechanical Agitation. Open Chem. 2018, 16, 1283–1296. [Google Scholar] [CrossRef]
  19. Al-Fawwaz, A.T.; Al Shra’ah, A.; Elhaddad, E. Bioremoval of Methylene Blue from Aqueous Solutions by Green Algae (Bracteacoccus sp.) Isolated from North Jordan: Optimization, Kinetic, and Isotherm Studies. Sustainability 2023, 15, 842. [Google Scholar] [CrossRef]
  20. Hambisa, A.A.; Regasa, M.B.; Ejigu, H.G.; Senbeto, C.B. Adsorption Studies of Methyl Orange Dye Removal from Aqueous Solution Using Anchote Peel-Based Agricultural Waste Adsorbent. Appl. Water Sci. 2023, 13, 24. [Google Scholar] [CrossRef]
  21. Asanjarani, N.; Bagtash, M.; Zolgharnein, J. A Comparison between Box–Behnken Design and Artificial Neural Network: Modeling of Removal of Phenol Red from Water Solutions by Nanocobalt Hydroxide. J. Chemom. 2020, 34, 9. [Google Scholar] [CrossRef]
  22. Mahdi, A.E.; Ali, N.S.; Kalash, K.R.; Salih, I.K.; Abdulrahman, M.A.; Albayati, T.M. Investigation of Equilibrium, Isotherm, and Mechanism for the Efficient Removal of 3-Nitroaniline Dye from Wastewater Using Mesoporous Material MCM-48. Prog. Color. Color. Coat. 2023, 16, 387–398. [Google Scholar] [CrossRef]
  23. Hassaan, M.A.; Yılmaz, M.; Helal, M.; El-Nemr, M.A.; Ragab, S.; El Nemr, A. Isotherm and Kinetic Investigations of Sawdust-Based Biochar Modified by Ammonia to Remove Methylene Blue from Water. Sci. Rep. 2023, 13, 12724. [Google Scholar] [CrossRef] [PubMed]
  24. Shoaib, A.G.M.; Ragab, S.; El Sikaily, A.; Yılmaz, M.; El Nemr, A. Thermodynamic, Kinetic, and Isotherm Studies of Direct Blue 86 Dye Absorption by Cellulose Hydrogel. Sci. Rep. 2023, 13, 5910. [Google Scholar] [CrossRef] [PubMed]
  25. Deka, J.; Das, H.; Singh, A.; Barman, P.; Devi, A.; Bhattacharyya, K.G. Methylene Blue Removal Using Raw and Modified Biomass Plumeria Alba (White Frangipani) in Batch Mode: Isotherm, Kinetics, and Thermodynamic Studies. Environ. Monit. Assess. 2023, 195, 26. [Google Scholar] [CrossRef]
  26. Wekoye, J.N.; Wanyonyi, W.C.; Wangila, P.T.; Tonui, M.K. Kinetic and Equilibrium Studies of Congo Red Dye Adsorption on Cabbage Waste Powder. Environ. Chem. Ecotoxicol. 2020, 2, 24–31. [Google Scholar] [CrossRef]
  27. Kavcı, E. Adsorption of Direct Red 243 Dye onto Clay: Kinetic Study and Isotherm Analysis. Desalination Water Treat. 2021, 212, 452–461. [Google Scholar] [CrossRef]
  28. Zghal, S.; Jedidi, I.; Cretin, M.; Cerneaux, S.; Abdelmouleh, M. Adsorptive Removal of Rhodamine B Dye Using Carbon Graphite/CNT Composites as Adsorbents: Kinetics, Isotherms and Thermodynamic Study. Materials 2023, 16, 1015. [Google Scholar] [CrossRef] [PubMed]
  29. Ahmed, A.S.A.; Sanad, M.M.S.; Kotb, A.; Negm, A.N.R.M.; Abdallah, M.H. Removal of Methyl Red from Wastewater Using a NiO@Hyphaene Thebaica Seed-Derived Porous Carbon Adsorbent: Kinetics and Isotherm Studies. Mater. Adv. 2023, 4, 2981–2990. [Google Scholar] [CrossRef]
  30. Thamer, B.M.; Al-aizari, F.A.; Abdo, H.S. Enhanced Adsorption of Textile Dyes by a Novel Sulfonated Activated Carbon Derived from Pomegranate Peel Waste: Isotherm, Kinetic and Thermodynamic Study. Molecules 2023, 28, 7712. [Google Scholar] [CrossRef]
  31. Dutta, S.K.; Amin, M.K.; Ahmed, J.; Elias, M.; Mahiuddin, M. Removal of Toxic Methyl Orange by a Cost-Free and Eco-Friendly Adsorbent: Mechanism, Phytotoxicity, Thermodynamics, and Kinetics. S. Afr. J. Chem. Eng. 2022, 40, 195–208. [Google Scholar] [CrossRef]
  32. Cheng, Z.; Feng, K.; Su, Y.; Ye, J.; Chen, D.; Zhang, S.; Zhang, X.; Dionysiou, D.D. Novel Biosorbents Synthesized from Fungal and Bacterial Biomass and Their Applications in the Adsorption of Volatile Organic Compounds. Bioresour. Technol. 2020, 300, 122705. [Google Scholar] [CrossRef] [PubMed]
  33. Shen, T.; Jiang, C.; Wang, C.; Sun, J.; Wang, X.; Li, X. A TiO2 Modified Abiotic–Biotic Process for the Degradation of the Azo Dye Methyl Orange. RSC Adv. 2015, 5, 58704–58712. [Google Scholar] [CrossRef]
  34. Hii, H.T. Adsorption Isotherm and Kinetic Models for Removal of Methyl Orange and Remazol Brilliant Blue R by Coconut Shell Activated Carbon. Trop. Aquat. Soil. Pollut. 2021, 1, 1–10. [Google Scholar] [CrossRef]
  35. Akansha, K.; Chakraborty, D.; Sachan, S.G. Decolorization and Degradation of Methyl Orange by Bacillus Stratosphericus SCA1007. Biocatal. Agric. Biotechnol. 2019, 18, 101044. [Google Scholar] [CrossRef]
  36. Shi, X.; Zhang, X.; Ma, L.; Xiang, C.; Li, L. TiO2-Doped Chitosan Microspheres Supported on Cellulose Acetate Fibers for Adsorption and Photocatalytic Degradation of Methyl Orange. Polymers 2019, 11, 1293. [Google Scholar] [CrossRef] [PubMed]
  37. Nouaa, S.; Aziam, R.; Benhiti, R.; Carja, G.; Iaich, S.; Zerbet, M.; Chiban, M. Synthesis of LDH/Alginate Composite Beads as a Potential Adsorbent for Phosphate Removal: Kinetic and Equilibrium Studies. Chem. Pap. 2023, 77, 6689–6705. [Google Scholar] [CrossRef]
  38. Chiban, M.; Carja, G.; Lehutu, G.; Sinan, F. Equilibrium and Thermodynamic Studies for the Removal of As(V) Ions from Aqueous Solution Using Dried Plants as Adsorbents. Arab. J. Chem. 2016, 9, S988–S999. [Google Scholar] [CrossRef]
  39. Ramutshatsha-Makhwedzha, D.; Mavhungu, A.; Moropeng, M.L.; Mbaya, R. Activated Carbon Derived from Waste Orange and Lemon Peels for the Adsorption of Methyl Orange and Methylene Blue Dyes from Wastewater. Heliyon 2022, 8, e09930. [Google Scholar] [CrossRef]
  40. Djezar, H.; Rida, K.; Salhi, M. Efficient Adsorbent for the Removal of Methyl Orange and Congo Red by Calcined Zn-Al Layered Double Hydroxide. Inorg. Nano-Met. Chem. 2022, 52, 161–172. [Google Scholar] [CrossRef]
  41. Khalil, M.; Hanif, M.A.; Rashid, U.; Ahmad, J.; Alsalme, A.; Tsubota, T. Low-Cost Novel Nano-Constructed Granite Composites for Removal of Hazardous Terasil Dye from Wastewater. Environ. Sci. Pollut. Res. 2023, 30, 81333–81351. [Google Scholar] [CrossRef] [PubMed]
  42. Sarfraz, S.; Ameer, S.; Javed, M.; Iqbal, S.; Aljazzar, S.O.; Zahra, M.; Amin, S.; Shah, K.H.; Abourehab, M.A.S.; Elkaeed, E.B.; et al. Removal of Hexavalent Chromium Ions Using Micellar Modified Adsorbent: Isothermal and Kinetic Investigations. RSC Adv. 2022, 12, 23898–23911. [Google Scholar] [CrossRef] [PubMed]
  43. Etemadinia, T.; Allahrasani, A.; Barikbin, B. ZnFe2O4@SiO2@Tragacanth Gum Nanocomposite: Synthesis and Its Application for the Removal of Methylene Blue Dye from Aqueous Solution. Polym. Bull. 2019, 76, 6089–6109. [Google Scholar] [CrossRef]
  44. Imessaoudene, A.; Cheikh, S.; Hadadi, A.; Hamri, N.; Bollinger, J.C.; Amrane, A.; Tahraoui, H.; Manseri, A.; Mouni, L. Adsorption Performance of Zeolite for the Removal of Congo Red Dye: Factorial Design Experiments, Kinetic, and Equilibrium Studies. Separations 2023, 10, 57. [Google Scholar] [CrossRef]
  45. Emami, M.R.S.; Amiri, M.K.; Zaferani, S.P.G. Removal Efficiency Optimization of Pb2+ in a Nanofiltration Process by MLP-ANN and RSM. Korean J. Chem. Eng. 2021, 38, 316–325. [Google Scholar] [CrossRef]
  46. Biradar, V.R.; Charde, M.S.; Chakole, R.D. QBD Approach Based Development of Validated Analytical Method for Estimation of Clarithromycin by RP-HPLC. J. Adv. Sci. Res. 2023, 14, 15–24. [Google Scholar] [CrossRef]
  47. Jawad, A.H.; Abdulhameed, A.S.; Hanafiah, M.A.K.M.; ALOthman, Z.A.; Khan, M.R.; Surip, S.N. Numerical Desirability Function for Adsorption of Methylene Blue Dye by Sulfonated Pomegranate Peel Biochar: Modeling, Kinetic, Isotherm, Thermodynamic, and Mechanism Study. Korean J. Chem. Eng. 2021, 38, 1499–1509. [Google Scholar] [CrossRef]
  48. Al-Ghouti, M.A.; Da’ana, D.A. Guidelines for the Use and Interpretation of Adsorption Isotherm Models: A Review. J. Hazard. Mater. 2020, 393, 122383. [Google Scholar] [CrossRef] [PubMed]
  49. Candido, I.C.M.; Soares, J.M.D.; de Araujo Barros Barbosa, J.; de Oliveira, H.P. Adsorption and Identification of Traces of Dyes in Aqueous Solutions Using Chemically Modified Eggshell Membranes. Bioresour. Technol. Rep. 2019, 7, 100267. [Google Scholar] [CrossRef]
  50. Mokhtar, N.; Aziz, E.A.; Aris, A.; Ishak, W.F.W.; Mohd Ali, N.S. Biosorption of Azo-Dye Using Marine Macro-Alga of Euchema Spinosum. J. Environ. Chem. Eng. 2017, 5, 5721–5731. [Google Scholar] [CrossRef]
  51. Pootthachaya, P.; Puangsap, W.; Bunchalee, P.; Plangklang, P.; Reungsang, A.; Yuangsoi, B.; Cherdthong, A.; Tengjaroenkul, B.; Wongtangtintharn, S. Investigation of Nutritional Profile, Protein Solubility and in Vitro Digestibility of Various Algae Species as an Alternative Protein Source for Poultry Feed. Algal Res. 2023, 72, 103147. [Google Scholar] [CrossRef]
  52. Elgarahy, A.M.; Elwakeel, K.Z.; Mohammad, S.H.; Elshoubaky, G.A. A Critical Review of Biosorption of Dyes, Heavy Metals and Metalloids from Wastewater as an Efficient and Green Process. Clean. Eng. Technol. 2021, 4, 100209. [Google Scholar] [CrossRef]
  53. Arumugam, N.; Chelliapan, S.; Kamyab, H.; Thirugnana, S.; Othman, N.; Nasri, N.S. Treatment of Wastewater Using Seaweed: A Review. Int. J. Environ. Res. Public Health 2018, 15, 2851. [Google Scholar] [CrossRef] [PubMed]
  54. Bayramoglu, G.; Burcu Angi, S.; Acikgoz-Erkaya, I.; Yakup Arica, M. Preparation of Effective Green Sorbents Using O. Princeps Alga Biomass with Different Composition of Amine Groups: Comparison to Adsorption Performances for Removal of a Model Acid Dye. J. Mol. Liq. 2022, 347, 118375. [Google Scholar] [CrossRef]
  55. Yu, L.; Bi, J.; Song, Y.; Wang, M. Isotherm, Thermodynamics, and Kinetics of Methyl Orange Adsorption onto Magnetic Resin of Chitosan Microspheres. Int. J. Mol. Sci. 2022, 23, 13839. [Google Scholar] [CrossRef] [PubMed]
  56. Hady, A.K.; Owda, M.E.; Abouzeid, R.E.; Shehata, H.A.; Elzaref, A.S.; Elfeky, A.S. Harnessing the Potential of Modified Cellulosic Pumpkin Seed Hulls as Affordable Biosorbents for Cationic Dye Removal from Aqueous Solutions: Adsorption Kinetics and Isotherm Studies. Biomass Convers. Biorefin. 2023. [Google Scholar] [CrossRef]
  57. Yönten, V.; Sanyürek, N.K.; Kivanç, M.R. A Thermodynamic and Kinetic Approach to Adsorption of Methyl Orange from Aqueous Solution Using a Low Cost Activated Carbon Prepared from Vitis vinifera L. Surf. Interfaces 2020, 20, 100529. [Google Scholar] [CrossRef]
  58. Carolin, C.F.; Kumar, P.S.; Joshiba, G.J. Sustainable Approach to Decolourize Methyl Orange Dye from Aqueous Solution Using Novel Bacterial Strain and Its Metabolites Characterization. Clean Technol. Environ. Policy 2021, 23, 173–181. [Google Scholar] [CrossRef]
  59. Murali, V.; Ong, S.A.; Ho, L.N.; Wong, Y.S. Evaluation of Integrated Anaerobic-Aerobic Biofilm Reactor for Degradation of Azo Dye Methyl Orange. Bioresour. Technol. 2013, 143, 104–111. [Google Scholar] [CrossRef]
  60. Zhong, W.; Jiang, T.; Dang, Y.; He, J.; Chen, S.Y.; Kuo, C.H.; Kriz, D.; Meng, Y.; Meguerdichian, A.G.; Suib, S.L. Mechanism Studies on Methyl Orange Dye Degradation by Perovskite-Type LaNiO3-Δ under Dark Ambient Conditions. Appl. Catal. A Gen. 2018, 549, 302–309. [Google Scholar] [CrossRef]
Figure 1. UV-Vis absorption spectra of the MO solution before and after treatment with the Bracteacoccus sp. after 75 min of contact time. Inset: a microscope view of the Bracteacoccus sp. after absorption of the MO dye. The image was taken at 100× magnification.
Separations 11 00170 g001
Figure 2. A microscope view of the Bracteacoccus sp. before (A) and after (B) the addition of the MO dye. The image was taken at 100× magnification.
Separations 11 00170 g002
Figure 3. Old, immobilized fresh, and free fresh Bracteacoccus sp. algae for MO dye removal from aqueous solutions. The error bars represent the standard deviation of a triplicate analysis. (Co of MO = 10 mg L−1, adsorbent dose = 0.10 g mL−1, contact time = 75 min, temperature = 20 °C).
Separations 11 00170 g003
Figure 4. Experimental design to determine the effect of each factor, i.e., initial MO concentration (a), adsorbent dose (b), temperature (c), and contact time (d) on MO removal %.
Separations 11 00170 g004
Figure 5. 3D surface plots of MO removal by the Bracteacoccus sp. showing the interactive effects of the four factors (initial MO concentration (a,b,e), adsorbent dose (bd), temperature (a,d,f), and contact time (c,e,f)).
Separations 11 00170 g005
Figure 6. Ramps of desirability for the optimization of the experimental variables (initial MO concentration, adsorbent dose, temperature, and contact time) in MO removal from aqueous solutions by the Bracteacoccus sp.
Separations 11 00170 g006
Figure 7. Liner plots of the isotherm models, including (a) Langmuir, (b) Freundlich, (c) D–R, and (d) Temkin isotherm models for MO adsorption using the Bracteacoccus sp.
Separations 11 00170 g007
Figure 8. Plots of pseudo–first–order (a), pseudo–second–order (b), and Elovich (c) kinetic models for MO adsorption onto the Bracteacoccus sp. (Co = 10 mg L−1, adsorbent dose = 0.1 g, and temperature = 20 °C).
Separations 11 00170 g008
Figure 9. The plot of lnKd versus 1/T for MO adsorption by the Bracteacoccus sp. (Co = 10 mg L−1, adsorbent dose = 0.1 g, and contact time = 75 min).
Separations 11 00170 g009
Figure 10. Number of regeneration cycles of the Bracteacoccus sp. for MO removal from aqueous solutions.
Separations 11 00170 g010
Table 1. Characteristics of MO dye [18].
ParameterValue
Chemical structureSeparations 11 00170 i001
Chemical formulaC14H14N3SO3Na
Molecular weight (g mol−1)327.33
Molecular size (Å)15.8 × 6.5 × 2.6
λmax (nm)464
Density at 20 °C1.28
pKa3.42
Solubility (mg L−1)5.0 × 10³
Table 2. Four experimental factors and their levels and actual values using a Box-Behnken design for MO dye removal using green microalgae (a Bracteacoccus sp.).
ParameterFactor Level
Low (−1)Medium (0)High (+1)
Initial MO concentration (mg L−1)A51525
Adsorbent dose (g mL−1)B0.020.060.10
Temperature (°C)C42036
Contact time (min)D54595
Table 3. BBD matrix for the four examined experimental factors (initial MO concentration, adsorbent dose, temperature, and contact time) including their coded values.
Exp. #Factor 1
(Initial Concentration, mg L−1)
Factor 2
(Adsorbent Dose, g mL−1)
Factor 3
(Temperature, °C)
Factor 4
(Time, min)
10−1−10
2−100−1
30−10−1
4+10−10
50000
6+100−1
70+10+1
8+10+10
900−1−1
1000−1+1
11−1−100
120+10−1
130000
14−100+1
15−1+100
160−1+10
17+1−100
18−10+10
190000
20+1+100
210000
22−10−10
2300+1−1
240+1+10
25+100+1
2600+1+1
270+1−10
280−10+1
290000
Table 4. Responses are presented as removal % values for the experiments listed in Table 3.
Exp. #Response (Removal %)Exp. #Response (Removal %)
1761680
2521776
3441896
4831985
5852086
6482186
7942277
8862360
9482499
10822580
11752691
12602789
13842874
14842986
1596
Table 5. ANOVA analysis of the surface quadratic model for MO removal using green microalgae.
Sum of MeanFp-Value
SourceSquaresdfSquareValueProb > F
Model6347.8914453.42286.71<0.0001significant
A—Initial concentration38.16138.1624.130.0002
B—Adsorbent dose806.881806.88510.21<0.0001
C—Temperature261.331261.33165.25<0.0001
D—Contact time3084.8113084.811950.62<0.0001
AB29.70129.7018.780.0007
AC68.06168.0643.04<0.0001
AD0.00010.0000.0001.0000
BC7.5617.564.780.0462
BD4.0014.002.530.1341
CD3.2413.242.050.1743
A219.51119.5112.330.0035
B21.5211.520.960.3435
C219.10119.1012.080.0037
D21854.6211854.621172.73<0.0001
Residual22.14141.58
Lack of Fit19.87101.993.500.1195not significant
Pure Error2.2740.57
Cor Total6370.0328
Table 6. The values of the isotherm terms of the Langmuir, Freundlich, D–R, and Temkin isotherm models for MO dye adsorption using the Bracteacoccus sp.
Isotherm ModelParametersValues
Langmuir q e m a x (mg g−1)5.4171
KL (L mg−1)1.2067
RL0.07635
R20.9991
RMSE0.04197
FreundlichKf ((mg g−1)(L mg−1)1/n)2.3977
n2.8514
R20.9717
RMSE61.0529
D-RQm (mg g−1)3.8129
KD (mol2/kJ2)0.0653
E (J mol−1)2.7671
R20.9518
RMSE14.4135
TemkinAT (L g−1)33.869
BT (J mol−1)1.1639
bT (J mol−1)3225.58
R20.9946
RMSE0.07198
Table 7. The calculated values of parameters in pseudo-first-order, pseudo-second-order, and Elovich kinetic models. (Co = 10 mg L−1, adsorbent dose = 0.1 g, and temperature = 20 °C).
Kinetic ModelParametersValues
Pseudo-first-orderqe (mg g−1)0.9307
K1 (min−1)0.0354
R20.9363
RMSE2.0556
Pseudo-second-orderqe (mg g−1)2.0588
K2 (g mg−1 min−1)0.0766
R20.9991
RMSE0.04569
Elovichβ (g mg−1)66.6667
α (mg g−1 min−1)5.1476 × 10¹¹
R20.9674
RMSE1.0074
Table 8. The calculated values of thermodynamic parameters for MO removal using the Bracteacoccus sp. (Co = 10 mg L−1, adsorbent dose = 0.1 g, and contact time = 75 min).
ΔH° (KJ/mol)ΔS° (KJ/mol)ΔG° (KJ/mol)
277 k293 k309 k
+49.469+0.205−7.345−10.627−13.909
Table 9. Some biosorbents used for MO removal from aqueous solutions.
BiosorbentExperimental Conditionsqm (mg g−1)R%Ref.
Alga (Fucus vesiculosus)10 mL of a 60 mg L−1 MO solution, pH = 7.0, 3 g L−1 of adsorbent dose, and 60 min of contact time0.1050%[11]
Chlorella species1.0–2.2 mg L−1 initial MO concentration and 0.7 g of adsorbent in 50 mL of aqueous solution 0.74–0.27-[13]
Alga (Oedogonium
subplagiostomum AP1)
500 mg L−1 initial MO concentration, pH = 6.5, 400 mg L−1 algal dose, and 5.5 days of contact time121397%[12]
Microbial culture (bacterial strain, M. yunnaenensis)100 mL of a 100 mg L−1 MO solution, pH 7.0, 3 mL (culture), and 5.0 days of contact time-98%[58]
Microbial culture (Bacillus stratosphericus SCA1007)100 mL of a 150 mg L−1 MO solution, optical density 1.0 (λmax = 600 nm, 1.50 × 10⁶ cells mL−1), pH 7.0, T = 35 °C, 3 mL (culture), and 12 h of contact time-100%[37]
Biofilm reactor containing anaerobic–aerobic microbial culture/coconut fiber3 L reactor with anaerobic–aerobic biofilm (7.2 cm dimeter × 75 cm height) filled with 1 L of coconut fiber, 200 mg L−1 initial MO concentration, contact time of 36 days with aeration for 24 h1.2081%[59]
Green microalga (Bracteacoccus sp.)20 mL of MO solution (10 mg L−1), 0.10 g L−1 adsorbent dose, 20 °C temperature, and 75 min of contact time5.4297%The current study
Disclaimer/Publisher’s Note: The statements, opinions and data contained in all publications are solely those of the individual author(s) and contributor(s) and not of MDPI and/or the editor(s). MDPI and/or the editor(s) disclaim responsibility for any injury to people or property resulting from any ideas, methods, instructions or products referred to in the content.

