Article

Hydrogen–Water Isotope Catalytic Exchange Process Analysis by Simulation

Institute of Nuclear Physics and Chemistry, China Academy of Engineering Physics, Mianyang 621900, China
*
Author to whom correspondence should be addressed.
Separations 2024, 11(7), 219; https://doi.org/10.3390/separations11070219
Submission received: 2 June 2024 / Revised: 15 July 2024 / Accepted: 19 July 2024 / Published: 22 July 2024

Abstract

:
The hydrogen–water isotope catalytic exchange process has been widely applied in the tritium-containing water treatment process. It can be compared and analyzed conveniently with process simulation software. In this study, the catalytic exchange process was simulated by Aspen Plus software (V11). According to the simulation results, the main reaction process was that HDO in the liquid phase converts into HD in the gas phase, and the reaction mainly occurred at the bottom of the column, exhibiting a two-orders-of-magnitude-higher reaction amount compared to that observed in the top section. Different side reactions occur at distinct positions along the column, exhibiting a reaction amount that is lower by one to two orders of magnitude compared to the main reaction and aligning in the same direction as the main reaction. The optimum operating temperature is 60~80 °C, with the best performance observed at 70 °C, because of the large reaction equilibrium constant and the suitable ratio of vapor to hydrogen (1:4~1:1.5) in the gas phase. The influence of the residence time was investigated by introducing reaction kinetic equations. The residence time should be more than 1 s to ensure an adequate reaction. The influence of operating conditions on the hydrogen–water isotope catalytic exchange process can be deeply investigated by process simulation, and more mass transfer process quantities can be obtained. It plays a promoting role in guiding the process design and condition optimization.

1. Introduction

The technology of water–hydrogen isotope separation finds extensive applications in various fields such as the detritiation of light water [1], the production and purification of heavy water [2,3], the extraction of tritium from heavy water [4], and the preparation of deuterium-depleted water [5]. Distillation, electrolysis, hydrogen sulfide–water exchange, single- or double-temperature ammonia–hydrogen exchange, hydrogen–water exchange, and other processes are the primary methods employed for the separation of hydrogen isotopes [6]. Notably, hydrogen–water isotope exchange is widely utilized due to its mild reaction conditions, non-toxic and non-corrosive nature, high separation efficiency, and simplicity in operation [7].
Hydrogen–water isotope exchange technology typically employs processes such as vapor phase catalytic exchange (VPCE), liquid phase catalytic exchange (LPCE), and combined electrolysis catalytic exchange (CECE). VPCE, being the earliest technology, has a large processing scale but requires a high temperature and pressure, resulting in an elevated energy consumption and increased safety risks. The CECE technology demonstrates an enhanced efficiency in the separation of hydrogen isotopes and facilitates their concentrated accumulation. Moreover, it offers a substantial reduction in the utilization of titanium-based [8] or alternative hydrogen-absorbing materials during the gaseous product storage. However, its electrolysis process consumes a substantial amount of energy, making it economically inefficient for industrial applications. LPCE operates under relatively mild conditions (50–70 °C, and 1–1.2 atmospheres), boasts a lower energy consumption, and offers enhanced safety features. As a result, it has found widespread application in the separation of various hydrogen isotopes in water. Taking deuterium separation from water as an example, deuterium-enriched water is introduced at the top of the LPCE column, while natural hydrogen gas is fed in from the bottom. Inside the LPCE column, a hydrogen isotope exchange reaction occurs between HDO and H2 under the action of a catalyst, generating H2O and HD. Deuterium-depleted water exits from the bottom of the column, while deuterium-enriched hydrogen escapes from the top, effectively achieving deuterium separation from water. LPCE technology has been engineered for practical applications; for instance, South Korea’s Wolsong Tritium Removal Facility (WTRF) achieves a 97% reduction in tritium content in reactor heavy water through the implementation of the LPCE process [9]. The Tritium Removal Facility (TRF) at Russia’s PIK reactor also adopts the LPCE process by utilizing multiple series-connected LPCE columns to achieve tritium reduction and deuterium recovery [10]. Hydrogen energy, the most eco-friendly energy of the 21st century, has drawn worldwide focus. Its technological progress has enabled the economical mass production of heavy water [11]. Atomic Energy of Canada Limited similarly utilizes the LPCE process and has established a demonstration plant for heavy water production in Hamilton that combines LPCE with steam methane reforming to enrich the deuterium content in water [12].
Although most of the LPCE processes are primarily based on experimental research [13,14,15], it is challenging to explore the component distribution, reaction process, and changes in other parameters within the column solely by measuring the inlet and outlet components. To gain a comprehensive understanding of the mass transfer process within the LPCE column, process simulation can be employed to analyze the temperature, pressure, and gas and liquid distribution at each theoretical stage in the column, as well as variations in component content. This approach provides accurate data for trace components and allows for a thorough consideration of side reactions. The abundance of data obtained through process simulation facilitates a deeper comprehension. Furthermore, process simulation enables a convenient investigation into the impact of different operating conditions on catalytic exchange processes while reducing the experimentation requirements and guiding or validating both the process design and experimental results.
The simulation of the LPCE process has been the subject of extensive research. Krunal A. Mistry et al. have developed a steady-state process model that accurately predicts the performance of the entire exchange process using experimentally determined parameters [16]. Ye et al. simulated the hydrogen/deuterium exchange process in a column with alternating packing layers based on material balance equations and equilibrium relationships between deuterium in hydrophilic and hydrophobic packing layers, elucidating the influence of operating conditions on the separation efficiency [17]. The corresponding software has also been developed by various countries, such as FLOSHEET in Canada [18], SICA in Romania [19], and EVIO(version 5) in Russia [20]. However, these aforementioned software solutions are primarily tailored to specific application scenarios, with a limited consideration for simulating auxiliary equipment within the technological process and ensuring compatibility with other process simulation software.
In this study, we innovatively utilized Aspen Plus software (Aspen Plus V11), a widely used commercial software package in chemical engineering simulation [21,22,23,24]. This allowed us to simulate the hydrogen–water isotope catalytic exchange process within a reactive distillation column while incorporating commonly used operating units like pumps, compressors, and heat exchangers. By doing so, we were able to facilitate a convenient process design. It also provides a flexible interface to provide a basis for a future joint simulation with other processes, for example, the process simulation of the tritium fuel cycle system used in the fusion reactor‘s tritium plant. The objectives of this study are: (i) to analyze the component composition and reaction processes; (ii) to discuss the influence of temperature on the exchange process; and (iii) to employ kinetic reaction equations in order to investigate the impact of the residence time on mass transfer.

2. Process Modeling

2.1. Pure Component Properties

The simulation process is the water–hydrogen isotope catalytic exchange process with a gas–liquid countercurrent. Hydrogen is used to remove the HDO in water. The relative pure components include H2, HD, D2, H2O, HDO, and D2O. The activity coefficients used in this work have been calculated by the nonrandom two-liquid (NRTL) model equations, which is suitable for the systems containing polar components [25]. In the simulation process, the absent properties in the data are estimated and collected from other literature [26]. The main property parameters are listed in Table 1.

2.2. Reaction Equations

In the catalytic exchange process of H2-HDO, multiple hydrogen isotope exchange reactions occur, as shown in Equations (1) to (7):
H 2 O v + HD g K 1 HDO v + H 2 g
H 2 O v + D 2 g K 2 D 2 O v + H 2 g
H 2 g + D 2 g K 3 2 H D g
H D O v + D 2 g K 4 D 2 O v + H D g
H 2 O v + D 2 O v K 5 2 H D O v
H 2 O v + D 2 v K 6 H D O v + H D g
D 2 O v + H 2 g K 7 H D O v + H D g
According to the stoichiometric matrix, this system involves three independent reactions. Selecting reactions (1)–(3), their equilibrium constants are represented by Equations (8)–(10) [27]:
K 1 = y HDO y H 2 y H 2 O y H D = e 0.297 + 472 T
K 2 = y D 2 O y H 2 y H 2 O y D 2 = e 0.667 + 923 T
K 3 = y H D 2 y H 2 y D 2 = e 1.411 77.5 T
where Ki represents the reaction equilibrium constant of the equation i; yi represents the mole fraction of component i in the gas phase; and T represents the temperature, K. The equilibrium constants of other equations can be calculated from these three independent reactions, where:
K 4 = K 2 / K 1 ,   K 5 = K 3 K 1 2 / K 2 ,   K 6 = K 1 K 3 ,   K 7 = K 3 K 1 / K 2
The separation factor (α) of the hydrogen–water isotopic exchange is typically defined in terms of the deuterium (D)-to-protium (H) atom ratios in the two species at equilibrium [28]. A distinction exists in the definitions between the equilibrium constant and separation factor. For instance, Equations (12) and (13), respectively, present the definitions of the equilibrium constant and separation factor for the reaction described in reaction (1).
K 1 = H D O H 2 H 2 O H D = n H D O · n H 2 n H 2 O · n H D
α = D / H l i q D / H g = n H D O · n H 2 + n H D n H D · n H 2 O + n H D O
Therefore, in the case of a negligible content of D, the equilibrium constant can be approximated by the separation factor.
In the practical operation process, it is difficult to reach the reaction equilibrium for reactions (1) and (2) due to the loading ratio of the catalyst to packing and the gas–liquid flow rate. Therefore, to make the simulation results approach the actual situation, the reaction kinetics equations are introduced to describe the reaction process [26], and then the reaction process can be controlled by adjusting the residence time.
r 1 = k 1 ( y H D y H 2 1 K 1 y H D O y H 2 O )
r 2 = k 2 ( y D 2 O y H 2 O 1 K 2 y D 2 y H 2 )
ln k 1 = 11.869 3104.2 T
ln k 2 = 9.8372 3565.0 T
where ri represents the reaction rate of component i, s−1; and ki represents the reaction kinetic constant of component i.

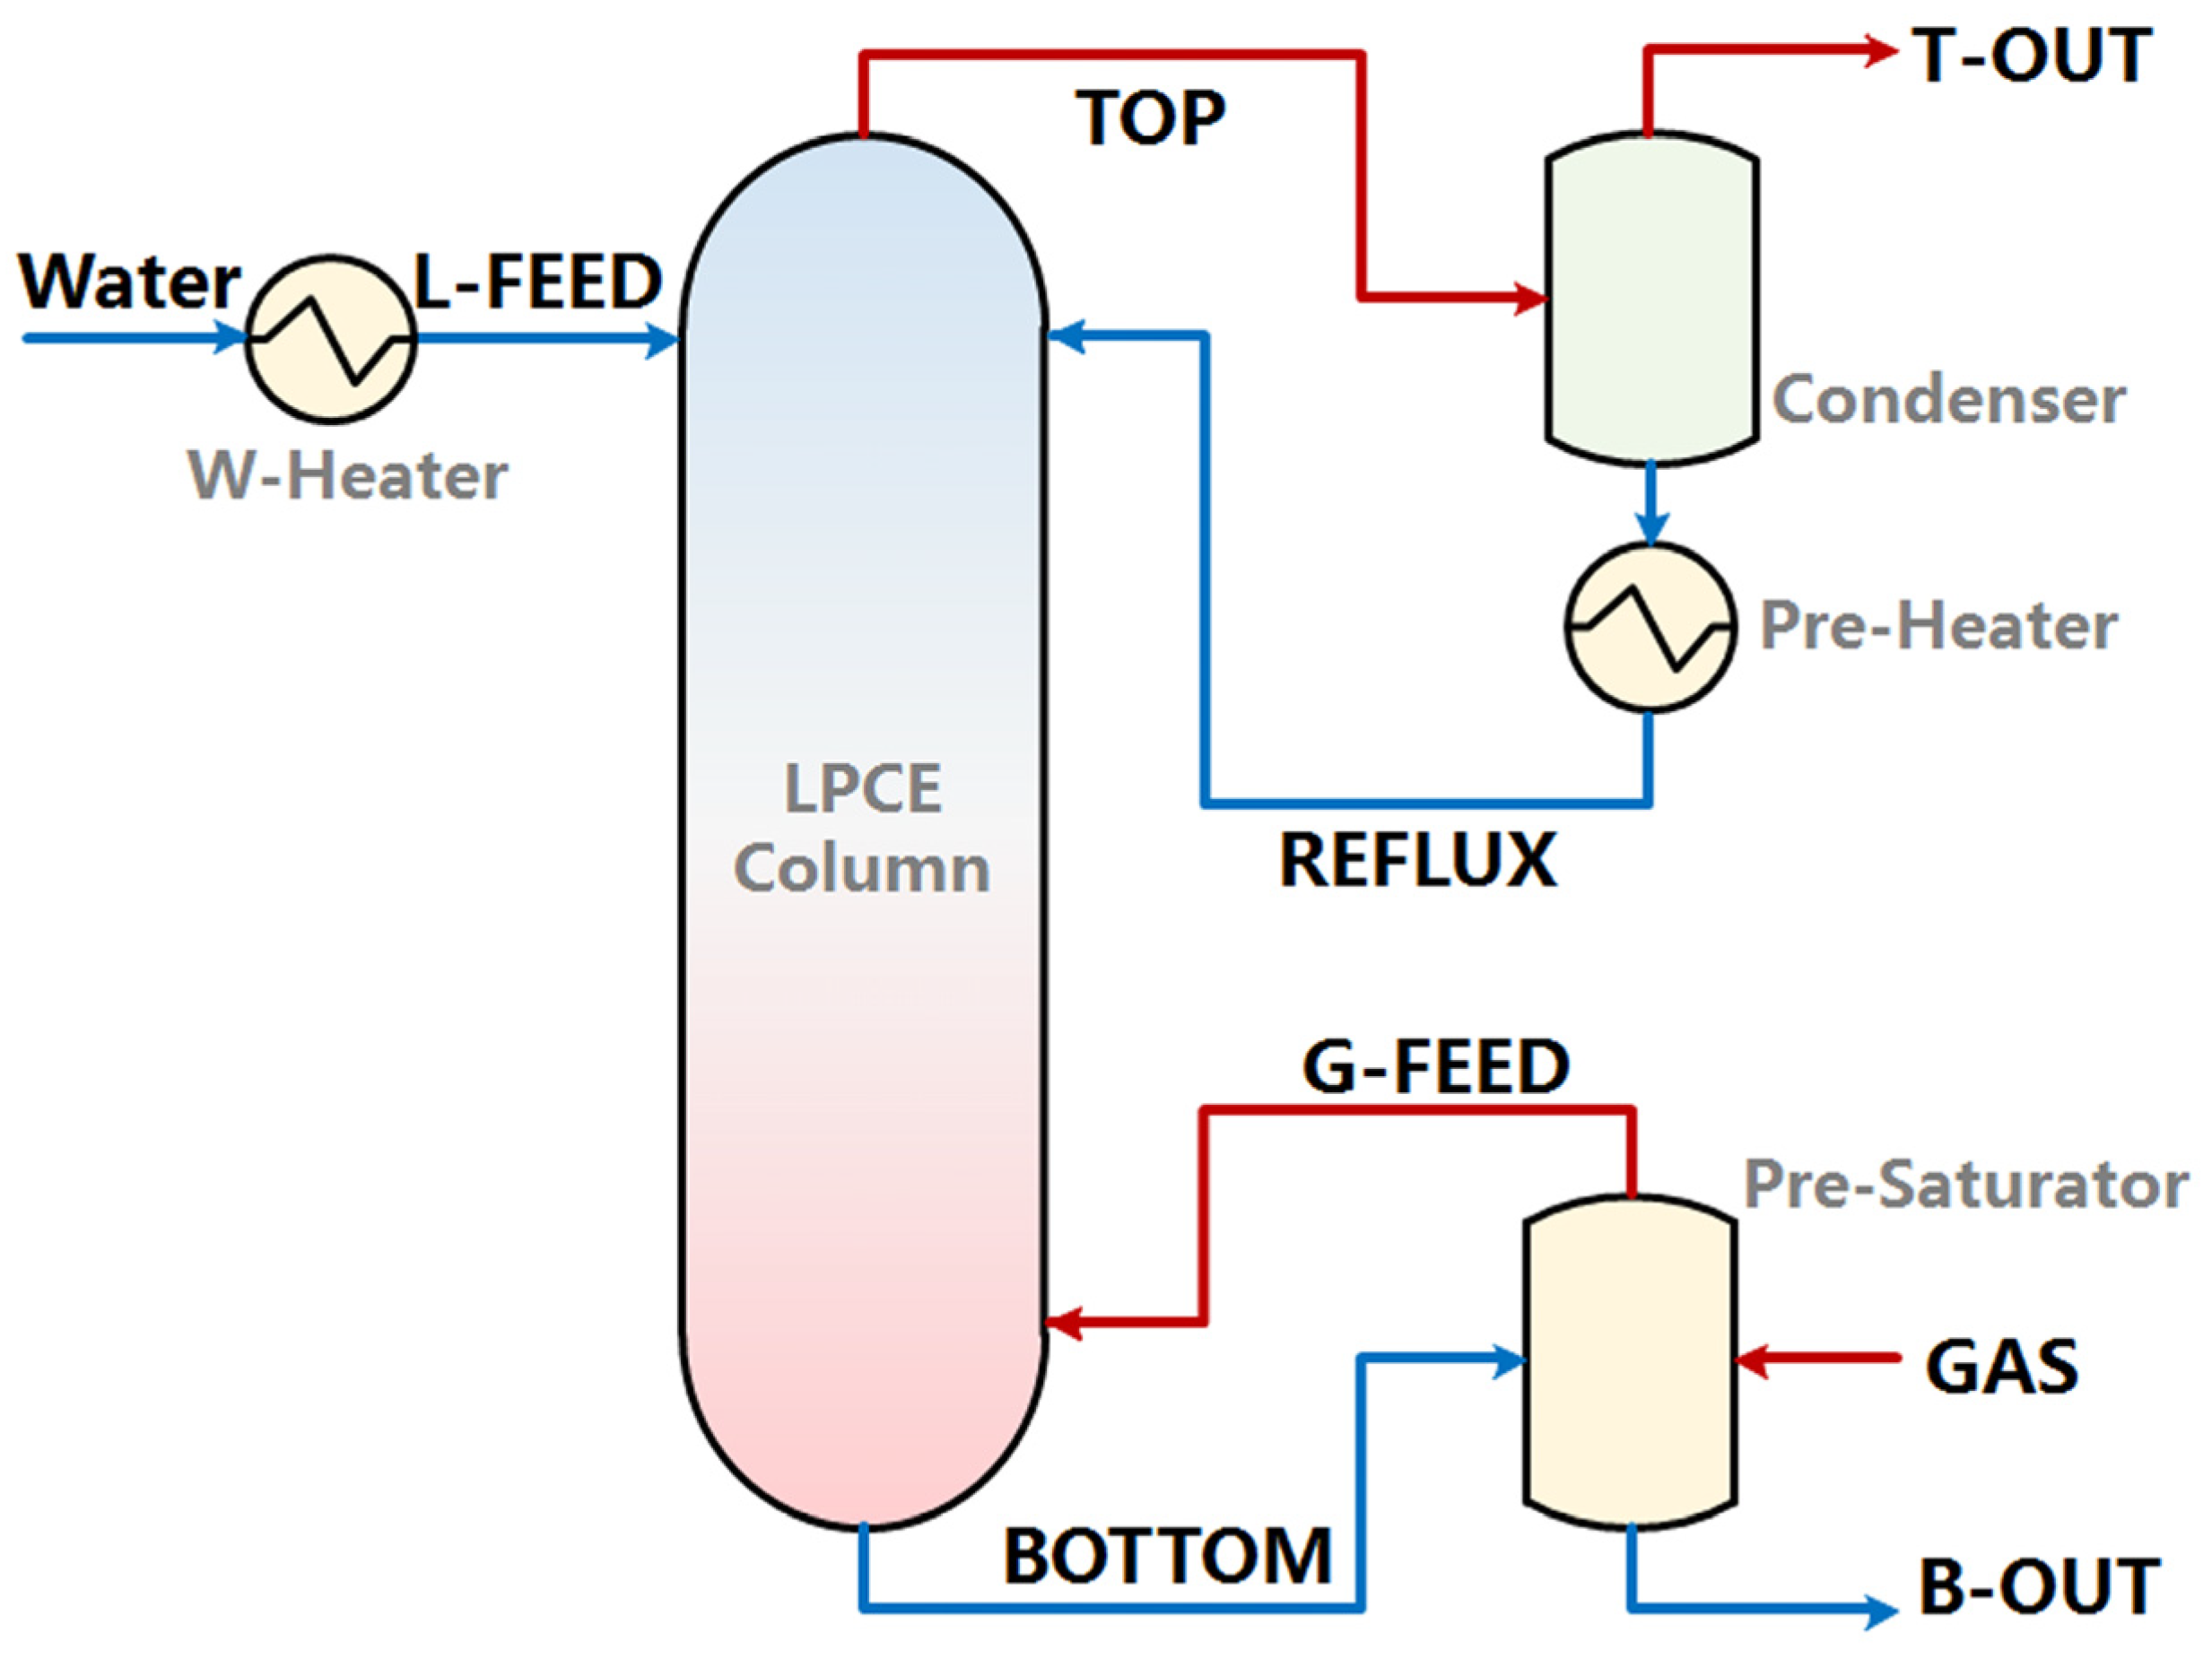
2.3. Simulation Process

The hydrogen–water isotope catalytic exchange process consisted of the catalytic reaction with a hydrophobic catalyst and the mass transfer between the liquid and vapor with hydrophilic packing. The reaction process makes D transfer from HDO to HD in the gas, and then the evaporation of HDO in the liquid is promoted. For the analysis presented in this paper, the type of homogeneous package is assumed. To simulate the simultaneous reaction and evaporation–condensation mass transfer process, two types of models are calculated: the chemical equilibrium and phase equilibrium model (CEPE) and the chemical kinetics and phase equilibrium model (CKPE). The following assumptions were made: (1) The pressure drop does not affect performance. (2) There is no radial distribution uniformity difference. (3) In the CEPE model, thermodynamic equilibrium and chemical equilibrium are achieved on each theoretical stage. (4) In the CKPE model, the extent of the reaction is controlled by the residence time, and it does not assume gas–liquid equilibrium at each stage. The CKPE model is closer to the actual situation because it is extremely difficult to achieve the equilibrium assumptions during practical operation.
During the simulation process, the primary module utilized was the RadFrac Column implemented in Aspen Plus software, where reaction equations were configured. By defining parameters such as the theoretical plate number, reaction equilibrium constant, effective phase state, convergence method, operating pressure, and flow distribution, along with invoking relevant properties of the separated material and combining them with material balance, energy balance, and phase balance equations, the tower equipment can be solved using a stage calculation. Additional modules, including Flash and Heater, were employed for gas–liquid phase separation and fluid temperature control. As depicted in Figure 1, water (20 °C, 10 mol/h; the molar fraction of deuterium is 5%) was heated and introduced from the top of the column (L-FEED). Pure hydrogen gas (GAS, 20 °C, 20 mol/h) was initially saturated with the liquid stream exiting the bottom of the column (BOTTOM) in a pre-saturator, mirroring real-world conditions, before being fed into the bottom of the column (G-FEED). The liquid stream exiting the pre-saturator (B-OUT) represented the deuterium-depleted water product. The gas stream exiting the column (TOP) was condensed to recover the water vapor. The condensate was pre-heated and returned to the top of the column (REFLUX) to ensure it did not affect the temperature distribution within the column. The gas with a minor vapor content constituted the top product (T-OUT).
The main operation parameter settings are as follows: The number of theoretical stages is 10, and the top of the column is defined as the first stage, and the bottom is defined as the tenth stage. The column pressure is 1 atm without a pressure drop; the temperature of the Condenser is 0 °C; and the operation temperature is controlled with the W-Heater, Pre-Heater, and Pre-Saturator. Unless otherwise specified, the operation temperature is 60 °C.

3. Result and Discussion

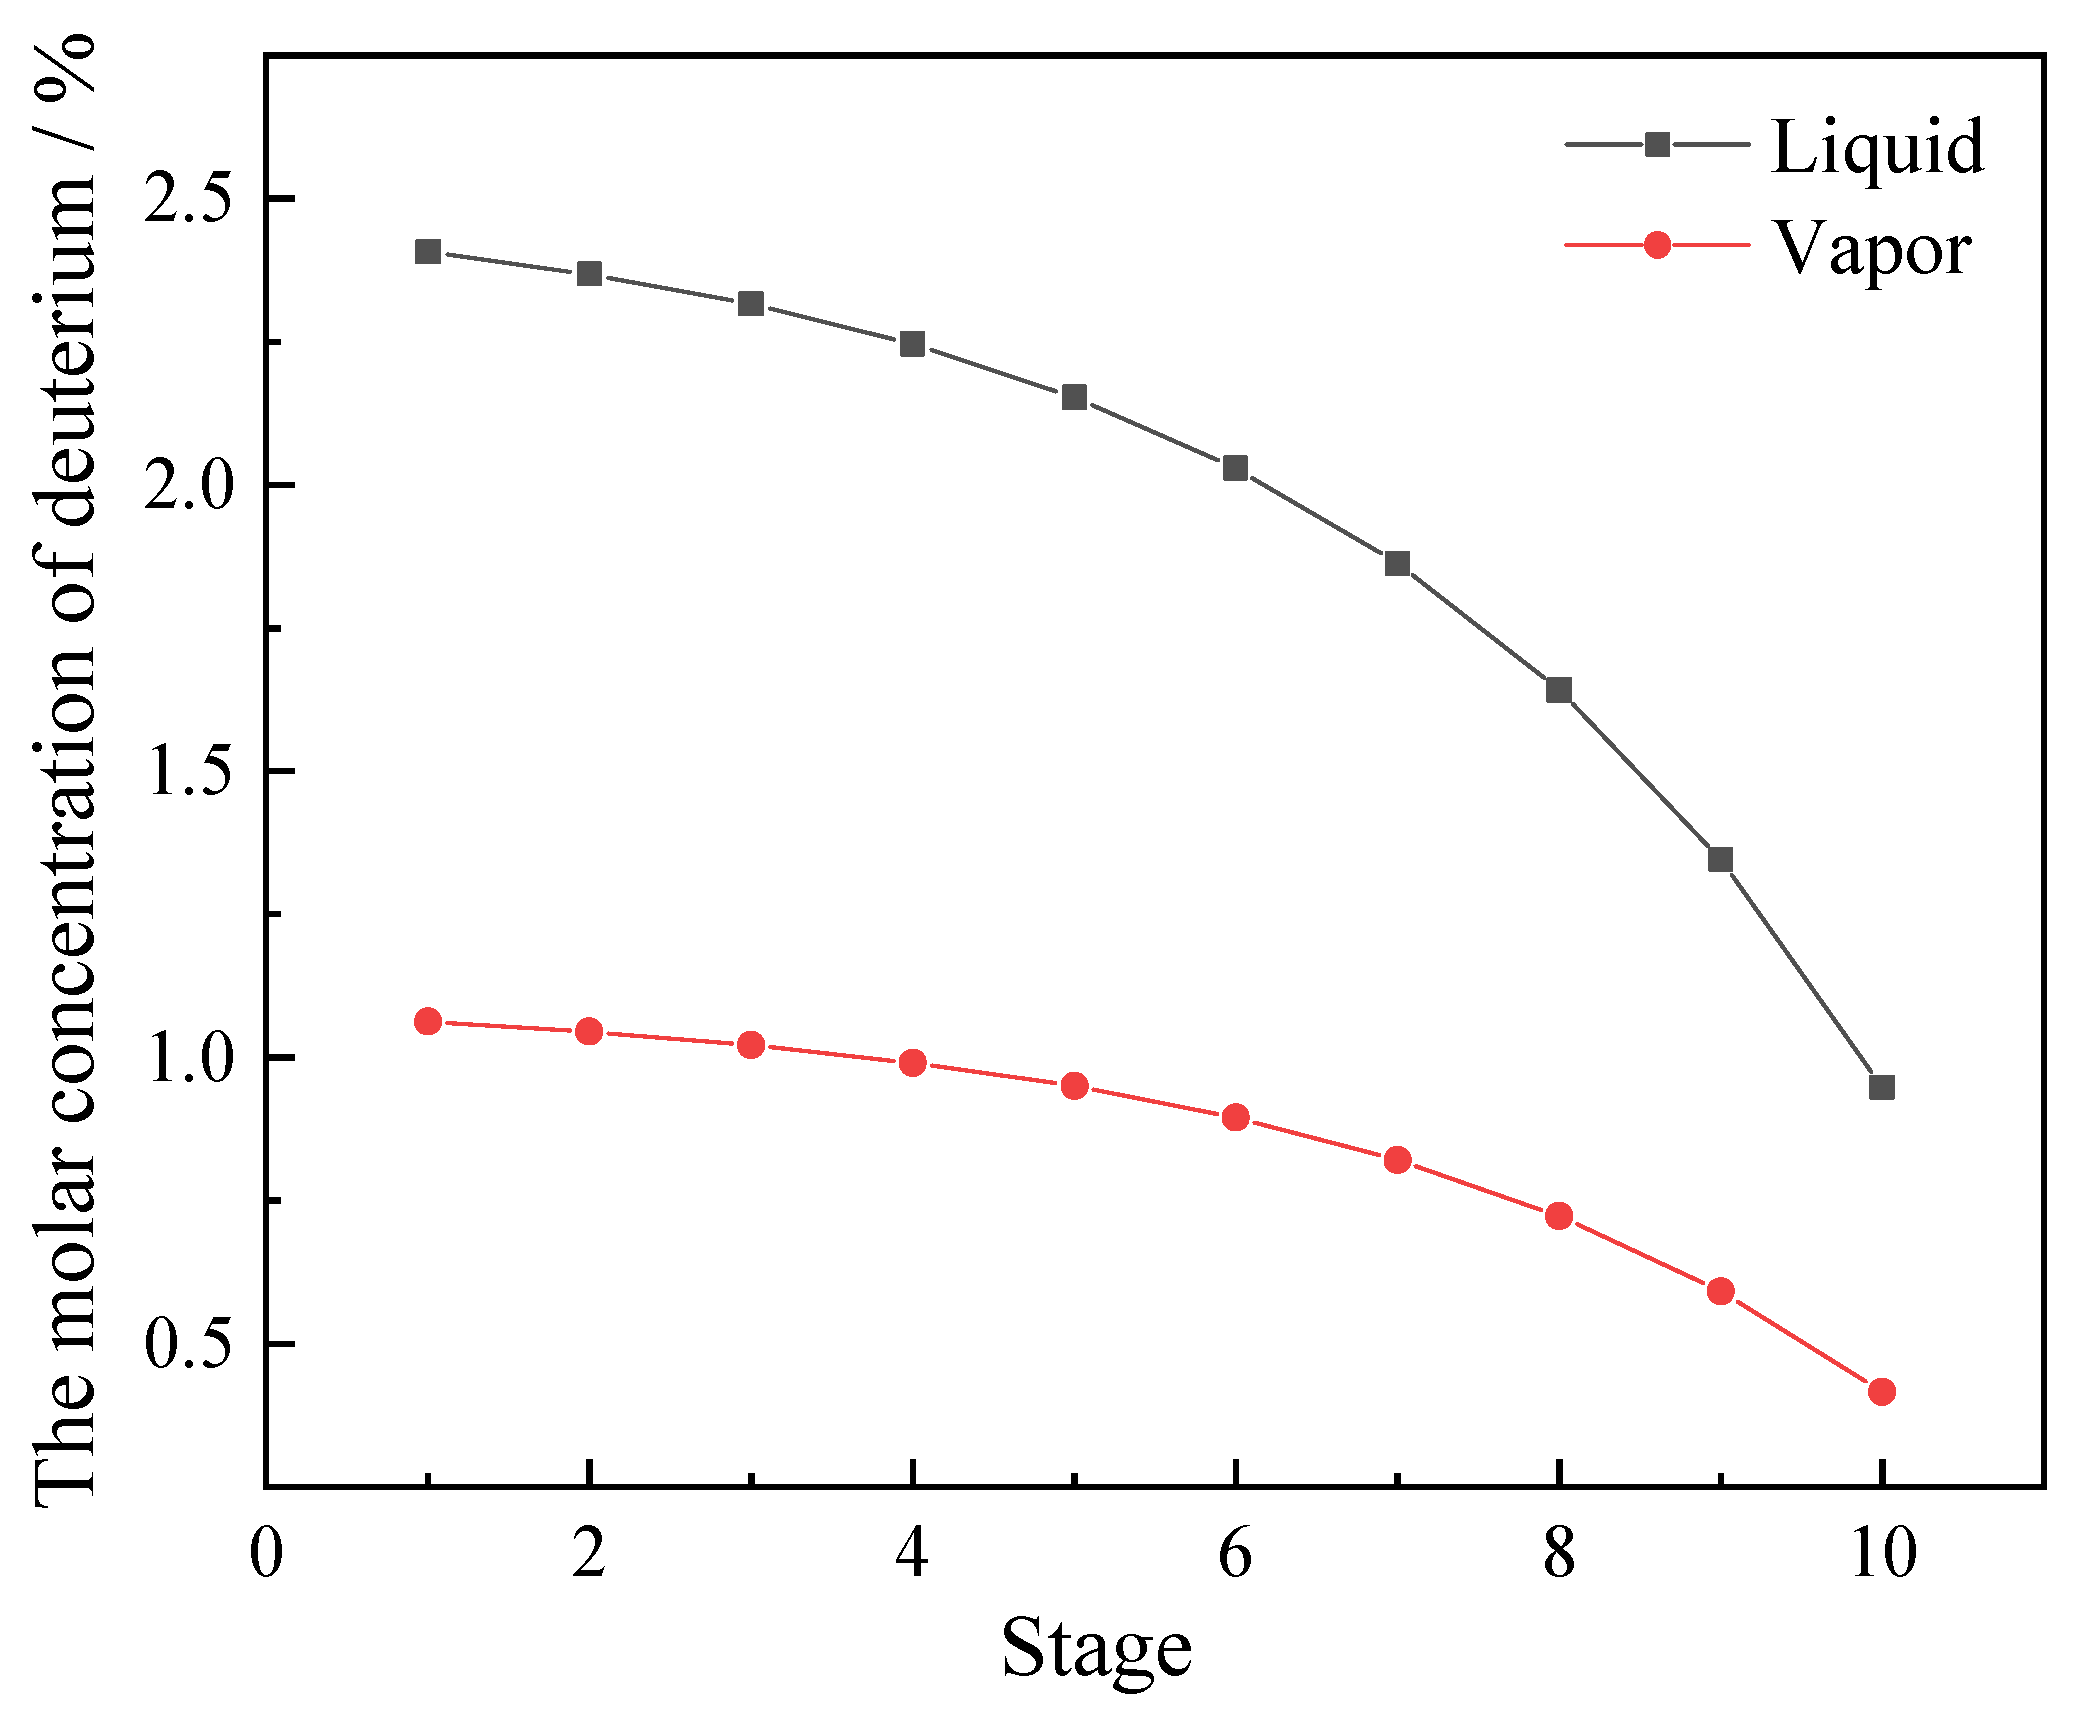
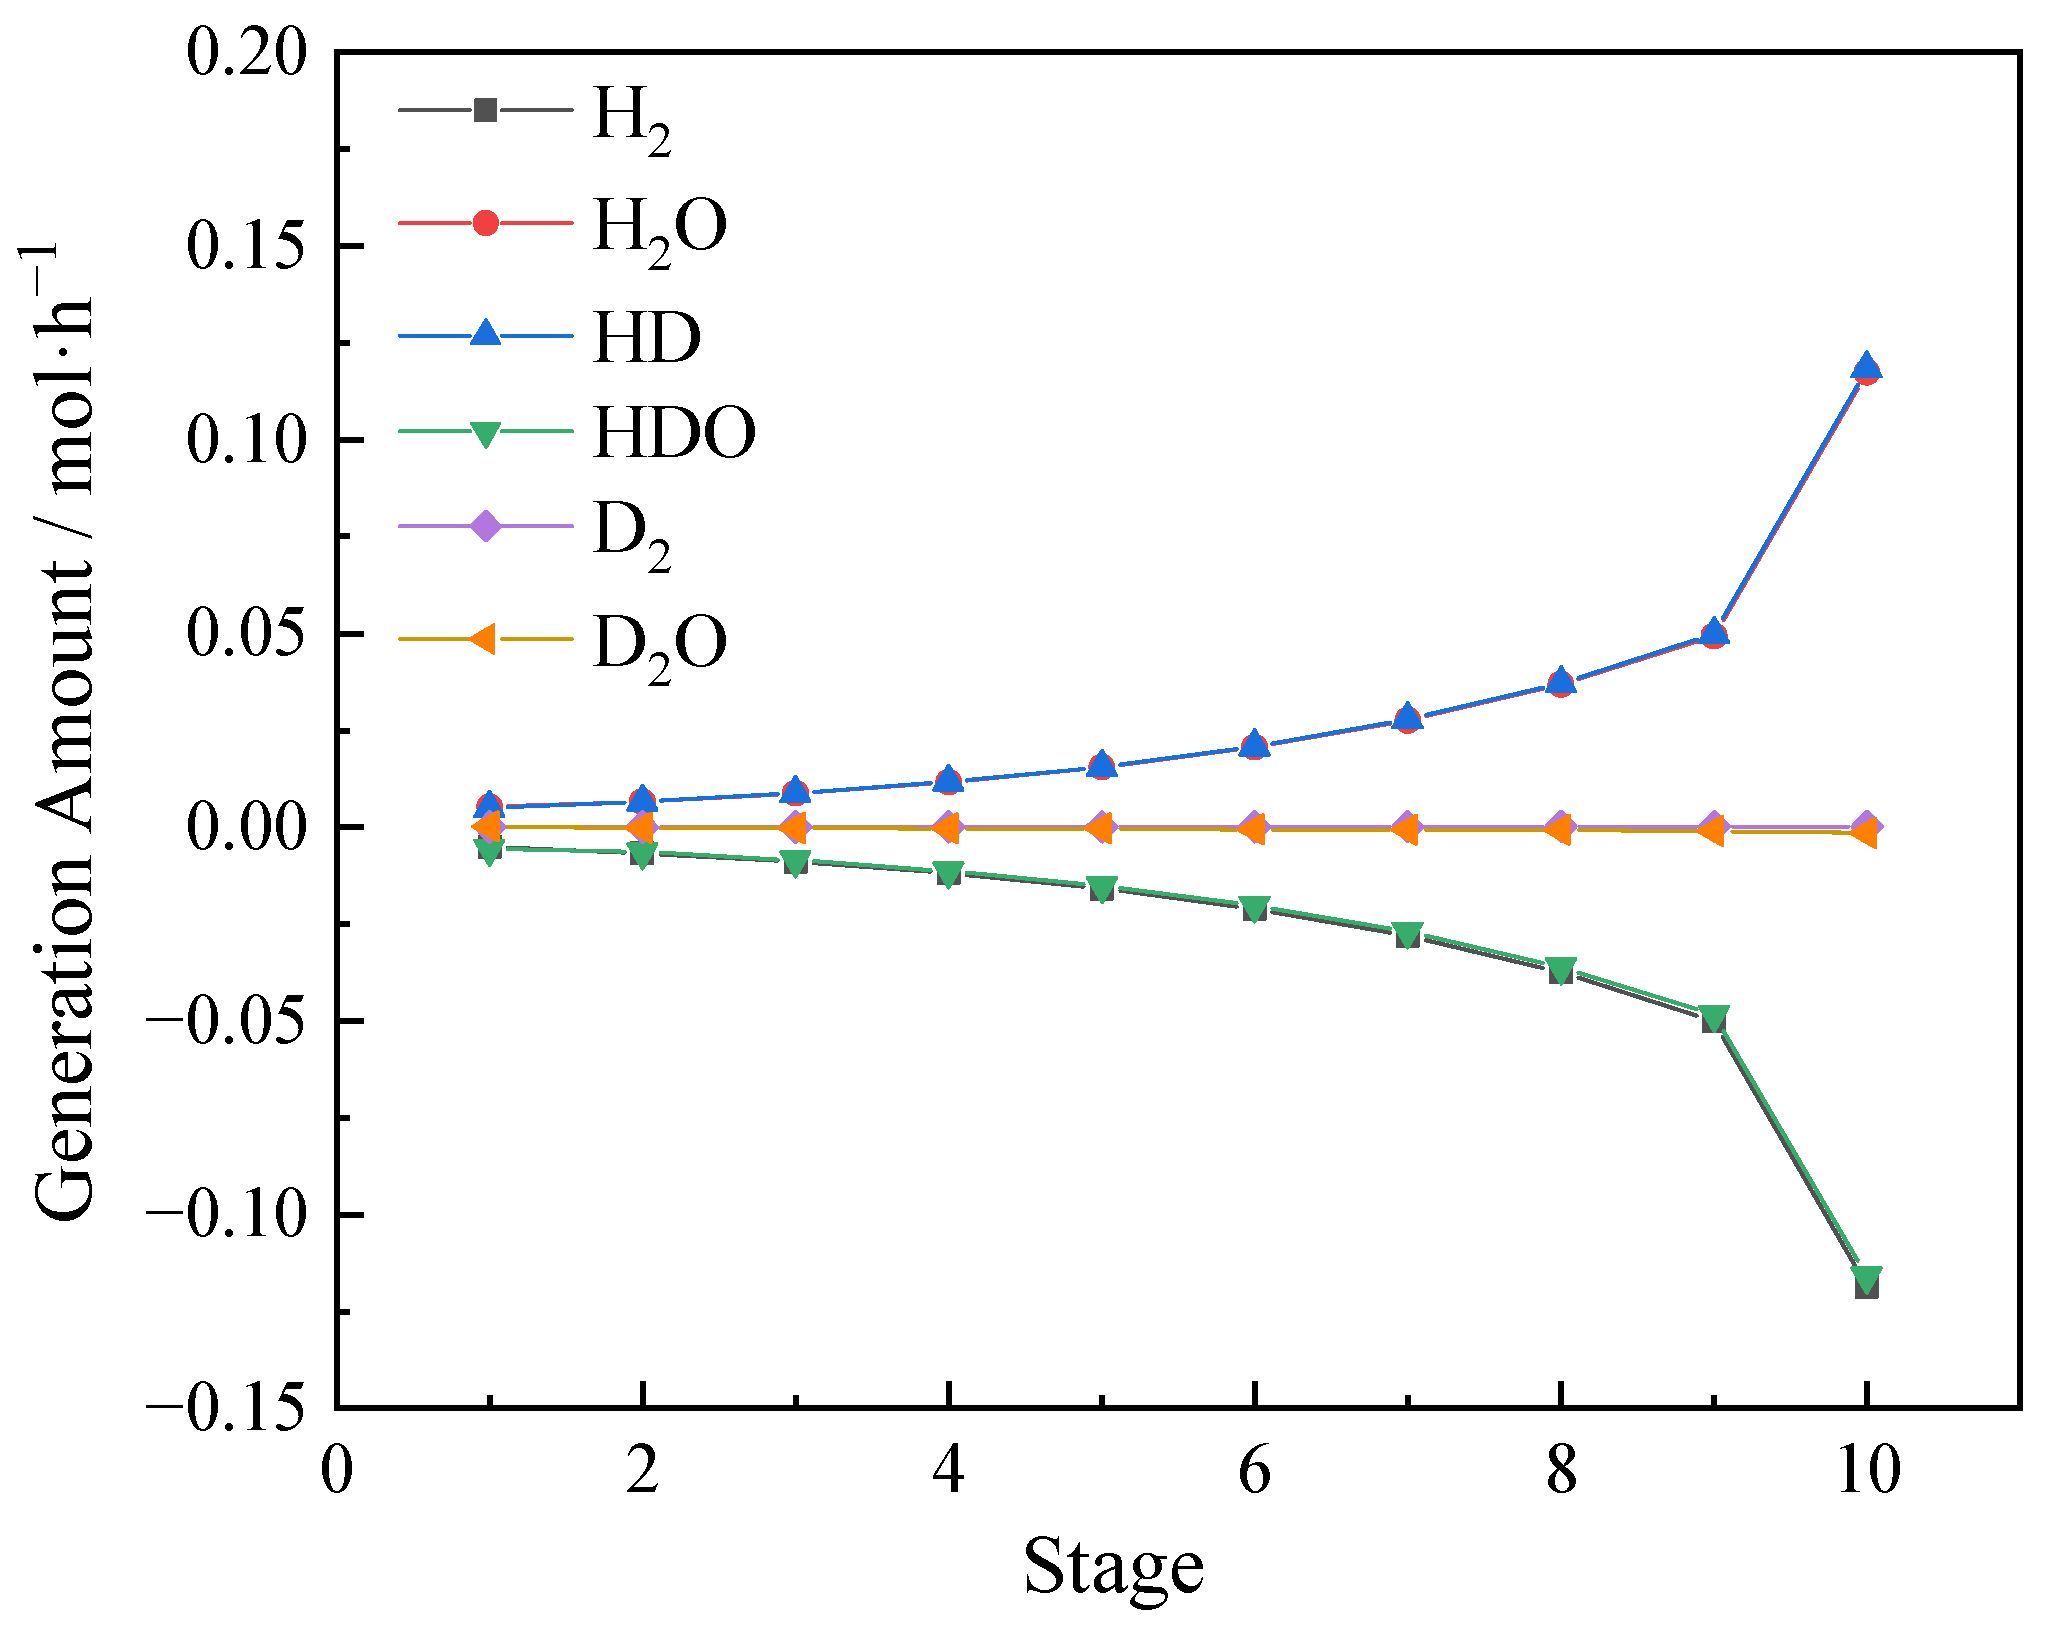
3.1. Reaction Process Analysis

According to the simulation results of the hydrogen–water isotope catalytic exchange process, Figure 2 illustrates the distribution of the deuterium (D) molar concentration with an increase in the number of stages. Both in the liquid and gas phases, the concentration of deuterium gradually decreases from top (stage 1) to bottom (stage 10). The water-containing deuterium enters the top of the column, resulting in the first stage having the highest deuterium concentration. This is consistent with the results measured by Bornea et al. in the experiment [29].
To further investigate the change in each component, the reaction amount of the six components in the system on each stage is shown in Figure 3. A positive value in the figure indicates that the substance is a product, corresponding to its generation amount, while a negative value indicates that the substance is a reactant, corresponding to its consumption.
According to the reaction amount of each substance, the main reaction process at each stage is the reaction Equation (1) which converts HDO and H2 into HD and H2O. From stage 1 (the top) to stage 5 (the middle), the order of the reaction amount is 10−3 mol/h; from stage 6 to stage 9, the order is 10−2 mol/h; and, on stage 10 (the bottom), the amount is 1.2 × 10⁻¹ mol/h. It is obvious that the lower part of the column is the main position for the isotope exchange process. This is attributed to the exchange of deuterium in water into hydrogen gas, where the concentration of deuterium in natural hydrogen at the bottom of the column is minimal, far from equilibrium, thereby providing a substantial driving force for the reaction and resulting in a maximal reaction amount.
Moreover, this process is accompanied by subordinate reactions:
2 H D O D 2 O + H 2 O
H 2 + 2 H D O D 2 + 2 H 2 O
D 2 O + 2 H 2 H 2 O + 2 H D
D 2 O + H 2 H 2 O + D 2
Since the water-containing deuterium is fed from the top, the highest composition of HDO in the liquid leads to a small amount of D2 and D2O generation at stage 1. The apparent reaction are Equations (18) and (19). The reaction amount of Equation (18) is 2.1 × 10⁻⁴ mol/h, which is one order of magnitude lower than the main reaction (1). The amount of reaction (19) is also one order of magnitude lower than reaction (18). For stage 1, the overall reaction amount is relatively small (5.5 × 10⁻³ mol/h) mainly because of the minimum D composition difference between the gas and liquid phase. For stage 2~10, the deuterium in D2O generated at stage 1 needs to be further transferred into the gas phase, so the subordinate reaction is Equations (20) and (21). The reaction amount of Equation (20) is usually one to two orders of magnitude lower than the main reaction (1). That of reaction (21) is the same order or one order lower than that of reaction (20). For all stages, although the reaction amount of the subordinate reactions is relatively small compared with the main reaction, it is still a part of the result of the catalytic exchange mass transfer process because the exchange direction of deuterium is consistent with the main reaction.
In addition, the maximum deuterium concentration difference between the gas and liquid phase occurs at the column bottom, corresponding with the largest reaction amount as shown in Figure 3. From the bottom to the top, the composition of each substance tends to the equilibrium state, and the reaction amount gradually decreases. Therefore, in the actual operation, increasing the residence time of the gas at the bottom is beneficial to making the reaction fully proceed and improving the mass transfer effect.

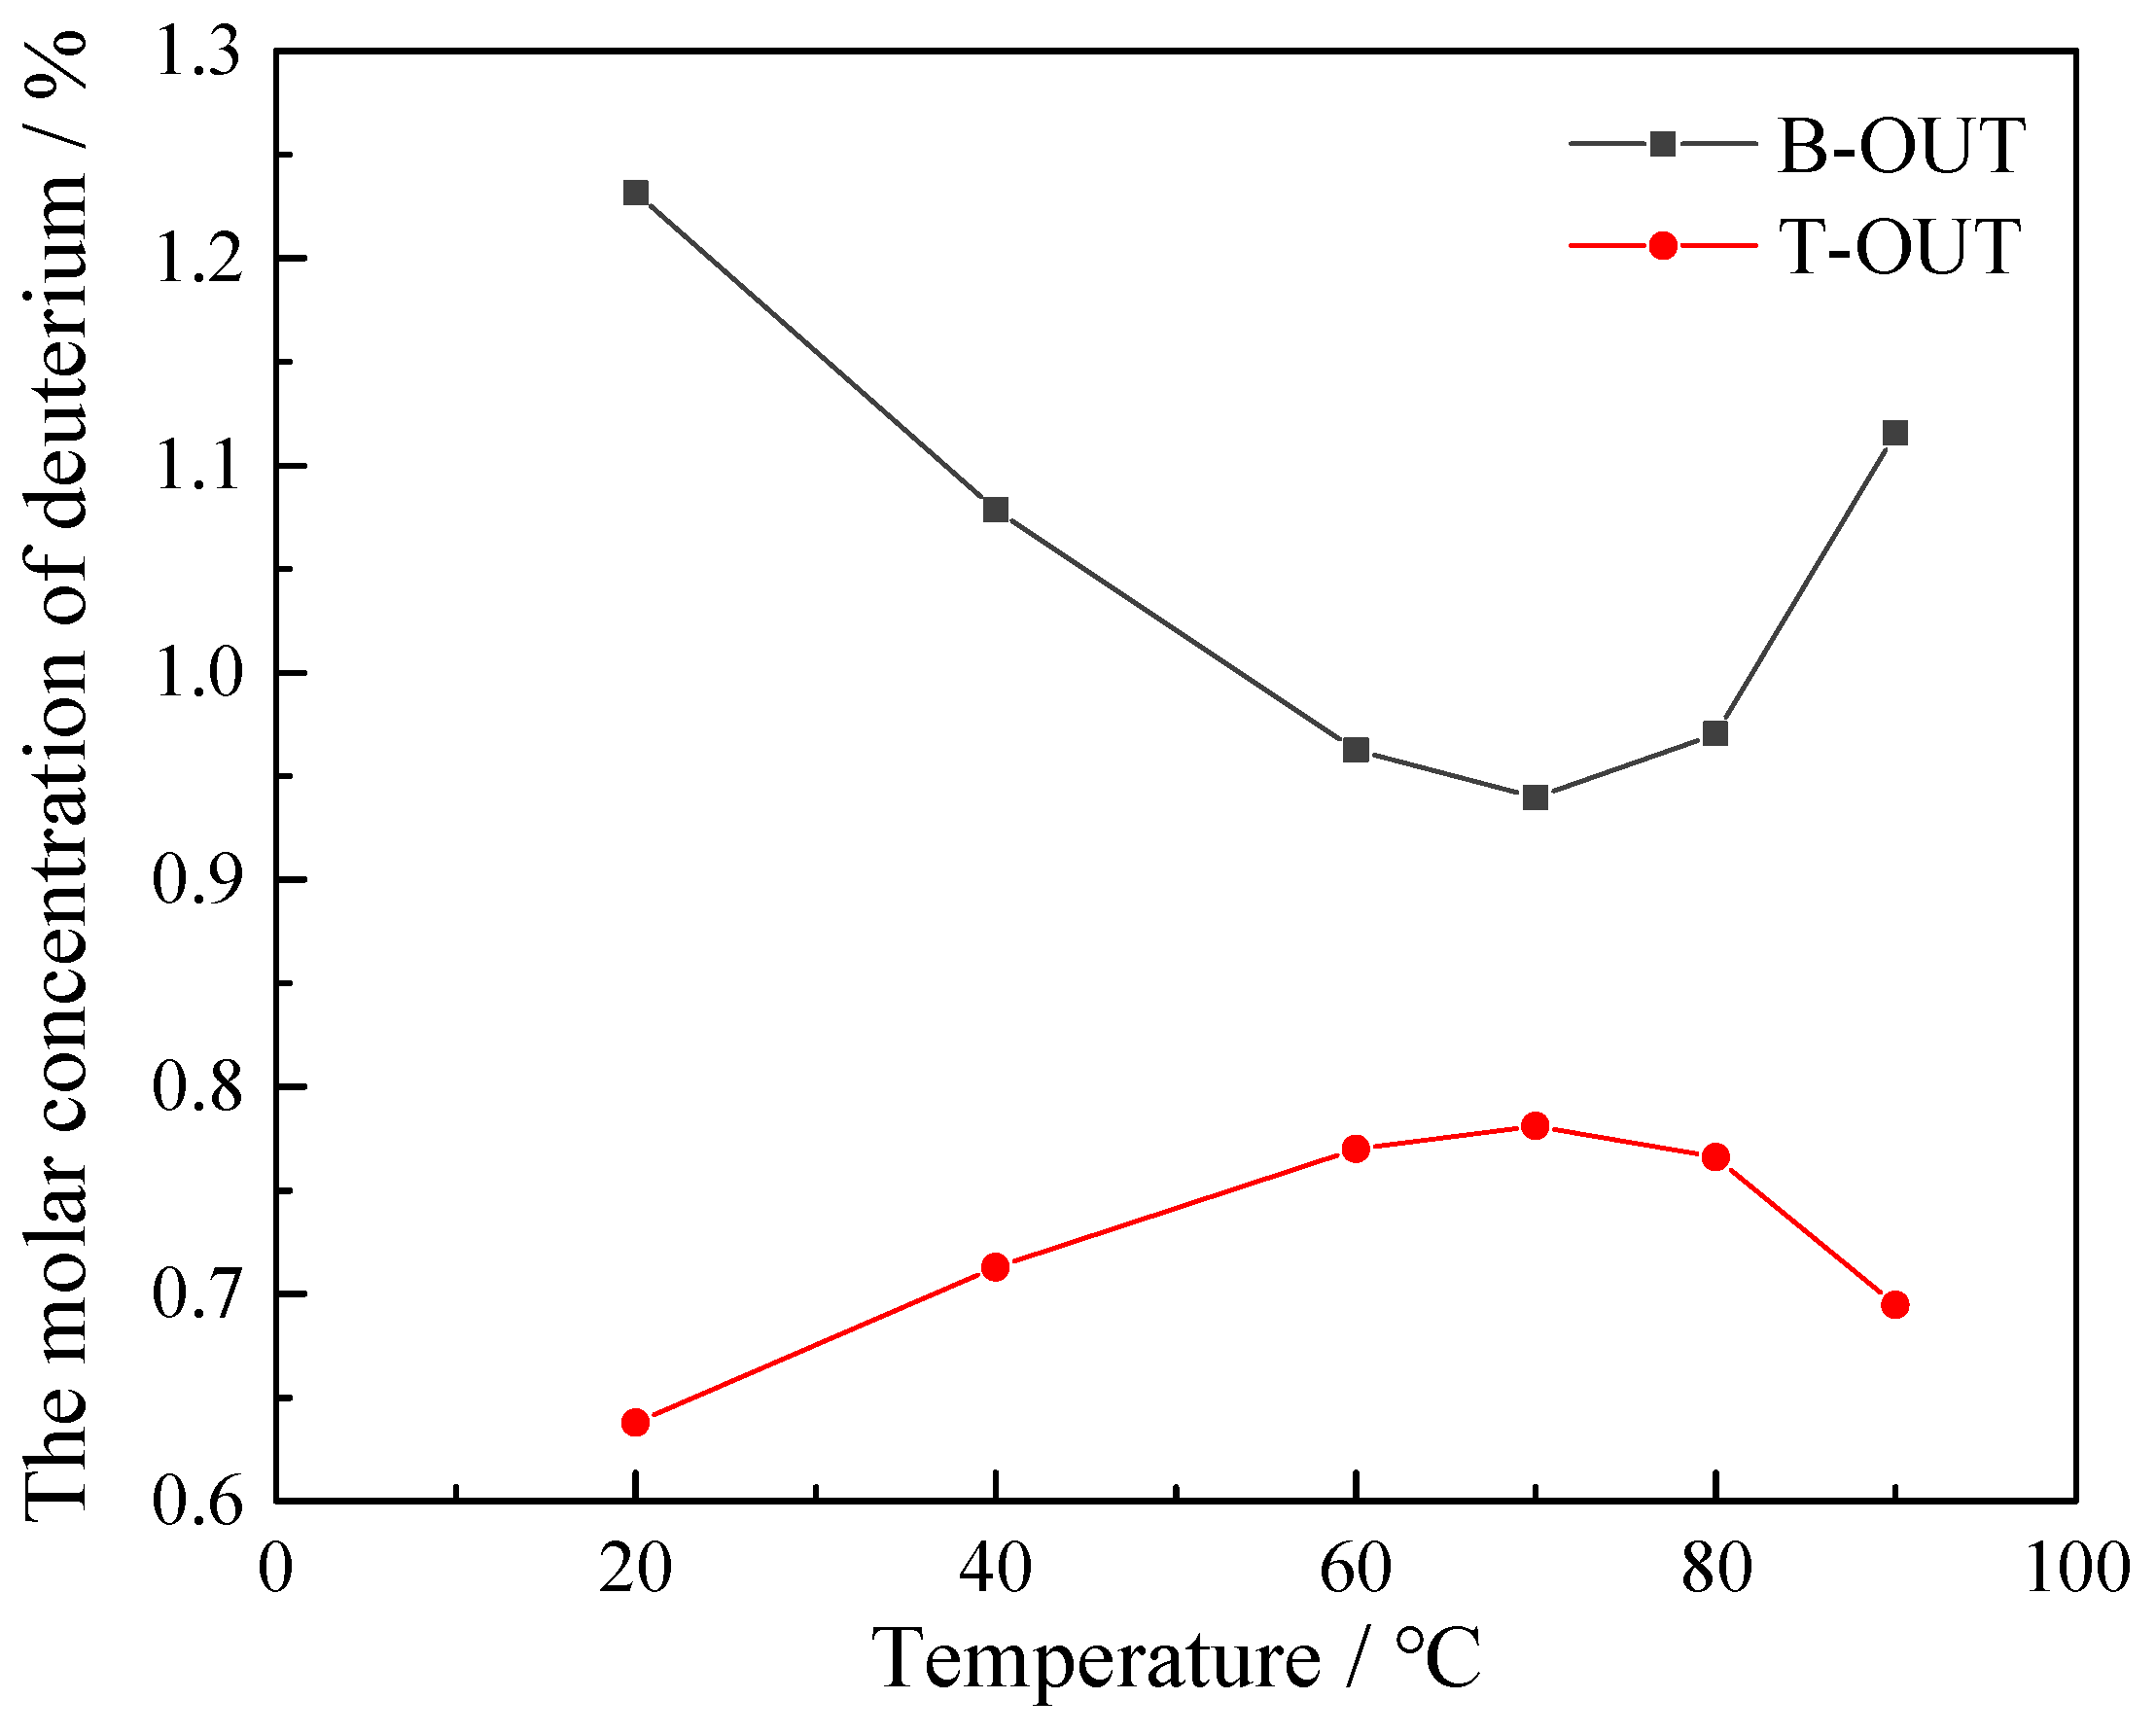
3.2. Effect of Operating Temperature

The operating temperature exerts a significant influence on the gas–liquid catalytic exchange process, as temperature variations directly impact the water vapor content in the gas phase, thereby affecting the reaction kinetics and catalytic exchange efficiency. During the simulation process, temperature settings affecting the operating conditions encompass the temperatures of the Pre-Heater, Pre-Saturator, and L-FEED. By varying these temperatures, the molar fraction of deuterium in streams T-OUT and B-OUT is depicted in Figure 4. For T-OUT, the deuterium molar fraction exhibits an increasing trend from 20 °C to 70 °C, followed by a decrease from 70 °C to 90 °C; conversely, for B-OUT, the trend is reversed, with the molar concentration of deuterium peaking at 70 °C. This is basically consistent with the experimental results of Li et al. [30].
In the context of isotope catalytic exchange processes, the conversion rate of HDO to HD is governed by both gas-phase reactions and vapor–liquid mass transfer processes. Under conditions where reactions are neglected, the water content between the vapor and liquid phases remains nearly identical. This phenomenon arises from the phase equilibrium constants of HDO and H2O, which range from 1.08 to 1.03 at temperatures of 20~90 °C [10] under 1 atm pressure. However, during the isotope catalytic exchange process, evaporated HDO undergoes a conversion to HD via catalytic exchange reactions, while HDO in the liquid phase continues to vaporize to maintain phase equilibrium. These dual processes facilitate the conversion of HDO in the liquid phase to HD in the gas phase.
Concerning the reaction kinetics, as depicted in Figure 5a, the reaction equilibrium constant K increases with rising temperature. In the simulation, the molar fraction of deuterium is 5% of the raw material liquid, and natural hydrogen is used as the raw material gas. The reaction process is the conversion of deuterium from the liquid phase to gas phase, which is equivalent to the reverse reaction of reaction (1), and the equilibrium constant is the reciprocal of K1, so it tends to decline with the rise in temperature. This is consistent with the research conclusions of Bulter et al., except that they are expressed using the trend of the separation factor of the forward process of reaction (1) with the change in temperature [28]. The relationship between the water vapor content in the gas phase and temperature is illustrated in Figure 5b. Within the temperature range of 20~70 °C, the content increases from 2% to 30%, while, from 70 °C to 90 °C, it sharply rises to 70%. When the water vapor content is relatively low (<30%), the gas phase is predominantly composed of H2. The increased water vapor content signifies an increase in HDO in the gas phase, thereby promoting the conversion of HDO to HD. However, at temperatures exceeding 70 °C, the substantial presence of H2O vapor in the gas phase becomes the primary component, inhibiting the conversion of HDO. Consequently, the conversion of HDO reaches its peak value at approximately 70 °C.
From the perspective of the reaction process, it is dominated by the HDO conversion to HD and the main reaction is Equation (1) according to the discussion in 3.1. It is also verified by the total generation amount of HD at different temperatures as shown in Figure 6a. The variation tendency is highly consistent with that of the molar concentration of deuterium as shown in Figure 5, and 70 °C is the optimal temperature. The amount of HD generated at each stage is plotted in Figure 6b. The main location of HD generation is at the column bottom. The amount of HD generation is about 0.12 mol/h at 20~70 °C, 0.13 mol/h at 80 °C, and 0.15 mol/h at 90 °C. With the temperature raising, the composition of HDO in the gas phase is increasing due to water evaporation. Meanwhile, pure hydrogen feeds into the bottom. The large concentration difference and high reaction equilibrium constant at a high temperature are both conducive to the isotope exchange process. As for stages 1~9, the amount of HD generated increases linearly at 70~90 °C. The HD composition in the gas phase has achieved a high value due to the large reaction amount at the bottom which is unfavorable for the conversion of HDO to HD. Only the concentration distribution of HDO leads to the removal of deuterium. At relatively low temperatures (20~60 °C), H2 is the main component of the gas phase. Although a large amount of HD is generated at the bottom, H2 is still surplus because of the relatively low HDO composition in the gas phase, and then HD can be generated evidently at stages 5~9. Close to the top of the column, the gas phase composition changes slightly, and the amount of HD generation gradually reduced. Therefore, the tendency is approximately an exponential curve.
The change in the molar concentration of deuterium in different phases performs similarly, as shown in Figure 7: a simi-liner tendency at 70~90 °C and a simi-exponential tendency at 20~60 °C. Moreover, the variation between liquid and vapor is highly consistent, which indirectly verifies the deduction above: the composition of water between the vapor and liquid phases is almost the same and the reaction process mainly occurs between hydrogen and water vapor.
In conclusion, at 60~80 °C, the proportion difference of the molar concentration of deuterium between the hydrogen phase and water vapor is appropriate (1:4~1:1.5), which can promote the continuous transformation of D from vapor to hydrogen. However, considering the influence of energy consumption and the improvement of D removal caused by the temperature increasing as shown in Figure 8, 60 °C is recommended as the optimal operation temperature. From 60 °C to 70 °C, the power consumption increased 0.11 kW (74%), while the molar concentration of deuterium in B-OUT only decreased 0.02% (2.4%).

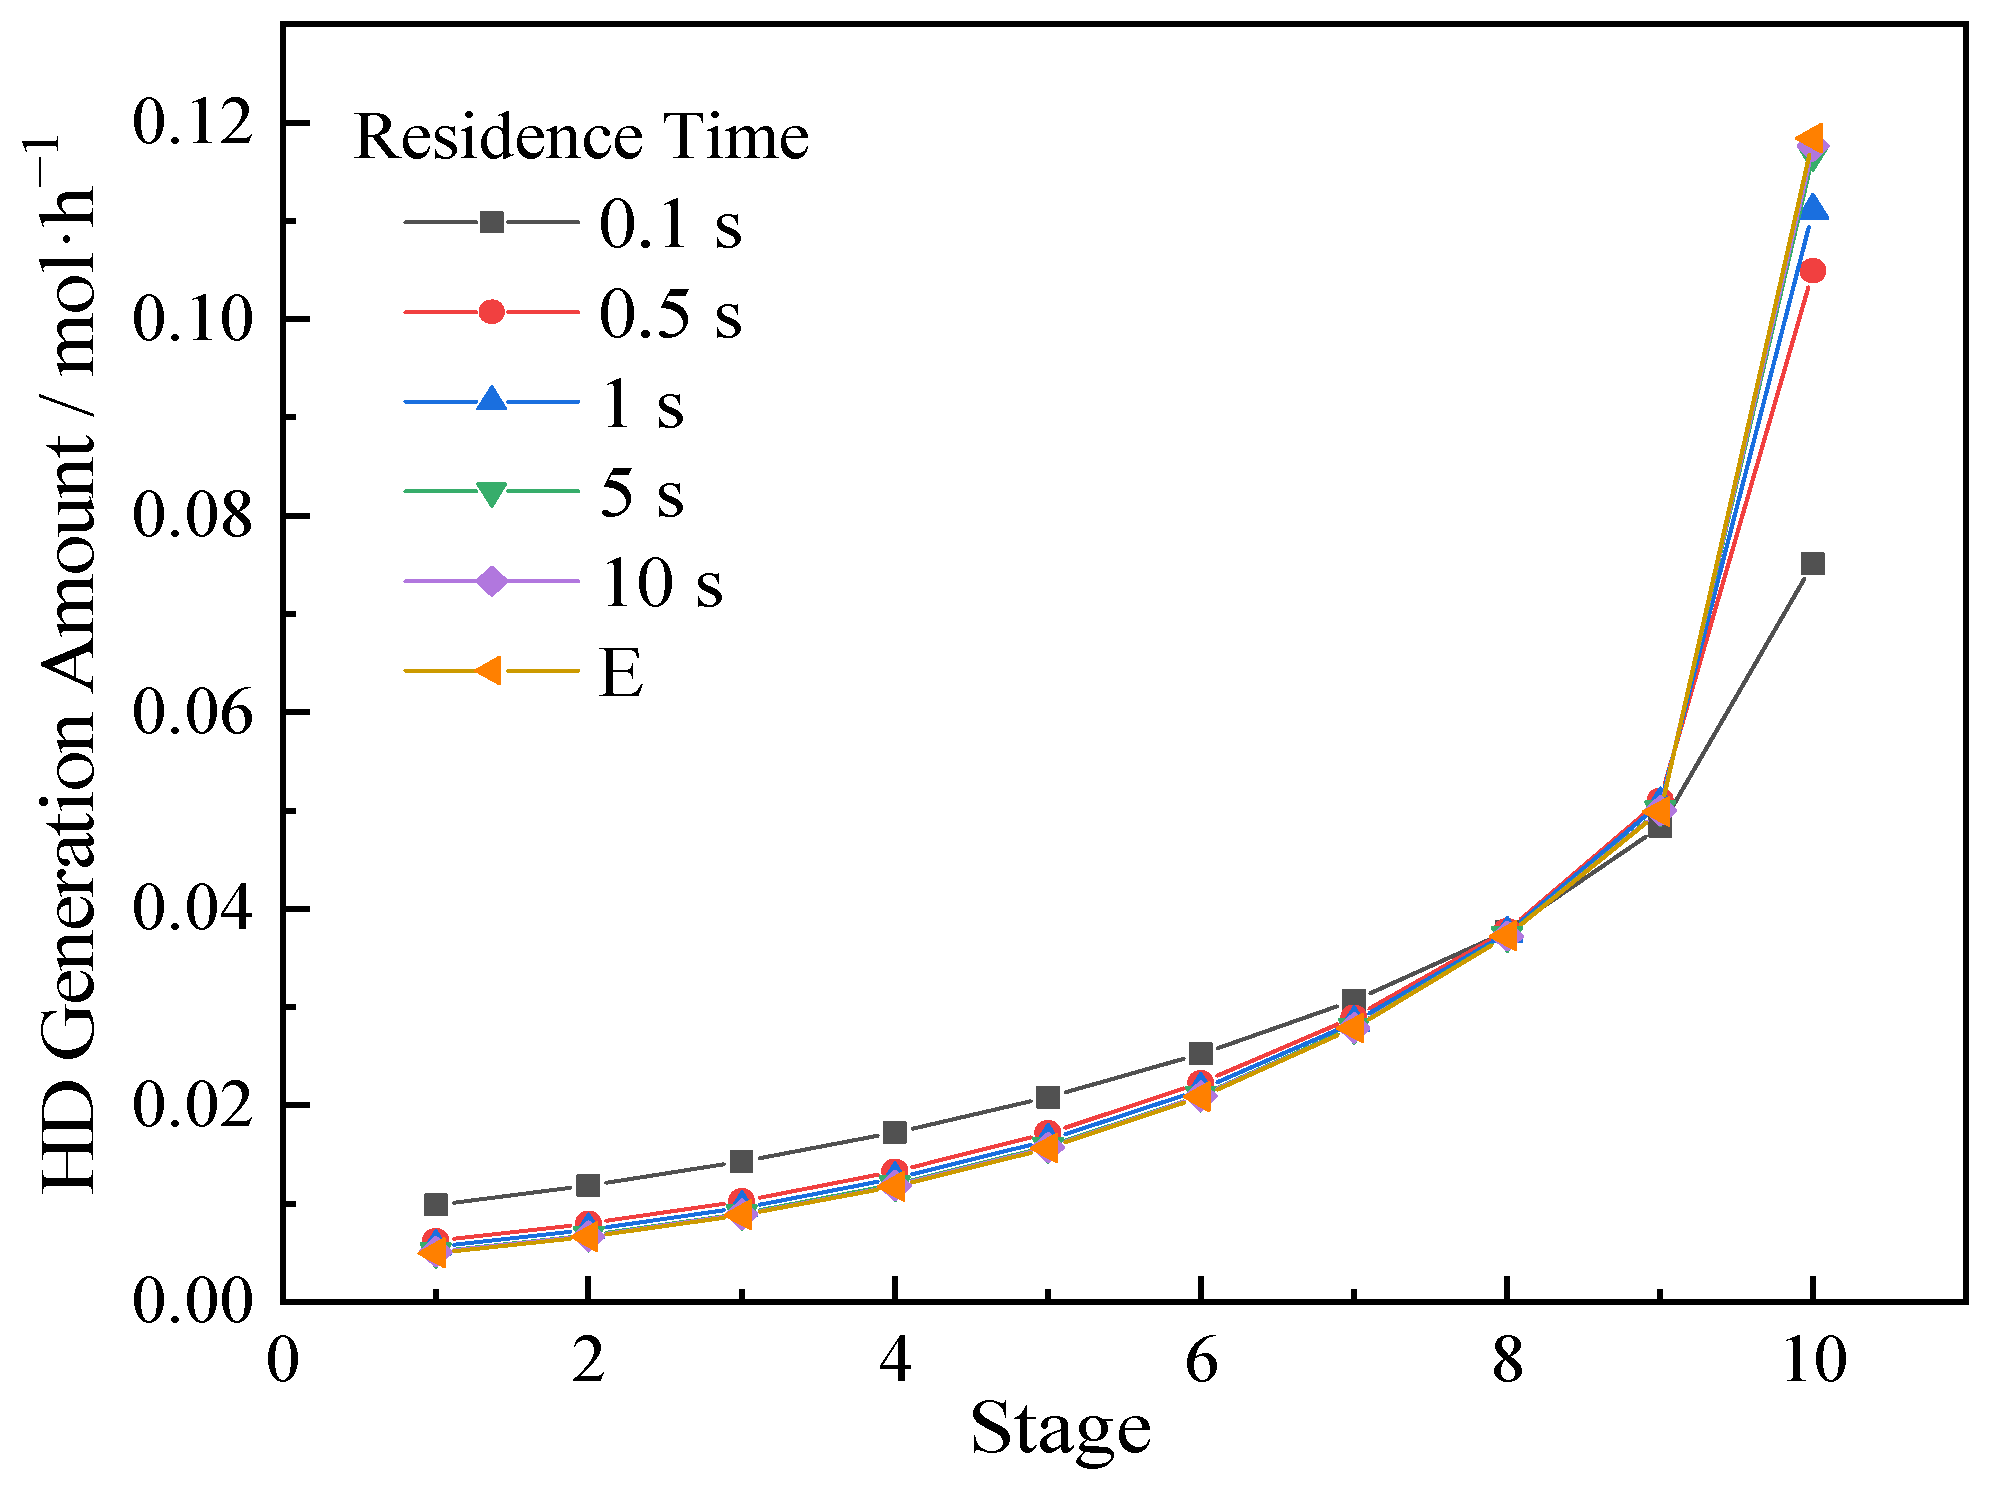
3.3. Effect of Reaction Kinetic Process

The assumption of the CEPE model is that the composition of the gas and liquid streams leaving the stage simultaneously achieves the vapor–liquid phase equilibrium and gas reaction equilibrium states. However, in practical operational processes, it is almost impossible to satisfy this assumption because achieving equilibrium requires sufficiently long residence times at each equilibrium stage. With variations in the column parameters, catalyst and packing loading, and operating conditions, the residence times for the reaction and mass transfer differ. Therefore, the reaction kinetic equations (CKPE model) are introduced to explore the influence of the residence time on the hydrogen–water isotope catalytic exchange process. Figure 9 illustrates the relationship between the residence time and the molar concentration of deuterium of the T-OUT and B-OUT streams. As the residence time at each stage increases, the molar concentration of deuterium gradually approaches equilibrium. When the residence time exceeds 1 s, the catalytic exchange effect significantly approaches equilibrium with only a 0.61% relative deviation. According to the literature reports, the height equivalent of the theoretical plate (HETP) in the hydrogen–water isotope catalytic exchange process typically ranges from 20 to 30 cm [31,32], while the gas velocity in an empty column is usually between 0.15 and 0.25 m per second [31,32]. Considering the flow resistance caused by catalysts and packing in practical columns, the residence time for HETP exceeds 1 s, consistent with the assumption of the CEPE model.
The variation of the residence time directly affects the final catalytic exchange effect because it influences the extent of the reaction and the reaction process. As mentioned above, the main reaction on each stage is Equation (1). Taking the HD generation amount as an example, the influence of different residence times on it is shown in Figure 10. When the residence time is 0.1 s, the increment between adjacent stages is relatively uniform. For the other residence times, the generation amount at the bottom is obviously higher than the other stages. HD is mainly generated in the middle and lower parts of the column, and the reaction process is also consistent with that of the CEPE model. For the higher parts of the column, when the residence time is ≤5 s, the subordinate reactions are Equations (19) and (21); and, when the residence time is 10 s, the reaction process is consistent with the CEPE model, which is reaction (18) and (19). It can be inferred that the reaction rate of Equation (21) is relatively slow, which means it needs a long residence time to reach equilibrium.
During the actual operation process, it is beneficial to improving the effect of the catalytic exchange by adjusting the gas–liquid flux and the type or loading ratio of the catalyst and packing to provide a sufficient residence time and ensure it fully reacts. However, a long residence time will reduce the treatment capacity, and, then, affect the isotope exchange process efficiency. Therefore, it needs to be comprehensively considered to choose the optimal value.

4. Conclusions

The hydrogen–water isotope catalytic exchange process is a complex mass transfer process consisting of vapor–liquid phase equilibrium and a gas-phase catalytic reaction. Analyzing the composition changes at different positions in the column through experiments is challenging. However, process simulation is a convenient method to explore the distribution of temperature, flux, and composition at each stage. Aspen Plus software is applied to analyze the reaction process, temperature influence, and kinetic process. The main reaction process involves converting HDO in the liquid phase into HD in the gas phase, with the primary reaction occurring at the bottom of the column. Subordinate reactions vary depending on the position in the column, temperature, and residence time. For the operating temperature, the optimal range is 60–80 °C, where the reaction equilibrium constant is large, and the proportion of water vapor and hydrogen in the gas phase is appropriate for the continuous conversion of deuterium from liquid to gas. According to the CEPK model, a residence time longer than 1 s should be provided to ensure the full extent of the reaction process. By combining the reaction kinetics equations, the influence of different operating conditions on the reaction process can be investigated by adjusting the residence time.
The process simulation analysis of the hydrogen–water isotope catalytic exchange system is convenient for obtaining the mass transfer process parameters, which is beneficial for exploring the mechanism of this process and guiding its process design and condition optimization. The simulation can also reduce experimental consumption and improve efficiency. However, to further improve the accuracy of the simulation, more experiments are still needed to investigate the reaction kinetics process with different catalysts and loading ratios. To extend the simulation method to tritium-containing systems, the corresponding physical property data and kinetic equations are necessary to ensure the simulation results are instructive.

Author Contributions

Conceptualization, S.P.; methodology, H.W. and C.X.; investigation, J.H. and J.L.; data curation, J.H. and J.L.; writing—original draft preparation, J.H. and J.L.; writing—review and editing, J.H.; supervision, S.P.; All authors have read and agreed to the published version of the manuscript.

Funding

This research received no external funding.

Data Availability Statement

Data available on request from the authors.

Conflicts of Interest

The authors declare no conflicts of interest.

References

  1. Bukin, A.N.; Marunich, S.; Pak, Y.; Rastunova, I.; Rozenkevich, M.; Chebotov, A.Y. Specific features and current status of processes for tritium removal from water: A critical review. Fusion Sci. Technol. 2022, 78, 595–606. [Google Scholar] [CrossRef]
  2. Galley, M.R. Future Trends in Heavy Water Production; Atomic Energy of Canada Ltd.: Chalk River, ON, Canada, 1983. [Google Scholar]
  3. Ridzuan, N.D.M.; Ayodele, B.V.; Talib, N.N.A.; Shaharun, M.S.; Shariff, A.M.; Ahmad, K.N. Synthesis and characterization of hydrophobic nickel catalyst supported on different oxides for continuous liquid phase catalytic exchange reaction. J. Ind. Eng. Chem. 2024, in press. [Google Scholar] [CrossRef]
  4. Bondarenko, S.D.; Alekseev, I.A.; Fedorchenko, O.A.; Konoplev, K.A.; Vasyanina, T.V. Conceptual design of multi-purpose heavy water detritiation plant. Fusion Sci. Technol. 2017, 71, 605–609. [Google Scholar] [CrossRef]
  5. Butler, J.P. Hydrogen isotope separation by catalyzed exchange between hydrogen and liquid water. Sep. Sci. Technol. 1980, 15, 371–396. [Google Scholar] [CrossRef]
  6. Rae, H.K. Selecting heavy water processes. In The Separation of Hydrogen Isotopes; Rae, H.K., Ed.; American Chemical Society: Washington, DC, USA, 1978; Volume 68, pp. 1–26. ISBN 9780841204201. [Google Scholar]
  7. Ye, L.; Luo, D.; Tang, T.; Yang, W.; Yang, Y. Hydrogen isotope separation in hydrophobic catalysts between hydrogen and liquid water. Fusion Eng. Des. 2015, 100, 576–580. [Google Scholar] [CrossRef]
  8. Shi, Z.; Xiong, Y.; Wu, H. Preparation and hydrogen sorption performance of Ti-based hydrogen-absorbing materials without activation. Chin. J. Rare Met. 2022, 46, 1567–1572. [Google Scholar]
  9. Song, K.M.; Sohn, S.H.; Kang, D.W.; Paek, S.W.; Ahn, D.H. Installation of liquid phase catalytic exchange columns for the Wolsong tritium removal facility. Fusion Eng. Des. 2007, 82, 2264–2268. [Google Scholar] [CrossRef]
  10. Bondarenko, S.D.; Alekseev, I.A.; Fedorchenko, O.A.; Vasyanina, T.V. The current status of the heavy water detritiation facility at the NRC (Kurchatov Institute)–PNPI. Fusion Sci. Technol. 2020, 76, 690–695. [Google Scholar] [CrossRef]
  11. Wan, C.; Zhou, L.; Xu, S.; Jin, B.; Ge, X.; Qian, X.; Cheng, D.G. Defect engineered mesoporous graphitic carbon nitride modified with AgPd nanoparticles for enhanced photocatalytic hydrogen evolution from formic acid. Chem. Eng. J. 2022, 429, 132388. [Google Scholar] [CrossRef]
  12. Miller, A.I. Heavy water: A manufacturer’s guide for the hydrogen century. Can. Nucl. Soc. Bull. 2001, 22, 1–14. [Google Scholar]
  13. Lu, Z.; Li, J.; Fu, X.; Hou, J.; Ran, G.; Xiao, C.; Wang, X. Superhydrophobic Pt@SBA-15 catalyst for hydrogen water isotope exchange reactions. Int. J. Hydrogen Energy 2022, 47, 18080–18087. [Google Scholar] [CrossRef]
  14. Fedorchenko, O.A.; Alekseev, I.A.; Bondarenko, S.D.; Vasyanina, T.V. Recent progress in the experimental study of LPCE process on “eVIO” pilot plant. Fusion Sci. Technol. 2017, 71, 432–437. [Google Scholar] [CrossRef]
  15. Bornea, A.M.; Zamfirache, M.V. The influence of the extraction of gas/liquid samples on the isotopic separation regime of the CECE process. Fusion Eng. Des. 2024, 201, 114293. [Google Scholar] [CrossRef]
  16. Mistry, K.A.; Shenoy, N.S.; Bhanja, K.; Kohli, D.K.; Shenoy, K.T. Modeling and experimental investigation for development of Combined Electrolysis and Catalytic Exchange process for hydrogen isotope separation. Chem. Eng. Res. Des. 2023, 192, 487–499. [Google Scholar] [CrossRef]
  17. Ye, L.; Luo, D.; Tang, T.; Yang, W.; Zhao, P. Process simulation for hydrogen/deuterium exchange in a packed column. Int. J. Hydrogen Energy 2014, 39, 6604–6609. [Google Scholar] [CrossRef]
  18. Busigin, A.; Sood, S. FLOSHEET-A computer program for simulating hydrogen isotope separation systems. Fusion Technol. 1988, 14, 529–535. [Google Scholar] [CrossRef]
  19. Bornea, A.; Petrutiu, C.; Zamfirache, M. Complex software dedicated for design and simulation of LPCE process for heavy water detritiation. Fusion Sci. Technol. 2015, 67, 270–273. [Google Scholar] [CrossRef]
  20. Fedorchenko, O.A.; Alekseev, I.A.; Bondarenko, S.D.; Vasyanina, T.V. Experimental results and experience with the LPCE process. Fusion Sci. Technol. 2020, 76, 341–346. [Google Scholar] [CrossRef]
  21. Yang, B.; Wu, J.; Zhao, G.; Wang, H.; Lu, S. Multiplicity analysis in reactive distillation column using ASPEN PLUS. Chin. J. Chem. Eng. 2006, 14, 301–308. [Google Scholar] [CrossRef]
  22. Meng, W.X.; Banerjee, S.; Zhang, X.; Agarwal, R.K. Process simulation of multi-stage chemical-looping combustion using Aspen Plus. Energy 2015, 90, 1869–1877. [Google Scholar] [CrossRef]
  23. Noh, J.; Fulgueras, A.M.; Sebastian, L.J.; Lee, H.G.; Kim, D.S.; Cho, J. Estimation of thermodynamic properties of hydrogen isotopes and modeling of hydrogen isotope systems using Aspen Plus simulator. J. Ind. Eng. Chem. 2017, 46, 1–8. [Google Scholar] [CrossRef]
  24. Wang, X.; Zeng, Q.; Shi, W.; Chen, H. Hydrogen isotope inventory evaluation of hydrogen isotopes separation system of CFETR using Aspen Plus simulator. Fusion Eng. Des. 2022, 177, 113078. [Google Scholar] [CrossRef]
  25. Renon, H.; Prausnitz, J.M. Local compositions in thermodynamic excess functions for liquid mixtures. AIChE J. 1968, 14, 135–144. [Google Scholar] [CrossRef]
  26. Aldehani, M.; Alzahrani, F.; An tSaoir, M.N. Kinetics and reactive stripping modelling of hydrogen isotopic exchange of deuterated waters. Chem. Eng. Process. Process Intensif. 2016, 108, 58–73. [Google Scholar] [CrossRef]
  27. Yamanishi, T.; Okuno, K. A Computer Code Simulating Multistage Chemical Exchange Column under Wide Range of Operating Conditions; JAERI-DATA/CODE-96-028; Japan Atomic Energy Research Institute: Tokyo, Japan, 1996. [Google Scholar]
  28. Butler, J.P.; Rolston, J.H.; Stevens, W.H. Novel Catalysts for Isotopic Exchange between Hydrogen and Liquid Water. In The Separation of Hydrogen Isotopes; Rae, H.K., Ed.; American Chemical Society: Washington, DC, USA, 1978; Volume 68, pp. 93–109. ISBN 9780841204201. [Google Scholar]
  29. Bornea, A.; Ana, G.; Balteanu, O.; Bidica, N.; Bucur, C.; Ionita, G.; Zamfirache, M. New catalytic packing performance: Theoretical and experimental characterization for LPCE process. Fusion Eng. Des. 2019, 146, 2384–2388. [Google Scholar] [CrossRef]
  30. Li, P.; Guo, L.; Xiong, R.; Luo, J.; Wen, M.; Yao, Y.; Zhang, Z.; Song, J.; Shi, Y.; Tang, T. Separation process study of liquid phase catalytic exchange reaction based on the Pt/C/PTFE catalysts. Chin. J. Chem. Eng. 2019, 27, 1837–1845. [Google Scholar] [CrossRef]
  31. Iwai, Y.; Misaki, Y.; Hayashi, T.; Yamanishi, T.; Konishi, S.; Nishi, M.; Ninomiya, R.; Yanagimachi, S.; Senrui, S.; Yoshida, H. The water detritiation system of the ITER tritium plant. Fusion Sci. Technol. 2002, 41, 1126–1130. [Google Scholar] [CrossRef]
  32. Alekseev, I.; Bondarenko, S.; Fedorchenko, O.; Konoplev, K.A.; Vasyanina, T.V.; Arkhipov, E.A.; Uborsky, V.V. Development of a heavy water detritiation plant for PIK reactor. Fusion Sci. Technol. 2005, 48, 286–289. [Google Scholar] [CrossRef]
Figure 1. The schematic simulation flow sheet of hydrogen–water isotope catalytic exchange process.
Separations 11 00219 g001
Figure 2. The distribution of D molar concentration with stages.
Separations 11 00219 g002
Figure 3. The generation amount of each component with stages.
Separations 11 00219 g003
Figure 4. The composition of deuterium of T-OUT and B-OUT with temperature.
Separations 11 00219 g004
Figure 5. The relationship between temperature and (a) the equilibrium constant K; and (b) water vapor in the gas phase.
Separations 11 00219 g005
Figure 6. (a) Total generation amount of HD at different temperatures; and (b) HD generation amount at different stages.
Separations 11 00219 g006
Figure 7. The composition of D at different temperatures in the phase: (a) hydrogen; (b) vapor; and (c) liquid.
Separations 11 00219 g007
Figure 8. Power consumption with temperature.
Separations 11 00219 g008
Figure 9. The composition of deuterium of T-OUT and B-OUT with residence time (E represents the results of CEPE model).
Separations 11 00219 g009
Figure 10. HD generation amount with stages at different residence time (E represents the results of CEPE model).
Separations 11 00219 g010
Table 1. Property parameters.
ParametersUnitH2H2OHDHDOD2D2O
Vaporization EnthalpykJ/mol0.9040.691.0440.681.1941.45
Freeze Point°C−259.200.00−256.551.91−254.423.81
Dipole Momentdebye0.001.850.001.820.001.78
Molecular Weight 2.0218.023.0219.024.0320.03
Omega −0.220.34−0.180.36−0.140.37
Critical PressurekPa1313.022,064.01484.021,867.51661.721,671.0
Standard Specific Gravity 0.301.000.301.050.301.11
Boiling PointK20.39373.1522.29374.0023.65374.57
Critical TemperatureK33.19647.1035.91645.6438.35643.89
Triple Point Temperature°C−259.200.01−256.551.92−254.423.82
Liquid Molar Volume at Boiling Pointcm3/mol28.5718.8326.8418.8425.1118.85
Critical Volumecm3/mol64.1555.9562.0056.1260.2656.30
Standard Liquid Molar Volumecm3/mol53.5618.0553.5618.0553.5618.13
Critical Compressibility Factor 0.310.230.310.230.310.23
Disclaimer/Publisher’s Note: The statements, opinions and data contained in all publications are solely those of the individual author(s) and contributor(s) and not of MDPI and/or the editor(s). MDPI and/or the editor(s) disclaim responsibility for any injury to people or property resulting from any ideas, methods, instructions or products referred to in the content.

