Article

Efficient Photocatalytic Degradation of Triclosan and Methylene Blue by Synthesized Ag-Loaded ZnO under UV Light

by
Myriam Chems
1,
Lázaro Adrián González-Fernández
2,
Manuel Sanchez Polo
3,
Abdellah Anouar
1 and
Ventura Castillo Ramos
3,*
1
Laboratory of Applied Chemistry and Environment, Faculty of Sciences and Techniques, Hassan First University of Settat, Settat 26000, Morocco
2
Multidisciplinary Graduate Program in Environmental Sciences, Av. Manuel Nava 201, 2nd Floor, University Zone, San Luis Potosi 78000, Mexico
3
Department of Inorganic Chemistry, Faculty of Science, University of Granada, 18071 Granada, Spain
*
Author to whom correspondence should be addressed.
Separations 2024, 11(8), 221; https://doi.org/10.3390/separations11080221
Submission received: 4 June 2024 / Revised: 17 July 2024 / Accepted: 19 July 2024 / Published: 23 July 2024

Abstract

:
Industrial discharge of hazardous organic and synthetic chemicals, such as antibacterials and dyes, poses severe risks to human health and the environment. This study was conducted to address the urgent need for efficient and stable zinc-oxide-based photocatalysts to degrade such pollutants. A novel approach to synthesizing silver-loaded zinc oxide (Ag@Z) catalysts was introduced by using a simple and efficient combination of hydrothermal and precipitation methods. Comprehensive characterization of Ag@Z photocatalysts was performed using XRD, XPS, Raman, UV–vis adsorption, FTIR, and SEM, revealing an enhancement of structural, optical, and morphological properties in comparison to pure zinc oxide. Notably, the 5%Ag@Z catalyst exhibited the highest degradation efficiency among the other synthesized catalysts under UV-C light irradiation, and enhanced the degradation rate of pure zinc oxide (Z) by 1.14 and 1.64 times, for Triclosan (TCS) and Methylene Blue (MB), respectively. the effect of catalyst dose and initial concentration was studied. A mechanism of degradation was proposed after investigating the effect of major reactive species. The 5%Ag@Z catalyst increased the photostability, which is a major problem of zinc oxide due to photocorrosion after reusability. We found that 50% and 74% of energy consumption for the photocatalytic degradation of TCS and MB by 5%Ag@Z, respectively, was saved in compassion with zinc oxide. The remarkable photocatalytic performance and the good recovery rate of Ag@Z photocatalysts demonstrate their high potential for photocatalytic degradation of organic contaminants in water.

1. Introduction

During the last decades, the industrial revolution has seen enormous development in favor of human life quality; however, massive damage has affected the environment due to the evacuation of hazardous and toxic effluents loaded with organic and synthetic chemicals like antibacterials and dyes into nature [1,2]
Triclosan (TCS) is a synthetic compound with antibacterial properties [3], usually found in personal care products such as toothpaste, soaps, deodorants, and cosmetics, as well as in medication and disinfectants. The presence of TCS in wastewater has a serious effect on human health and the aquatic ecosystem, including endocrine disruption [4,5]. Methylene blue (MB) is a synthetic dye used in various industries such as textile and paper [5]. Due to its high solubility and stability in water, MB is difficult to fully degrade via conventional wastewater treatment, leading to potential aquatic toxicity [6,7].
The persistence and toxicity of TCS and MB emphasize the urgent need for efficient removal techniques, such as photocatalytic degradation. Heterogeneous photocatalytic degradation is an advanced oxidation process that uses light-activated catalysts to mineralize organic contaminates into simple and less harmful compounds [8]. The generation of electron and hole pairs in the presence of photocatalysts and light leads to the oxidation and hydrolysis of pollutant molecules [9,10]. Semiconductor materials such as TiO2, WO3, ZrO2, ZnO, etc., are used as photocatalysts [11,12].
Zinc oxide has gained a lot of attention in the scientific community due to its large band gap of 3.3 eV at room temperature and its significant excitation binding energy in the range of 60 MeV [13]. The non-toxicity, electron mobility, non-solubility in water, and high photo-sensibility of ZnO make it an excellent photocatalyst for pollutant degradation in water [14]. However, the photocatalytic activity of ZnO decreases due to photocorrosion [15]. To enhance ZnO photocatalytic efficiency, a lot of researchers have combined it with other elements (Au, Cu, Cd, Ag, etc.) via doping or loading [16].
Silver (Ag) is a noble metal, with a big ionic size and small orbital energy [17]. Ag is known for its ability to improve visible light absorption via the plasmon resonance effect. And because of its metallic nature, Ag can play an essential role in charge separation as well as in the enhancement of the surface of the catalyst together with its dispersion and interaction within the ZnO matrix [14], potentially leading to improved photocatalytic proprieties.
In this work, pure ZnO and several percentages of silver-loaded zinc oxide photocatalysis were successfully synthesized in situ via a novel and unique combination of hydrothermal, precipitation processes and UV irradiation to enhance the physical and chemical properties of ZnO. Various techniques of characterization were used to investigate this improvement. The photocatalytic performance was evaluated on two pollutants, TCS and MB, under UV-C irradiation to demonstrate the versatility and broad application of the synthesized catalysts. The effects of catalyst dose, initial concentration, and reactive species were studied. Furthermore, a mechanism of photodegradation was proposed. The energy consumption and reusability were investigated in comparison with pure zinc oxide. We found that Ag loading on zinc oxide enhanced the photocatalytic efficiency of both organic contaminants, as well as improved the photostability and recyclability of ZnO.

2. Material and Methods

2.1. Chemicals

All the purchased chemicals and reagents were used without any further purifications. Zinc nitrate hexahydrate. Zn (NO3)2 6 H2O 99% was supplied by Sigma-Aldrich (Burlington, MA, USA), and sodium hydroxide, NaOH 99%, and silver nitrate were procured from PanReac (Chicago, IL, USA). Absolut ethanol and acetone were used in synthesis. Triclosan (TCS), methylene blue (MB) (Table S1), and acetonitrile, HPLC grade, were provided by Lab Kem (Woburn, MA, USA) and were used in the preparation of triclosan solution.

2.2. Synthesis of Photocatalysts

  • Synthesis of ZnO nanoparticles
Zinc oxide nanoparticles were prepared via a hydrothermal method: 3.02 g of sodium hydroxide was dissolved in 125 mL of ultrapure water then added to 50 mL of (0.25 M) zinc nitrate hexahydrate solution drop by drop under stirring, and the resultant opaque mixture was stirred for 1 h before it was transferred to an autoclave and heated at 160 °C for 6 h in an oven. The obtained white precipitate was filtered and washed several times with water, ethanol, and acetone, respectively, then dried at 70 °C overnight.
b.
Synthesis of silver-loaded ZnO nanomaterial
A variation (1%, 3%, 5%, and 7%) molar ratio of silver-loaded zinc was prepared by dispersing 500 mg of the prepared ZnO in 150 mL of ultrapure water under ultrasonication for 20 min. A variation in silver nitrate volumes (0.5, 1.5, 2.6 and 3.7 mL) with 0.1 M concentration was added to dispersed zinc oxide and stirred for 30 min in the dark, and then for 1 h under UV-C-irradiation; the variations of garish solutions obtained were centrifuged for 10 min (40,000 rpm), then collected and dried for 24 h at 80 °C. The molar ratio silver-loaded zinc oxide ZnO, (1, 3, 5, and 7%) was represented by Z, 1%Ag@Z, 3%Ag@Z, 5%Ag@Z, and 7%Ag@Z, respectively.

2.3. Characterization of Materials

The crystal phase of the samples was measured by the Bruker D8 Discover X-ray diffractometer (Bruker, Billerica, MA, USA) (XRD, Cu kα, λ = 1.5406 Å), The UV–vis absorption spectra were obtained on the VARIAN UV-Vis NIR Cary 5E Spectrophotometer (VARIAN, Palo Alto, CA, USA). Through Jasco FT/IR 6200 Fourier Transform Infrared spectroscopy (FTIR) (Jasco, Tokyo, Japan), the surface functional groups were confirmed. The X-ray photoelectron spectroscopy (XPS) was determined on Kratos Axis Ultra-DLD XPS (Kratos Analytical, Manchester, UK). Morphological features and chemical composition were analyzed using Scanning Electron Microscopy (SEM) AMBER X dual-beam Microscope from TESCAN (Essence Software, Brno, Czech Republic) and Raman spectra of the samples were collected by Jasco NRS-5100 spectrophotometer (Waltham, MA, USA).

2.4. Photocatalytic Degradation Experiment

The photocatalytic activity of the synthesis photocatalysts was evaluated by the degradation of TCS and MB at 25 °C in a multi-position photocatalytic reactor (6 × 35 mL quartz tubes) Figure S1 equipped with 15 W UV-C-lamp emits at 254 nm. The photocatalytic degradation experiment was started with 0.5 g L−1 of photocatalyst dose and 10 mg/L as concentration of both analytes to reach the adsorption–desorption equilibrium; the reactions were kept in the dark for 30 min. The samples were collected and centrifuged at 40,000 rpm for 10 min. HPLC (high-performance liquid chromatography) and UV–vis spectrophotometry were used to follow the evolution of the concertation of TCS and MB, respectively at (λmaxTCS = 280 nm and λmaxMB = 664 nm).
The photocatalytic degradation rate (R%) was calculated by Equation (1)
R % = 1 C t C 0 × 100
And Equation (2) was used to the detriment of the kinetics of the degradation performance:
ln C 0 C t = k t
where C0 and Ct are the concentrations at instant t = 0 and t, respectively, during the degradation reaction, and k is the constant of pseudo-first order.

3. Results and Discussion

3.1. Characterization

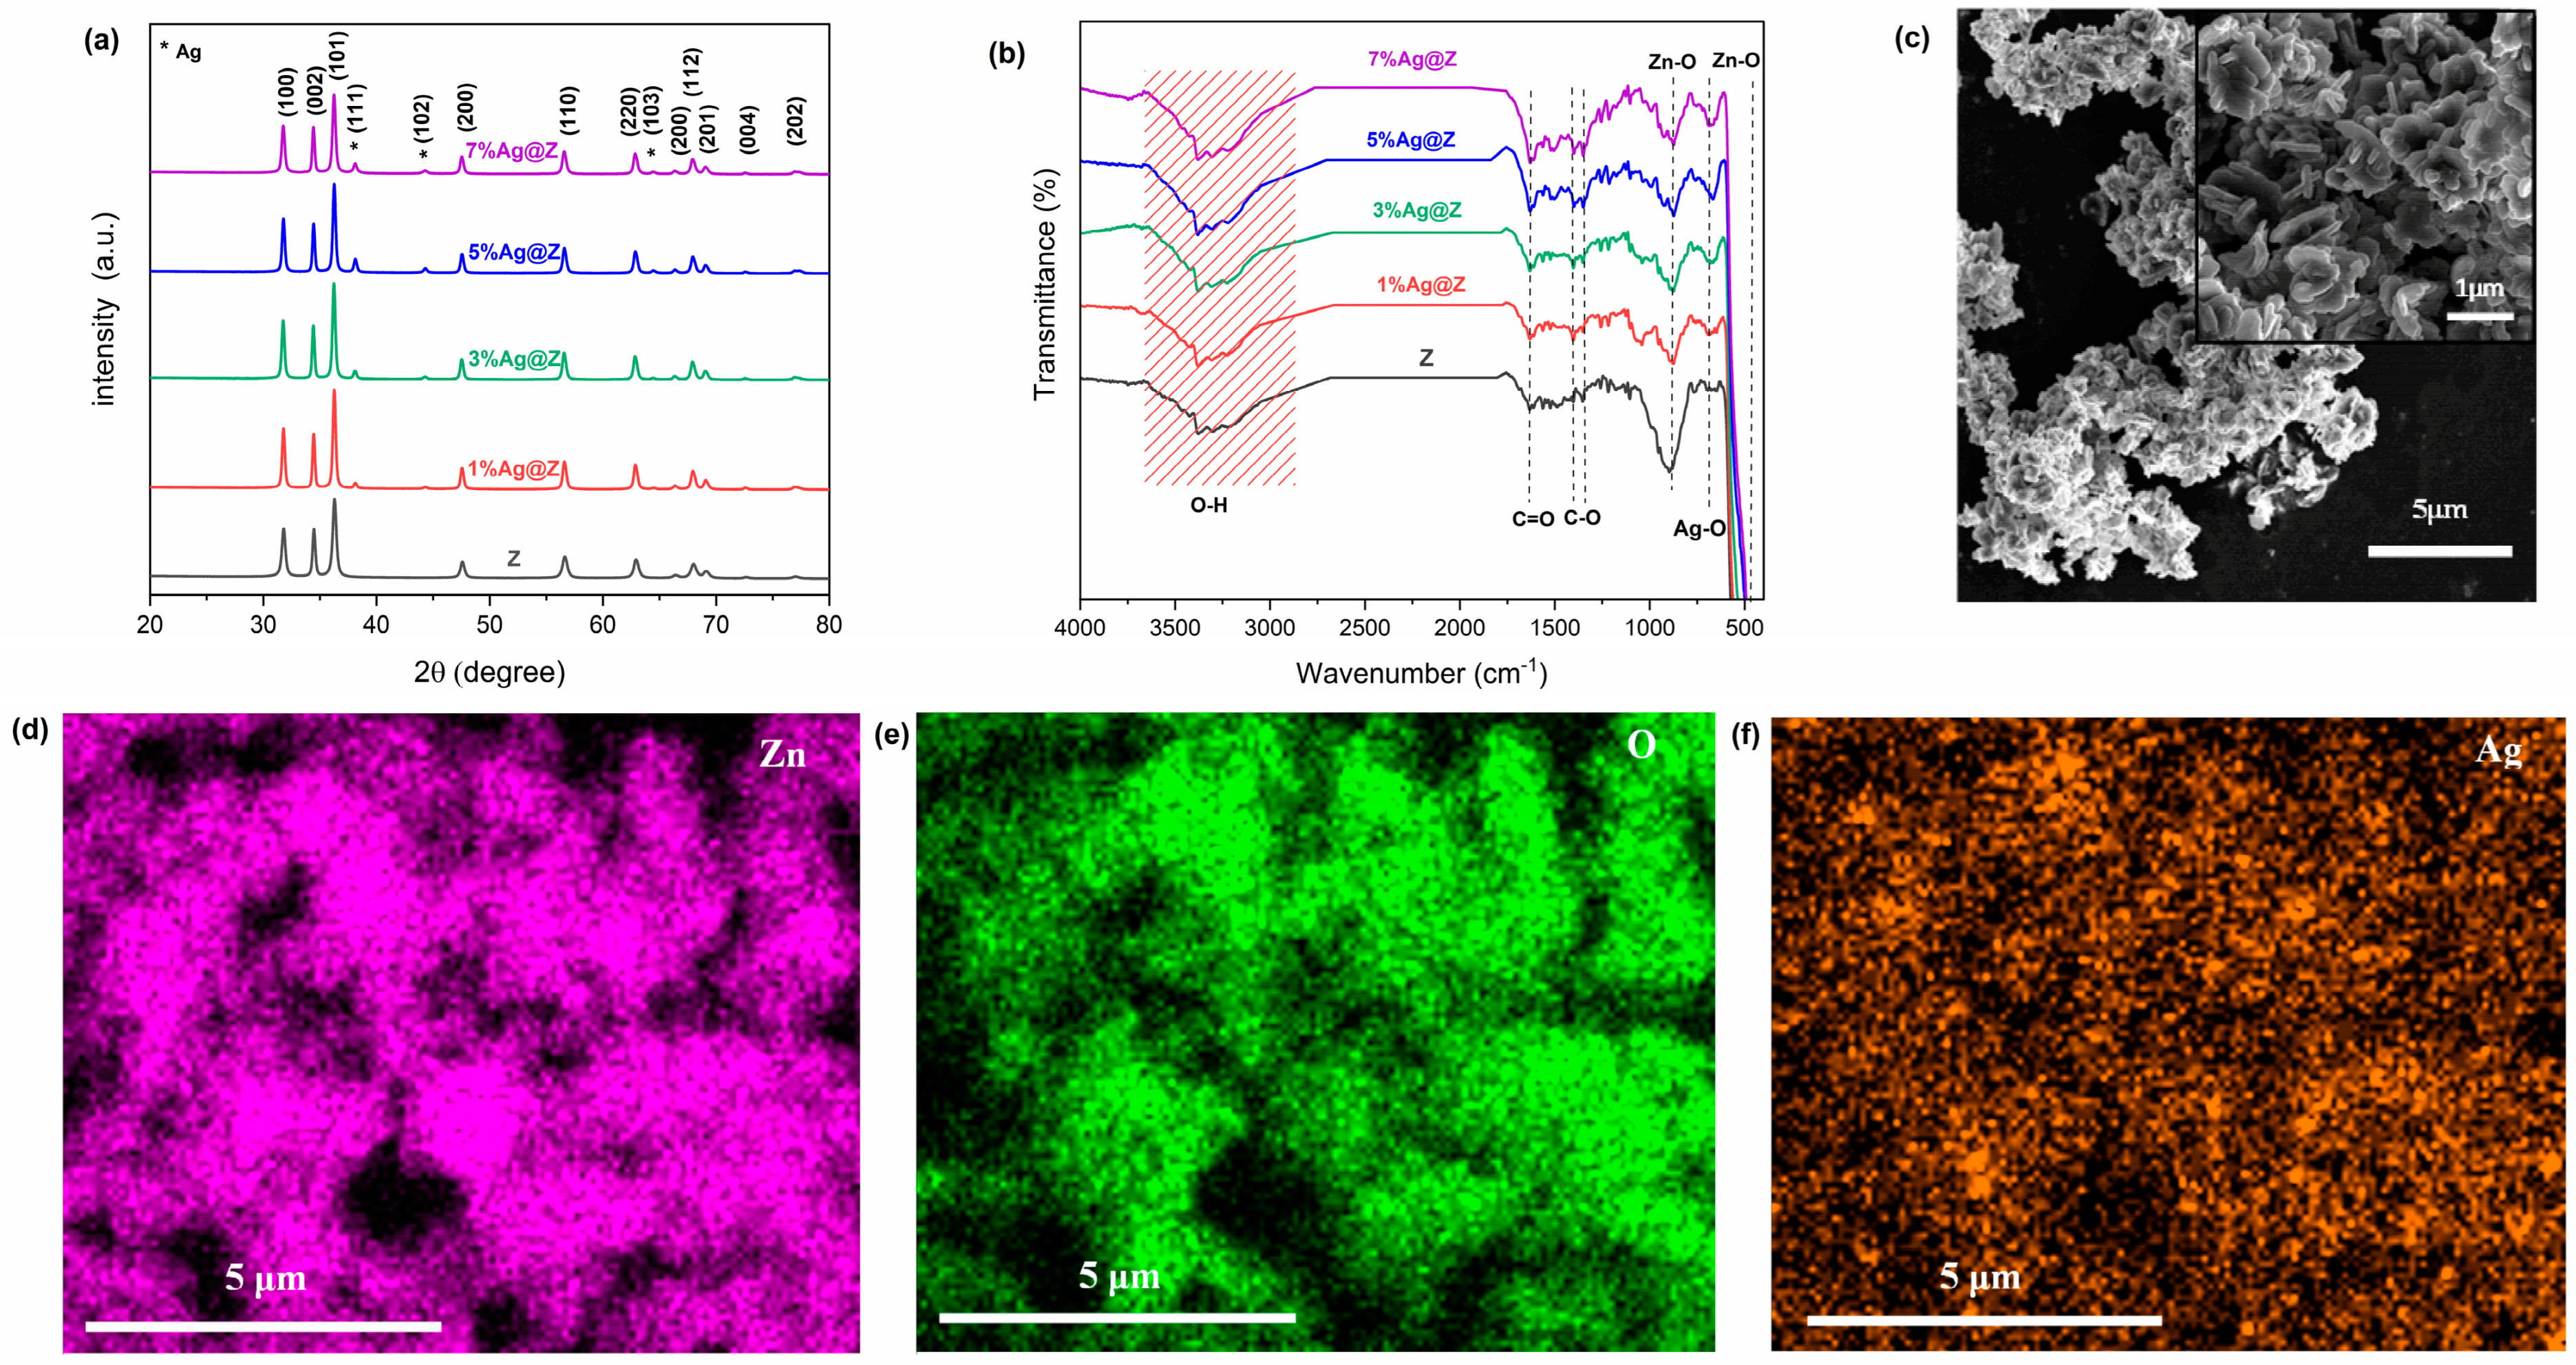
3.1.1. Structural Proprieties

Figure 1a shows the XRD patterns of the synthesized Z, 1%Ag@Z, 3%Ag@Z, 5%Ag@Z, and 7%Ag@Z catalysts. The diffraction peaks of zinc oxide are all present and in alignment with (JCPDS NO. 01-080-0075) the hexagonal wurtzite structure for all the samples. The formation of a secondary phase peaking at 38.1°, 44.3°, and 64.4° was attributed to (111), (102), and (103), respectively, for all silver-loaded zinc oxide nanomaterials (x% Ag@Z). These peaks were correlated to the cubic phase of silver (JCPDS NO. 01-087-0597), revealing that the loading of silver nanoparticles on the zinc oxide surface was successful. Moreover, the appearance and increase in the secondary phase with augmentation of the Ag percentage of loading on zinc oxide were observed. The absence of any additional diffraction peak in the XRD data indicated the high purity of the synthesized samples.

3.1.2. FTIR Analysis

The functional groups and chemical bonds of the synthesized nanoparticles were verified with FTIR analysis, as illustrated in Figure 1b. It is noticeable that the spectra share similar bands over the entire screening range of all the samples. Broadband from 3700 cm−1 to 3200 cm−1 belongs to the OH group stretching vibration mode [18], the peak around 1638 cm−1, 1400 cm−1, and 1355 cm−1 correlated to C=O and C-O stretching vibrations, respectively [19]. The peaks below 900 cm−1 mainly correspond to bonding between metals and oxygen [20]. Zn-O bonding was demonstrated by the peaks at 875 cm−1 and 460 cm−1 [21] and finally, the absence of the peak at 671 cm−1 for Z, and its presence for silver-loaded nanoparticles, confirms the formation of Ag-O [22].

3.1.3. Morphological Proprieties

The morphological features of the 5%Ag@Z nano-catalyst were investigated by SEM analysis, as shown in Figure 1c. Different sizes and shapes in a three-dimensional cluster were observed forming flower-like structures. The limited space between the particles creates densification of the structures [23]. Figure 1d–f shows the corresponding elemental mapping images of Zn, O, and Ag for 5%Ag@Z. It is verified that catalysts contain a uniform distribution of these elements.

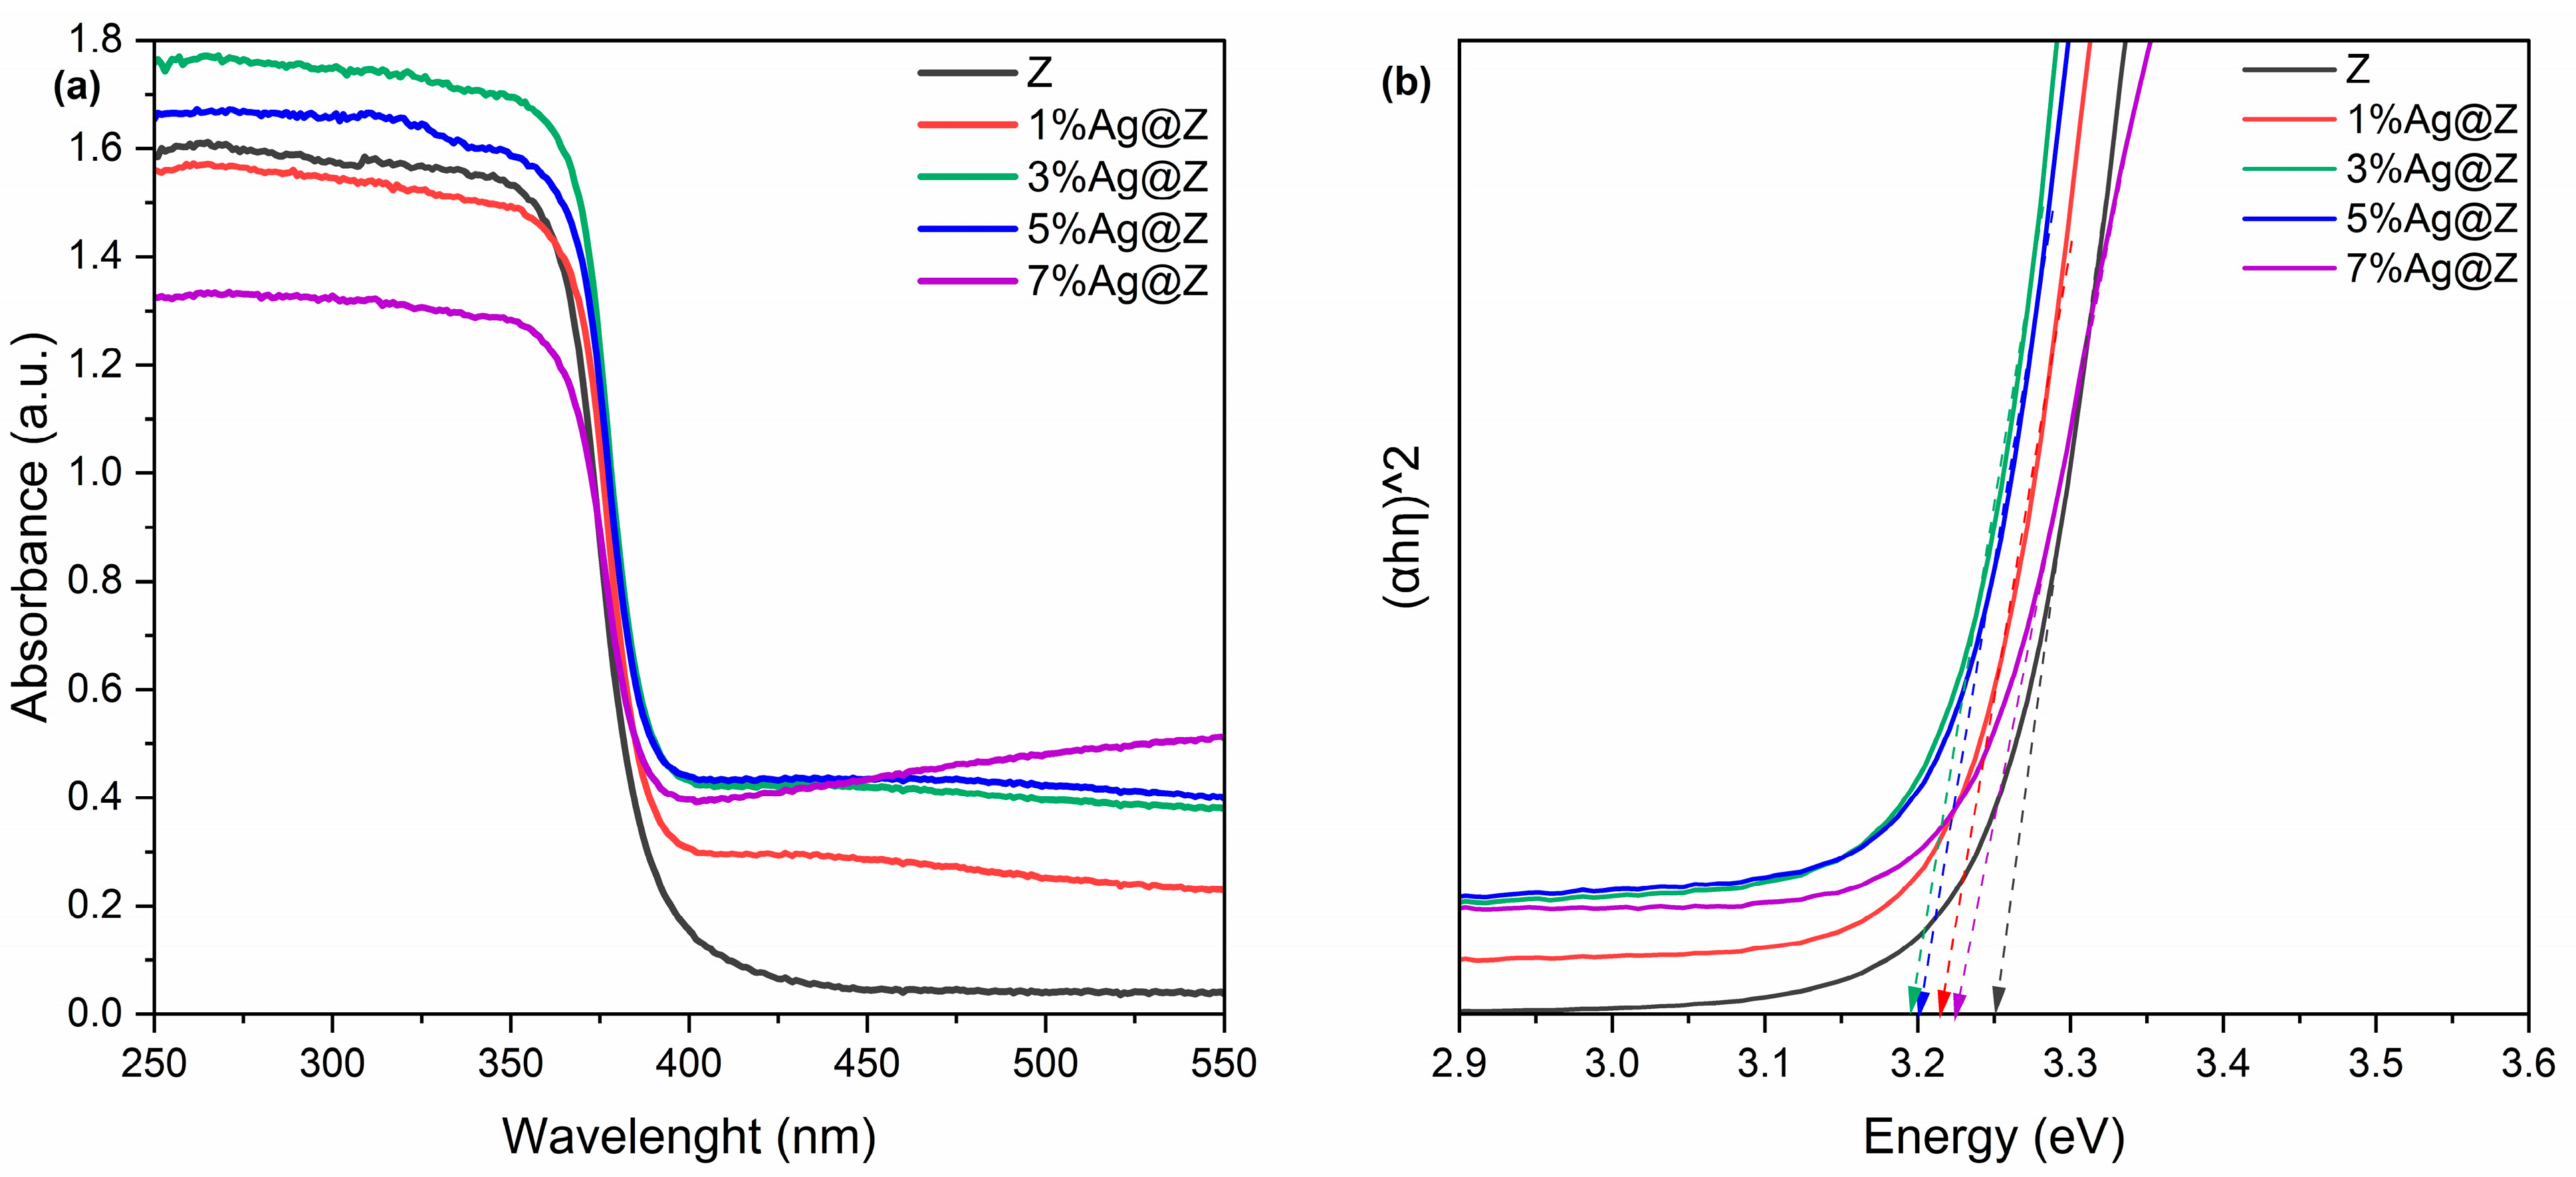
3.1.4. Optical Proprieties
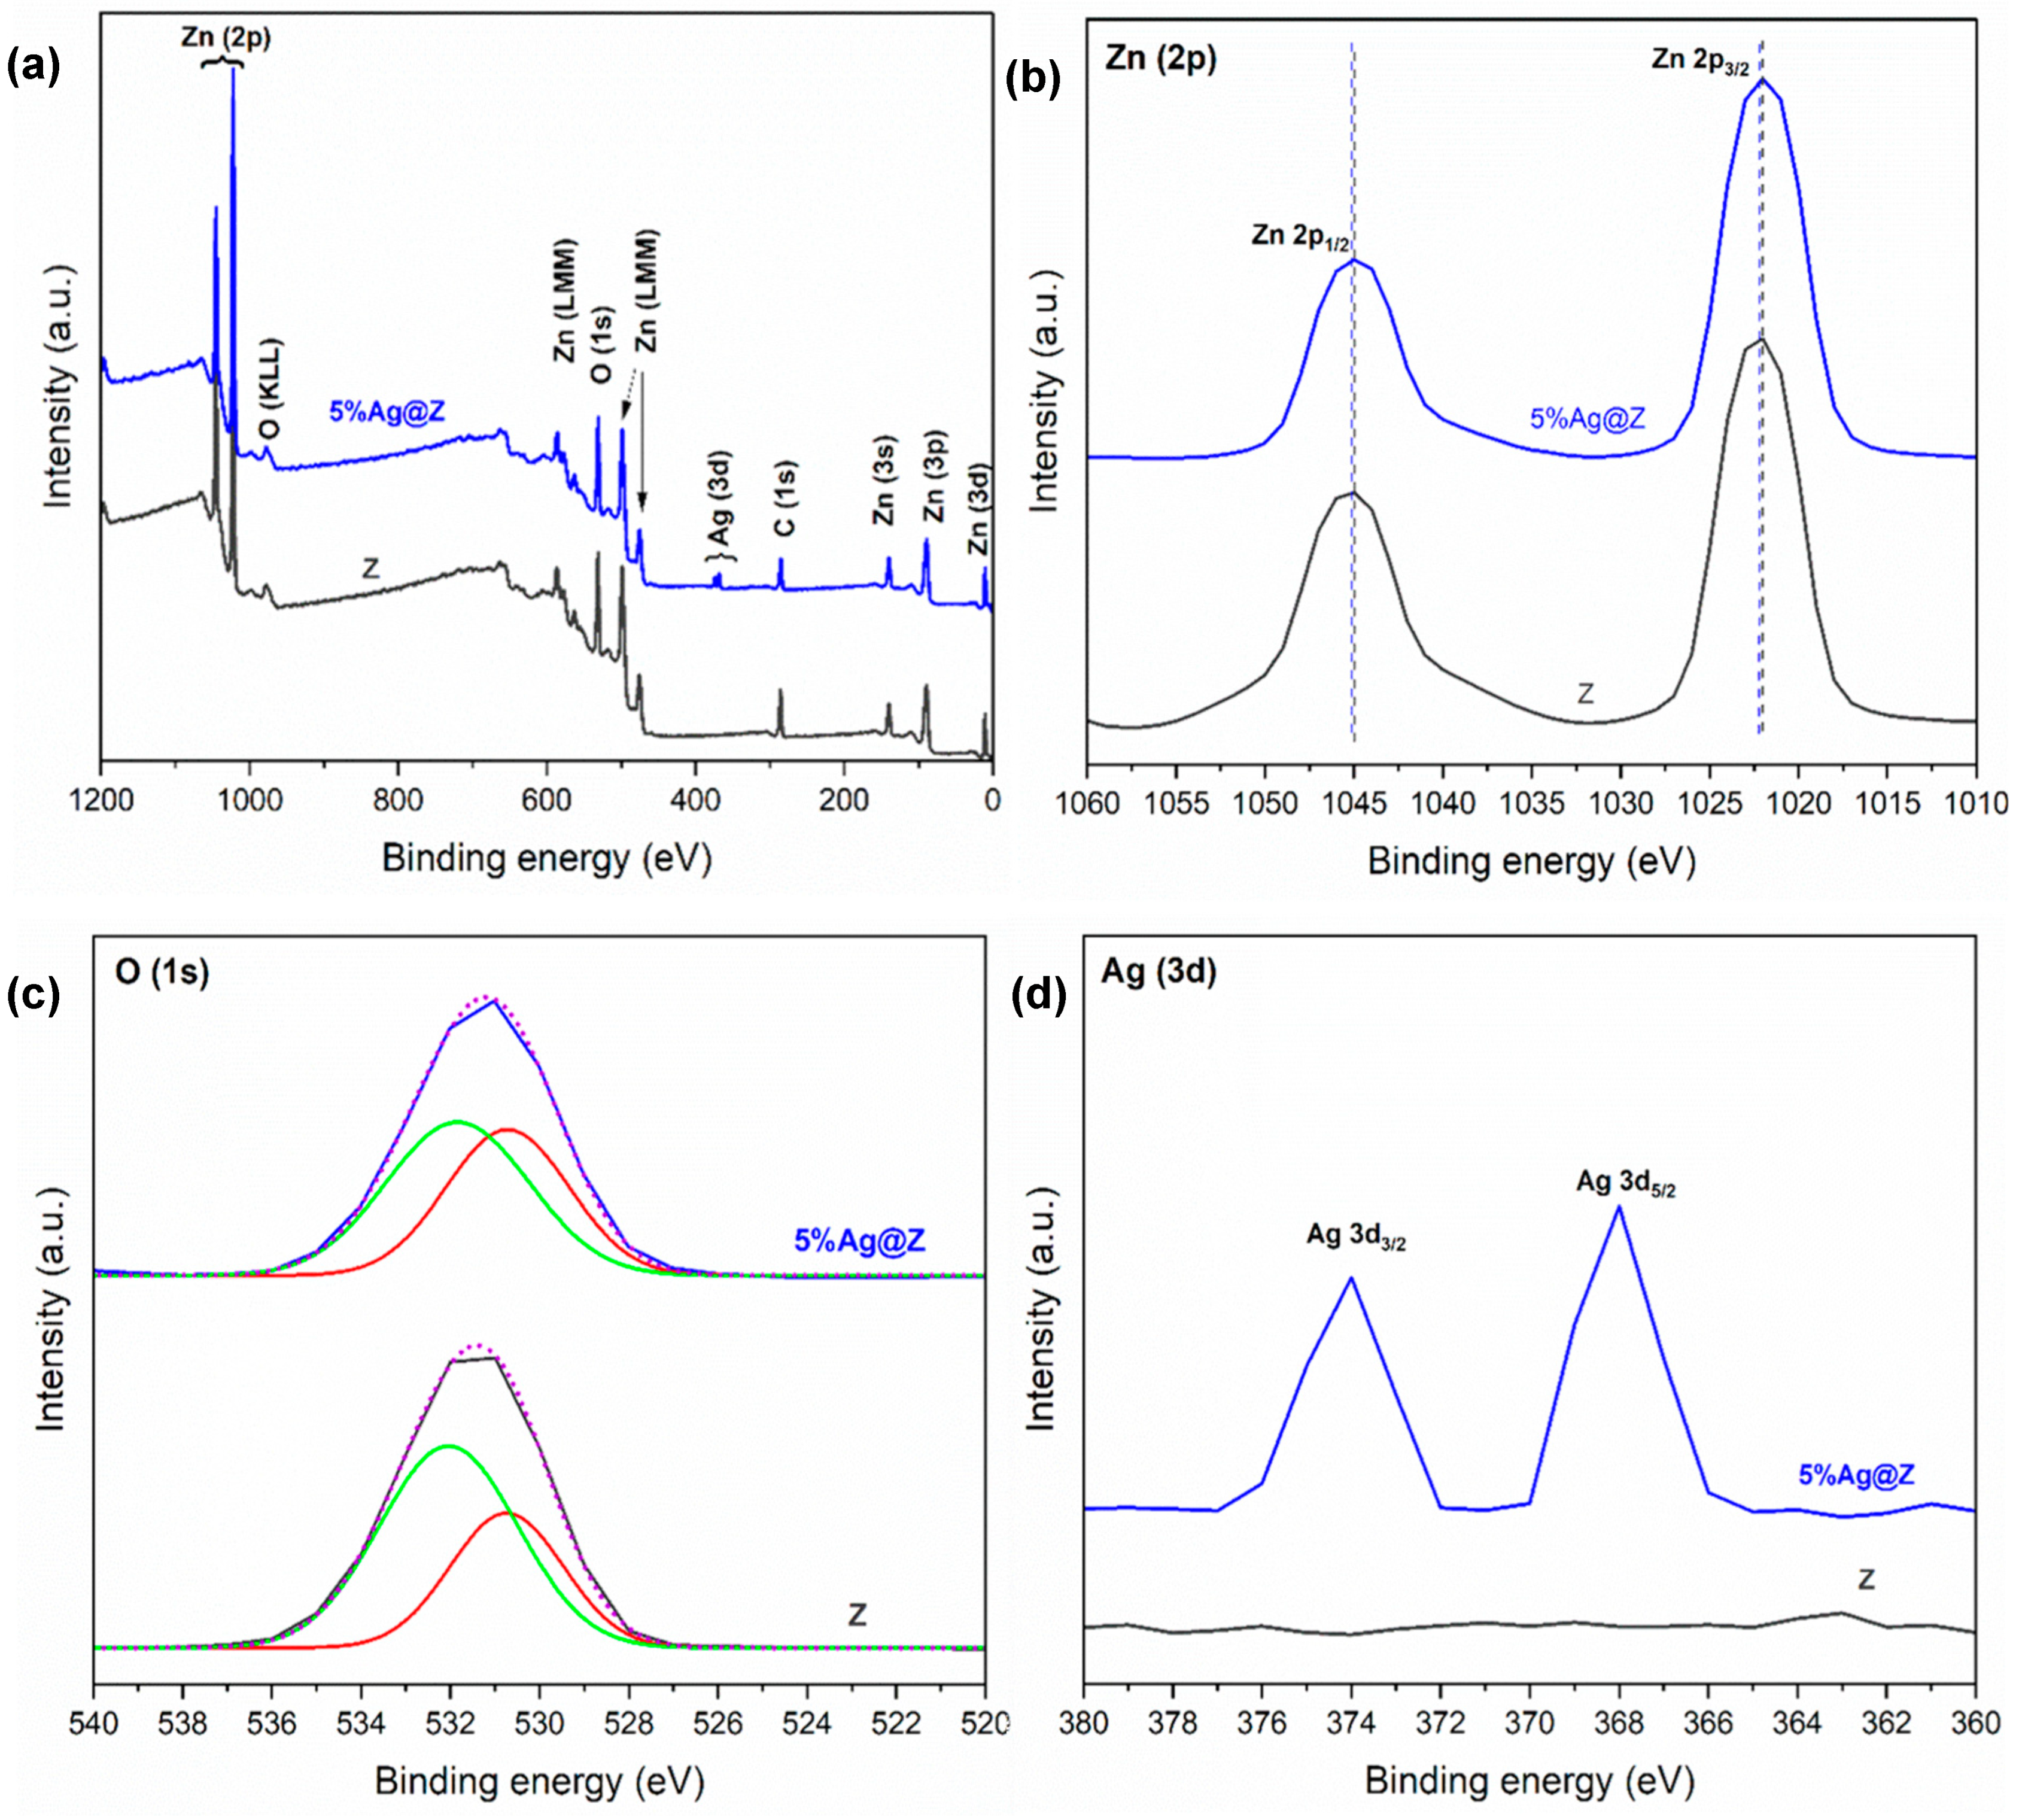
To study the optoelectronic properties of Z, 1%Ag@Z, 3%Ag@Z, 5%Ag@Z, and 7%Ag@Z photocatalysts, a UV–vis diffuse reflectance spectroscopy was performed in a wavelength range of 250–550 nm. Near 350–425 nm, the absorbance edges of all the samples appeared, as presented in the UV–vis absorption spectra in Figure 2a, and a slight shift in the absorbance edge toward the higher wavelengths with augmentation of silver loading was observed. Additionally, the redshift displays an improvement in the crystallinity of the nanoparticles [24]. The band gap energy (Eg) value is acquired by the representation of the Tauc Equation (3),
α h ν n = A ( h ν E g )
where α is the absorbance coefficient, h is the Planck constant, ν is frequency, A is a constant, and n is the Tauc exponent. Figure 2b presents the Tauc plot with n = 2, where the band gap values are equal to 3.25 eV, 3.22 eV, 3.20 eV, 3.20 eV, and 3.23 eV for Z, 1%Ag@Z, 3%Ag@Z, 5%Ag@Z, and 7%Ag@Z, respectively, showing a reduction in the band gap value from pure zinc oxide to the silver-loaded samples.

3.1.5. XPS Analysis

The XPS energy spectra of Z and 5%Ag@Z are displayed in Figure 3. The presence of Zn, O, and C elements for both samples is shown in Figure 3a. Although the peaks of carbon (C1) come primarily from the XPS instrument, the silver characteristic peaks appeared in the 5%Ag@Z XPS energy spectra. This demonstrates the successful synthesis and the great purity of the loading of silver on zinc oxide. Figure 3b presents the XPS binding energies of Zn (2p), which are found at 1044.5 and 1045 eV for Zn (2p1/2) orbital and 1022 and 1022.1 eV for Zn (2p3/2) orbital, respectively, for Z and 5%Ag@Z [13]. The characteristic peaks of O (1s) in Figure 3c are asymmetric spectra that can be split into two Gaussian signals related to two different oxygen-binding states for both catalysts. It is possible to attribute the lower binding energy portion to O2 ions in zinc oxide. The higher binding energy portion is related to the presence of areas with oxygen deficiency [15]. The relative augmentation of the illustrated signal of 5%Ag@Z reflects a greater quantity of oxygen on surface vacancies. Figure 3d shows Ag (3d) XPS spectra between 380 and 360 eV; the non-existence of any peaks for Z shows the purity and non-contamination of the sample. For 5%Ag@Z, two signals were detected at 374 eV and 368.02 eV linked to the Ag (3d3/2) and Ag (3d5/2) states, respectively. This demonstrates the integration of Ag ions present in the chemical metallic state of silver. Table 1 shows the atomic concentration percentage (At%) of the main element on the surface and the elemental ratio Zn:O and Zn:O:Ag of Z and 5%Ag@Z, respectively. The increase in Ag (3d), the atomic concentration percentage, with the augmentation of silver-loaded zinc oxide is confirmed by Figure S2a,b and Table S2.

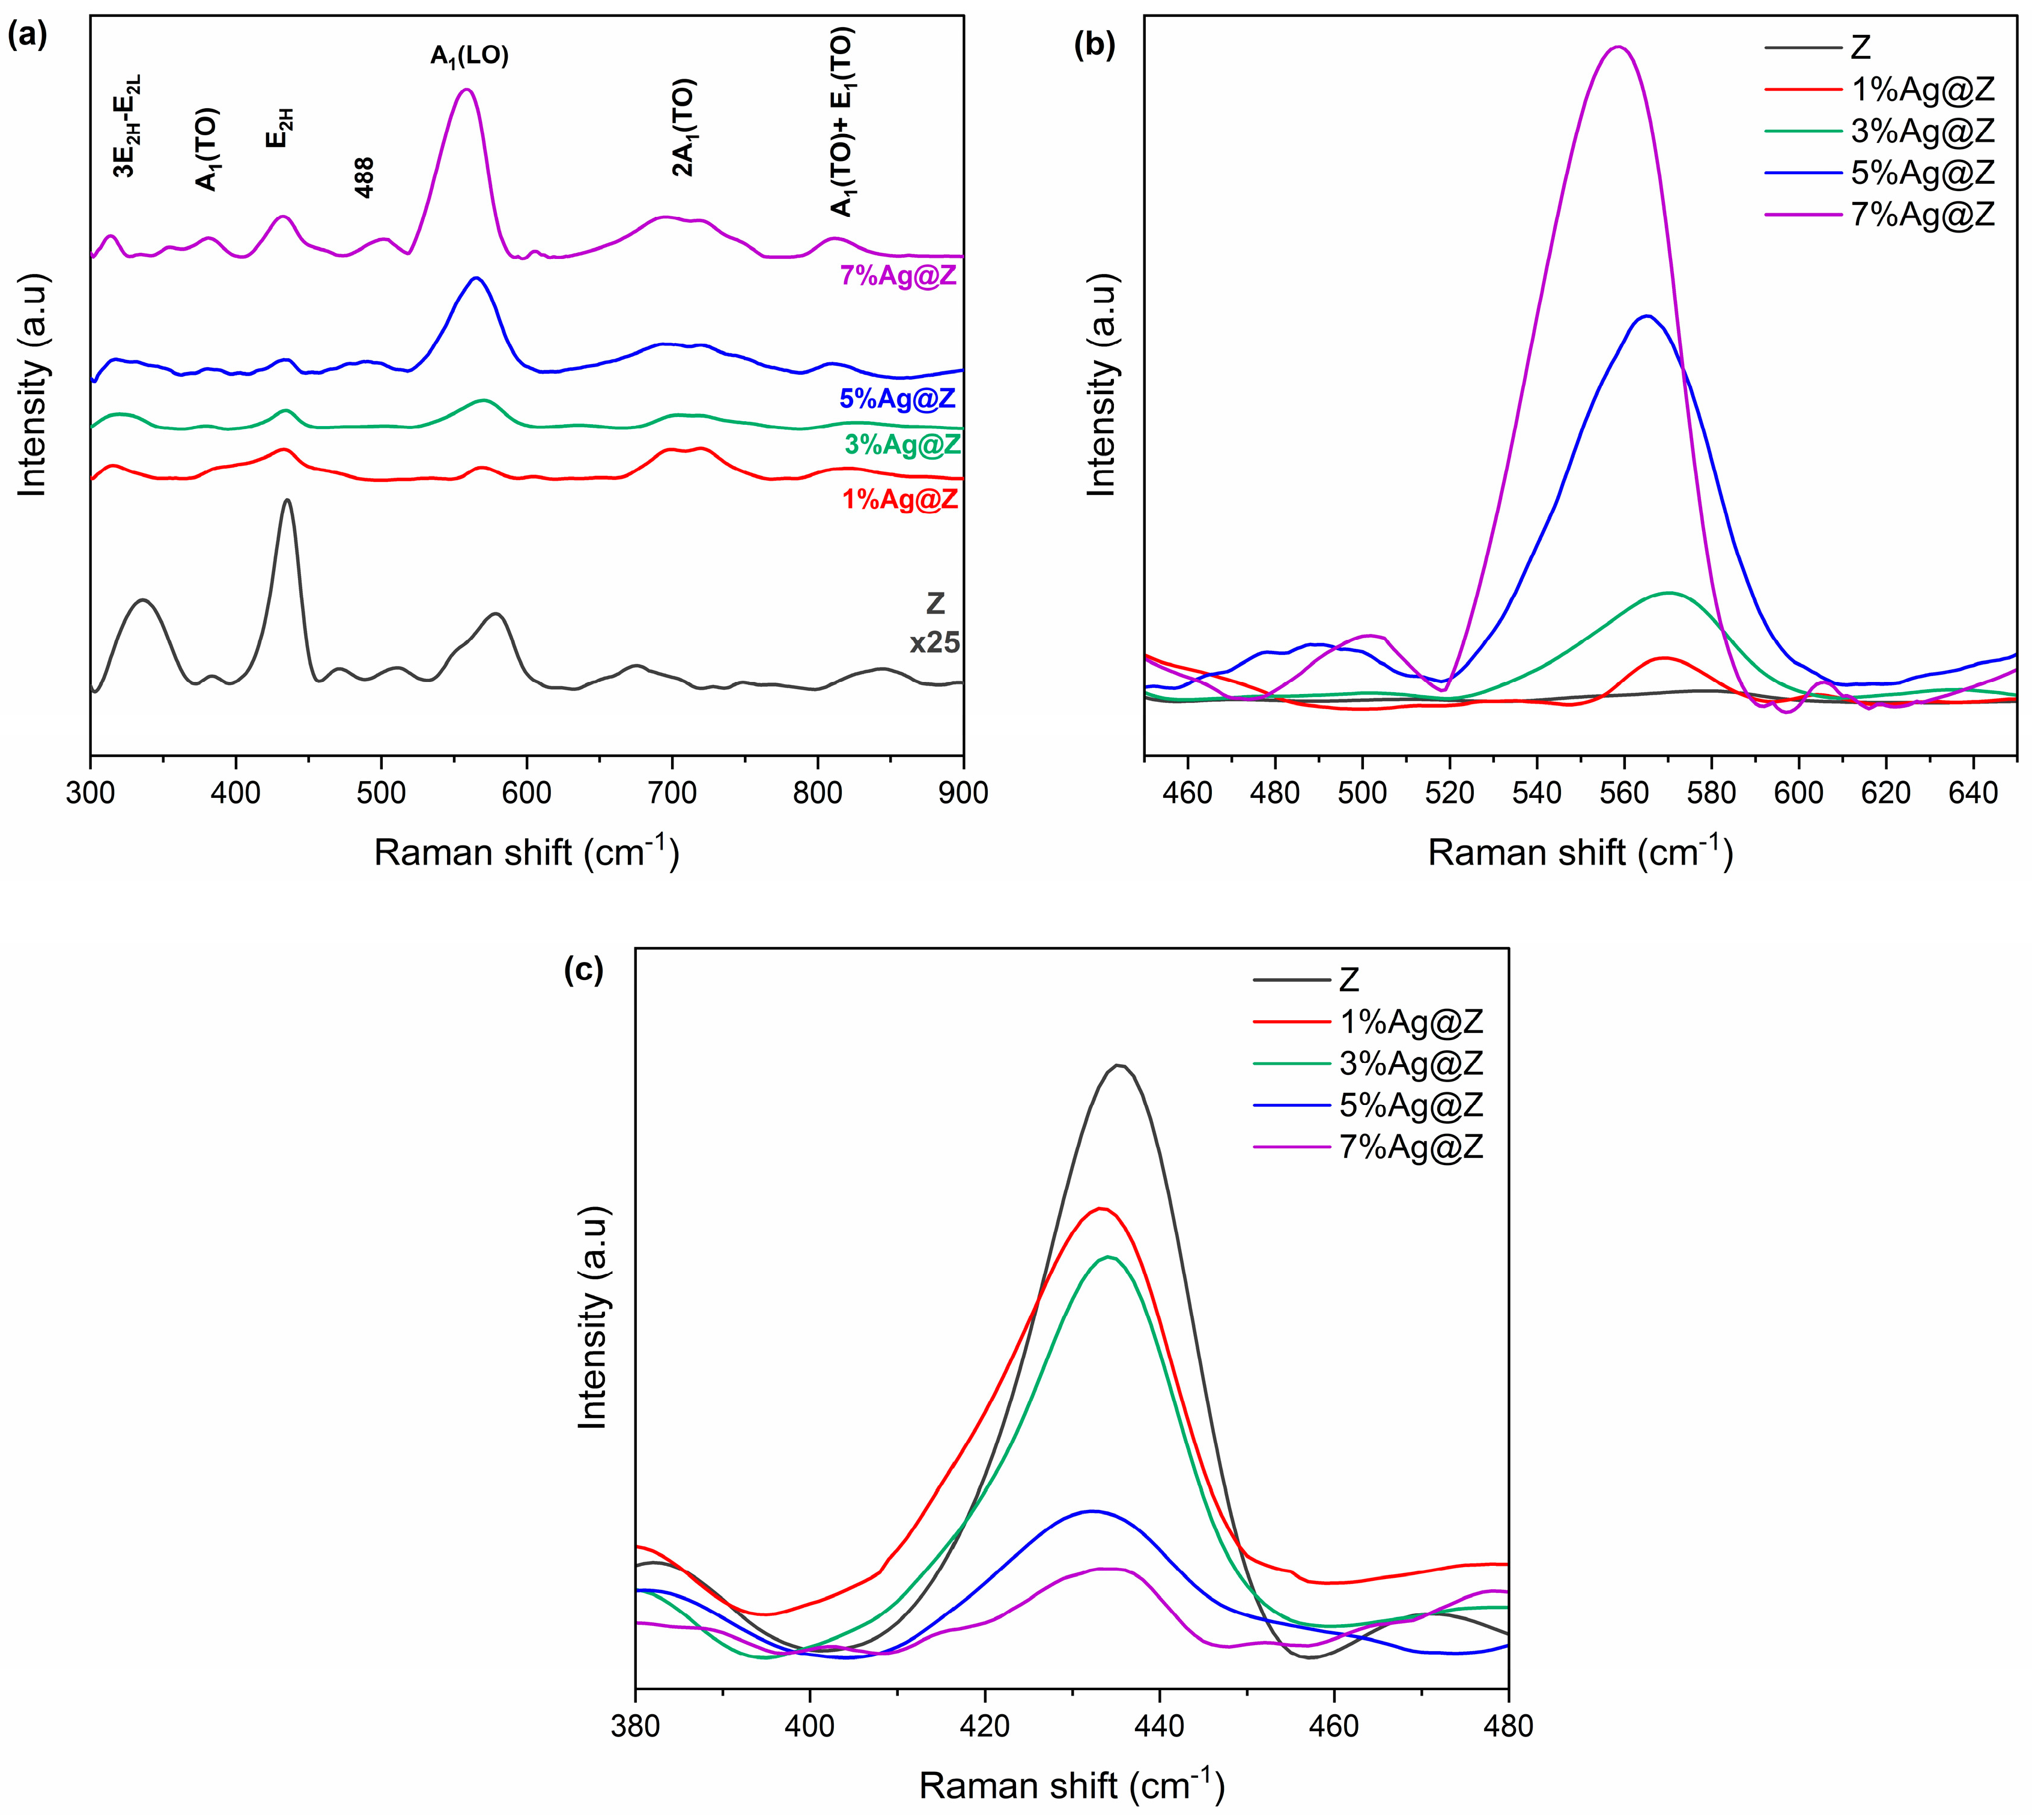
3.1.6. Raman Analysis

Raman scattering measurement was executed in the spectral range between 300 and 900 cm−1 to study the vibrational characteristics of Z, 1%Ag@Z, 3%Ag@Z, 5%Ag@Z, and 7%Ag@Z, as presented in Figure 4a. Raman spectra of Z show three peaks at 383,435, and 578 cm−1 belonging to the fundamental phonon modes of hexagonal ZnO at positions A1(TO), E2H, and A1(LO), respectively. And the peaks located at 336, 511, 674, and 840 cm−1 may be attributed to the multi-phonon scattering modes of 3E2H-E2L, E1(TO) + E2L, 2(E2H-E2L) and A1(TO) + 3E2H, respectively. Raman shifts spectra of 1%Ag@Z, 3%Ag@Z, 5%Ag@Z, and 7%Ag@Z indicate the peaks around 383 and 565 cm−1 related to A1(TO) and A1(LO)polar branches, respectively. Due to the presence of Ag, the peak at A1(LO) enlarged and shifted to the lower energy for all the synthesized samples with the augmentation of the silver loading percentage, as presented in Figure 4b; moreover, for Z, the peak at 580 cm−1 is almost equal to zero, and this is due to defected nature of the synthesized zinc oxide [25]. This change can be related to the scattering contribution of A1(LO) branches outside the center zone of the Brillouin [22]. Figure 4c presents the normalized peaks of all the samples between 380 and 480 cm−1 to highlight the reduction in the peak E2H at 438 cm−1 with the augmentation of the Ag loading percentage, as well as the result of the defect. Furthermore, a wide peak appeared at around 488 cm−1 for 5% and 7%Ag-loaded nanocatalysts. This peak has been described as the interfacial surface phonon mode [26]. With the presence of Ag, the intensity of Raman peaks increased enormously.

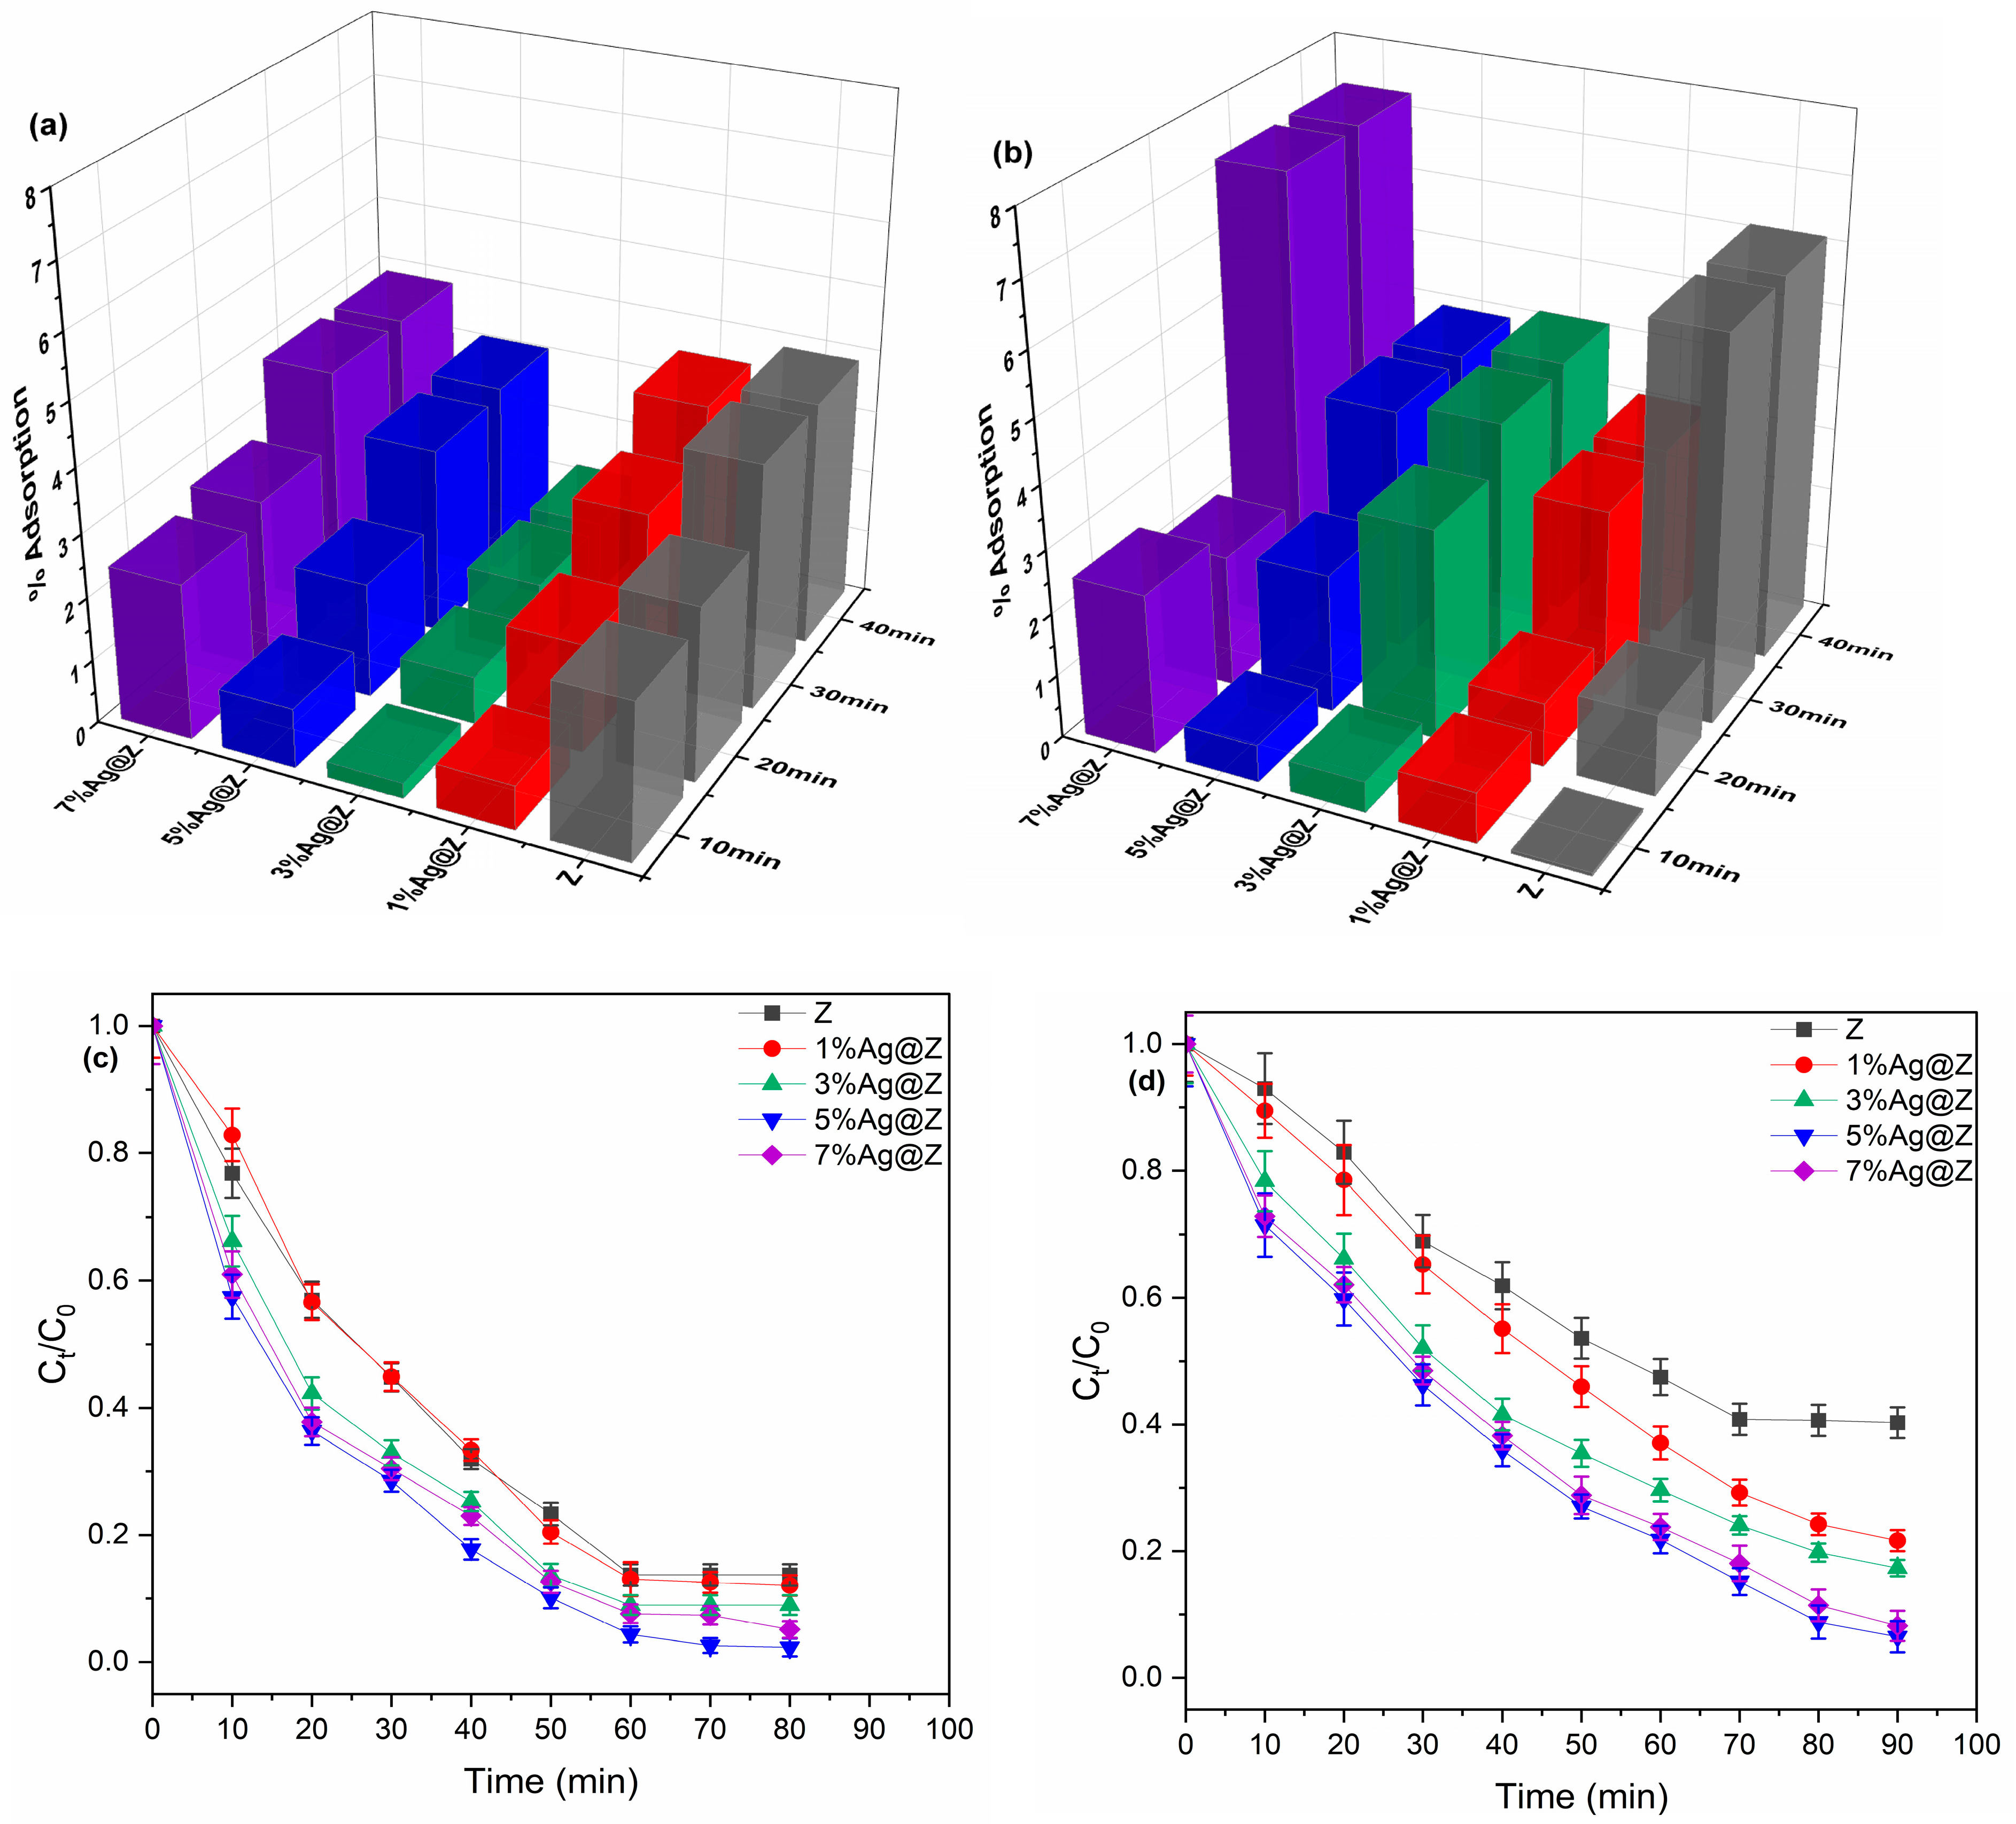
3.2. Photocatalytic Degradation Performance

The photocatalytic degradation of TCS and MB in an aqueous solution with a 10 mg/L as concentration was conducted under UV-C light by using Z, 1%Ag@Z, 3%Ag@Z, 5%Ag@Z, and 7%Ag@Z nano-catalysts. In order to avoid the involvement of adsorption, the behavior of the catalysts in the dark was investigated as shown in Figure 5a,b for both TCS and MB, respectively. The adsorption efficiency was stable after 30 min for all catalysts and both pollutants. 7.29% and 3.86% were the highest adsorption efficiency for MB and TCS, respectively by 7%Ag@Z. The adsorption efficiency increases with augmentation of Ag loading from 3% to 7% on ZnO, oppositely from Z to 1%Ag@Z. The suspensions were exposed to UV irradiation afterwards. Figure 5c,d presents the photocatalytic activity of Z and %x Ag@Z (x = 1, 3, 5, and 7) at 25°C. The photo-activity of Z is the lowest, and degradation efficiency is 59.34% and 86.27% in 80 min for MB and TCS, respectively. The catalytic activity increases with the increase of silver loading on zinc oxide from 1% to 5% and then decreases for 7%Ag@Z. Remarkably, 5%Ag@Z enhanced the removal rate to 93.05% and 97.69% for MB and TCS at 90 min and 80 min, respectively. The enhancement of the photocatalytic activities of Ag-loaded photocatalysts is related to the increase of visible light absorption and improvement of the catalysis surface because of metallic Ag, and increased charge separation as a result of surface plasmon resonance, as well as the capacity of Ag of trapping electrons [14]. Nevertheless, a further increase in silver percentage has an opposite effect on the degradation activity, which could be explained by the aggregation of Ag particles at higher concentrations.

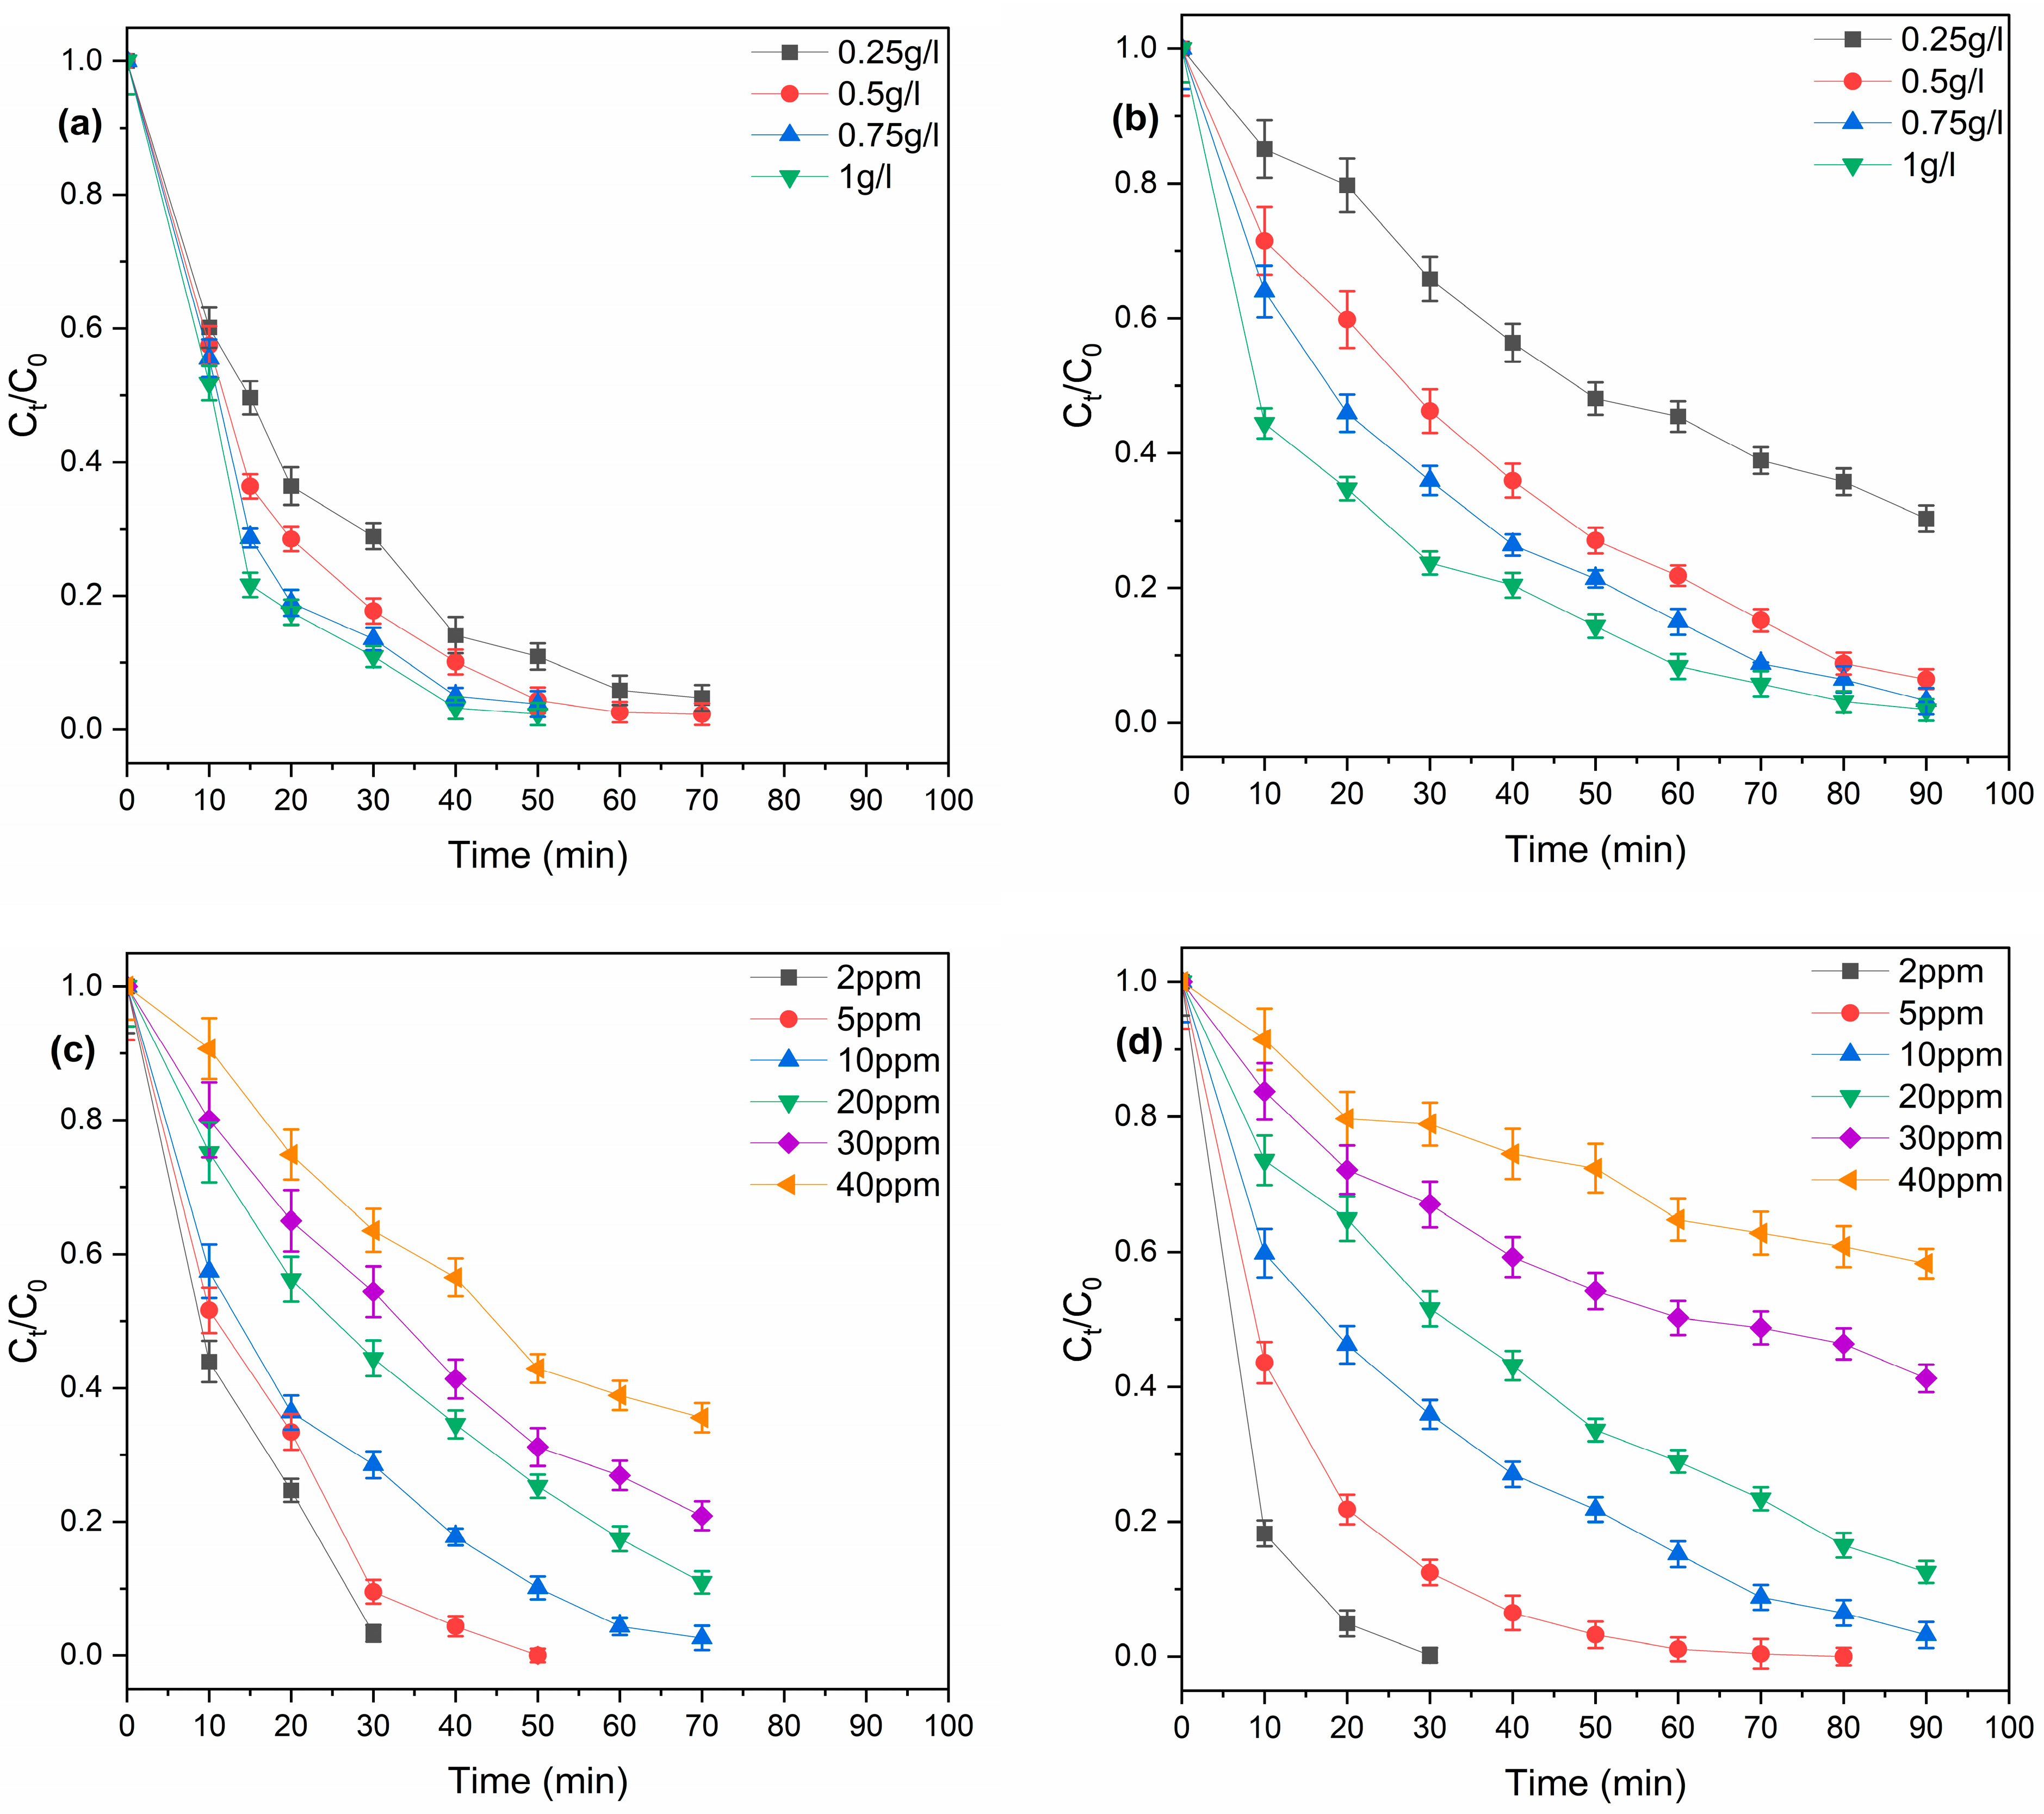
3.3. Catalyst Dosage Effect

To investigate the effect of a 5%Ag@Z photocatalyst dose on the photodegradation of TCS and MB under UV-C light, the catalyst amounts were varied from 7.5 to 30 mg per 30 mL, as illustrated in Figure 6a,b. An improvement in the degradation rate was observed with the increase in catalyst dose for both analytes. The photocatalytic efficiency of 5%Ag@Z catalysts for MB and TCS increased from 69.70% and 89.05% to 98.08% and 98.66% at 90 min and 50 min, respectively, with the augmentation of the dose from 0.25 mg/L to 1 mg/L. The increase in the photocatalytic activity is related to the increasing number of active sites available for adsorption on the surface of the photocatalyst, due to the high catalyst amount, thus boosting the generation of radicals.

3.4. Concentration Effect
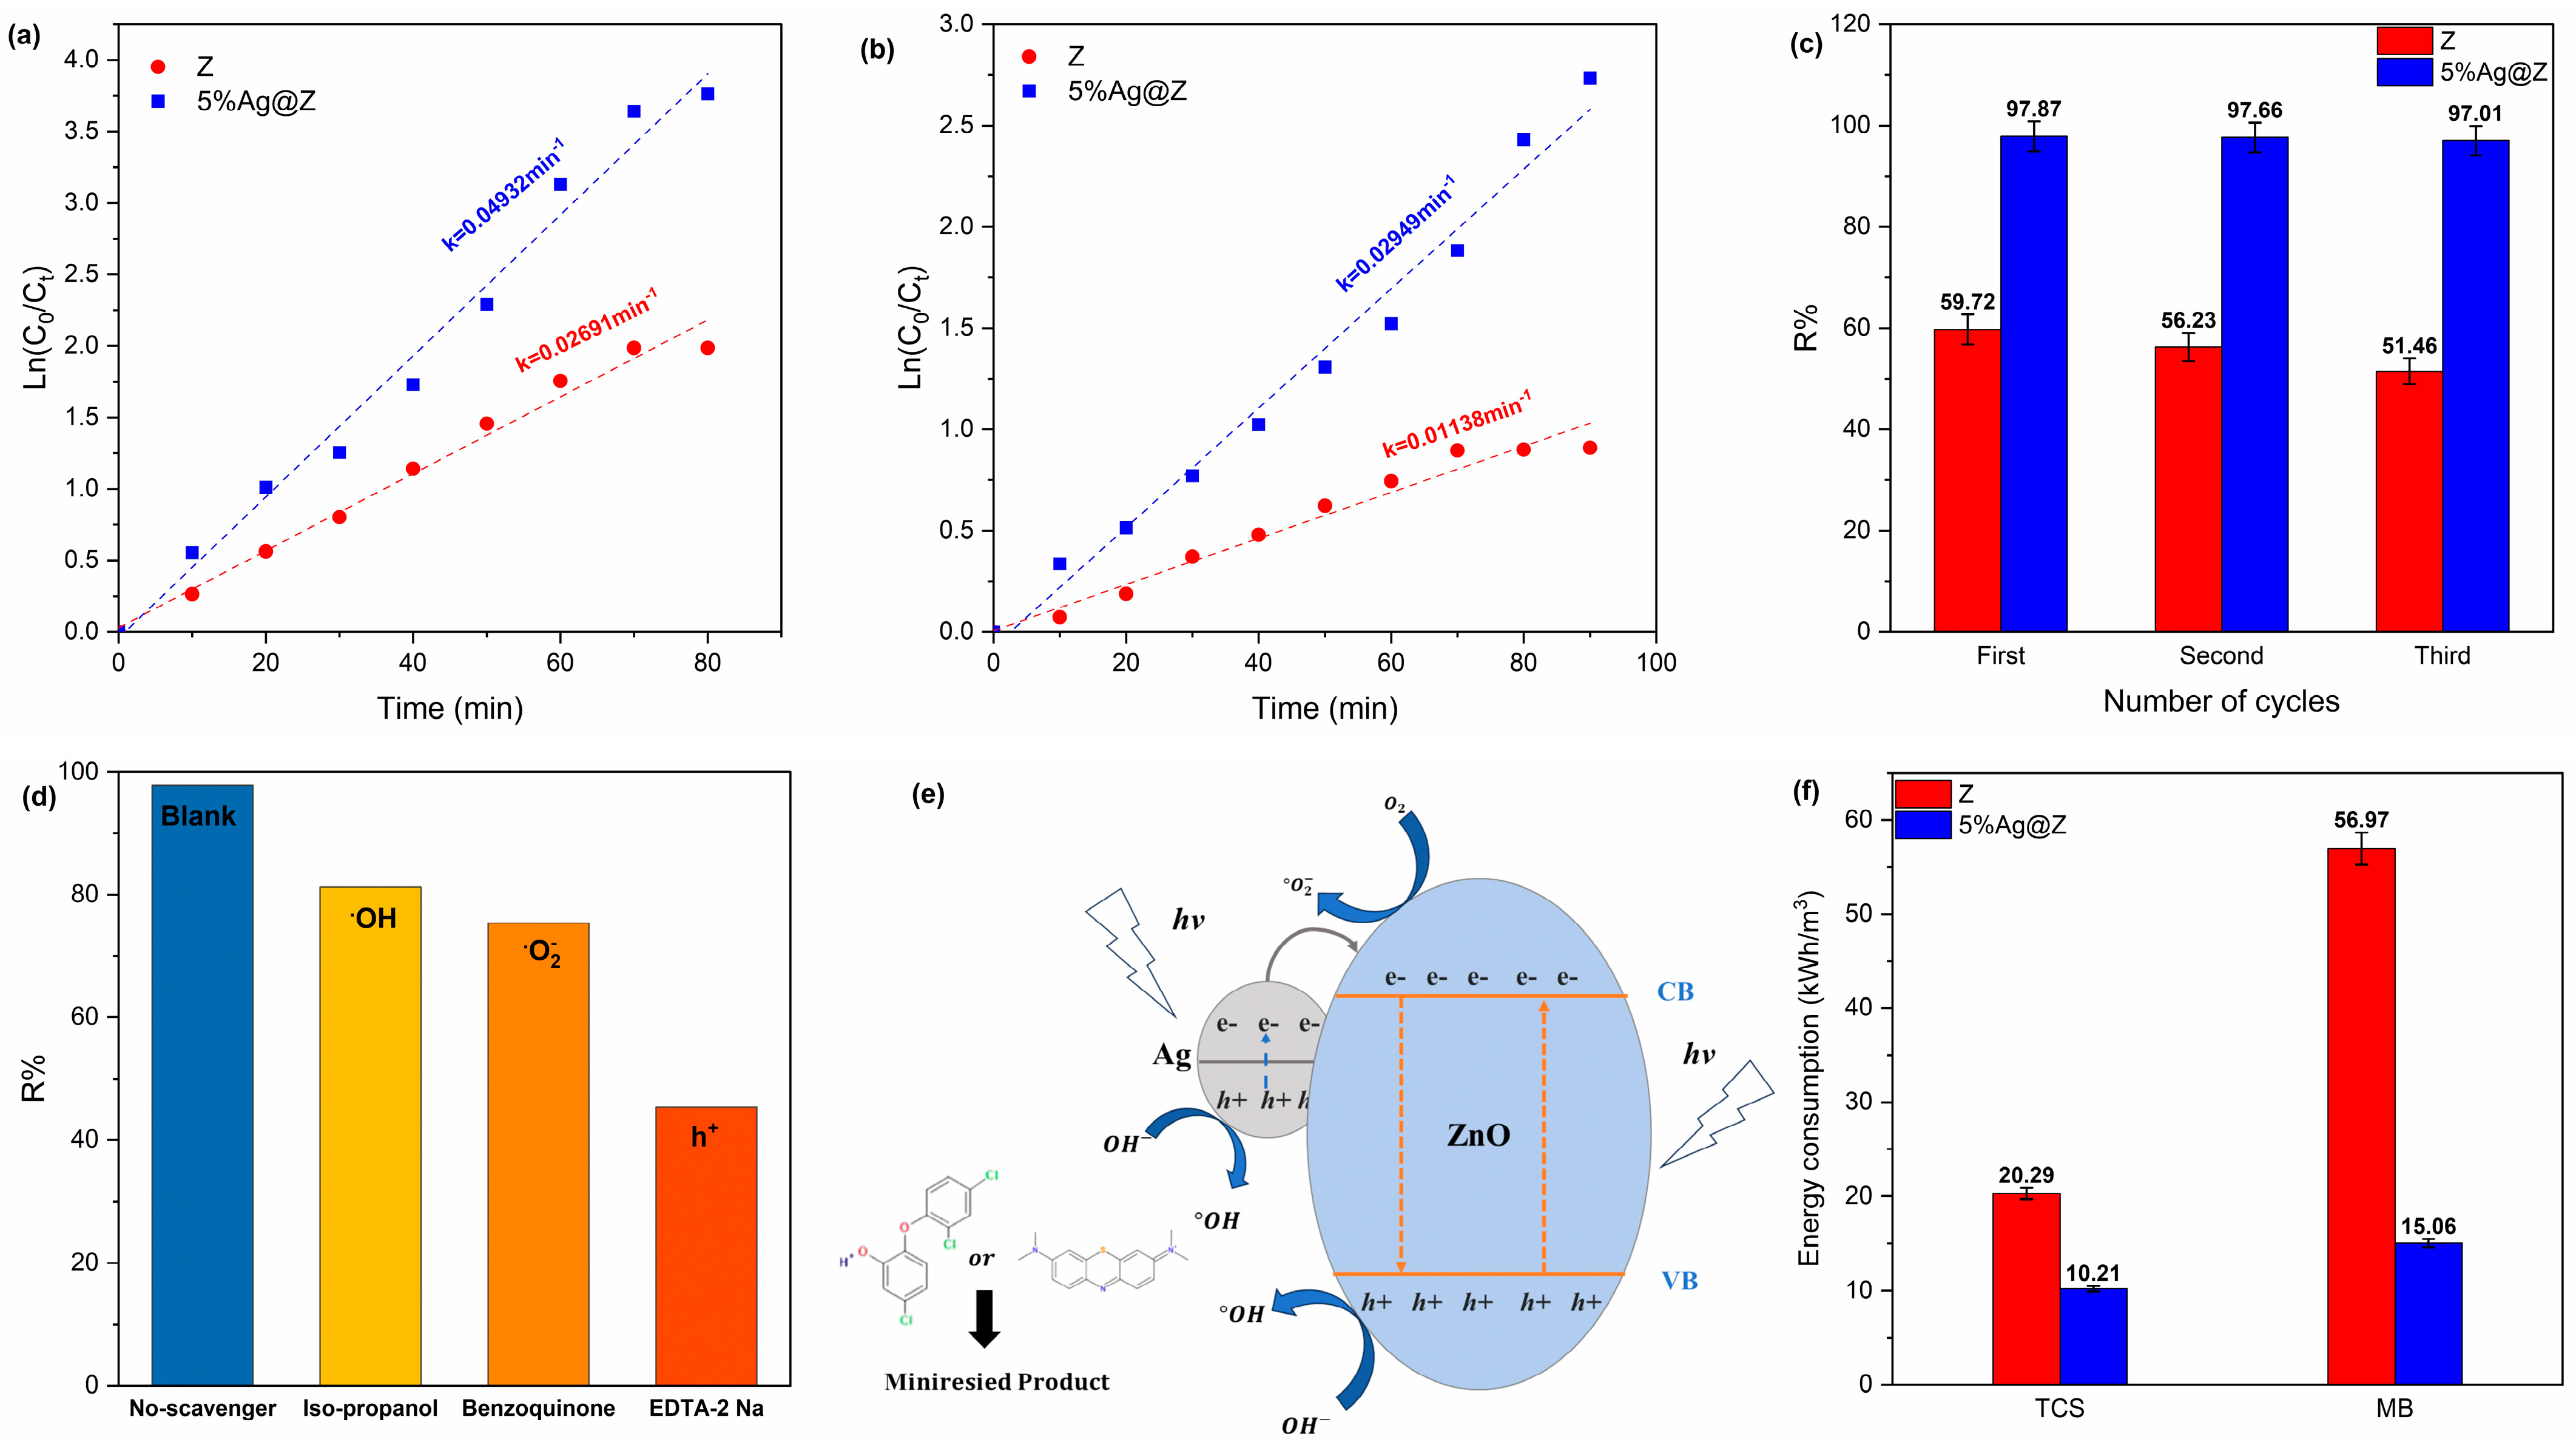
Figure 6c,d shows the effect of the variation in the initial concentration of TCS and MB on the photocatalytic activity of the 5%Ag@Z catalyst. The investigation was carried out by varying the concentrations from 2 mg/L to 40 mg/L with 0.75 mg/L as catalyst doses for both analysts at 25 °C. We observed a significant reduction in the degradation efficiencies of TCS and MB from total degradation to 64.42% and 41.70% for TCS and MB, respectively, with an increase in the initial concentration from 2 mg/L to 40 mg/L. The reduction in the degradation rate with the augmentation of TCS and MB initial concentrations can be related to analyte molecule adsorption on the catalyst surfaces, which occupied a big number of active sites, thus causing a drop in the generations of radicals. Moreover, a high analyte concentration may prevent the photons from reaching the photocatalyst, which impacts the generation of radicals as well.

3.5. Kinetics

The kinetics of the photocatalytic degradation of TCS and MB by the 5%Ag@Z catalyst was evaluated using Equation (2).
The photocatalytic degradation of both analytes followed the kinetics of the pseudo-first order, as shown in Figure 7a,b; by using Z to 5%Ag@Z catalysts, an augmentation of k was observed, from 0.02691 min−1 to 0.04932 min−1 and from 0.01138 min−1 to 0.02949 min−1 for the degradation of TCS and MB, respectively. The curving fit R2 is more than 0.98 for both catalysts in the two pollutants.

3.6. Photocatalytic Reusability

To investigate the stability of the photocatalytic activity of Z and 5%Ag@Z photocatalysts, the reusability study was performed on 10 mg/L of MB. The catalysts were collected by centrifugation, and dried at 80 °C for 24 h. Then, 0.5 g/L of dry catalysts was reused for the following cycle under the same conditions. The reusability test shows a slight reduction in the photocatalytic degradation of MB by 5%Ag@Z for 97.87% to 97.01% after three cycles, as illustrated in Figure 7c. However, the degradation efficiency of Z decreased by 8.26% after only three cycles. This reduction in the degradation activity of Z is related to photocorrosion [27]. In comparison to Z, 5%Ag@Z demonstrated great photocatalytic efficiency and increased photostability.

3.7. Role of Reactive Species and Photocatalytic Mechanism

The scavenger investigation was conducted to determine the main oxidizing radicals responsible for the photocatalytic degradation of MB. Figure 7d shows the effect of isopropanol, benzoquinone, and EDTA-2Na as captive of °O2, OH°, and h+, respectively. The degradation rate slightly decreases from 97.87% to 81.25% and 75.37% in the presence of isopropanol and benzoquinone, respectively. However, the degradation efficiency decreased to 45.31% in the presence of EDTA-2Na. Thus, the results showed that °O2 is the least effective species in the degradation process; on another hand, h+ and °O2 were discovered to be major radicals in the photodegradation of MB.
Along with the free radical investigation mentioned above, a hypothesis mechanism of degradation is proposed in Figure 7e and equations [5,6,7,8]. With the UV-C light irradiation, e hole pairs were generated by the excitement of the photocatalyst 5%Ag@Z, where the e is stimulated to go from the valance band (VB) to the conduction band (CV), where the h+ were generated. Moreover, °O2 and °OH were produced by the capture of photoexcited electrons in the dissolved oxygen in water [28]. The presence of Ag enhances the number of photoexcited electrons, which leads to an improvement in the photocatalytic degradation of pollutants.
The mineralization of TCS and MB solutions was investigated by total organic carbon analysis (TOC) in the presence of 5%Ag@Z, as shown in Figure S3, where 59% of TCS and almost 69% of MB were mineralized after 50 min and 80 min, respectively.
Z n O + h ν Z n O ( e + h + )
h + + H 2 O ° O H + H +
e + O 2 ° O 2
A g + e A g

3.8. Energy Consumption

One of the biggest obstacles to the usage of the photocatalytic degradation process is the requirement for large sources of energy [29]. EC is defined by the (IUPAC) International Union of Pure and Applied Chemistry as the kilowatt-hours (kWh) of electrical energy required to reduce a contaminant’s concentration in a solution [30], it is possible to calculate EC using Equation (8) [28].
E C = P × t × 1000 V × 60 × l o g ( C 0 C t )
where P is the power from the UV-C lamp, t is the reaction time (min), V is the volume (L), and C0 and Ct are the concentrations at instant 0 and t, respectively. The energy consumed for the maximum photocatalytic degradation of 1 m3 of 10 mg/L of TCS and MB increased from 20.29 to 10.21 kWh/m3 and from 56.97 to 15.06 kWh/m3 in presence of 0.5 g/L of Z and 5%Ag@Z under the UV-C lamp (15 W) for 70 min and 90 min, respectively, as presented in Figure 7f. 5%Ag@Z saved 50% and 74% of EC for the photocatalytic degradation of TCS and MB, respectively, in comparison with Z.

4. Conclusions

Through hydrothermal synthesis, pure zinc oxide Z was prepared and loaded with various percentages of silver via precipitation and activation with UV-C light. The samples were characterized with various techniques and used as photocatalysts for the degradation of triclosan and methylene blue, respectively. The photocatalytic activity was improved with the silver loading. The enhancement of silver nanoparticle charge separation and the surface plasmon resonance effect were the reasons behind the enhancement of the photocatalytic degradation. The 5%Ag@Z photocatalyst presented the highest degradation rates for MB and TCS with 97.87% and 98.66% at 80 min and 50 min, respectively. Silver loading on zinc oxide photocatalysts has promising properties for the photodegradation of organic pollutants, and it has demonstrated great efficiency with a good recycling response.

Supplementary Materials

The following supporting information can be downloaded at: https://www.mdpi.com/article/10.3390/separations11080221/s1, Table S1: Chemical structure of TCS and MB; Figure S1: Schematic illustration of photocatalytic UV reactor; Figure S2: (a) XPS survey of Z, 1%A@Z, 3%A@Z, 5%A@Z, and 7%A@Z. (b) Ag 3d; Table S2: XPS surface atomic percentage of the main elements; Figure S3: Degradation and TOC removal rate of TCS and MB by 5%Ag@Z.

Author Contributions

Conceptualization: L.A.G.-F., M.C., V.C.R. and M.S.P.; methodology: L.A.G.-F., M.C., A.A., V.C.R. and M.S.P.; software: L.A.G.-F., M.C., A.A., V.C.R. and M.S.P.; validation: L.A.G.-F., M.C., A.A., V.C.R. and M.S.P.; formal analysis: L.A.G.-F., M.C., A.A., V.C.R., M.S.P.; investigation: L.A.G.-F., M.C., A.A., V.C.R. and M.S.P.; resources: A.A. and M.S.P.; data curation: L.A.G.-F., M.C., A.A., V.C.R., M.S.P.; writing—original draft preparation: L.A.G.-F., M.C., V.C.R., M.S.P., A.A.; writing—review and editing: L.A.G.-F., M.C., A.A., V.C.R., M.S.P.; visualization, L.A.G.-F., V.C.R. and M.S.P.; funding acquisition: V.C.R., A.A. and M.S.P. All authors have read and agreed to the published version of the manuscript.

Funding

This work was funded by the EU Commission as part of the Erasmus+ Programme.

Data Availability Statement

The original contributions presented in the study are included in the article/Supplementary Materials, further inquiries can be directed to the corresponding author.

Acknowledgments

This work was developed as part of a PhD thesis in Chemistry at the University of Granada and at the Applied Chemistry and Environment at Hassan First University of Settat, funded by the EU Commission as part of the Erasmus+ Programme.

Conflicts of Interest

The authors declare no conflicts of interest.

References

  1. Ma, S.; Xia, X.; Song, Q.; Zhao, Y.; Yang, J. Heterogeneous Junction Ni-MOF @ BiOBr Composites: Photocatalytic Degradation of Methylene Blue and Ciprofloxacin. Solid. State Sci. 2023, 138, 107135. [Google Scholar] [CrossRef]
  2. Lee, K.M.; Lai, C.W.; Ngai, K.S.; Juan, J.C. Recent Developments of Zinc Oxide Based Photocatalyst in Water Treatment Technology: A Review. Water Res. 2016, 88, 428–448. [Google Scholar] [CrossRef] [PubMed]
  3. Sun, C.; Zhang, T.; Zhou, Y.; Liu, Z.F.; Zhang, Y.; Bian, Y.; Feng, X.S. Triclosan and Related Compounds in the Environment: Recent Updates on Sources, Fates, Distribution, Analytical Extraction, Analysis, and Removal Techniques. Sci. Total Environ. 2023, 870, 161885. [Google Scholar] [CrossRef]
  4. Milanović, M.; Đurić, L.; Milošević, N.; Milić, N. Challenges in managing and risk assessment of emerging Comprehensive Insight into Triclosan—From Widespread Occurrence to Health Outcomes. Environ. Sci. Pollut. Res. 2023, 30, 25119–25140. [Google Scholar] [CrossRef] [PubMed]
  5. Isai, K.A.; Shrivastava, V.S. Photocatalytic Degradation of Methylene Blue Using ZnO and 2%Fe–ZnO Semiconductor Nanomaterials Synthesized by Sol–Gel Method: A Comparative Study. SN Appl. Sci. 2019, 1, 1247. [Google Scholar] [CrossRef]
  6. Olusakin, P.; Oladiran, T.; Oyinkansola, E.; Joel, O. Results in Engineering Methylene Blue Dye: Toxicity and Potential Elimination Technology from Wastewater. Results Eng. 2022, 16, 100678. [Google Scholar] [CrossRef]
  7. Khairnar, S.D.; Shrivastava, V.S. Facile Synthesis of Nickel Oxide Nanoparticles for the Degradation of Methylene Blue and Rhodamine B Dye: A Comparative Study. J. Taibah Univ. Sci. 2019, 13, 1108–1118. [Google Scholar] [CrossRef]
  8. Pavel, M.; Anastasescu, C.; State, R.-N.; Vasile, A.; Papa, F.; Balint, I. Photocatalytic Degradation of Organic and Inorganic Pollutants to Harmless End Products: Assessment of Practical Application Potential for Water and Air Cleaning. Catalysts 2023, 13, 380. [Google Scholar] [CrossRef]
  9. Kosera, V.S.; Cruz, T.M.; Chaves, E.S.; Tiburtius, E.R.L. Triclosan Degradation by Heterogeneous Photocatalysis Using ZnO Immobilized in Biopolymer as Catalyst. J. Photochem. Photobiol. A Chem. 2017, 344, 184–191. [Google Scholar] [CrossRef]
  10. da Silva Alves, D.C.; de Farias, B.S.; Breslin, C.; de Almeida Pinto, L.A.; Cadaval, T.R.S.A. Carbon Nanotube-Based Materials for Environmental Remediation Processes. In Advanced Materials for Sustainable Environmental Remediation; Elsevier: Amsterdam, The Netherlands, 2022; pp. 475–513. [Google Scholar] [CrossRef]
  11. Vaya, D.; Surolia, P.K. Environmental Technology & Innovation Semiconductor Based Photocatalytic Degradation of Pesticides: An Overview. Environ. Technol. Innov. 2020, 20, 101128. [Google Scholar] [CrossRef]
  12. Wong, K.T.; Kim, S.C.; Yun, K.; Choong, C.E.; Nah, I.W.; Jeon, B.H.; Yoon, Y.; Jang, M. Understanding the Potential Band Position and e–/H+ Separation Lifetime for Z-Scheme and Type-II Heterojunction Mechanisms for Effective Micropollutant Mineralization: Comparative Experimental and DFT Studies. Appl. Catal. B 2020, 273, 119034. [Google Scholar] [CrossRef]
  13. Khalid, A.; Ahmad, P.; Memon, R.; Gado, L.F.; Khandaker, M.U.; Almukhlifi, H.A.; Modafer, Y.; Bashir, N.; Abida, O.; Alshammari, F.A.; et al. Structural, Optical, and Renewable Energy-Assisted Photocatalytic Dye Degradation Studies of ZnO, CuZnO, and CoZnO Nanostructures for Wastewater Treatment. Separations 2023, 10, 184. [Google Scholar] [CrossRef]
  14. Zhang, Z.; Zada, A.; Cui, N.; Liu, N.; Liu, M.; Yang, Y.; Jiang, D.; Jiang, J.; Liu, S. Synthesis of Ag Loaded ZnO/BiOCl with High Photocatalytic Performance for the Removal of Antibiotic Pollutants. Crystals 2021, 11, 981. [Google Scholar] [CrossRef]
  15. Dimitropoulos, M.; Aggelopoulos, C.A.; Sygellou, L.; Tsantis, S.T.; Koutsoukos, P.G.; Yannopoulos, S.N. Unveiling the Photocorrosion Mechanism of Zinc Oxide Photocatalyst: Interplay between Surface Corrosion and Regeneration. J. Environ. Chem. Eng. 2024, 12, 112102. [Google Scholar] [CrossRef]
  16. Trandafilović, L.V.; Jovanović, D.J.; Zhang, X.; Ptasińska, S.; Dramićanin, M.D. Enhanced Photocatalytic Degradation of Methylene Blue and Methyl Orange by ZnO:Eu Nanoparticles. Appl. Catal. B 2017, 203, 740–752. [Google Scholar] [CrossRef]
  17. Ersöz, E.; Altintas Yildirim, O. Green Synthesis and Characterization of Ag-Doped ZnO Nanofibers for Photodegradation of MB, RhB and MO Dye Molecules. J. Korean Ceram. Soc. 2022, 59, 655–670. [Google Scholar] [CrossRef]
  18. Assimeddine, M.; Farid, Z.; Abdennouri, M.; Barka, N.; Lemdek, E.M.; Sadiq, M. Improvement of Photocatalytic Degradation of Methyl Orange by Impregnation of Natural Clay with Nickel: Optimization Using the Box-Behnken Design (BBD). Environ. Sci. Pollut. Res. 2023, 30, 62494–62507. [Google Scholar] [CrossRef] [PubMed]
  19. Ramesan, M.T.; Greeshma, K.P.; Parvathi, K.; Anilkumar, T. Structural, Electrical, Thermal, and Gas Sensing Properties of New Conductive Blend Nanocomposites Based on Polypyrrole/Phenothiazine/Silver-Doped Zinc Oxide. J. Vinyl Addit. Technol. 2020, 26, 187–195. [Google Scholar] [CrossRef]
  20. Alnehia, A.; Al-Sharabi, A.; Al-Hammadi, A.H.; Al-Odayni, A.B.; Alramadhan, S.A.; Alodeni, R.M. Phyto-Mediated Synthesis of Silver-Doped Zinc Oxide Nanoparticles from Plectranthus Barbatus Leaf Extract: Optical, Morphological, and Antibacterial Properties. Biomass Convers. Biorefin 2023, 14, 17041–17053. [Google Scholar] [CrossRef]
  21. Stan, M.; Popa, A.; Toloman, D.; Silipas, T.D.; Vodnar, D.C. Antibacterial and Antioxidant Activities of ZnO Nanoparticles Synthesized Using Extracts of Allium Sativum, Rosmarinus Officinalis and Ocimum Basilicum. Acta Metall. Sin. (Engl. Lett.) 2016, 29, 228–236. [Google Scholar] [CrossRef]
  22. Zeferino, R.S.; Barboza-flores, M.; Pal, U. Photoluminescence and Raman Scattering in Ag-Doped ZnO Nanoparticles. J. Appl. Phys. 2011, 109, 014308. [Google Scholar] [CrossRef]
  23. Chauhan, A.; Verma, R.; Kumari, S.; Sharma, A.; Shandilya, P. Photocatalytic Dye Degradation and Antimicrobial Activities of Pure and Ag-Doped ZnO Using Cannabis Sativa Leaf Extract. Sci. Rep. 2020, 10, 781. [Google Scholar] [CrossRef] [PubMed]
  24. Varudkar, H.A.; Umadevi, G.; Nagaraju, P.; Dargad, J.S.; Mote, V.D. Fabrication of Al-Doped ZnO Nanoparticles and Their Application as a Semiconductor-Based Gas Sensor for the Detection of Ammonia. J. Mater. Sci. Mater. Electron. 2020, 31, 12579–12585. [Google Scholar] [CrossRef]
  25. Aggelopoulos, C.A.; Dimitropoulos, M.; Govatsi, A.; Sygellou, L.; Tsakiroglou, C.D.; Yannopoulos, S.N. Influence of the Surface-to-Bulk Defects Ratio of ZnO and TiO2on Their UV-Mediated Photocatalytic Activity. Appl. Catal. B 2017, 205, 292–301. [Google Scholar] [CrossRef]
  26. Merlin, R. Raman Studies of Fibonacci, Thue-Morse, and Random Superlattices. In Light Scattering in Solids V: Superlattices and Other Microstructures; Cardona, M., Güntherodt, G., Eds.; Springer: Berlin/Heidelberg, Germany, 1989; Volume 66/1, pp. 214–232. ISBN 978-3-540-50400-9. [Google Scholar]
  27. Ma, X.; Li, H.; Liu, T.; Du, S.; Qiang, Q.; Wang, Y.; Yin, S.; Sato, T. Comparison of Photocatalytic Reaction-Induced Selective Corrosion with Photocorrosion: Impact on Morphology and Stability of Ag-ZnO. Appl. Catal. B 2017, 201, 348–358. [Google Scholar] [CrossRef]
  28. Balarak, D.; Mengelizadeh, N.; Rajiv, P.; Chandrika, K. Photocatalytic Degradation of Amoxicillin from Aqueous Solutions by Titanium Dioxide Nanoparticles Loaded on Graphene Oxide. Environ. Sci. Pollut. Res. 2021, 28, 49743–49754. [Google Scholar] [CrossRef] [PubMed]
  29. Guo, W.; Guo, T.; Zhang, Y.; Yin, L.; Dai, Y. Chemosphere Progress on Simultaneous Photocatalytic Degradation of Pollutants and Production of Clean Energy: A Review. Chemosphere 2023, 339, 139486. [Google Scholar] [CrossRef]
  30. Al-Musawi, T.J.; Yilmaz, M.; Ramírez-Coronel, A.A.; Al-Awsi, G.R.L.; Alwaily, E.R.; Asghari, A.; Balarak, D. Degradation of Amoxicillin under a UV or Visible Light Photocatalytic Treatment Process Using Fe2O3/Bentonite/TiO2: Performance, Kinetic, Degradation Pathway, Energy Consumption, and Toxicology Studies. Optik 2023, 272, 170230. [Google Scholar] [CrossRef]
Figure 1. (a) XRD spectrum; (b) FTIR spectra of Z, 1%Ag@Z, 3%Ag@Z, 5%Ag@Z, and 7%Ag@Z nanostructures; and (c) SEM image of 5%Ag@Z and (df) the corresponding element mapping images.
Separations 11 00221 g001
Figure 2. (a) UV–vis absorption spectra, (b) the Tauc plot of Z, 1%Ag@Z, 3%Ag@Z, 5%Ag@Z, and 7%Ag@Z nanostructures.
Separations 11 00221 g002
Figure 3. (a) XPS survey of Z and 5%Ag@Z, (b) Zn 2p, (c) O 1s, and (d) Ag 3d.
Separations 11 00221 g003
Figure 4. (ac) Raman spectra of Z, 1%Ag@Z, 3%Ag@Z, 5%Ag@Z, and 7%Ag@Z nanoparticles.
Separations 11 00221 g004
Figure 5. Adsorption behavior of Z, 1%Ag@Z, 3%Ag@Z, 5%Ag@Z, and 7%Ag@Z nanostructures toward (a) TCS and (b) MB. The photodegradation of (c) TCS and (d) MB.
Separations 11 00221 g005
Figure 6. Dosage effect of 5%Ag@Z on the photocatalytic degradation of (a) TCS and (b) MB. Effect on the initial concentration of (c) TCS and (d) MB on photodegradation by 5%Ag@Z.
Separations 11 00221 g006
Figure 7. Kinetic study of Z and 5%Ag@Z on (a) TCS and (b) MB. (c) Reusability study of Z and 5%Ag@Z on MB. (d) Effect of different scavengers on the degradation of MB. (e) Photocatalytic mechanism diagram. (f) Energy consumption of photocatalytic degradation of TCS and MB by Z and 5%Ag@Z, respectively.
Separations 11 00221 g007
Table 1. XPS surface atomic percentage of the main elements of Z and 5%Ag@Z.
Atomic Percentage (At %)
Zn (2p)O (1s)Ag (3d)Element Ratio
Zn:O:Ag
Z80.0519.95-4:1:0
5% Ag@Z81.6515.283.0726.6:5:1
Disclaimer/Publisher’s Note: The statements, opinions and data contained in all publications are solely those of the individual author(s) and contributor(s) and not of MDPI and/or the editor(s). MDPI and/or the editor(s) disclaim responsibility for any injury to people or property resulting from any ideas, methods, instructions or products referred to in the content.

