Article

Achieving Simultaneous Nitrification and Denitrification by a Membrane Aerated Biofilm Reactor at Moderate Lumen Pressure

1
School of Urban Construction, Changzhou University, Changzhou 213164, China
2
School of Environmental Science and Engineering, Changzhou University, Changzhou 213164, China
*
Author to whom correspondence should be addressed.
Separations 2024, 11(8), 227; https://doi.org/10.3390/separations11080227
Submission received: 25 June 2024 / Revised: 22 July 2024 / Accepted: 23 July 2024 / Published: 25 July 2024
(This article belongs to the Special Issue Removal and Recovery of Nitrogen and Phosphorus from Wastewater)

Abstract

:
Lumen pressure is of crucial importance to achieve simultaneous nitrification and denitrification (SND) in the membrane aerated biofilm reactor (MABR); so, in this study, a laboratory-scale MABR was operated under different lumen pressures (7 kPa, 10 kPa, 13 kPa, and 16 kPa) successively to verify its impact on nitrogen removal. The results showed that NH4+-N oxidation was deficient under 7 kPa due to inadequate oxygen supply, while denitrification was depressed under 16 kPa. Total nitrogen removal efficiency was similar under 10 kPa and 13 kPa (around 78.9%), much higher than that under 7 kPa and 16 kPa (approximately 50%). The biomass density (22.35 g/m2) and biofilm thickness (500.3 µm) were the highest under 13 kPa, and EPS was increasingly secreted along with the increase in lumen pressure. The relative abundance of Nitrospirae was highest under 16 kPa (3.53%), indicating a higher lumen pressure could promote nitrifiers. The denitrifying-related microbes, such as β-proteobacteria, α-proteobacteria and ε-proteobacteria, showed an increasing and then decreasing pattern along with lumen pressure increase, and were enriched at 10 kPa. The results could draw the conclusion that SND could be achieved at moderate lumen pressure, i.e., 10 kPa and 13 kPa in this study.

1. Introduction

As one of the common nutrients in domestic wastewater, nitrogen should be removed to meet certain standards as it is a main factor causing eutrophication in natural water [1]. While efficient and cheap removal methods have been researched for organic matters (BOD and COD), nitrogen compounds typically require stricter conditions or more advanced means for treatment [2]. Compared with physio-chemical methods for nitrogen removal, biological methods have showed their advantages, such as low cost, simple operating procedures, and non-toxic products [3]. Biological nitrogen removal (BNR) refers to the process in which organic nitrogen and ammonia are transformed into nitrogen gas by naturally existing functional microorganisms [4]. In wastewater treatment plants (WWTPs), the commonly used BNR methods usually consist of two stages—nitrification and denitrification. Because nitrification requires oxygen and denitrification thrives without oxygen, they are generally carried out in separate reactors. Based on this process mechanism, several typical BNR processes have been developed, such as the anoxic/oxic (A/O) process, the anaerobic/anoxic/oxic (A2/O) process and the sequencing batch reactor (SBR) process. Generally, these processes could reach a high nitrogen removal efficiency (over 90%, or even over 95%) [4,5]. Furthermore, unlike physio-chemical methods, such as break point chlorination or air stripping, neither expensive chemicals nor a high power input are required for BNR processes, making them widely used nitrogen removal methods in WWTPs [6]. However, as stricter nitrogen discharge standards have been issued in recent years and carbon neutral policies have been applied globally, the demand for low-carbon methods that are more energy-efficient with higher oxygen transfer efficiency and lower sludge production has become more urgent [7]. Biofilm-based technologies such as a moving bed biofilm reactor have been applied to achieve better treating performance with high biological density, activity, and stability [8], but the competition for a carbon source between heterotrophs and denitrifiers and the mass transfer limitations hinder the nitrogen removal process [9].
Recently, attempts to develop innovative energy-efficient wastewater treatment technologies with high nitrogen removal capacities have been conducted, and the membrane aerated biofilm reactor (MABR) has stood out due to its special design combining membrane technology and aeration process with high performance [10]. In an MABR, a gas-permeable membrane is used to create a biofilm that supports counter-diffusion, with air or oxygen entering from one side and substrates from the bulk liquid entering from the opposite side [11]. The oxygen diffuses through the membrane, while substrates from the bulk liquid cross the liquid boundary layer, resulting in the most intense biological activity at the biofilm’s center, where both gaseous and liquid substrates are readily available [12]. This unique counter-diffusion characteristic of MABR provides them with a high level of functional stability, making them resistant to shock loads and toxic inhibitors [13]. MABR technology offers the ability to realize simultaneous nitrification and denitrification (SND) by manipulating the oxygen supply within the lumen, resulting in the formation of an inner zone rich in oxygen and an outer zone depleted in oxygen within the biofilm [7]. A high oxygen transfer rate could be achieved as oxygen is transferred directly through the lumen to biofilm without bubbles, significantly enhancing the nitrogen removal rate with up to 100% oxygen transfer efficiency and a low carbon footprint [14,15].
The transfer rate of oxygen in MABR is primarily regarded to be related to the lumen pressure, and studies have shown that the oxygen transfer efficiency is proportional to the lumen pressure [16]. However, high lumen pressure means high energy consumption and operation costs; so, controlling an appropriate lumen pressure is especially crucial economically. In addition, the availability of oxygen plays a crucial role in structuring the physiology and function of microbiota, which highly influence nitrogen transformation and antibiotic degradation [17]. Adjusting lumen pressure has been shown to modify the stratified micro-environment and the distribution of microbial populations within MABR, thereby impacting the multifunctional capabilities of the microbial community [18]. Ideally, an optimized lumen pressure could promote stable microbial communities and enhance overall treatment efficiency [19]. To achieve SND in the MABR system, the lumen pressure should be carefully controlled to supply enough oxygen for nitrifiers attached directly on the membrane surface (the inner layer of the biofilm), while an anoxic micro-environment should be obtained for the denitrifiers on the outer layers with the oxygen being consumed by the inner-layer nitrifiers [7]. Despite past studies having demonstrated the potential practicability of MABRs, and three commercial membrane modules (ZeeLung, OxyMem and Fluence) having been implemented in full-scale wastewater treatment plants (WWTPs) [20], research on how to select suitable lumen pressure is still scarce.
To fill the above research gap, a laboratory-scale solely biofilm-based MABR system (without suspended sludge) was operated for municipal wastewater treatment to study how lumen pressure would influence the performance of the MABR system. This investigation provides a comprehensive assessment of the system’s performance, encompassing aspects such as biofilm thickness, bacterial community structure, nitrification and denitrification efficiency, organic carbon and nitrogen removal. Operating under a range of different lumen pressure conditions, this study seeks to offer valuable insights into optimizing the MABR system for superior wastewater treatment. This study would not only provide guidance on how to optimize MABR systems to achieve SND, but also offer an investigation pattern for relevant studies, which would advance MABR-based treatment strategies for the future applications.

2. Materials and Methods

2.1. MABR System Set-Up and Operation

2.1.1. MABR System Set-Up

An MABR system in laboratory-scale (Figure S1) was established to treat synthetic municipal wastewater. The reactor employed for this investigation was a 5 L cuboid chamber, and it was connected with a feeding drum and an effluent drum, respectively, on each end. A peristaltic pump was used to control the feeding speed, while another one was implemented to recirculate the medium in the system. Made of hydrophobic polytetrafluoroethylene (from Nanjing Bidun Environmental Protection Technology Inc., Nanjing, China), the outer- and inner-diameters of the porous hollow fibers were 1 mm and 0.5 mm, respectively. The membranes were made into a module that spanned 40 cm in length with a membrane surface area of 0.1 m2. An air blower was employed for air supply, and the lumen pressure was controlled by sealing one end of the fibers and connecting the other to an air-flow meter. The reactor was shielded from light exposure using aluminum foil.

2.1.2. Experimental Operation

The MABR system was initiated by seeding the reactor with return activated sludge obtained from the secondary clarifier in a local wastewater treatment plant in Changzhou City, China. The sludge exhibited mixed liquor suspended solids (MLSS) and mixed liquor volatile suspended solids (MLVSS) of 6740 mg/L and 4250 mg/L, respectively, resulting in a calculated MLVSS/MLSS ratio of 63.05%. To achieve 3500 mg VSS/L concentration sludge, synthetic wastewater was added to make a 4 L solution, comprising the following components in mg/L: glucose 260, peptone 260, (NH4)2SO4 236, KH2PO4 34, K2SO4 105, MgSO4·7H2O 55, NaCl 45, NaHCO3 90, and Na2CO3 450. Operating temperature was set at 25 ± 2 °C, and the recirculating pump was operated at 0.01 m/s to provide enough mixing for the system. The MABR system was operated through 4 phases as follows:
Phase 1 (start-up): Throughout this phase, the dissolved oxygen (DO) concentration was maintained at 1.5~2.5 mg/L, with glucose, (NH4)2SO4, and KH2PO4 added every 24 h to ensure ample nutrients for sludge attachment to the membrane. This phase lasted approximately for 7 days until obvious biomass was observed to attach to the membrane surfaces. In this phase, the lumen pressure was set at 10 kPa.
Phase 2 (biofilm cultivation): In this phase, the medium was drained every day and then the system was replenished with fresh synthetic wastewater, resulting in an HRT of 24 h for a subsequent 30-day period to facilitate biofilm formation. The NH4+-N, total nitrogen (TN), and chemical oxygen demand (COD) concentrations in the medium were monitored daily and biofilm formation was observed under an optical microscope every week. After biofilm formation, the reactor was operated to reach a relatively stable state for 20 days.
Phase 3 (batch test): After mature biofilm formed on the membrane surfaces, the system continued to operate under the same procedure with Phase 2, except the lumen pressure was set at 7 kPa, 10 kPa, 13 kPa and 16 kPa. Each lumen pressure was operated for 7 days, and the water quality was measured every hour during one HRT cycle. To be noted, the day batch test started was marked as Day 0. Under each lumen pressure, the results of the last three HRT cycles were recorded in triplicate.
Phase 4 (long-term continuous feeding test): At Day 30, the MABR system was switched to continuously feeding mode with an HRT of 24 h and stepwise increasing lumen pressure (7 kPa, 10 kPa, 13 kPa, and 16 kPa). Each lumen pressure was operated for 15 days with water samples taken and measured every day. The biofilm was sampled before switching to the next lumen pressure.

2.2. Chemical Analysis

Periodic liquid samples were extracted using syringes and filtered using 0.22 μm PES filters from Merck Millipore Ltd. before being stored in a 4 °C refrigerator for subsequent chemical analysis. Nitrogen species, including NH4+-N, NO3-N, NO2-N, and total nitrogen (TN), were quantified following the guidelines specified in APHA methods [21]. For chemical oxygen demand (COD) measurements, the samples underwent digestion using Hach Digestion Vials, and the COD levels were assessed using a Hach Spectrophotometer (Hach, New York, NY, USA).

2.3. Biofilm Analysis

The 50 mm long membranes were excised using sterilized scissors to quantify the adhered biomass through weight measurement. Following the excision, the remaining membrane in the reactor was sealed using resin adhesive. Prior to measurement, a circular filter paper was dried to a constant weight and weighed with a dried weighing bottle, denoted as Weight A. The sampled membrane was submerged in NaOH (20%) overnight and then subjected to sonication to detach the biofilm from the membrane surface, allowing it to enter the liquid phase. This liquid phase was then filtered using the dried filter paper to capture the biomass. Subsequently, the filter paper with the biomass was dried to a constant weight and placed into the weighing bottle for measurement, denoted as Weight B. The surface area of the sampled membrane was determined and marked as a. The biomass amount was calculated using the formula: Biomass = (B − A)/a.
Biofilm thickness was assessed using Celmer’s method [22]. The membrane module was extracted from the reactor and left aside for 15 min to enable water drainage. Subsequently, the biofilm from a specific area of the module was transferred using a sterilized plastic scraper to a plastic syringe partially filled with deionized water. The increase in volume of the liquid in the syringe represented the volume of the biomass. Biofilm thickness could be calculated as follows:
T = V l π + R 2 R
where T is the biofilm thickness, V is the biomass volume, l is the length of the selected membrane fiber, and R is the fiber radius.
The biofilm’s morphology was visualized using a scanning electron microscope (SEM, HITACHI SU3500, Hitachi High-Tech Corp., Tokyo, Japan) at an accelerating voltage of 15 kV. A randomly selected piece of membrane fiber with biofilm was cut, which was immediately immersed in glutaraldehyde (2.5%) for 5 h for fixation. Subsequently, the fiber was dehydrated using a series of ethanol (20%, 50%, 70%, and 100% vol/vol in sequence) and then dried by nitrogen gas. A thin gold film was applied to the fiber prior to observation.

2.4. The Extraction and Analysis of Extracellular Polymeric Substances (EPS)

For EPS extraction and analysis, a heating method was utilized following a previous description [23]. Three 5 cm long hollow fiber membrane segments uniformly covered with biofilms were cut and carefully placed in a sterile bottle. The segments were washed three times with deionized water, and the biofilm was then removed with a sterile scalpel and transferred to 20 mL of deionized water, and then heated for 30 min at 80 °C in a water bath. Following this, the EPS solution was centrifuged at 5000 rpm for 15 min, and the supernatant was filtered through a 0.45 μm membrane. Polysaccharides (PS) in the EPS extracts were quantified using a BPA anthrone assay [24], with glucose used for calibration. The proteins (PN) in the EPS extracts were analyzed using the Coomassie brilliant blue G-250 dye-binding method according to Pierce and Suelter [25]. The total amount of EPS was represented by the sum of the PS and PN contents.
For the 3D Excitation Emission Matrix spectra (3D-EEM) analysis, a 3D fluorescence spectrometer (Cary Eclipse, Agilent, Palo Alto, Cal., USA) was employed to assess the EPS characteristics of the biofilms during different lumen pressure phases in the system. The EPS solution was appropriately diluted with deionized water to ensure accurate detection. The EPS solution was then analyzed at specific excitation and emission wavelengths (220~450 nm by 5 nm step and 280~550 nm by 1 nm step) using ultrapure water as the blank.
Additionally, to characterize the molecular structure, an infrared spectrometer (Nicolet-460, Thermo Fisher Scientific Inc.,Waltham, MA, USA) was used to acquire the Fourier-transform infrared spectra (FTIR) for main functional groups analysis in EPS. The EPS solution was freeze-dried, crushed into powder, mixed with KBr (1:100), and then processed at 400~4000/cm.

2.5. DNA Extraction and 16s rRNA Gene Sequencing Analysis

For DNA extraction and analysis, biofilms from different phases were sampled and preserved in a −80 °C freezer. Microbial DNA was extracted using the E.Z.N. ATM Mag-Bind Soil DNA Kit (OMEGA bio-tek, Norcross, GA, USA), and its concentration was determined with the Qubit dsDNA HS Kit (Thermo Fisher, Scientific Inc., Waltham, MA, USA). The highly variable region V 3~V 4 of the 16S r RNA genes was amplified using primers 341F (5′-CCTACGGGGGNGGCWGCAG-3′) and 805R (5′-GACTACHVGGGGTATCTAATCC-3′). Polymerase chain reaction (PCR) was performed, and sequencing was carried out using I11uminaMiSeq (Bioengineering (Shanghai) Co., Shanghai, China). The abundance of the microbial community could be illustrated by Chao and ACE indices, while the microbial diversity was depicted by Shannon, Simpson, and Coverage indices [26].

3. Results and Discussion

3.1. Water Quality

3.1.1. Batch Tests

As in Section 2.1, the batch test was conducted with the water quality measured every hour during one HRT cycle. The results of three cycles were recorded in triplicate and are shown as Figure 1.
As in Figure 1a, dissolved oxygen (DO) started to drop immediately after the replenish of the fresh media in all the phases. It reached up to around 0.2 mg/L after one hour under 7 kPa, 10 kPa and 13 kPa, which increased after 7 h under 13 kPa. The DO level under 16 kPa decreased to near 0.9 mg/L after 3 h and started to increase afterwards, reaching almost 3.1 mg/L at the end of the HRT cycle. The DO concentration did not show a proportional variation among different lumen pressures, which was consistent with the previous study [16].
According to Figure 1b, during the first hour, COD degradation rates were the highest under all four lumen pressures’ conditions, reaching 50.56%, 60.26%, 53.56%, and 57.09% from 7 kPa to 16 kPa, respectively, and continued to increase to relatively steady levels towards the end of the HRT cycle with cumulative degradation rates of 83.8%, 92.08%, 93.36%, and 89.55%, respectively. The COD concentration decreased more rapidly under 10 kPa lumen pressure, indicating a higher COD removal efficiency than other conditions. Xia et al. [9] reported similar phenomenon, stating that the COD removal could both reach 92%~94% under 6 kPa and 10 kPa lumen pressure.
Regarding the NH4+-N removal performance in Figure 1c, the variation in its concentrations of 10 kPa, 13 kPa, and 16 kPa almost followed the same patterns with an approximate reducing rate of 4.3 mg/(L∙h), while NH4+-N was removed moderately at the first 12 h under 7 kPa. This could be due to the low DO level under 7 kPa, which the limited nitrification process. Although DO levels under 10 kPa and 13 kPa were also relatively low, this could be attributed to the consumption of nitrifiers, which were abundant according to the NH4+-N concentrations in Figure 1c.
In Figure 1d, the NO2-N concentrations experienced fluctuations under 7 kPa, 10 kPa and 13 kPa, although they kept at a relative stable state with low accumulation under 16 kPa. NO2-N is mainly accumulated with a relative low DO level and the suppression of nitrite oxidizing bacteria [27]. Combined with the NO3-N concentrations in Figure 1e, under 16 kPa, NO3-N was detected with a highest concentration at around 4.3 mg/L, and it could be speculated that denitrifiers were suppressed under high DO level.
TN removal performances were shown in Figure 1f, and the removal efficiency was the lowest under 7 kPa, which would be attributed to the deficient NH4+-N oxidation. The tests under 16 kPa showed a high TN removal rate at the start of the tests, and the TN concentration started to approach towards around 30 mg/L after 7 h, indicating a depressed TN removal.
Overall, slight variations in lumen pressure demonstrated a significant impact on the reactor performance in this study. Compared with conventional biological wastewater treatment technologies with bubble aeration, MABR stands out due to its precise air feeding control by lumen pressure regulation [20]. This advantage has been utilized to develop methods for the suppression of nitrite oxidizing bacteria (NOB) to achieve partial nitrification [28]. This aligns with the results presented in Figure 1d, showing a significant accumulation of NO2-N during the initial 2 h of the HRT cycle at 10 kPa, and a marginal accumulation at 16 kPa. It is evident that it is possible to realize simultaneous shortcut nitrification and denitrification in the solely biofilm-based MABR system in this study, which had been achieved in a hybrid MABR system reported recently [10].

3.1.2. Long-Term Continuous Feeding Tests

For long-term continuous feeding tests, the MABR system was still maintained at an HRT of 24 h, and operated under each lumen pressure for 15 days, with water samples taken and measured every day.
Typically, pressured hollow fiber membrane tubes can effectively drive oxygen inside the membrane to diffuse outward, increasing the oxygen supply rate and DO content in the effluent [29]. As shown in Figure 2a, this was reflected when changing the lumen pressure from 7 kPa to 10 kPa but was not obvious for the range of 13 kPa to 16 kPa. The DO concentration gradually increased from 1.0 mg/L to almost 2.0 mg/L along with lumen pressure increasing from 7 kPa to 16 kPa, and it stayed relatively stable with 10 kPa and 13 kPa of 1.7 mg/L. Figure 2b showed that COD removal rates were 93.34% (7 kPa), 93.85% (10 kPa), 92.49% (13 kPa), and 93.63% (16 kPa), and these rates did not show significant differences as a result of changes in the lumen pressure. The removal rates of NH4+-N under 7 kPa were 57.63% but increased to 89.93% and 90.88% under 10 kPa and 13 kPa, respectively, approaching a steadier level at 95.23% under 16 kPa. This was reconciled with the results of the DO concentrations in Figure 2a, as the oxidation of NH4+-N was inhibited under low pressure.
According to Figure 2d, throughout the operation, NO3-N concentrations under all three conditions of 7 kPa, 10 kPa, and 13 kPa were maintained basically at 0 mg/L, whereas it was detected at around 3.3 mg/L under 16 kPa. NO2-N concentrations showed a gradually decreasing trend from 0.18 mg/L to around 0 mg/L along with the increase in lumen pressure. As shown in Figure 2e, TN removal rates could reach around 75% under 10 kPa and 13 kPa, while these were lower under 7 kPa and 16 kPa (about 55% to 60%).
When pressurized, biofilm enhances the adhesiveness between the hollow fiber membrane and biofilm by releasing extracellular polymeric substances (EPS), thereby promoting biofilm density [30]. On the other hand, the increase in tube pressure can induce the generation of substances such as protein and nucleic acid, increasing the density of biofilm. Too much EPS can clog the membrane pores, accelerate membrane fouling, and ultimately lead to a reduced oxygen supply rate [31]. Excessive tube pressure may surpass the membrane wall’s tolerance, resulting in membrane wall structure damage and affecting the oxygen transfer within the micropores [28]. These are only speculations, and further verification is necessary to determine the exact reasons.

3.2. Biofilm Characteristics

3.2.1. Biomass Density and the Thickness of Biofilm

The biomass density and the thickness of biofilm on fiber surface under different lumen pressures is shown in Figure 3. It can be observed that along with the lumen pressures increasing incrementally through 7 kPa, 10 kPa, 13 kPa, and 16 kPa, the biomass density of the MABR reactor’s biofilm was 17.5 g/m2, 19.56 g/m2, 22.35 g/m2, and 18.13 g/m2, respectively. The biomass density followed a gradually increasing pattern between 7 kPa, 10 kPa, and 13 kPa, but it decreased to slightly higher than that at 7 kPa when the lumen pressure switched to 16 kPa. Combining this with the DO levels in the system in Figure 2a, it may be due to the inadequate oxygen supply when the lumen pressure was 7 kPa, which inhibited the growth of nitrifying bacteria responsible for ammonia nitrogen oxidation, thereby reducing the biomass on the hollow fiber surface. Conversely, when the lumen pressure was 16 kPa, the high oxygen supply would suppress the growth of denitrifying bacteria, which also resulted in a reduced biofilm density. Additionally, the excessive pressure in the lumen also generates a reverse thrust on the attached microorganisms, causing them to detach from the biofilm and reducing the biomass on the fiber surface.
Similar to the biomass density, the biofilm thickness increased with lumen pressure between 7, 10, and 13 kPa, expanding from 320.52 µm to 500.3 µm; the biofilm thickness at 7 kPa and 16 kPa was lower than that at 10 kPa and 13 kPa. Thus, it is evident that the biofilm thickness was primarily influenced by the oxygen supply from the fiber, which subsequently affected the rate of microbial growth. Therefore, both excessive and inadequate pressure can lead to a reduction in the number of microorganisms on the fiber surface. The above results indicated that the lumen pressure had a significant impact on the biomass density and thickness of the biofilm.

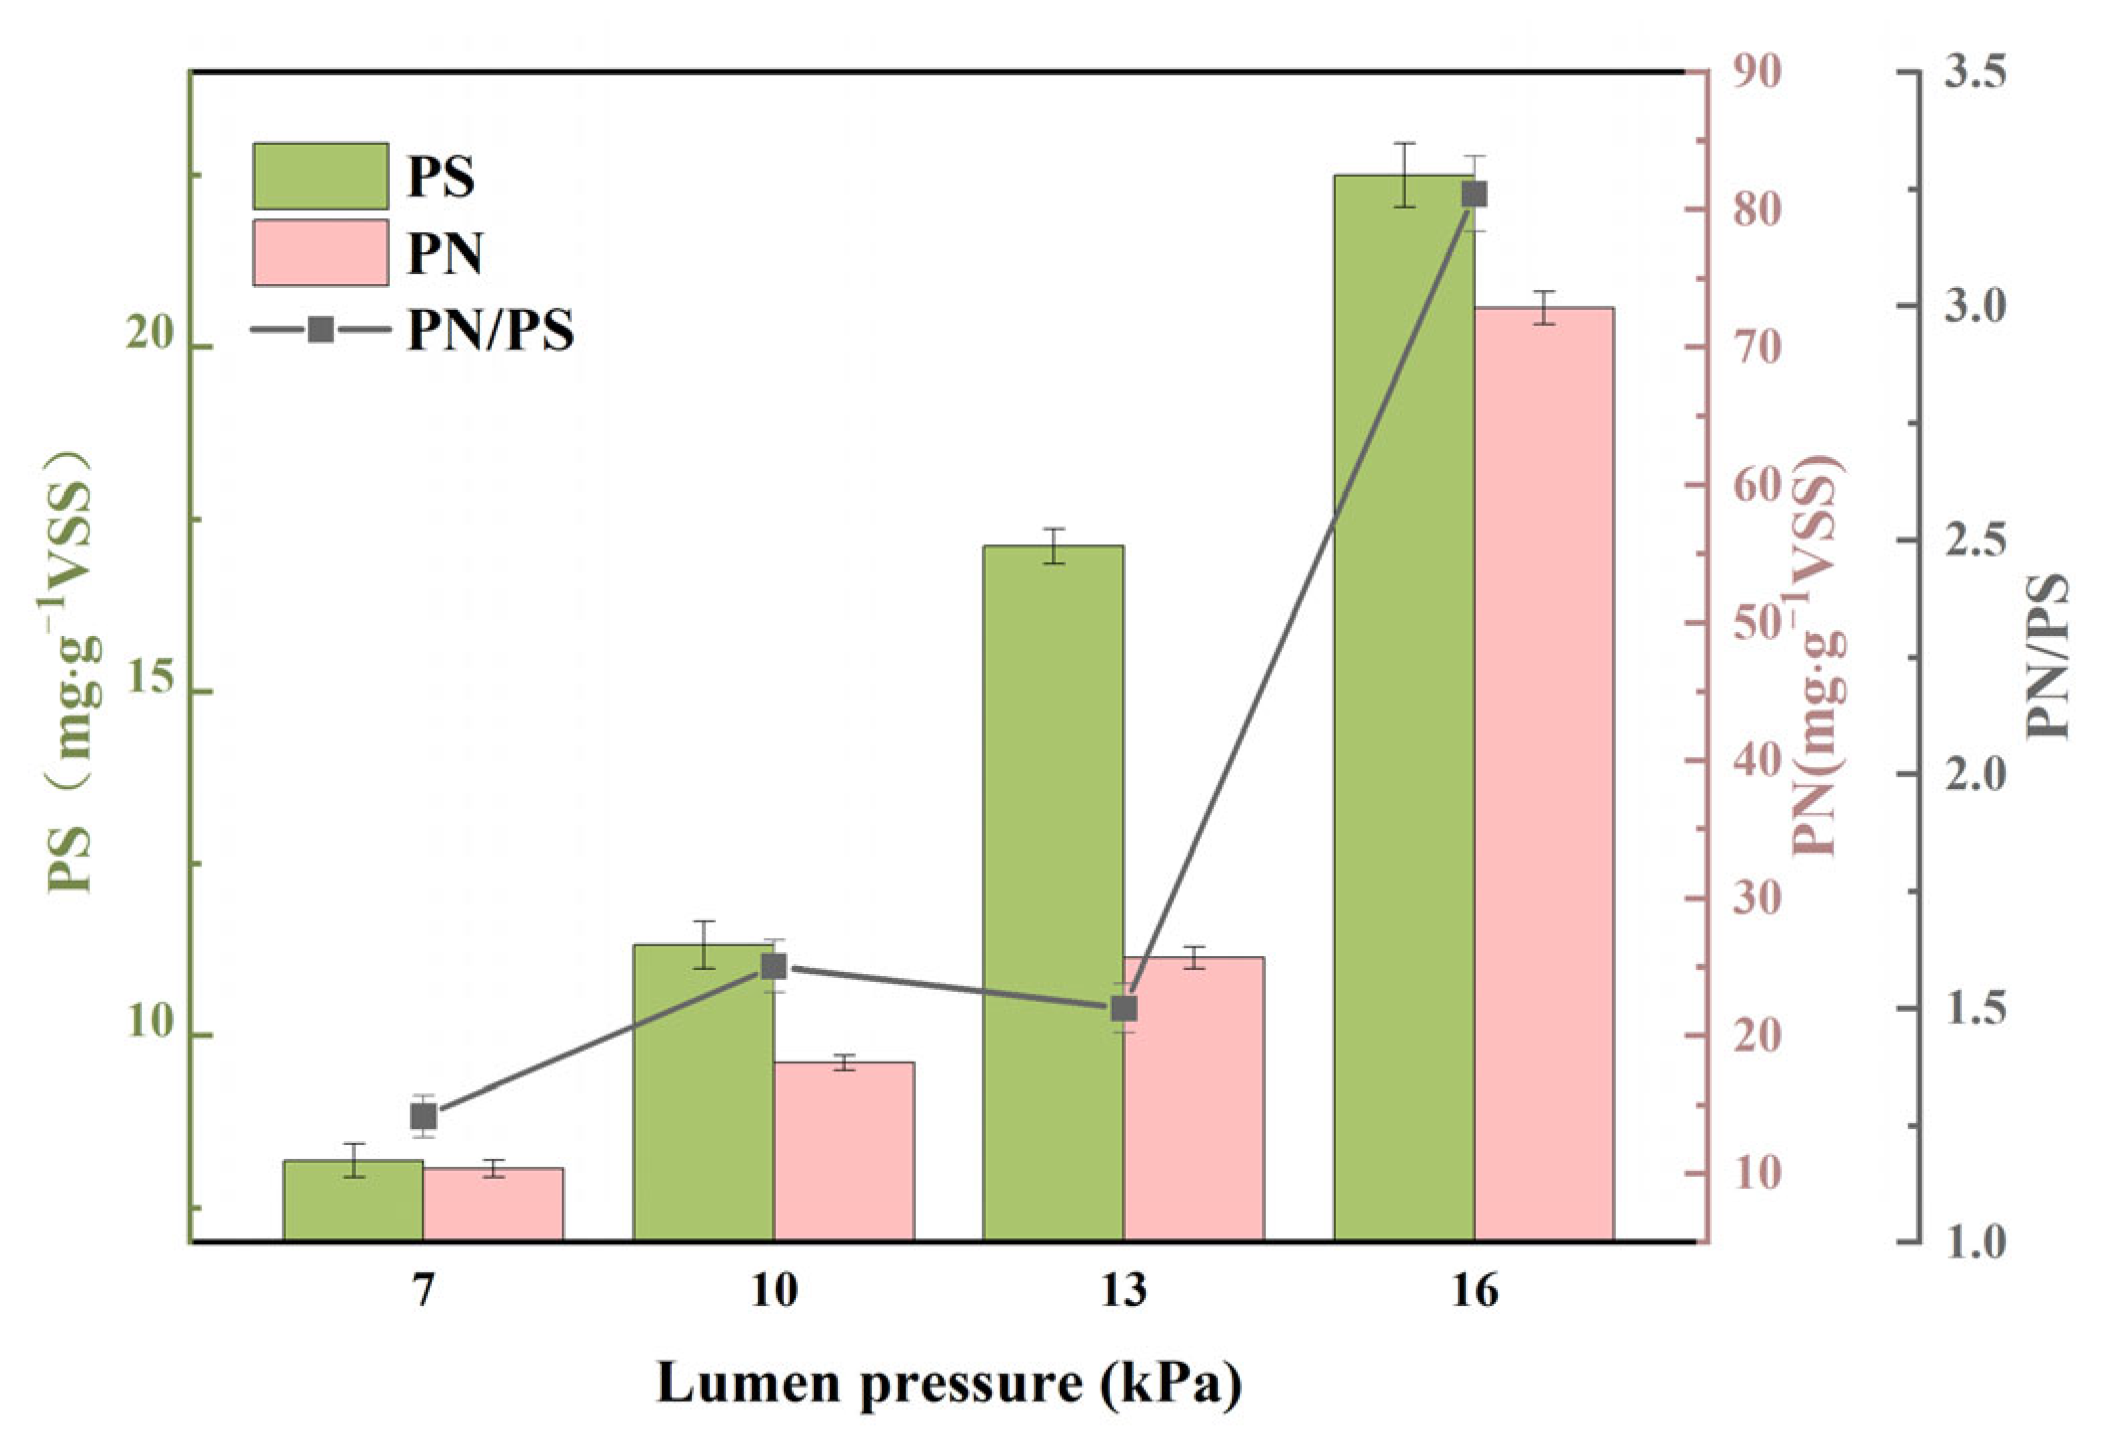
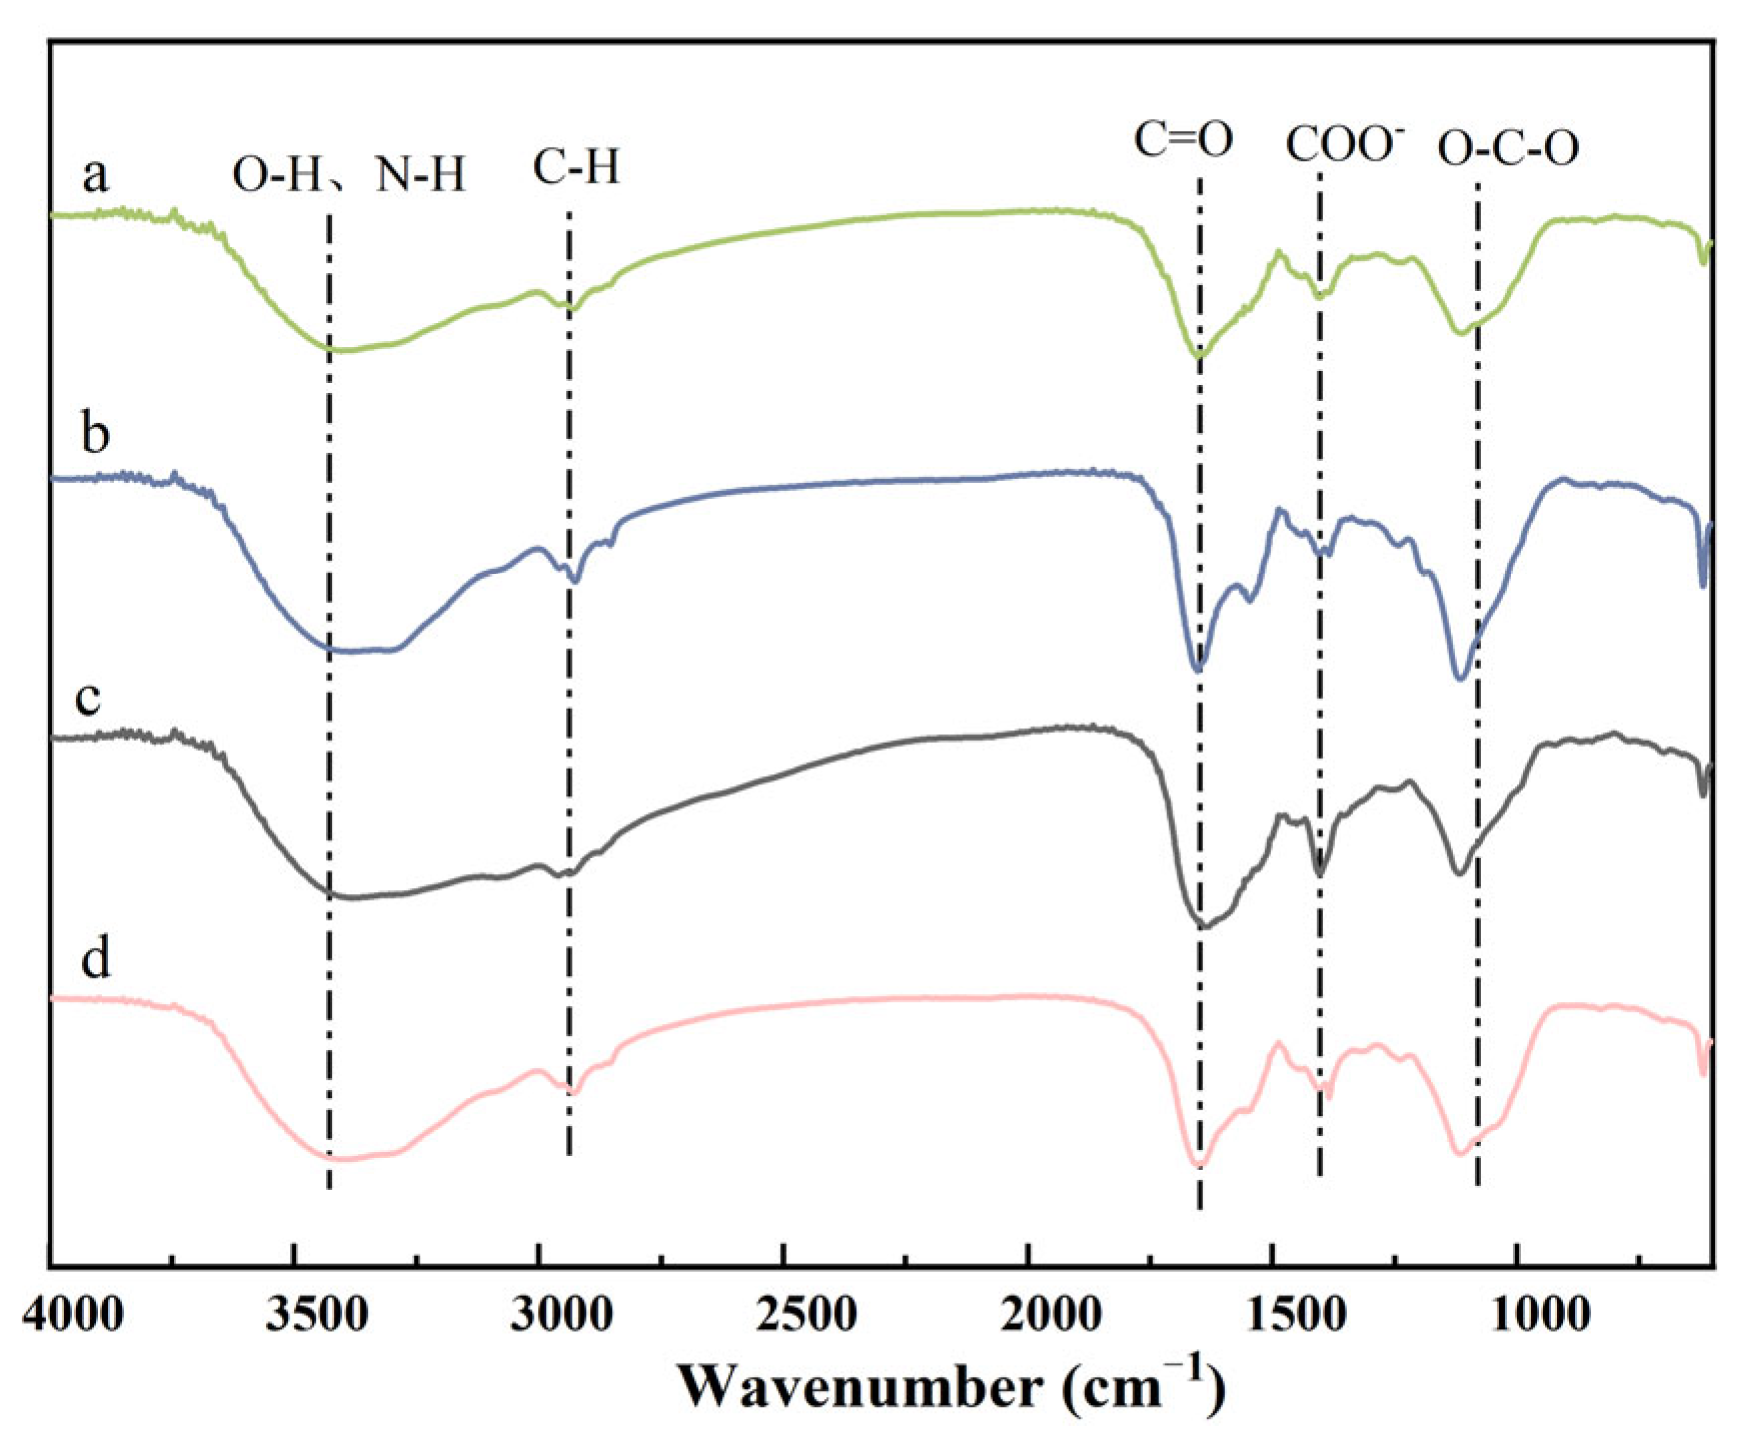
3.2.2. The Content and Composition of EPS

As a high-molecular-weight polymer synthesized by bacteria composed of PS, PN, lipids, and nucleic acids, EPS is a substance extensively found in biofilms and activated sludge, playing vital physiological roles [32]. It is an important microbial metabolite, and its formation and composition are influenced by various environmental factors such as C/N, aeration pressure, salinity, sludge age, substrate types, and sludge age [33]. The content and composition of EPS in the biofilm of the MABR system under different lumen pressures is depicted in Figure 4. It can be observed that as the lumen pressure increased from 7 kPa to 16 kPa, the PN content in the MABR system progressively rose from 10.36 mg/g VSS to 25.68 mg/g VSS, and then significantly increased to 72.85 mg/g VSS. Similarly, the PN/PS in the MABR system increased slightly from 1.27 to 1.5, then leaped to 3.24. The results showed that under different lumen pressures, the change in PN was more significant than in PS, showing a more active response to the environment. This may be because when organic matter decreased in the MABR system, the biofilm secreted more EPS, especially PN, as a carbon source and energy for metabolism.
Li and Liu [34] also reported that lower influent loads in MABR systems could stimulate microbes in the biofilm to secrete more EPS, and high PN content enhanced the hydrophobicity of the biofilm. Previous studies have also shown that the increase in amino and carboxyl groups in proteins enhanced the hydrophobicity of the cell surface, which may help maintain substrate structure and stability [35,36]. Additionally, the high hydrophobicity of the cell surface facilitated the attachment of the biofilm to the hydrophobic MABR membrane material. It was indicated that the PN content in EPS in MABR biofilm systems was higher than the PS content, and PN played a crucial role in responding to changes in environmental conditions, consistent with previous studies on MABR biofilm [37]. According to the results shown in Figure 4, although the increment between the four lumen pressures was the same, the microbes experienced a greater environmental deviation when switching from 13 kPa to 16 kPa, resulting in a relatively large increase in PN content. However, this phenomenon was inconsistent with studies in conventional activated sludge and aerobic granular sludge systems, in which PS was more sensitive to environmental pressure [38]. A previous study found that the PN/PS ratios detected in the MABR are two-folds higher than those reported on sludge [39], which may be due to the unique stratified structure of the biofilm and the counter-diffusion of oxygen and pollutants in the MABR system [10].
To further characterize the properties of EPS under different lumen pressures, the three-dimensional fluorescence spectra of EPS are depicted in Figure 5. Five main peaks were identified in the spectra. Peak A represented soluble microbial by-products, including proteinoids with tryptophan, tyrosine, and PN, as well as tryptophan. Peaks B and C denoted humic-like substances, including hydrophobic amino acids, fulvic-like substances, and humic acid. Peak D represented aromatic PN substances. The peak intensities increased with the increase in lumen pressure, consistent with the PN content measured by the colorimetric method. The changes in EPS content and composition revealed the adaptation pattern of the MABR biofilm to lumen pressure. Furthermore, Zhang et al. also put forward their view that aromatic PN substances and tryptophan-like PN substances in EPS are biodegradable and can be reused by microorganisms as carbon sources and electron donors for denitrification [40].
FTIR was conducted to characterize the response of EPS functional groups to lumen pressure throughout the operation as shown in Figure 6. The main functional groups in extracellular polysaccharides of the biofilm include O-H, N-H, C=O, and C-O groups of PN and PS substances. The absorption peak in the vicinity of 3415/cm to 3440/cm in the EPS was caused by the stretching vibration of O-H or N-H in the extracellular polymers in the biofilm [37,41]. The absorption peaks near 1637/cm and 1648/cm were related to the stretching vibration of the C=O group in the presence of PN. The absorption peak near 1100/cm was related to the stretching vibration of C-O in PS and aromatic compounds. The peak at 600~621/cm indicated the presence of unsaturated bonds in the sample. However, the results suggested that the absorption peaks near 2931/cm and 2937/cm could be attributed to the transformation between isomers of PN or PS and the extension of C-H bonds [42]. The changes in the peak intensity of functional groups in EPS were consistent with the results of the colorimetric method, 3D-EEM, and the qualitative analysis. The results indicated that EPS had various functional groups and confirmed the existence of polysaccharides, proteins, lipids, and high-molecular-weight compounds in EPS. Under different lumen pressures, there was no significant change in the FTIR of biofilm EPS, indicating that the composition of EPS was stable.

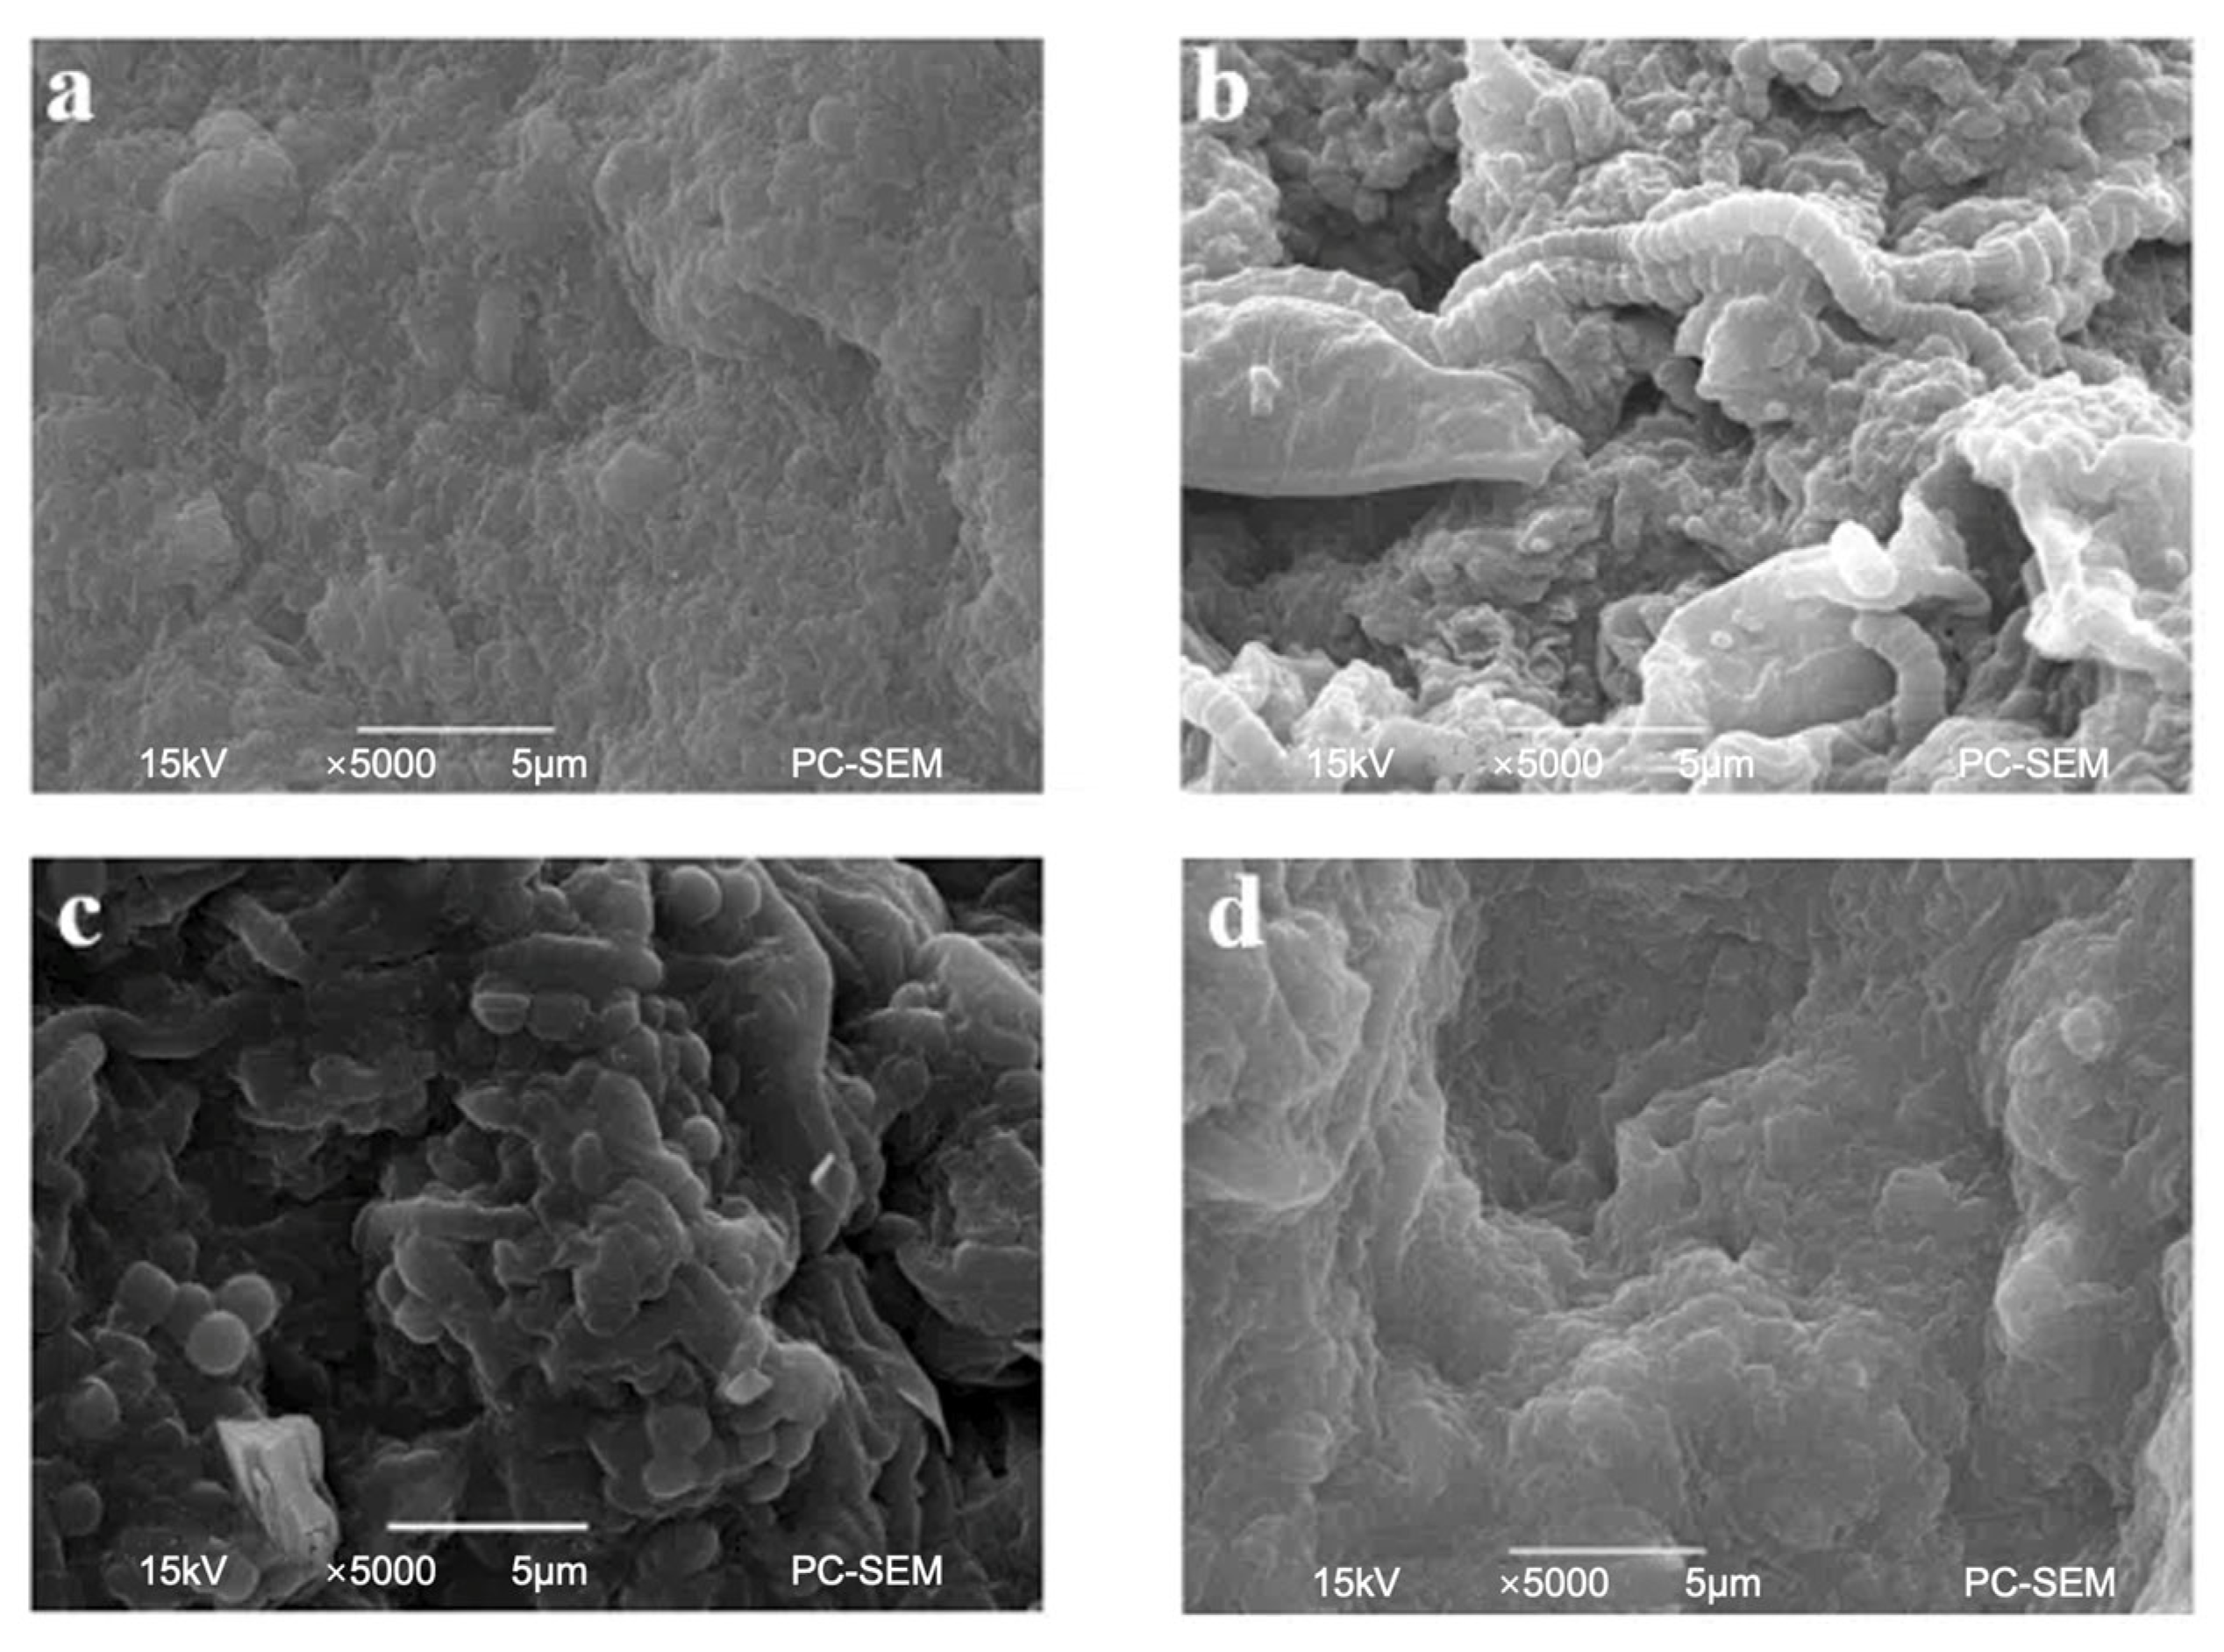
3.2.3. Biofilm Visualization

The SEM images of biofilm within the MABR system under different lumen pressures are shown in Figure 7. It was evident that these bacteria were clustered together. When the lumen pressures were 10 kPa and 13 kPa, there were numerous gaps between the bacteria clusters, favoring the transfer of nutrients and metabolic by-products. The SEM images also revealed that in the MABR system, the predominant bacteria were rod-shaped and spherical, which were the most common in biological wastewater treatment process. These bacteria interconnected with each other, eventually forming a complete biofilm. The microbial film within the MABR system became more compact under 16 kPa, possibly due to the encapsulation by EPS according to Section 3.2.2. The complexity of the biofilm structure could be due to the special counter-diffusion characteristic of MABR, which favors the stratification of the biofilm into distinct ecological niches [19]. Also, the lumen pressure could significantly impact microbial diversity and activity [9], which is also indicated by the different microbes’ morphology in SEM images in Figure 7. The lumen pressure should be adjusted to form biofilms with a structure that is neither too compact nor too tortuous to facilitate SND inside the biofilm, as bubbles and boundary layers would hinder mass transfer through the biofilm [43].

3.3. Microbial Diversity and Community Structure

3.3.1. Microbial Diversity

The α diversity can effectively reflect the abundance and diversity of microbial communities. When the similarity was 97%, the calculation of OUT yielded the results in Table 1. Samples P-1, P-2, P-3, and P-4 represented a lumen pressure of 7 kPa, 10 kPa, 13 kPa and 16 kPa, and obtained 39,828, 33,701, 48,391, and 34,641 valid sequences, respectively. Using the OTU clustering method, based on 97% similarity, effective sequences were obtained, resulting in 677, 656, 720, and 719 OTUs, respectively. The sequencing depth (Coverage) of the four samples was all greater than 99.7%, demonstrating the high quality of their sequencing. With the increase in lumen pressure, the Chao1 and ACE indices increased from 732.08 and 736.15 to 775.67 and 765.67, suggesting that a higher lumen pressure increased the abundance of the bacterial community. The Shannon index initially decreased from 4.69 to 4.59 when switching the lumen pressure from 7 kPa to 10 kPa, then increased to 5.02 with the increase in lumen pressure. As the decrease in the Simpson index was negatively related to the microbial diversity, the Simpson index’s decrease from 0.029 to 0.016 indicated that the diversity of the biofilm community in the MABR system increased with the increase in lumen pressure.
The microbial community’s similarity under different lumen pressures was depicted and analyzed using dilution curves, Venn diagrams, and principal component analysis (Figure 8). As shown in Figure 8a, the dilution curve flattened along the positive direction of the X-axis, confirming the rationality and reliability of the four measured samples. The Venn diagram confirmed the similarity and dissimilarity of microbial communities.
From Figure 8b, it can be seen that the number of the common OTUs was 457, accounting for 53.7% of all OTUs (851). The common OTUs indicated that in the MABR system, certain microorganisms were sustained in the reactor throughout the whole study, indicating a smaller response than the others. Additionally, the numbers of independent OTUs in samples P-1, P-2, P-3, and P-4 were 15, 36, 12, and 16, respectively, depicting the presence of a small number of unique microorganisms under different lumen pressures.
A shown in Figure 8c, Principal Component Analysis (PCA) was conducted to simplify the variables to identify the most influential ones. The results revealed significant differences in the microbial community within the MABR system under different lumen pressures. PC1 and PC2 represented 54.4% and 26.62% of the variables, respectively. Due to the close proximity between P-1 and P-3, their similarity was relatively high.

3.3.2. Microbial Community Structure

The microbial community structure at the phylum, class and genus levels was also investigated under different lumen pressures (Figure 9).
At the phylum level, Bacteroidetes, Chloroflexi, Planctomycetes, Proteobacteria, Candidatus-Saccharibacteria, Nitrospirae, Gemmatimonadetes, Firmicutes and Actinobacteria were identified in all four samples. Proteobacteria was the most dominant phylum, yet its relative abundance did not change accordingly with the change in lumen pressures. The optimal pressure for the growth of Proteobacteria was 10 kPa. For the relative abundance of Nitrospirae, it reached a maximum at 16 kPa (3.53%), indicating that increasing lumen pressure could promote its growth [44]. Moreover, its relative abundance was lowest (0.23%) when the lumen pressure was 7 kPa, and this may be the reason for the accumulation of nitrite in the reactor.
At the class level, β-proteobacteria was the most dominant group. When the lumen pressure increased from 7 kPa to 16 kPa, its relative abundance increased from 20.33% to 23.25% in general. However, the relative abundance decreased at 10 and 13 kPa lumen. β-proteobacteria contains highly efficient denitrifying bacteria, which play an important role in the denitrification process [45]. Other classes of Proteobacteria have also been found in the reactor. Both α-proteobacteria and ε-proteobacteria were enriched under 10 kPa, and the further increase in the lumen pressure inhibited their growth. On the contrary, the relative abundance of γ-proteobacteria increased with the increase in the lumen pressure, representing 5.23~8.05% of the microbial community. While the relative abundance of Bacteroidia changed little under different lumen pressures, the relative abundance of Actinobacteria and Gemmatimonadetes increased and then decreased.
About 60% of the total genera were not identified in the reactor, which was similar to the results of previous studies. This showed that there were still some unknown bacteria involved in the degradation of pollutants in the biofilm flora of MABR. Among the known genera, some dominant genera showed different changes under different lumen pressures. Nitrospira is a nitrite oxidizing bacterium, an aerobic autotrophic bacterium that plays an important role in the process of nitrogen removal [46]. Thauera and Hydrogenophaga showed opposite changes. The former is a typical denitrifying bacterium, and its abundance was 6.27% at 7 kPa. With the increase in the lumen pressure, its relative abundance increased and reached the maximum at 13 kPa. The latter is an anaerobic denitrification bacterium. With the increase in lumen pressure, its relative abundance decreased from 0.1% at 7 kPa to 0.03% at 16 kPa, indicating the increase in the lumen pressure inhibited the growth anaerobic denitrification microorganisms. The coexistence of the genera showed that there were multiple denitrification processes in the reactor.

4. Conclusions

MABR has shown obvious advantages over other traditional membrane technologies due to its special design with counter mass transfer. In this study, a laboratory-scale MABR was operated under different lumen pressures (7 kPa, 10 kPa, 13 kPa, and 16 kPa) to evaluate its impact on nitrogen removal, specifically to achieve SND. The results demonstrated that under 7 kPa, NH4+-N oxidation was hindered due to insufficient oxygen supply, while denitrification was inhibited under 16 kPa. Total nitrogen removal efficiency was similar under 10 kPa and 13 kPa (approximately 78.9%), significantly higher than that under 7 kPa and 16 kPa (approximately 50%). The highest biomass density (22.35 g/m2) and biofilm thickness (500.3 µm) were observed under 13 kPa, and EPS secretion increased with rising lumen pressure. The relative abundance of Nitrospirae peaked under 16 kPa (3.53%), suggesting that higher lumen pressure could enhance nitrification. Denitrifying-related microbes, such as β-proteobacteria, α-proteobacteria, and ε-proteobacteria, exhibited an increasing and then decreasing trend with increasing lumen pressure and were enriched at 10 kPa. The findings suggest that SND can be achieved at a moderate lumen pressure, specifically at 10 kPa and 13 kPa in this study.

Supplementary Materials

The following supporting information can be downloaded at: https://www.mdpi.com/article/10.3390/separations11080227/s1, Figure S1. The set-up of the lab-scale MABR system.

Author Contributions

H.Z.: Investigation, Data Analysis, Writing—Original Draft; Y.T.: Experiment Conduction, Data Analysis; M.W.: Methodology, Writing—Reviewing and Editing; L.D.: Organization, Supervision, Methodology, Writing—Reviewing and Editing. All authors have read and agreed to the published version of the manuscript.

Funding

Huiyun Zhong is supported by the Changzhou Leading Innovative Talents Introduction and Cultivation Project (CQ20210117). Liangfei Dong acknowledges the support of the Jiangsu Provincial Ecological Environment Research Project (Achievement Transformation and Promotion Project) (2022013).

Data Availability Statement

The original contributions presented in the study are included in the article/Supplementary Material, further inquiries can be directed to the corresponding author.

Conflicts of Interest

The authors declare no conflicts of interest.

References

  1. Priya, A.K.; Pachaiappan, R.; Kumar, P.S.; Jalil, A.A.; Vo, D.-V.N.; Rajendran, S. The war using microbes: A sustainable approach for wastewater management. Environ. Pollut. 2021, 275, 116598. [Google Scholar] [CrossRef]
  2. Anh-Vu, N.; Yun-Je, L.; Masumi, K.; Visvanathan, C. Effects of membrane relaxation rate on performance of pilot-scale membrane aerated biofilm reactors treating domestic wastewater. Environ. Res. 2022, 211, 113003. [Google Scholar] [CrossRef]
  3. Li, J.; Feng, M.; Zheng, S.; Zhao, W.; Xu, X.; Yu, X. The membrane aerated biofilm reactor for nitrogen removal of wastewater treatment: Principles, performances, and nitrous oxide emissions. Chem. Eng. J. 2023, 460, 141693. [Google Scholar] [CrossRef]
  4. Kabuba, J.; Lephallo, J.; Rutto, H. Comparison of various technologies used to eliminate nitrogen from wastewater: A review. J. Water Process Eng. 2022, 48, 102885. [Google Scholar] [CrossRef]
  5. Alsalhy, Q.F.; Al-Ani, F.H.; Al-Najar, A.E. A new Sponge-GAC-Sponge membrane module for submerged membrane bioreactor use in hospital wastewater treatment. Biochem. Eng. J. 2018, 133, 130–139. [Google Scholar] [CrossRef]
  6. Wang, X.J.; Xia, S.Q.; Chen, L.; Zhao, J.F.; Renault, N.J.; Chovelon, J.M. Nutrients removal from municipal wastewater by chemical precipitation in a moving bed biofilm reactor. Process Biochem. 2006, 41, 824–828. [Google Scholar] [CrossRef]
  7. He, H.; Wagner, B.; Carlson, A.; Yang, C.; Daigger, G. Recent progress using membrane aerated biofilm reactors for wastewater treatment. Water Sci. Technol. 2021, 84, 2131–2157. [Google Scholar] [CrossRef]
  8. Chen, Y.; Wang, J.; Zhao, Y.-G.; Maqbool, F.; Gao, M.; Guo, L.; Ji, J.; Zhao, X.; Zhang, M. Sulfamethoxazole removal from mariculture wastewater in moving bed biofilm reactor and insight into the changes of antibiotic and resistance genes. Chemosphere 2022, 298, 134327. [Google Scholar] [CrossRef]
  9. Xia, Z.; Ng, H.Y.; Xu, D.; Bae, S. Lumen air pressure regulated multifunctional microbiotas in membrane-aerated biofilm reactors for simultaneous nitrogen removal and antibiotic elimination from aquaculture wastewater. Water Res. 2024, 251, 121102. [Google Scholar] [CrossRef]
  10. Chang, M.; Liang, B.; Zhang, K.; Wang, Y.; Jin, D.; Zhang, Q.; Hao, L.; Zhu, T. Simultaneous shortcut nitrification and denitrification in a hybrid membrane aerated biofilms reactor (H-MBfR) for nitrogen removal from low COD/N wastewater. Water Res. 2022, 211, 118027. [Google Scholar] [CrossRef]
  11. Martin, K.J.; Picioreanu, C.; Nerenberg, R. Multidimensional modeling of biofilm development and fluid dynamics in a hydrogen-based, membrane biofilm reactor (MBfR). Water Res. 2013, 47, 4739–4751. [Google Scholar] [CrossRef] [PubMed]
  12. Martin, K.J.; Nerenberg, R. The membrane biofilm reactor (MBfR) for water and wastewater treatment: Principles, applications, and recent developments. Bioresour. Technol. 2012, 122, 83–94. [Google Scholar] [CrossRef] [PubMed]
  13. Nerenberg, R. The membrane-biofilm reactor (MBfR) as a counter-diffusional biofilm process. Curr. Opin. Biotechnol. 2016, 38, 131–136. [Google Scholar] [CrossRef]
  14. Zheng, P.; Li, Y.; Chi, Q.; Cheng, Y.; Jiang, X.; Chen, D.; Mu, Y.; Shen, J. Structural characteristics and microbial function of biofilm in membrane-aerated biofilm reactor for the biodegradation of volatile pyridine. J. Hazard. Mater. 2022, 437, 129370. [Google Scholar] [CrossRef] [PubMed]
  15. He, H.; Daigger, G.T. The hybrid MABR process achieves intensified nitrogen removal while N2O emissions remain low. Water Res. 2023, 244, 120458. [Google Scholar] [CrossRef] [PubMed]
  16. Wei, X.; Li, B.; Zhao, S.; Qiang, C.C.; Zhang, H.; Wang, S.-C. COD and nitrogen removal in facilitated transfer membrane-aerated biofilm reactor (FT-MABR). J. Membr. Sci. 2012, 389, 257–264. [Google Scholar] [CrossRef]
  17. Chen, R.; Cao, S.; Zhang, L.; Zhou, Y. NOB suppression strategies in a mainstream membrane aerated biofilm reactor under exceptionally low lumen pressure. Chemosphere 2022, 290, 133386. [Google Scholar] [CrossRef]
  18. Zhou, Y.; Li, R.; Guo, B.; Yu, N.; Xia, S.; Liu, Y. Lumen air pressure (LAP) affecting greywater treatment in an oxygen-based membrane biofilm reactor (O2-MBfR). Chemosphere 2021, 270, 129541. [Google Scholar] [CrossRef] [PubMed]
  19. Zhou, Y.; Li, R.; Guo, B.; Zhang, L.; Zou, X.; Xia, S.; Liu, Y. Greywater treatment using an oxygen-based membrane biofilm reactor: Formation of dynamic multifunctional biofilm for organics and nitrogen removal. Chem. Eng. J. 2020, 386, 123989. [Google Scholar] [CrossRef]
  20. Li, J.; Wang, Z.; Wang, Y. Integrating membrane aerated biofilm reactors with biological nitrogen removal processes: A new paradigm for achieving sustainable wastewater treatment plants. Chem. Eng. J. 2023, 475, 146025. [Google Scholar] [CrossRef]
  21. APHA. Standard Methods for the Examination of Water and Wastewater, 19th ed.; American Public Health Association: Washington, DC, USA, 1995. [Google Scholar]
  22. Celmer, D.; Oleszkiewicz, J.A.; Cicek, N. Impact of shear force on the biofilm structure and performance of a membrane biofilm reactor for tertiary hydrogen-driven denitrification of municipal wastewater. Water Res. 2008, 42, 3057–3065. [Google Scholar] [CrossRef] [PubMed]
  23. Lai, C.-Y.; Dong, Q.-Y.; Chen, J.-X.; Zhu, Q.-S.; Yang, X.; Chen, W.-D.; Zhao, H.-P.; Zhu, L. Role of Extracellular Polymeric Substances in a Methane Based Membrane Biofilm Reactor Reducing Vanadate. Environ. Sci. Technol. 2018, 52, 10680–10688. [Google Scholar] [CrossRef] [PubMed]
  24. Herbert, D.; Phipps, P.J.; Strange, R.E. Chapter III Chemical Analysis of Microbial Cells. In Methods Microbiology; Norris, J.R., Ribbons, D.W., Eds.; Academic Press: Cambridge, MA, USA, 1971; pp. 209–344. [Google Scholar]
  25. Pierce, J.; Suelter, C.H. An evaluation of the Coomassie brilliant blue G-250 dye-binding method for quantitative protein determination. Anal. Biochem. 1977, 81, 478–480. [Google Scholar] [CrossRef] [PubMed]
  26. Rajakaruna, H.; Drake, D.A.R.; Chan, F.T.; Bailey, S.A. Optimizing performance of nonparametric species richness estimators under constrained sampling. Ecol. Evol. 2016, 6, 7311–7322. [Google Scholar] [CrossRef] [PubMed]
  27. Zaman, M.; Kim, M.; Nakhla, G. Simultaneous partial nitrification and denitrifying phosphorus removal (PNDPR) in a sequencing batch reactor process operated at low DO and high SRT for carbon and energy reduction. Chem. Eng. J. 2021, 425, 131881. [Google Scholar] [CrossRef]
  28. Wang, L.; Zhang, C.; Kang, X.; Liu, Y.; Qiu, Y.; Wanyan, D.; Liu, J.; Cheng, G.; Huang, X. Establishing mainstream partial nitrification in the membrane aerated biofilm reactor by limiting the oxygen concentration in the biofilm. Water Res. 2024, 261, 121984. [Google Scholar] [CrossRef] [PubMed]
  29. Pellicer-Nacher, C.; Sun, S.; Lackner, S.; Terada, A.; Schreiber, F.; Zhou, Q.; Smets, B.F. Sequential Aeration of Membrane-Aerated Biofilm Reactors for High-Rate Autotrophic Nitrogen Removal: Experimental Demonstration. Environ. Sci. Technol. 2010, 44, 7628–7634. [Google Scholar] [CrossRef]
  30. Sun, Z.; Li, Y.; Liu, J.; Li, T.; Cao, X.; Li, B. Performance and mechanism of the synergistic hexavalent chromium and nitrogen removal in a MABR system. Chem. Eng. J. 2023, 478, 147433. [Google Scholar] [CrossRef]
  31. Perez-Calleja, P.; Aybar, M.; Picioreanu, C.; Esteban-Garcia, A.L.; Martin, K.J.; Nerenberg, R. Periodic venting of MABR lumen allows high removal rates and high gas-transfer efficiencies. Water Res. 2017, 121, 349–360. [Google Scholar] [CrossRef]
  32. Song, W.; Kim, C.; Lee, J.; Han, J.; Jiang, Z.; Kim, J.; An, S.; Park, Y.; Kweon, J. Low-biofouling membrane bioreactor: Effects of cis-2-Decenoic acid addition on EPS and biofouling mitigation. Chemosphere 2024, 358, 142110. [Google Scholar] [CrossRef]
  33. Zhong, H.; Dong, L.; Tang, Y.; Qi, L.; Wang, M. The C/N Ratio’s Effect on a Membrane-Aerated Biofilm Reactor (MABR): COD and Nitrogen Removal, Biofilm Characteristics, and Microbial Community Structure. Water 2023, 15, 4298. [Google Scholar] [CrossRef]
  34. Li, T.; Liu, J. Rapid formation of biofilm grown on gas-permeable membrane induced by famine incubation. Biochem. Eng. J. 2017, 121, 156–162. [Google Scholar] [CrossRef]
  35. Rene, E.R.; Kim, S.J.; Park, H.S. Effect of COD/N ratio and salinity on the performance of sequencing batch reactors. Bioresour. Technol. 2008, 99, 839–846. [Google Scholar] [CrossRef] [PubMed]
  36. Han, F.; Zhang, M.; Liu, Z.; Shang, H.; Li, Q.; Zhou, W. Dynamic characteristics of microbial community and soluble microbial products in partial nitrification biofilm system developed from marine sediments treating high salinity wastewater. J. Environ. Manag. 2021, 290, 112586. [Google Scholar] [CrossRef] [PubMed]
  37. Pellicer-Nàcher, C.; Smets, B.F. Structure, composition, and strength of nitrifying membrane-aerated biofilms. Water Res. 2014, 57, 151–161. [Google Scholar] [CrossRef] [PubMed]
  38. He, Q.; Chen, L.; Zhang, S.; Chen, R.; Wang, H. Hydrodynamic shear force shaped the microbial community and function in the aerobic granular sequencing batch reactors for low carbon to nitrogen (C/N) municipal wastewater treatment. Bioresour. Technol. 2019, 271, 48–58. [Google Scholar] [CrossRef] [PubMed]
  39. Sanchez-Huerta, C.; Medina, J.S.; Wang, C.; Fortunato, L.; Hong, P.-Y. Understanding the role of sorption and biodegradation in the removal of organic micropollutants by membrane aerated biofilm reactor (MABR) with different biofilm thickness. Water Res. 2023, 236, 119935. [Google Scholar] [CrossRef] [PubMed]
  40. Zhang, X.; Sun, Y.; Ma, F.; Li, A.; Zhao, H.P.; Wang, A.; Yang, J. In-situ utilization of soluble microbial product (SMP) cooperated with enhancing SMP-dependent denitrification in aerobic-anoxic sequencing batch reactor. Sci. Total Environ. 2019, 693, 133558. [Google Scholar] [CrossRef] [PubMed]
  41. Liang, Z.; Li, W.; Yang, S.; Du, P. Extraction and structural characteristics of extracellular polymeric substances (EPS), pellets in autotrophic nitrifying biofilm and activated sludge. Chemosphere 2010, 81, 626–632. [Google Scholar] [CrossRef]
  42. Wang, Z.; Gao, M.; Wang, Z.; She, Z.; Chang, Q.; Sun, C.; Zhang, J.; Ren, Y.; Yang, N. Effect of salinity on extracellular polymeric substances of activated sludge from an anoxic-aerobic sequencing batch reactor. Chemosphere 2013, 93, 2789–2795. [Google Scholar] [CrossRef]
  43. Mason, P.M.; Stuckey, D.C. Biofilms, bubbles and boundary layers—A new approach to understanding cellulolysis in anaerobic and ruminant digestion. Water Res. 2016, 104, 93–100. [Google Scholar] [CrossRef] [PubMed]
  44. Guadie, A.; Xia, S.; Zhang, Z.; Zeleke, J.; Guo, W.; Ngo, H.H.; Hermanowicz, S.W. Effect of intermittent aeration cycle on nutrient removal and microbial community in a fluidized bed reactor-membrane bioreactor combo system. Bioresour. Technol. 2014, 156, 195–205. [Google Scholar] [CrossRef] [PubMed]
  45. Hao, R.; Li, S.; Li, J.; Meng, C. Denitrification of simulated municipal wastewater treatment plant effluent using a three-dimensional biofilm-electrode reactor: Operating performance and bacterial community. Bioresour. Technol. 2013, 143, 178–186. [Google Scholar] [CrossRef] [PubMed]
  46. Chisholm, C.; Di, H.; Cameron, K.; Podolyan, A.; Shen, J.; Zhang, L.; Sirisena, K.; Godsoe, W. Contrasting response of comammox Nitrospira, ammonia oxidising bacteria, and archaea to soil pH and nitrogen inputs. Sci. Total Environ. 2024, 924, 171627. [Google Scholar] [CrossRef]
Figure 1. Water quality of the batch tests under different lumen pressures ((a) DO; (b) COD; (c) NH4+-N; (d) NO2-N; (e) NO3-N; (f) TN).
Separations 11 00227 g001
Figure 2. Water quality and the corresponding removal efficiencies of the long-term tests under different lumen pressures ((a) DO; (b) COD; (c) NH4+-N; (d) NO2-N & NO3-N; (e) TN).
Separations 11 00227 g002
Figure 3. The biomass density and biofilm thickness of the biofilm on fiber surfaces under different lumen pressures.
Separations 11 00227 g003
Figure 4. The PS, PN and PN/PS of the biofilm EPS under different lumen pressures.
Separations 11 00227 g004
Figure 5. Three-dimensional fluorescence diagram of EPS in MABR system under different lumen pressures ((a) 7 kPa; (b) 10 kPa; (c) 13 kPa; (d) 16 kPa).
Separations 11 00227 g005
Figure 6. Infrared spectrum of the EPS under different lumen pressures (a. 7 kPa; b. 10 kPa; c. 13 kPa; d. 16 kPa).
Separations 11 00227 g006
Figure 7. SEM images of the biofilms on fiber surfaces under different lumen pressures ((a) 7 kPa; (b) 10 kPa; (c) 13 kPa; (d) 16 kPa).
Separations 11 00227 g007
Figure 8. Similarity analysis of microbial community under different lumen pressures ((a) dilution curve; (b) Venn diagram; (c) principal component analysis).
Separations 11 00227 g008
Figure 9. Microbial community analysis under different lumen pressures ((a) phylum; (b) class; (c) genus).
Separations 11 00227 g009
Table 1. Microbial community α Diversity index.
Sample No.Lumen Pressure (kPa)Sequences NumberOTUsShannonSimpsonChao1ACECoverage
P-1739,8286774.690.029732.08736.150.998
P-21033,7016564.590.027745.79742.910.997
P-31348,3917204.860.019763.89763.770.998
P-41634,6417195.020.016775.67765.670.998
Disclaimer/Publisher’s Note: The statements, opinions and data contained in all publications are solely those of the individual author(s) and contributor(s) and not of MDPI and/or the editor(s). MDPI and/or the editor(s) disclaim responsibility for any injury to people or property resulting from any ideas, methods, instructions or products referred to in the content.

