
The Development and Validation of an LC–Orbitrap–HRMS Method for the Analysis of Four Tetracyclines in Milk and Its Application to Determine Oxytetracycline Concentrations after Intramuscular Administration in Healthy Sarda Ewes and Those Naturally Infected with Streptococcus uberis

 , ,
, , 
Abstract
:1. Introduction
- -
- It allows the effective removal of sample impurities, a critical step for the accurate and sensitive detection of tetracyclines;
- -
- It entails a reduced use of organic solvents compared to LLE, which translates into greater respect for the environment and a reduction in costs;
- -
- The high efficiency and selectivity of SPE cartridges such as Oasis HLB provide high recovery rates and reliable results;
- -
- It has high reproducibility, which makes it suitable for routine analyses in laboratories, as demonstrated by applying the method to the analysis of over 400 milk samples as part of a research project aimed at studying the pharmacokinetics/dynamics (PK/PD) of OTC in milk from healthy and infected half udders of dairy ewes after antibiotic administration.
2. Materials and Methods
2.1. Reagents and Materials
2.2. Standard Working Solutions
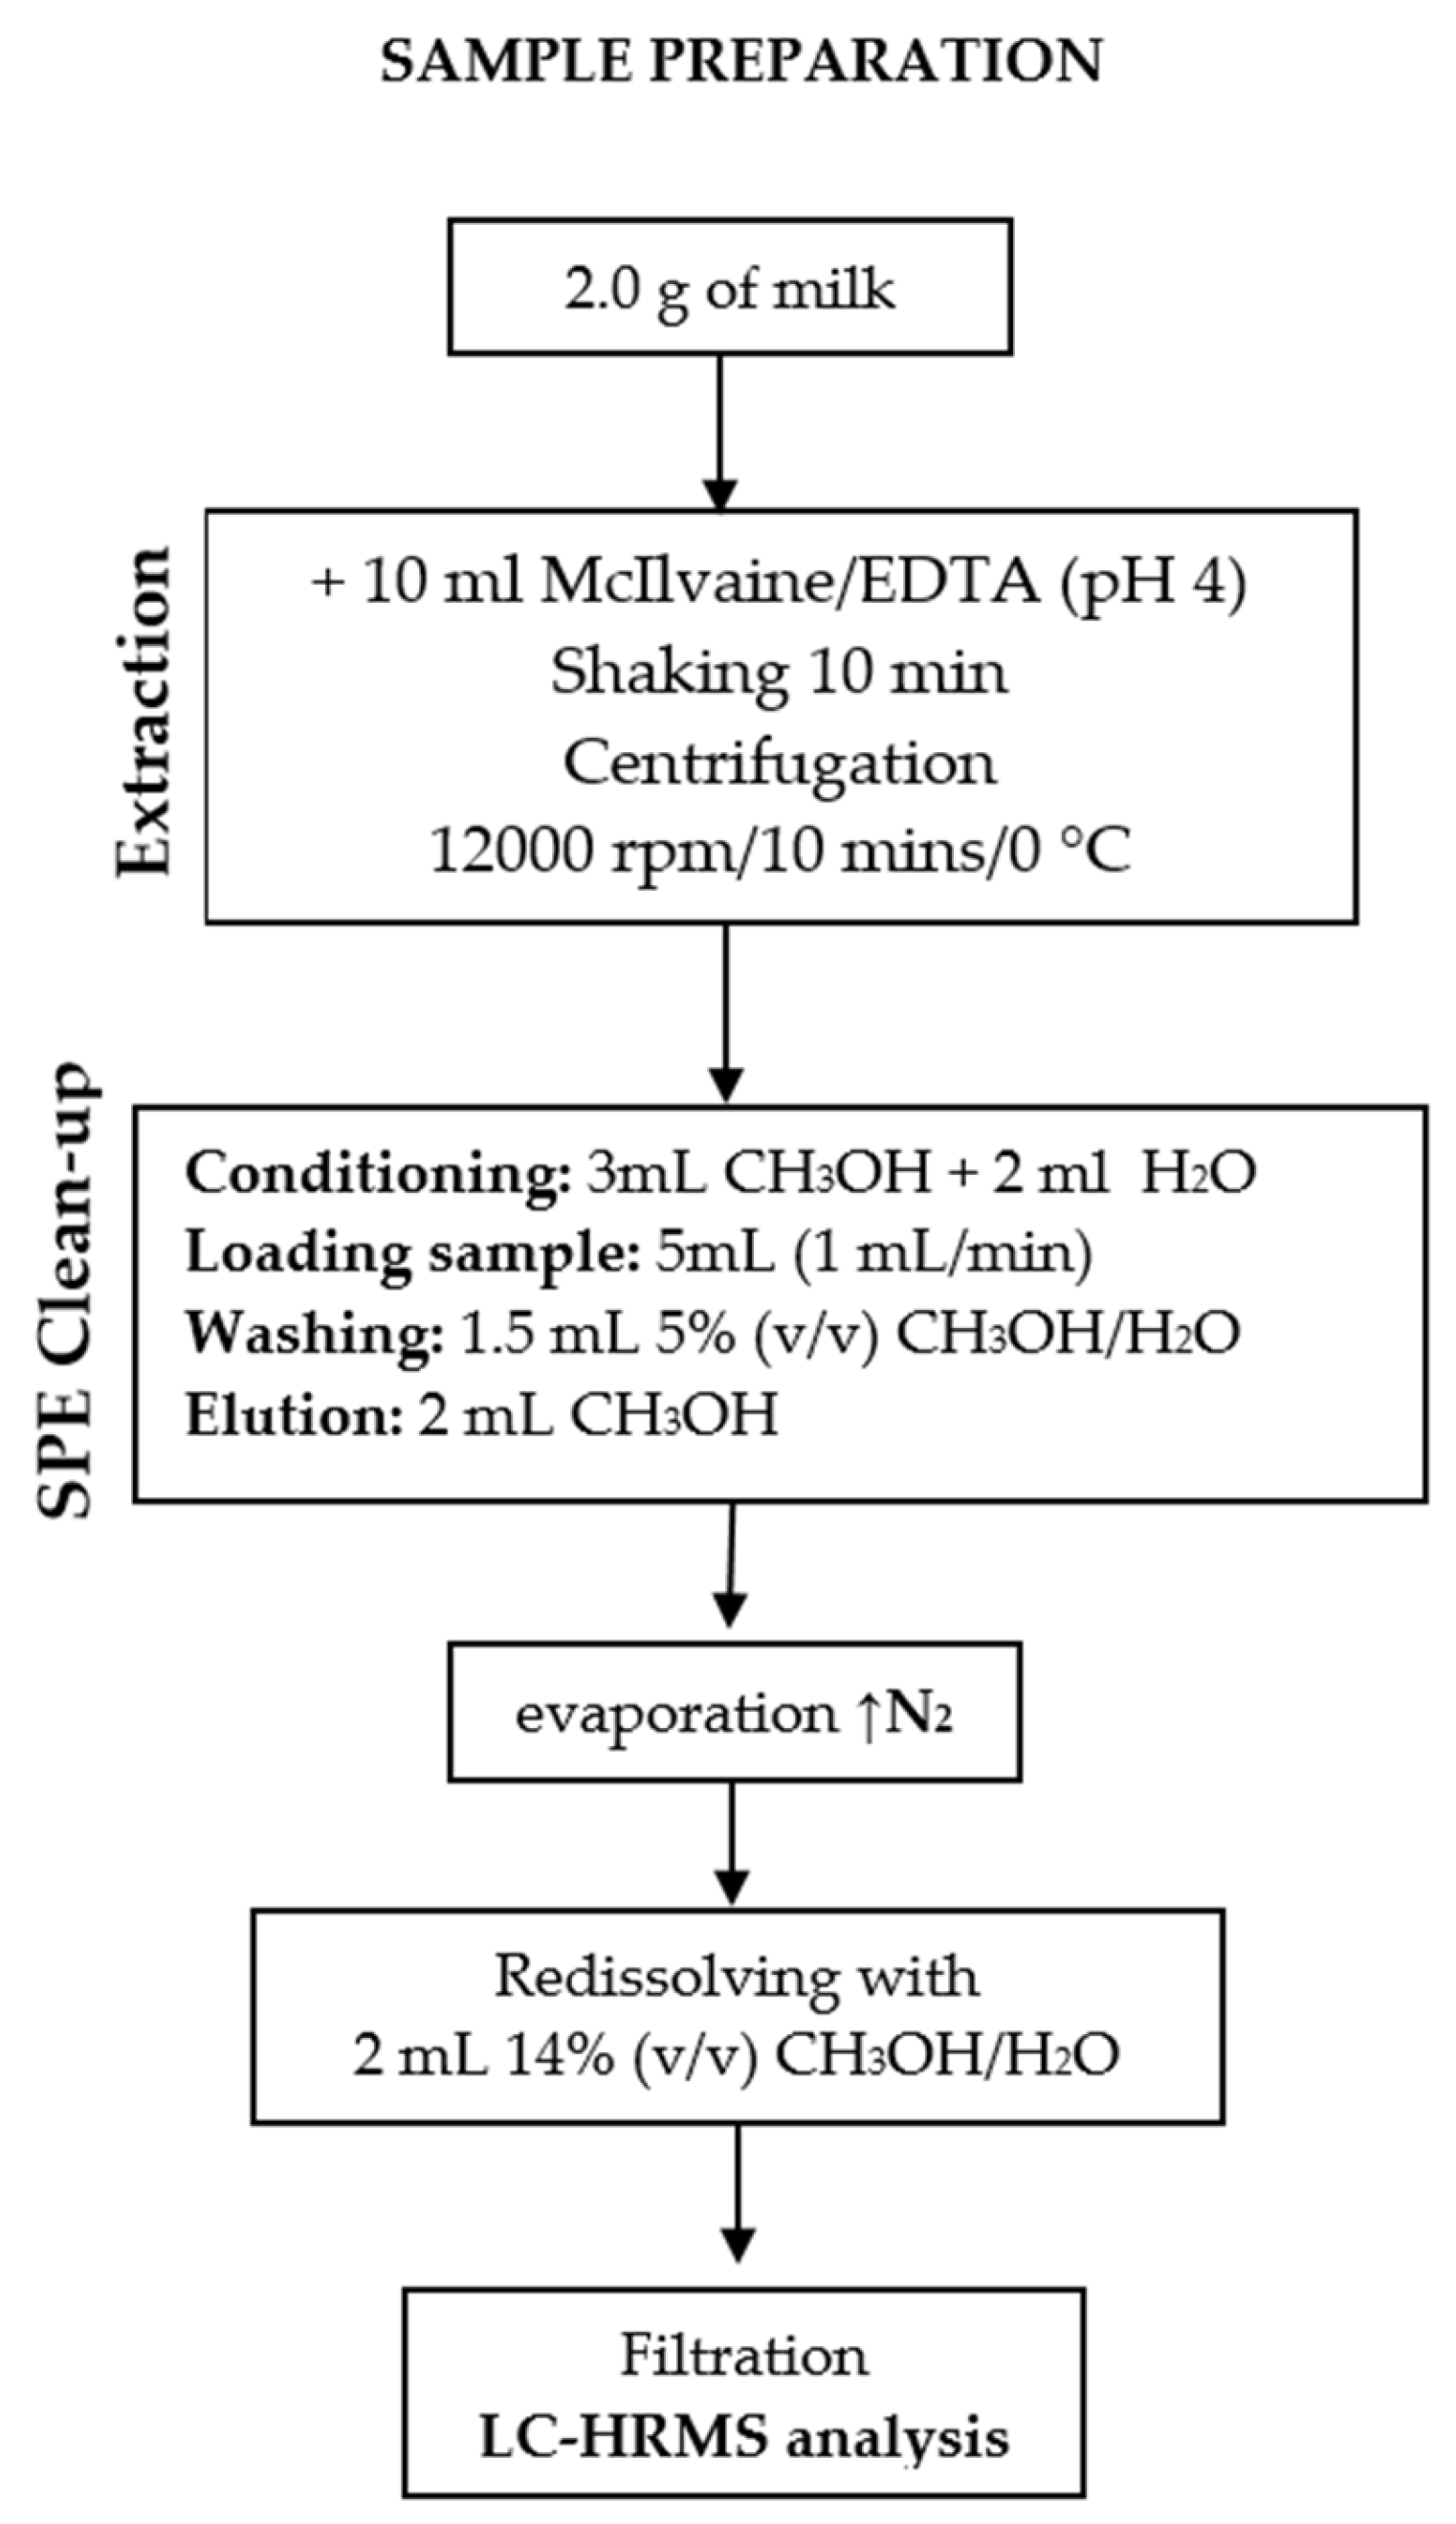
2.3. Sample Preparation
2.4. Chromatographic and Spectrometric Conditions
2.5. Experimental Design of Method Validation
2.6. Method Application
3. Results
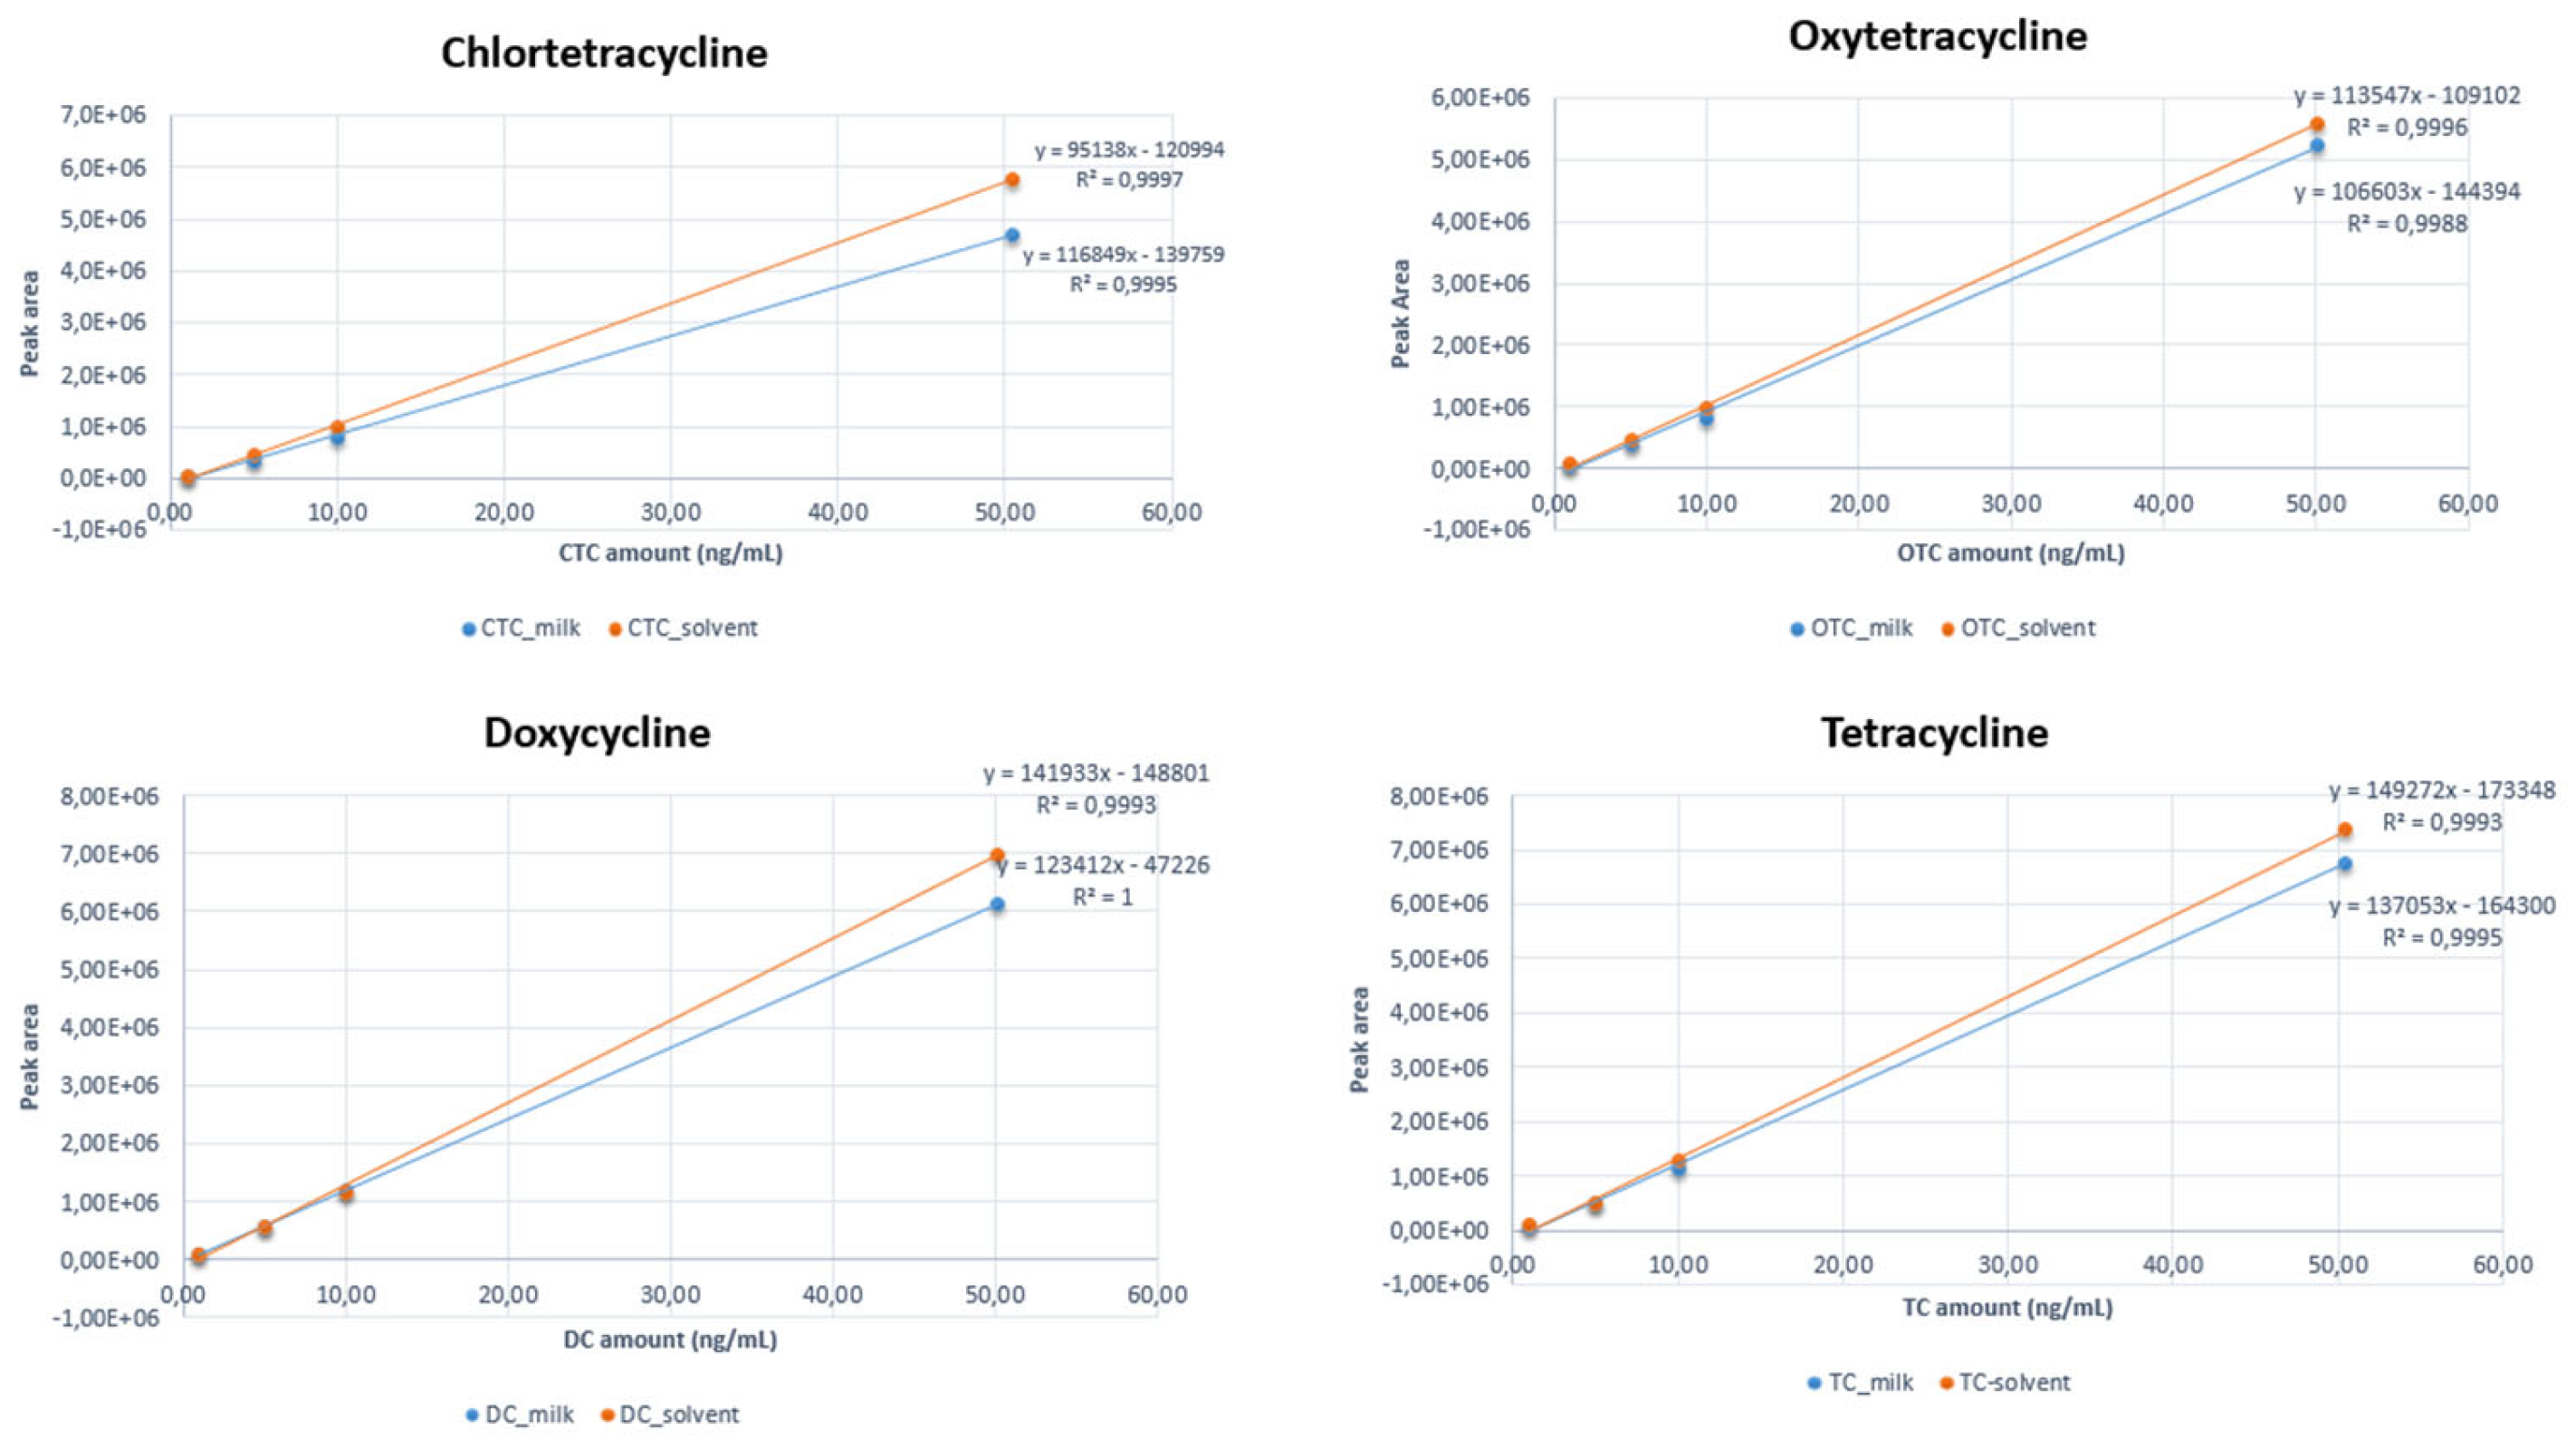
3.1. Linearity
3.2. Selectivity
3.3. Precision
3.4. Trueness
3.5. Limit of Detection (LOD) and Limit of Quantification (LOQ)
3.6. Detection Limit (CCα) and Detection Capability (CCβ)
3.7. Matrix Effect (ME)
3.8. Monitoring Quality Assurance
3.9. Method Application: OTC Determination in Sheep Milk
4. Discussion
4.1. Optimization of Sample Treatment and Instrumental Analysis
- Removal of potential interferences;
- Concentration of the analytes.
4.2. OTC Concentration in Milk
5. Conclusions
Author Contributions
Funding
Data Availability Statement
Conflicts of Interest
References
- US FDA. #209 Guidance for Industry, The Judicious Use of Medically Important Antimicrobial Drugs in Food-Producing Animals. Available online: https://www.fda.gov/downloads/AnimalVeterinary/GuidanceComplianceEnforcement/GuidanceforIndustry/UCM216936.pdf (accessed on 14 February 2024).
- Barbarossa, A.; Rambaldi, J.; Miraglia, V.; Giunti, M.; Diegoli, G.; Zaghini, A. Survey on antimicrobial prescribing patterns in small animal veterinary practice in Emilia Romagna, Italy. Vet. Rec. 2017, 181, 69. [Google Scholar] [CrossRef] [PubMed]
- Richards, E.D.; Martin, K.L.; Donnell, C.E.; Clapham, M.O.; Tell, L.A. Antibacterial Drug Residues in Small Ruminant Edible Tissues and Milk: A Literature Review of Commonly Used Medications in Small Ruminants. Animals 2022, 12, 2607. [Google Scholar] [CrossRef] [PubMed]
- Li, J.H.; Yousif, M.H.; Li, Z.Q.; Wu, Z.H.; Li, S.L.; Yang, H.J.; Wang, Y.J.; Cao, Z.J. Effects of antibiotic residues in milk on growth, ruminal fermentation, and microbial community of preweaning dairy calves. J. Dairy Sci. 2019, 102, 2298–2307. [Google Scholar] [CrossRef] [PubMed]
- Cramer, G.; Solano, L.; Johnson, R. Evaluation of tetracycline in milk following extra-label administration of topical tetracycline for digital dermatitis in dairy cattle. J. Dairy Sci. 2019, 102, 883–895. [Google Scholar] [CrossRef] [PubMed]
- De Liguoro, M.; Cibin, V.; Capolongo, F.; Halling-Sørensen, B.; Montesiss, C. Use of oxytetracycline and tylosin in intensive calf farming: Evaluation of transfer to manure and soil. Chemosphere 2003, 52, 203–212. [Google Scholar] [CrossRef] [PubMed]
- Kools, S.A.E.; Moltmann, J.F.; Knacker, T. Estimating the use of veterinary medicines in the European union. Regul. Toxicol. Pharmacol. 2008, 50, 59–65. [Google Scholar] [CrossRef] [PubMed]
- Michalova, E.; Novotna, P.; Schlegelova, J. Tetracyclines in veterinary medicine and bacteria resistance to them. Vet. Med.-Czech 2004, 49, 79–100. [Google Scholar] [CrossRef]
- Plachouras, D.; Antoniadou, A.; Giannitsioti, E.; Galani, L.; Katsarolis, I.; Kavatha, D.; Koukos, G.; Panagopoulos, P.; Papadopoulos, A.; Poulakou, G.; et al. Promoting prudent use of antibiotics: The experience from a multifaceted regional campaign in Greece. BMC Public Health 2014, 14, 866. [Google Scholar] [CrossRef] [PubMed]
- European Commission. Regulation (EC) No 470/2009 of the European Parliament and of the Council of 6 May 2009. Laying down Community Procedures for the Establishment of Residue Limits of Pharmacologically Active Substances in Foodstuffs of Animal Origin, Repealing Council Regulation (EEC) No 2377/90 and Amending Directive 2001/82/EC of the European Parliament and of the Council and Regulation (EC) No 726/2004 of the European Parliament and of the Council. Available online: http://eur-lex.europa.eu/LexUriServ/LexUriServ.do?uri=OJ:L:2009:152:0011:0022:en:PDF (accessed on 14 February 2024).
- Commission Regulation (EU) No 37/2010 of 22 December 2009 on Pharmacologically Active Substances and Their Classification Regarding Maximum Residue Limits in Foodstuffs of Animal Origin. Off. J. Eur. Union 2010, 15, 1–72. Available online: https://data.europa.eu/eli/reg/2010/37(1)/oj (accessed on 14 February 2024).
- Commission Decision 2002/657/EC implementing Council Directive 96/23/EC concerning the performances of analytical methods and the interpretation of results, Official Journal of the European Communities, No L 221, 17/08/2002, Decision of 12 August 2002, European Commission, Directorate General for Public Health and Consumers Protection, available online. Available online: https://eur-lex.europa.eu/eli/dec/2002/657/oj (accessed on 14 February 2024).
- Chen, Y.; Kong, D.; Liu, L.; Song, S.; Kuang, H.; Xu, C. Development of an ELISA and Immunochromatographic Assay for Tetracycline, Oxytetracycline, and Chlortetracycline Residues in Milk and Honey Based on the Class-Specific Monoclonal Antibody. Food Anal. Methods 2015, 9, 905–914. [Google Scholar] [CrossRef]
- Zhou, C.; Deng, J.; Shi, G.; Zhou, T. β-cyclodextrin-ionic liquid polymer based dynamically coating for simultaneous determination of tetracyclines by capillary electrophoresis. Electrophoresis 2017, 38, 1060–1067. [Google Scholar] [CrossRef]
- Pérez Rodríguez, M.; Redigolo Pezza, H.; Pezza, L. Simple and clean determination of tetracyclines by flow injection analysis. Spectrochim. Acta Part A Mol. Biomol. Spectrosc. 2016, 153, 386–392. [Google Scholar] [CrossRef] [PubMed]
- Pérez-Rodríguez, M.; Pellerano, R.G.; Pezza, L.; Redigolo Pezza, H. An overview of the main foodstuff sample preparation technologies for tetracycline residue determination. Talanta 2018, 182, 1–21. [Google Scholar] [CrossRef]
- Gondovà, Z.; Kožárová, I.; Polàkovà, Z.; Madàrovà, M. Comparison of four microbiological inhibition tests for the screening of antimicrobial residues in the tissues of food producing animals. Ital. J. Anim. Sci. 2014, 13, 3521. [Google Scholar] [CrossRef]
- Pikkemaat, M.G.; Rapallini, M.L.B.A.; Dijk, S.O.-V.; Elferink, J.W.A. Comparison of three microbial screening methods for antibiotics using routine monitoring samples. Anal. Chim. Acta 2009, 637, 298–304. [Google Scholar] [CrossRef]
- Patyra, E.; Kowalczyk, E.; Kwiatek, K. Screening method for the determination of selected tetracyclines in water by liquid chromatography with diode array detector. Bull. Vet. Inst. Pulawy 2014, 58, 65–70. [Google Scholar] [CrossRef]
- Cháfer-Pericás, C.; Maquieira, Á.; Puchades, R.; Miralles, J.; Moreno, A. Multiresidue determination of antibiotics in feed and fish samples for food safety evaluation. Comparison of immunoassay vs LC-MS-MS. Food Control. 2011, 22, 993–999. [Google Scholar] [CrossRef]
- Garcia-Fernandez, J.; Trapiella-Alfonso, L.; Costa-Fernandez, J.M.; Pereiro, R.; Sanz-Medel, A. A quantum dot-based immunoassay for screening of tetracyclines in bovine muscle. J. Agric. Food Chem. 2014, 62, 1733–1740. [Google Scholar] [CrossRef]
- Zhou, H.; Cao, Y.-M.; Miao, S.; Lan, L.; Chen, M.; Li, W.-T.; Mao, X.-H.; Ji, S. Qualitative screening and quantitative determination of 569 pesticide residues in honeysuckle using ultrahigh-performance liquid chromatography coupled to quadrupole-Orbitrap high resolution mass spectrometry. J. Chromatogr. A 2019, 1606, 460374. [Google Scholar] [CrossRef]
- Siddiqui, M.R.; AlOthman, Z.A.; Rahman, N. Analytical techniques in pharmaceutical analysis: A review. Arab. J. Chem. 2017, 10, 1409–1421. [Google Scholar] [CrossRef]
- Chiesa, L.; Nobile, M.; Arioli, F.; Britti, D.; Trutic, N.; Pavlovic, R.; Panseri, S. Determination of veterinary antibiotics in bovine urine by liquid chromatography–tandem mass spectrometry. Food Chem. 2015, 185, 7–15. [Google Scholar] [CrossRef] [PubMed]
- Jia, A.; Xiao, Y.; Hu, J.; Asami, M.; Kunikane, S. Simultaneous determination of tetracyclines and their degradation products in environmental waters by liquid chromatography–electrospray tandem mass spectrometry. J. Chromatogr. A 2009, 1216, 4655–4662. [Google Scholar] [CrossRef] [PubMed]
- Goto, T.; Ito, Y.; Yamada, S.; Matsumoto, H.; Oka, H. High-throughput analysis of tetracycline and penicillin antibiotics in animal tissues using electrospray tandem mass spectrometry with selected reaction monitoring transition. J. Chromatogr. A 2005, 1100, 193–199. [Google Scholar] [CrossRef] [PubMed]
- Yang, S.; Cha, J.; Carlson, K. Simultaneous extraction and analysis of 11 tetracycline and sulfonamide antibiotics in influent and effluent domestic wastewater by solid-phase extraction and liquid chromatography-electrospray ionization tandem mass spectrometry. J. Chromatogr. A 2005, 1097, 40–53. [Google Scholar] [CrossRef] [PubMed]
- Chiesa, L.; Panseri, S.; Pasquale, E.; Malandra, R.; Pavlovic, R.; Arioli, F. Validated multiclass targeted determination of antibiotics in fish with high performance liquid chromatography–benchtop quadrupole orbitrap hybrid mass spectrometry. Food Chem. 2018, 258, 222–230. [Google Scholar] [CrossRef] [PubMed]
- Rocha, G.L.; Alves, S.F.; Ribeiro, S.R.A.C.; Fernandes, C.; Silva, H.M.L.; Gloria, A.M.B. Quinolones and tetracyclines in aquaculture fish by a simple and rapid LC-MS/MS method. Food Chem. 2018, 245, 1232–1238. [Google Scholar] [CrossRef]
- Yao, T.; Song, J.; Zhou, C.; Shi, X. Recent progress of the applications of functionalized magnetic ionic liquids in sample pretreatment. Sep. Purif. Technol. 2024, 341, 126979. [Google Scholar] [CrossRef]
- Yao, T.; Li, H.; Ren, Y.; Feng, M.; Hu, Y.; Yan, H.; Peng, L. Extraction and recovery of phenolic compounds from aqueous solution by thermo-separating magnetic ionic liquid aqueous two-phase system. Sep. Purif. Technol. Part B 2022, 282, 120034. [Google Scholar] [CrossRef]
- Yao, T.; Feng, C.; Chen, W.; Chen, S. Selective separation and simultaneous recoveries of amino acids by temperature-sensitive magnetic ionic liquid aqueous biphasic system. J. Mol. Liq. 2023, 371, 121099. [Google Scholar] [CrossRef]
- Miller, J.N.; Miller, J.C. Calibration methods in instrumental analysis: Regression and correlation. Stat. Chemom. Anal. Chem. Pearson Ed. 2010, 6, 110–153. [Google Scholar]
- Ridgway, K.; Lalljie, S.P.D.; Smith, R.M. Sample preparation techniques for the determination of trace residues and contaminants in foods. J. Chromatogr. A 2007, 1153, 36–53. [Google Scholar] [CrossRef] [PubMed]
- Ziv, G.; Sulman, F.G. Binding of Antibiotics to Bovine and Ovine Serum. Antimicrob. Agents Chemother. 1972, 2, 206–213. [Google Scholar] [CrossRef] [PubMed]


| Analyte | Chemical Formula | RT | Exact Mass | Ion Transitions | NCE |
|---|---|---|---|---|---|
| (min) | [MH] + (m/z) | (eV) | |||
| Oxytetracycline (OTC) | C22H24N2O9 | 4.94 | 461.1555 | 426.1183 | 30 |
| 381.0605 | |||||
| 337.0707 | |||||
| Doxycycline (DC) | C22H24N2O8 | 6.56 | 445.1605 | 428.1340 | 30 |
| 410.1234 | |||||
| 154.0498 | |||||
| Tetracycline (TC) | C22H24N2O8 | 5.20 | 445.1605 | 410.1234 | 30 |
| 337.0703 | |||||
| 154.0498 | |||||
| Chlortetracycline (CTC) | C22H23N2O8Cl | 6.23 | 479.1216 | 444.0485 | 26 |
| 371.0317 | |||||
| 154.0498 |
| Validation series 1 | 6 batches for selectivity and fortification: 24 milk samples |
| (quantification with standard calibration) | |
| Validation series 2 | 6 batches for selectivity and fortification: 24 milk samples |
| (quantification with standard calibration) | |
| Validation series 3 | 6 batches for selectivity and fortification: 24 milk samples |
| (quantification with standard calibration) | |
| Validation series 4 | 20 batches, 20 milk samples |
| (for absolute recovery and relative matrix effect) |
| Validation | Fortification Level | N of Experiments | Performance Characteristic |
|---|---|---|---|
| Standard solution points | Five different levels | 5 | Linearity range |
| 1 aliquot of 6 different blank batches | No fortification | 6 | selectivity |
| 1 aliquot of 6 different blank batches | Level 1 | 6 | CCα, CCβ, trueness, intraday repeatability interday repeatability |
| fortified prior to extraction | 0.5 MRL | ||
| 1 aliquot of 6 different blank batches | Level 2 | 6 | |
| fortified prior to extraction | 1.0 MRL | ||
| 1 aliquot of 6 different blank batches | Level 2 | 6 | |
| fortified prior to extraction | 1.5 MRL |
| Analyte | LOD | LOQ | Concentration Level (µg kg−1) | Recovery (%) | Repeatability | |
|---|---|---|---|---|---|---|
| (µg kg−1) | (µg kg−1) | (n = 18) | Intraday | Interday | ||
| (RSD% n = 6) | (RSD % n = 18) | |||||
| OTC | 3 | 10 | 50 | 100.8 | 9.61 | 8.57 |
| 100 | 102.5 | 6.95 | 6.01 | |||
| 150 | 104.4 | 4.32 | 4.60 | |||
| DC | 3 | 11 | 50 | 77.9 | 7.83 | 8.58 |
| 100 | 77.4 | 4.35 | 6.43 | |||
| 150 | 77.8 | 5.27 | 5.27 | |||
| TC | 2 | 7 | 50 | 102.6 | 12.95 | 12.91 |
| 100 | 105.0 | 5.27 | 6.44 | |||
| 150 | 110.5 | 7.46 | 7.55 | |||
| CTC | 2.5 | 8 | 50 | 97.6 | 5.60 | 15.00 |
| 100 | 101.0 | 6.82 | 15.06 | |||
| 150 | 101.8 | 5.48 | 12.67 | |||
Disclaimer/Publisher’s Note: The statements, opinions and data contained in all publications are solely those of the individual author(s) and contributor(s) and not of MDPI and/or the editor(s). MDPI and/or the editor(s) disclaim responsibility for any injury to people or property resulting from any ideas, methods, instructions or products referred to in the content. |
© 2024 by the authors. Licensee MDPI, Basel, Switzerland. This article is an open access article distributed under the terms and conditions of the Creative Commons Attribution (CC BY) license (https://creativecommons.org/licenses/by/4.0/).
Share and Cite
Salis, S.; Dore, S.; Rubattu, N.; D’Ascenzo, V.; Cherchi, F.T.; Lollai, S.A. The Development and Validation of an LC–Orbitrap–HRMS Method for the Analysis of Four Tetracyclines in Milk and Its Application to Determine Oxytetracycline Concentrations after Intramuscular Administration in Healthy Sarda Ewes and Those Naturally Infected with Streptococcus uberis. Separations 2024, 11, 242. https://doi.org/10.3390/separations11080242
Salis S, Dore S, Rubattu N, D’Ascenzo V, Cherchi FT, Lollai SA. The Development and Validation of an LC–Orbitrap–HRMS Method for the Analysis of Four Tetracyclines in Milk and Its Application to Determine Oxytetracycline Concentrations after Intramuscular Administration in Healthy Sarda Ewes and Those Naturally Infected with Streptococcus uberis. Separations. 2024; 11(8):242. https://doi.org/10.3390/separations11080242
Chicago/Turabian StyleSalis, Severyn, Simone Dore, Nicola Rubattu, Vittoria D’Ascenzo, Francesca T. Cherchi, and Stefano A. Lollai. 2024. "The Development and Validation of an LC–Orbitrap–HRMS Method for the Analysis of Four Tetracyclines in Milk and Its Application to Determine Oxytetracycline Concentrations after Intramuscular Administration in Healthy Sarda Ewes and Those Naturally Infected with Streptococcus uberis" Separations 11, no. 8: 242. https://doi.org/10.3390/separations11080242
APA StyleSalis, S., Dore, S., Rubattu, N., D’Ascenzo, V., Cherchi, F. T., & Lollai, S. A. (2024). The Development and Validation of an LC–Orbitrap–HRMS Method for the Analysis of Four Tetracyclines in Milk and Its Application to Determine Oxytetracycline Concentrations after Intramuscular Administration in Healthy Sarda Ewes and Those Naturally Infected with Streptococcus uberis. Separations, 11(8), 242. https://doi.org/10.3390/separations11080242