
Analysis of Marker Compounds in Lindera erythrocarpa from Diverse Geographical Regions of Korea


Abstract
1. Introduction
2. Materials and Methods
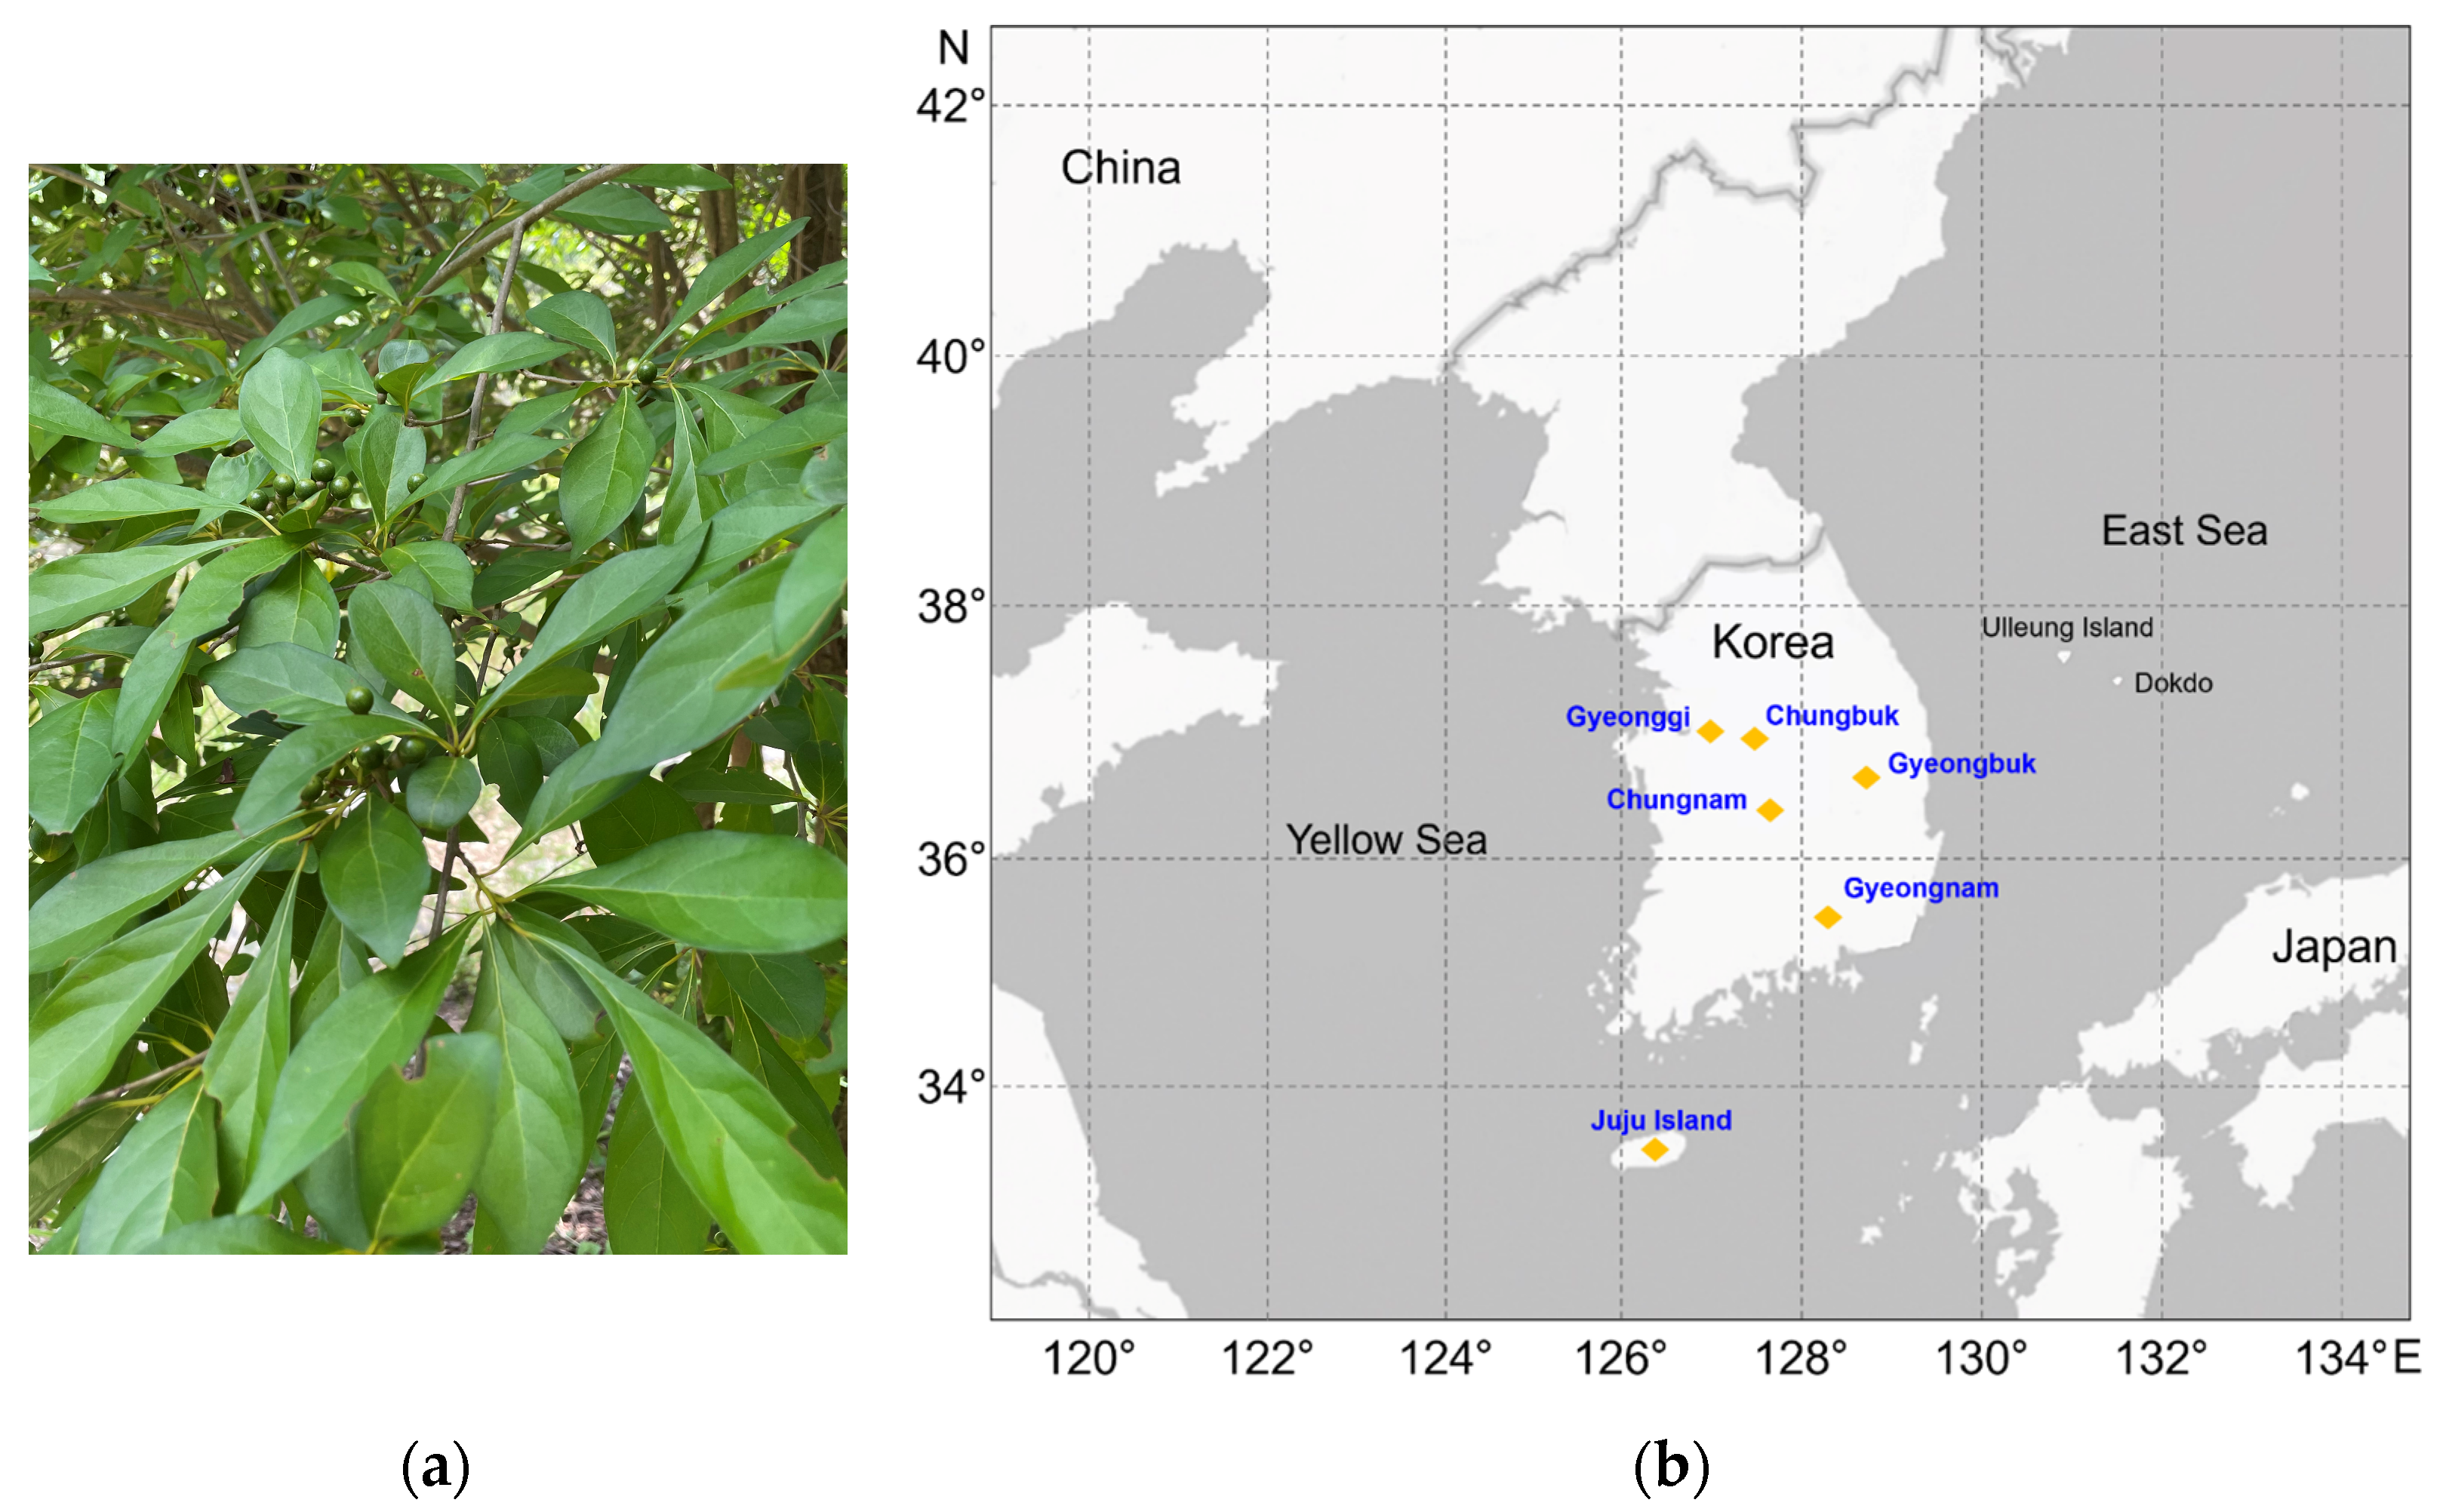
2.1. Plant Materials
2.2. Instruments, Chemicals, and Reagents
2.3. HPLC Conditions and Sample Preparation
2.4. Calibration Curves
2.5. Statistical Analysis
3. Results and Discussion
Author Contributions
Funding
Data Availability Statement
Acknowledgments
Conflicts of Interest
References
- Yoon, C.; Lee, H.; Liu, Z.; Lee, H.; Lee, D. Effects of compounds isolated from Lindera erythrocarpa on anti-inflammatory and anti-neuroinflammatory action in BV2 microglia and RAW264.7 macrophage. Int. J. Mol. Sci. 2022, 23, 7122. [Google Scholar] [CrossRef]
- Ko, Y.-J.; Ahn, G.; Ham, Y.M.; Song, S.M.; Ko, E.Y.; Cho, S.H.; Yoon, W.J.; Kim, K.N. Anti-inflammatory effect and mechanism of action of Lindera erythrocarpa essential oil in lipopolysaccharide-stimulated RAW264.7 cells. EXCLI J. 2017, 16, 1103–1113. [Google Scholar]
- Wang, S.; Lan, X.; Xiao, J.; Yang, J.; Kao, Y.; Chang, S. Anti-inflammatory activity of Lindera erythrocarpa fruits. Phytother. Res. 2007, 22, 213–216. [Google Scholar] [CrossRef] [PubMed]
- Kim, S.S.; Song, G.; Oh, T.H.; Kim, K.N.; Yang, E.J.; Kim, J.Y.; Lee, N.H.; Hyun, C.G. Antimicrobial effect of Lindera erythrocarpa essential oil against antibiotic-resistant skin pathogens. J. Pure Appl. Microbiol. 2009, 3, 429–434. [Google Scholar]
- Kang, M.; Ko, R.; Kim, S.; Choi, H.; Jin, Y.; Han, J.; Kim, B.; Lee, N. Melanin biosynthesis inhibitory effect of new compound (Jeju-Erythrane) isolated from the bark of Lindera erythrocarpa Makino. KSBB J. 2010, 25, 330–336. [Google Scholar]
- Hseu, Y.; Tsai, Y.; Huang, P.; Ou, T.; Korivi, M.; Hsu, L.; Chang, S.; Wu, C.; Yang, H. The dermato-protective effects of lucidone from Lindera erythrocarpa through the induction of Nrf2-mediated antioxidant genes in UVA-irradiated human skin keratinocytes. J. Funct. Foods 2015, 12, 303–318. [Google Scholar] [CrossRef]
- Lee, S.; Oh, H.; Fang, Y.; An, S.; Park, D.; Song, H.; Oh, S.; Kim, S.; Kim, S.; Kim, N.; et al. Identification of plant compounds that disrupt the insect juvenile hormone receptor complex. Appl. Biol. Res. 2015, 112, 1733–1738. [Google Scholar] [CrossRef]
- Oh, E.S.; Ro, H.; Ryu, H.W.; Song, Y.N.; Park, J.; Kim, N.; Kim, H.; Oh, S.M.; Lee, S.; Kim, D.; et al. Methyl lucidone inhibits airway inflammatory response by reducing TAK1 activity in human bronchial epithelial NCI–H292 cells. Heliyon 2023, 9, e20154. [Google Scholar] [CrossRef] [PubMed]
- Shetu, S.A.; Bandyopadhyay, D. Small-molecule RAS inhibitors as anticancer agents: Discovery, development, and Mechanistic studies. Int. J. Mol. Sci. 2022, 23, 3706. [Google Scholar] [CrossRef]
- Ryu, B.; Park, E.; Doan, T.; Cho, H.; Ponce-Zea, J.; Mai, V.; Oveissi, V.; Oh, W. Linderanidins A–F: Rare oligomeric flavonoids with an unusual C-3–C-4 linkage from the roots of Lindera erythrocarpa and their inhibitory activities on autophagy. Phytochemistry 2023, 215, 113836. [Google Scholar] [CrossRef]
- Phosri, S.; Jangpromma, N.; Chang, L.C.; Tan, G.T.; Wongwiwatthananukit, S.; Maijaroen, S.; Anwised, P.; Payoungkiattikun, W.; Klaynongsruang, S. Siamese crocodile white blood cell extract inhibits cell proliferation and promotes autophagy in multiple cancer cell lines. J. Microbiol. Biotechnol. 2018, 28, 1007–1021. [Google Scholar] [CrossRef] [PubMed]
- Lee, J.; Chun, H.; Pham, T.; Yoon, J.; Lee, J.; Choi, M.; Ryu, H.; Oh, S.; Oh, J.; Yoon, D. Kanakugiol, a compound isolated from Lindera erythrocarpa, promotes cell death by inducing mitotic catastrophe after cell cycle arrest. J. Microbiol. Biotechnol. 2020, 30, 279. [Google Scholar] [CrossRef]
- Yaman, C.; Önlü, Ş.; Ahmed, H.; Erenler, R. Comparison of phytochemicals and antioxidant capacity of Hypericum perforatum; wild plant parts and in vitro samples. J. Anim. Plant Sci. 2021, 32, 596–603. [Google Scholar]
- Kaggwa, B.; Anywar, G.; Munanura, E.I.; Wangalwa, R.; Kyeyune, H.; Okella, H.; Kamba, F.P.; Engeu, O.P. Application of the herbal chemical marker ranking system (Herb MaRS) to the standardization of herbal raw materials: A case study. BMC Complement. Med. Ther. 2023, 23, 348. [Google Scholar] [CrossRef]
- Tian, X.; Lv, H.; Xiang, G.; Peng, J.; Li, G.; He, Y.; Zhang, F.; Mou, C. Influence of geographic origin and tissue type on the medicinal chemical compounds of Semiliquidambar cathayensis. PeerJ 2023, 11, e15484. [Google Scholar] [CrossRef]
- Chen, J.; Xu, Y.; Wei, G.; Liao, S.; Zhang, Y.; Huang, W.; Yuan, L.; Wang, Y. Chemotypic and genetic diversity in Epimedium sagittatum from different geographical regions of China. Phytochemistry 2015, 116, 180–187. [Google Scholar] [CrossRef]
- Ogundola, A.F.; Bvenura, C.; Ehigie, A.F.; Afolayan, A.J. Effects of soil types on phytochemical constituents and antioxidant properties of Solanum nigrum. S. Afr. J. Bot. 2022, 151, 325–333. [Google Scholar] [CrossRef]
- Mudau, H.S.; Mokoboki, H.K.; Ravhuhali, K.E.; Mkhize, Z. Effect of Soil Type: Qualitative and quantitative analysis of phytochemicals in some browse species leaves found in savannah biome of South Africa. Molecules 2022, 27, 1462. [Google Scholar] [CrossRef]
- Moghaddam, M.K.; Fallah, H.; Niknejad, Y.; Dastan, S. Investigating the altitude impact on the eco-phytochemical parameters of Ziziphora clinopodioides and Sophora alopecuroides in the different regions of northern Iran. Acta Sci. Pol.-Hortorum 2022, 21, 57–65. [Google Scholar] [CrossRef]
- Khalil, N.; El-Jalel, L.; Yousif, M.; Gonaid, M. Altitude impact on the chemical profile and biological activities of Satureja thymbra L. essential oil. BMC Complement. Med. Ther. 2020, 20, 186. [Google Scholar] [CrossRef]
- Kang, Z.; Babar, M.A.; Khan, N.; Guo, J.; Khan, J.; Islam, S.; Shrestha, S.; Shahi, D. Comparative metabolomic profiling in the roots and leaves in contrasting genotypes reveals complex mechanisms involved in post-anthesis drought tolerance in wheat. PLoS ONE 2019, 14, e0213502. [Google Scholar] [CrossRef] [PubMed]
- Wang, S.; Alseekh, S.; Fernie, A.R.; Luo, J. The structure and function of major plant metabolite modifications. Mol. Plant. 2019, 12, 899–919. [Google Scholar] [CrossRef] [PubMed]
- Raya, K.B.; Ahmad, S.H.; Farhana, S.F.; Mohammad, M.; Tajidin, N.E.; Parvez, A. Changes in phytochemical contents in different parts of Clinacanthus nutans (Burm. f.) Lindau due to storage duration. Bragantia 2015, 74, 445–452. [Google Scholar] [CrossRef]
- Lv, Y.; Zou, Y.; Zhang, X.; Liu, B.; Peng, X.; Chu, C. A review on the chemical constituents and pharmacological efficacies of Lindera aggregata (Sims) Kosterm. Front. Nutr. 2023, 9, 1071276. [Google Scholar] [CrossRef]
- Yoon, J.; Pham, T.; Lee, J.; Lee, J.; Ryu, H.; Oh, S.; Oh, J.; Yoon, D. Methyl linderone suppresses TPA-Stimulated IL-8 and MMP-9 expression via the ERK/STAT3 pathway in MCF-7 breast cancer cells. J. Microbiol. Biotechnol. 2020, 30, 325–332. [Google Scholar] [CrossRef]
- Obel, H.O.; Cheng, C.; Tian, Z.; Njogu, M.K.; Li, J.; Du, S.; Lou, Q.; Zhou, J.; Yu, X.; Ogweno, J.O.; et al. Transcriptomic and physiological analyses reveal potential genes involved in photoperiod-regulated β-carotene accumulation mechanisms in the endocarp of cucumber (Cucumis sativus L.) fruit. Int. J. Mol. Sci. 2022, 23, 12650. [Google Scholar] [CrossRef]
- Mohanan, P.; Yang, T.-J.; Song, Y.H. Effect of far-red light on the production and diversity of ginsenosides in leaves of Panax ginseng Meyer. Appl. Biol. Chem. 2023, 66, 16. [Google Scholar] [CrossRef]
- Rienth, M.; Vigneron, N.; Darriet, P.; Sweetman, C.; Burbidge, C.; Bonghi, C.; Walker, R.P.; Famiani, F.; Castellarin, S.D. Grape berry secondary metabolites and their modulation by abiotic factors in a climate change scenario-a review. Front. Plant Sci. 2021, 12, 643258. [Google Scholar] [CrossRef]
- Pacheco-Hernández, Y.; Villa-Ruano, N.; Lozoya-Gloria, E.; Barrales-Cortés, C.A.; Jiménez-Montejo, F.E.; Cruz-López, M.D.C. Influence of environmental factors on the genetic and chemical diversity of Brickellia veronicifolia populations growing in fragmented shrublands from Mexico. Plants 2021, 10, 325. [Google Scholar] [CrossRef]
- Van Der Knaap, J.A.; Verrijzer, C.P. Undercover: Gene control by metabolites and metabolic enzymes. Genes Dev. 2016, 30, 2345–2369. [Google Scholar] [CrossRef]
- Vaou, N.; Stavropoulou, E.; Voidarou, C.C.; Tsakris, Z.; Rozos, G.; Tsigalou, C.; Bezirtzoglou, E. Interactions between medical plant-derived bioactive compounds: Focus on antimicrobial combination effects. Antibiotics 2022, 11, 1014. [Google Scholar] [CrossRef] [PubMed]
- Kim, J.-W.; Hong, Y.-K.; Ryu, S.-H.; Kwon, O.-K.; Lee, Y.-B.; Kim, S.C. Development of analytical method for veterinary antibiotics and monitoring of residuals in agricultural environment. Appl. Biol. Chem. 2023, 66, 20. [Google Scholar] [CrossRef]
- Ghimire, B.K.; Seo, J.; Kim, S.; Ghimire, B.; Lee, J.; Yu, C.; Chung, I. Influence of harvesting time on phenolic and mineral profiles and their association with the antioxidant and cytotoxic effects of Atractylodes japonica Koidz. Agronomy 2021, 11, 1327. [Google Scholar] [CrossRef]
- Gao, X.; Zhang, N.; Xie, W. Research on the medicinal chemistry and pharmacology of Taxus × media. Int. J. Mol. Sci. 2024, 25, 5756. [Google Scholar] [CrossRef]
- Oanh, V.T.; Phong, N.V.; Thanh, L.T.; Min, B.S.; Kim, J.A. Phytochemical investigation of active compounds from Celastrus orbiculatus Thunb. with α-glucosidase inhibitory activity. Nat. Prod. Sci. 2023, 29, 217–224. [Google Scholar] [CrossRef]


| Collection Site | Plant Part | Sample Name |
|---|---|---|
| Gyeonggi Province | Leaf | GGL |
| Stem | GGS | |
| Chungbuk Province | Leaf | CBL |
| Stem | CBS | |
| Chungnam Province | Leaf | CNL |
| Stem | CNS | |
| Gyeongbuk Province | Leaf | GBL |
| Stem | GBS | |
| Gyeongnam Province | Leaf | GNL |
| Stem | GNS | |
| Jeju Island | Leaf | JIL |
| Stem | JIS |
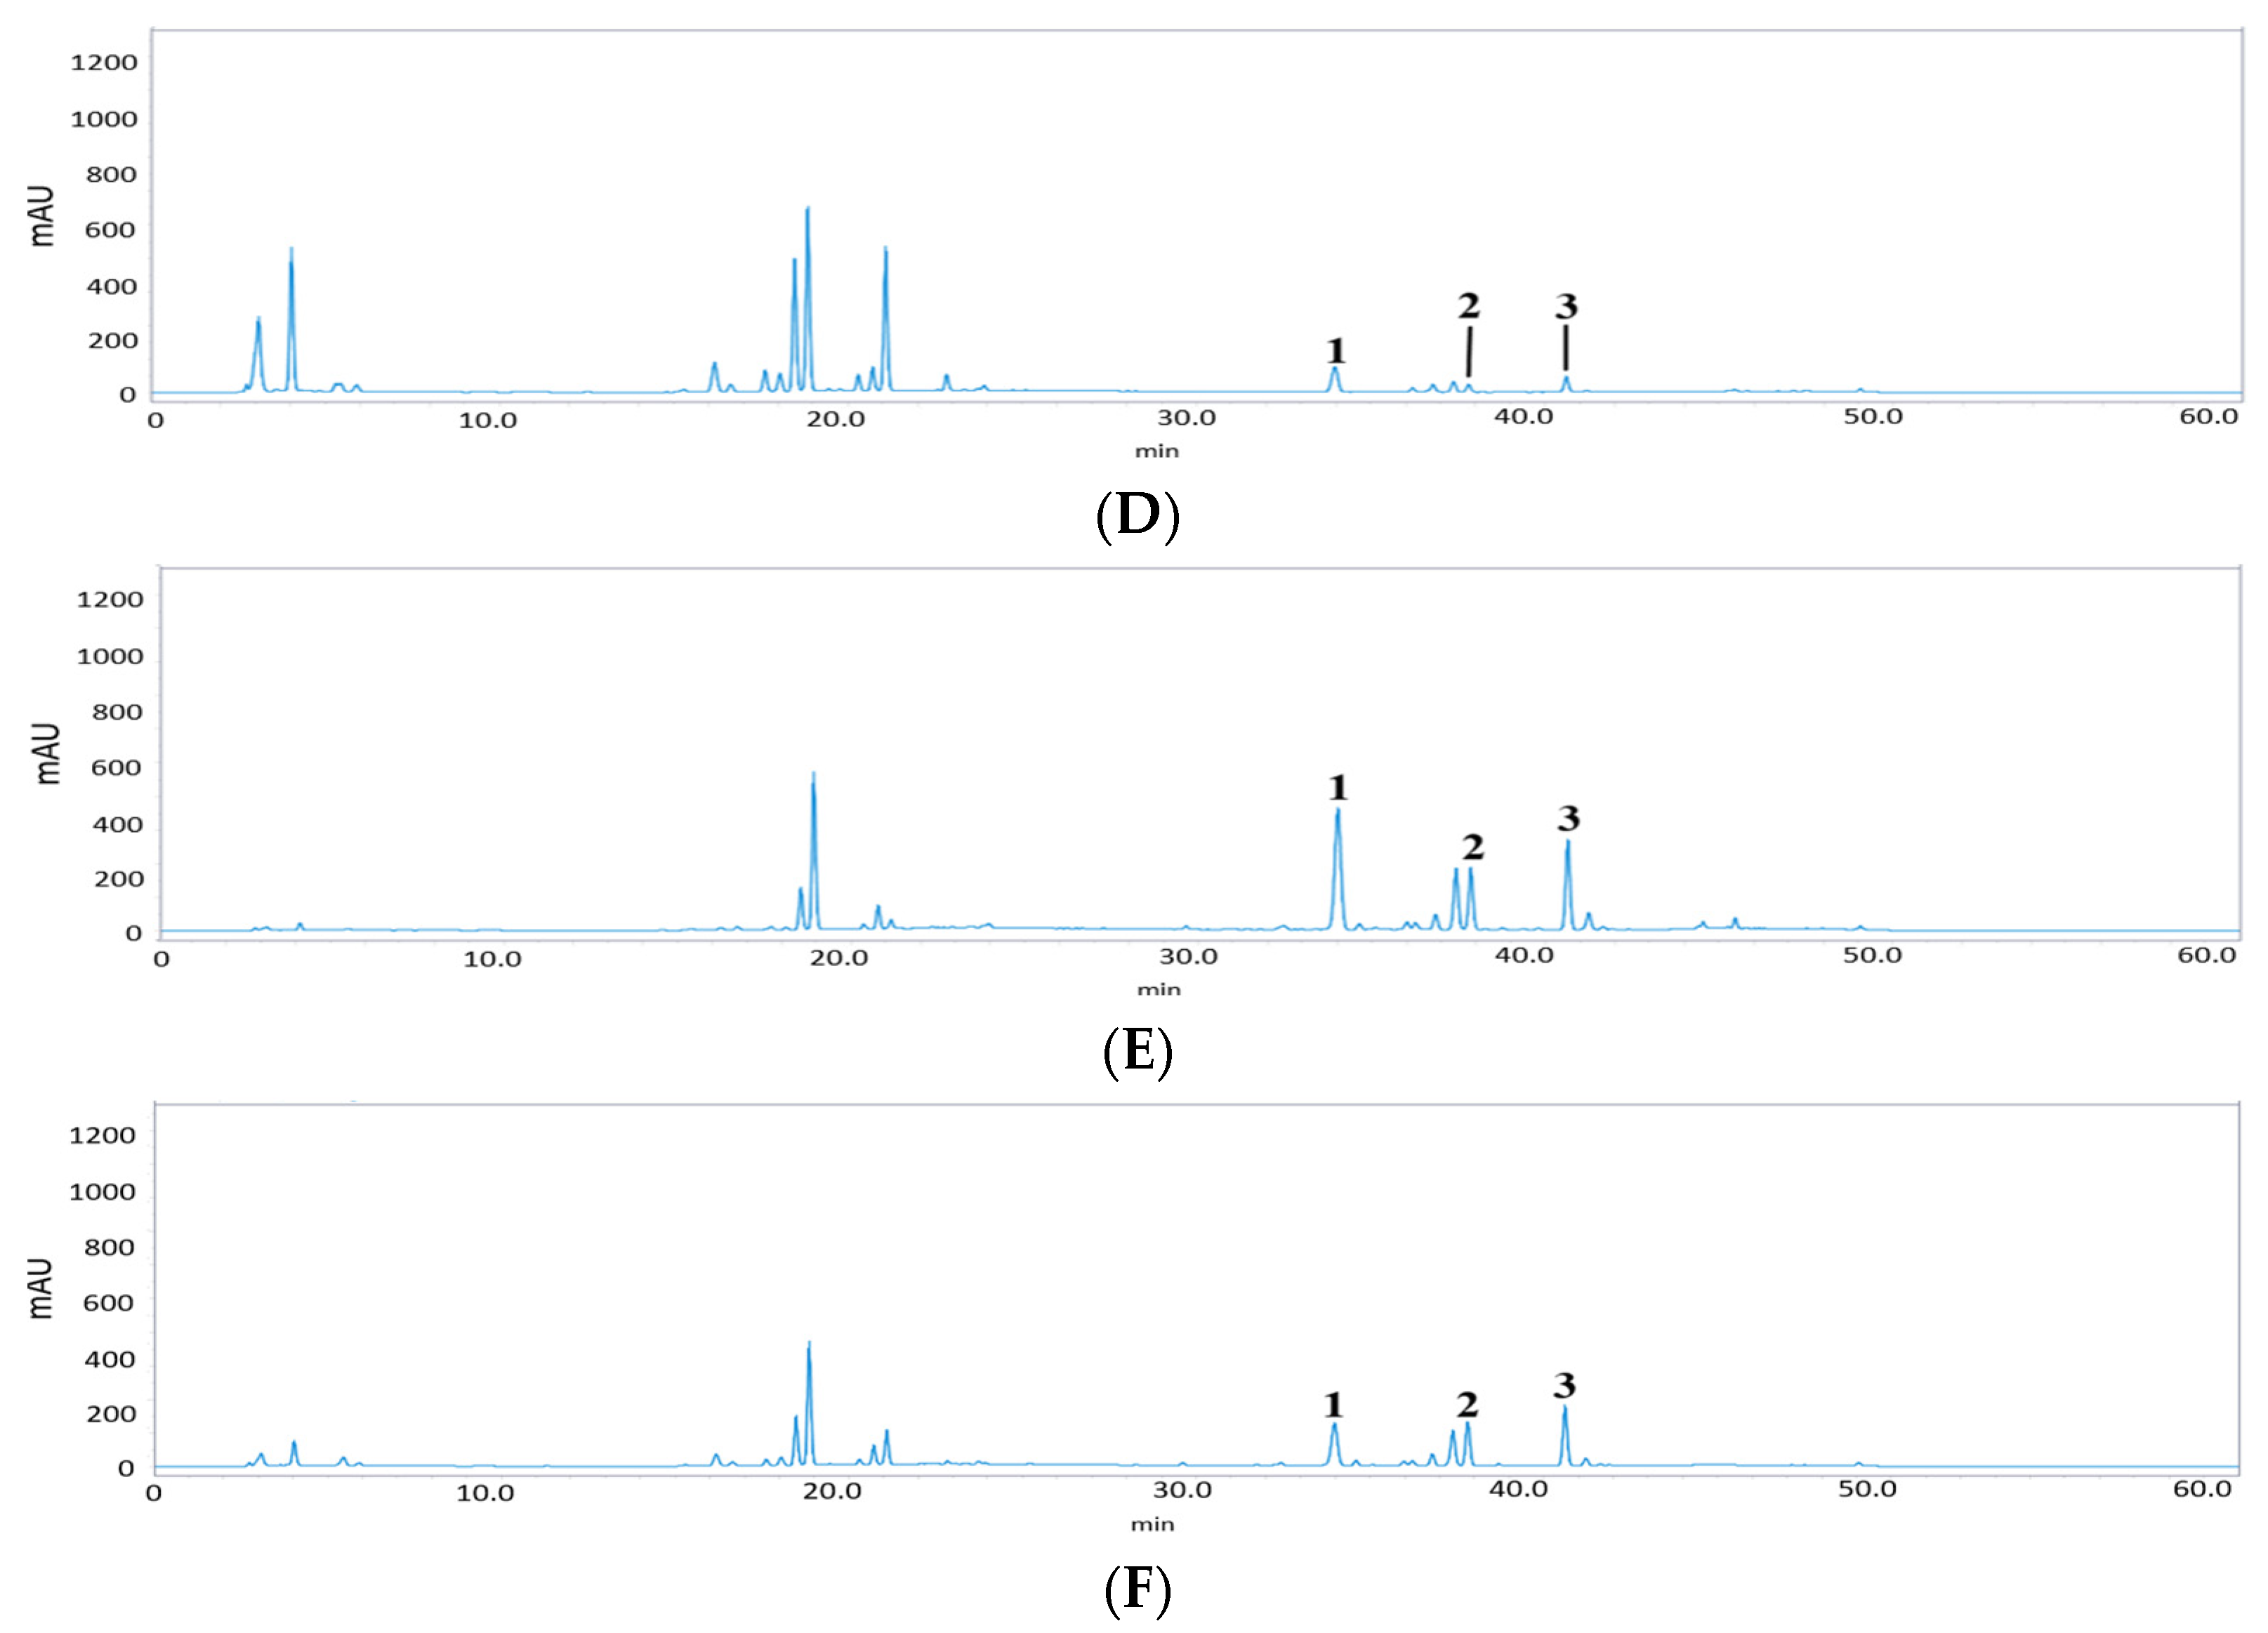
| Compound | tR | Calibration Equation | Correlation Factor R2 |
|---|---|---|---|
| 1 | 33.94 | y = 32.167x + 723.36 | 0.9970 |
| 2 | 37.79 | y = 32.973x + 496.89 | 0.9991 |
| 3 | 40.59 | y = 20.848x + 283.15 | 0.9997 |
| Sample | Content (mg/g) | |||
|---|---|---|---|---|
| 1 | 2 | 3 | Total | |
| GGL | 9.15 ± 0.00 a | 9.03 ± 0.00 c | 21.48 ± 0.00 d | 39.66 ± 0.01 |
| GGS | 2.54 ± 0.01 g | 10.03 ± 0.04 b | 50.10 ± 0.23 a | 62.66 ± 0.28 |
| CBL | 4.92 ± 0.06 c | 0.97 ± 0.02 i | 5.73 ± 0.07 j | 11.62 ± 0.15 |
| CBS | 3.14 ± 0.00 f | 3.11 ± 0.00 f | 8.49 ± 0.49 g | 14.74 ± 0.50 |
| CNL | 9.08 ± 0.09 a | 1.32 ± 0.02 h | 7.44 ± 0.09 h | 17.84 ± 0.20 |
| CNS | 4.85 ± 0.01 d | 5.20 ± 0.00 e | 23.44 ± 0.03 c | 33.50 ± 0.05 |
| GBL | 1.20 ± 0.01 i | tr | 0.29 ± 0.00 l | 1.41 ± 0.01 |
| GBS | 0.98 ± 0.02 h | 3.09 ± 0.03 f | 15.24 ± 0.09 e | 19.31 ± 0.13 |
| GNL | 8.38 ± 0.12 b | 2.56 ± 0.04 g | 6.92 ± 0.10 i | 17.86 ± 0.26 |
| GNS | 3.03 ± 0.00 e | 12.19 ± 0.00 a | 24.85 ± 0.02 b | 40.07 ± 0.03 |
| JIL | 2.57 ± 0.00 g | 1.77 ± 0.00 h | 4.33 ± 0.01 k | 6.10 ± 0.01 |
| JIS | 1.33 ± 0.03 h | 7.51 ± 0.12 d | 13.28 ± 0.22 f | 20.79 ± 0.34 |
Disclaimer/Publisher’s Note: The statements, opinions and data contained in all publications are solely those of the individual author(s) and contributor(s) and not of MDPI and/or the editor(s). MDPI and/or the editor(s) disclaim responsibility for any injury to people or property resulting from any ideas, methods, instructions or products referred to in the content. |
© 2024 by the authors. Licensee MDPI, Basel, Switzerland. This article is an open access article distributed under the terms and conditions of the Creative Commons Attribution (CC BY) license (https://creativecommons.org/licenses/by/4.0/).
Share and Cite
Uy, N.P.; Kim, J.-H.; Kim, D.-Y.; Ku, J.; Lee, S. Analysis of Marker Compounds in Lindera erythrocarpa from Diverse Geographical Regions of Korea. Separations 2024, 11, 252. https://doi.org/10.3390/separations11080252
Uy NP, Kim J-H, Kim D-Y, Ku J, Lee S. Analysis of Marker Compounds in Lindera erythrocarpa from Diverse Geographical Regions of Korea. Separations. 2024; 11(8):252. https://doi.org/10.3390/separations11080252
Chicago/Turabian StyleUy, Neil Patrick, Jung-Hee Kim, Doo-Young Kim, Jajung Ku, and Sanghyun Lee. 2024. "Analysis of Marker Compounds in Lindera erythrocarpa from Diverse Geographical Regions of Korea" Separations 11, no. 8: 252. https://doi.org/10.3390/separations11080252
APA StyleUy, N. P., Kim, J.-H., Kim, D.-Y., Ku, J., & Lee, S. (2024). Analysis of Marker Compounds in Lindera erythrocarpa from Diverse Geographical Regions of Korea. Separations, 11(8), 252. https://doi.org/10.3390/separations11080252