Article

Enrichment of Trace Selenium in Water Based on Metal−Organic Framework Materials and Reversed−Phase Ultra−High−Performance Liquid Chromatography−Diode Array Determination

1
Analytical & Testing Center, Southwest University of Science and Technology, Mianyang 621010, China
2
Sichuan Sainasi Analysis and Testing Company Limited, Chengdu 610023, China
3
Analytical & Service Center of Sichuan Province, Chengdu 610023, China
*
Authors to whom correspondence should be addressed.
Separations 2025, 12(3), 62; https://doi.org/10.3390/separations12030062
Submission received: 1 January 2025 / Revised: 20 February 2025 / Accepted: 4 March 2025 / Published: 9 March 2025

Abstract

:
A method for the determination of trace selenium in water enriched by metal–organic−framework material (MIL−125−NH2) and reversed−phase ultra−high−performance liquid chromatography−diode array detection (UPLC−DAD) was established. The MIL−125−NH2 material, synthesized by the microwave method, was characterized by SEM, XRD, and FT−IR. The MIL−125−NH2 material was added to the water sample to enrich the selenium, the enriched selenium was desorbed with dilute HCl, and then the derivative reaction with 0.1 mol·L−1 4−nitro−o−phenylenediamine was performed to produce piaselenole. After extraction with cyclohexane, the retention time and the spectrogram were qualitatively detected by a liquid chromatography−diode array detector, and the peak area was quantitatively detected. The pH, time, amount of material, extractant, and other conditions of derivation and enrichment were optimized in the experiment, and the methodology was verified under optimized conditions. The results showed that the linear correlation coefficient R2 was 0.9998, the detection limit of 0.13 μg·L−1 without enrichment was close to that of the ICP−MS method, the detection limit after 10−fold enrichment was 0.013 μg·L−1, the RSD was 0.7~2.7%, and the recovery was 87.8~102.1%, in the range of 2~1000 μg·L−1. Therefore, the method can be applied for the determination of trace selenium in tap water, river water, mountain spring water, packaged drinking water, and industrial sewage.

1. Introduction

Water is the source of life [1], and one of the most important components of organisms. Human beings need to drink a lot of water every day to maintain the normal metabolism of the body. However, the amount of selenium in water can directly affect human health. Selenium (Se) is a trace element that can enhance the activity of peroxidase, protect biological cell membranes, reduce blood lipids, prevent cardiovascular diseases, and promote the growth of children [2,3]. In addition, an excessive intake of selenium causes poisoning, which may threaten human health [4]. Therefore, based on the dual nature of selenium, it is of great significance to establish an accurate, efficient, and environmentally friendly method to detect Se in water.
Metal–organic−frameworks (MOFs) are different from traditional inorganic and organic materials, which are hybrid materials formed by the combination of metal ions and organic ligands, generally forming a three−dimensional porous crystal structure in space with an adjustable topological structure [5,6] and high porosity [7,8,9]. Compared with traditional nano−porous materials, the specific surface area is larger, the pore size can be adjusted, and it also has good thermal stability and solution dispersion [10,11,12]. In recent years, MOFs have been frequently applied in various adsorption and catalytic experiments at home and abroad [13,14,15,16]. The current enrichment methods for selenium include pre−enrichment on exchange resin [17], solid−phase extraction (SPE) [18], and nano−dispersion micro−extraction [19]. However, these traditional adsorption materials can only be adsorbed under limited conditions, such as that the SPE column can only adsorb part of the specific target, and the adsorption range is not as wide as MOF materials. In addition, MOF materials also have the ability to enrich gas, organic pollutants, metal pollutants, and other substances at the same time. In addition, the reuse performance of traditional adsorption materials is not as good as that of MOF materials. In this experiment, MIL−125−NH2, which was synthesized simply and quickly by microwave after micro−adjustment according to a previous report [20], belongs to the MILs series and has larger specific surface area and pore size, and stronger stability than some ZIFs series, UIO series, and IRMOF series [21,22]. The pore size of MIL−125−NH2 was much larger than the size of the Se(IV), which was not more than 3.20 Å [23]. In addition, there were H2O/−OH groups on its surface, which could bind SeO32−, HSeO3, and H2SeO3 through hydrogen bonds and coordination bonds. The N atom in the material was alkaline and could be protonated in an acidic solution [24], which was also conducive to the enrichment of SeO32− and HSeO3. Importantly, not only Se(IV) could form Se−O−Ti complexes with Ti, but also the −NH2 functional group introduced in MIL−125−NH2 material, which had a stronger coordination ability with Se(IV), thus enhancing the adsorption capacity.
So far, the detection methods for Se are very traditional, including atomic fluorescence spectrometry [25,26], inductively coupled plasma mass spectrometry [27,28], flame atomic absorption spectrometry [29], inductively coupled plasma−optical emission spectrometry [30], etc., but these methods either have low detection limits or matrix interference. In addition, there are also reports of high−performance liquid chromatography−fluorescence detection (HPLC−FLD) and UV spectrophotometry, but a HPLC−FLD detector is more expensive than a diode array detector (DAD), and both methods do not have a qualitative spectrogram, the determination of the results may lead to false positive misjudgments, as UV spectrophotometry without chromatographic separation will have impurities interference. Therefore, in this study, Se was absorbed by MIL−125−NH2 in water, then Se was involved in a rapid derivative reaction with 4−nitro−o−phenylenediamine (NPDA), and then produced 5−nitro−2,1, 3−benzooleprazole (the latter was called piaselenole), which had strong ultraviolet absorption, which can be detected by UPLC−DAD. Finally, a method for the determination of trace selenium in water by UPLC−DAD after enrichment by MIL−125−NH2 was established by optimizing various conditions. The method could detect low concentrations of Se in water which was adsorbed by MOF, and the impurity interference would be greatly reduced after the piaselenole was separated by chromatography. It was more accurate to use DAD for quantitative analysis, and it could also be qualitatively analyzed by an ultraviolet and 3D spectrogram. At present, there are almost no reports on the determination of Se by UPLC−DAD. In addition, the enrichment ratio of selenium in water could be increased by using MOF to achieve a lower detection limit.

2. Experimental Methods

2.1. Chemicals and Instruments

Tetrabutyl titanate (TBT), 4−nitro−o−phenylenediamine (NPDA), 2−aminoterephthalic acid (NH2−H2BDC), N,N−dimethylformamide (DMF), hydrochloric acid (HCl, 36%), cyclohexane, sodium hydroxide (NaOH), and ammonia solution were all analytically pure and purchased from Chengdu Kelon Chemical Reagent Factory (Chengdu, China). The selenium (IV) standard solution (1000 mg·L−1) was purchased from Beijing Tan−Mo Technology Company Limited (Beijing, China). The other instruments used in the experiment are shown in Table 1.

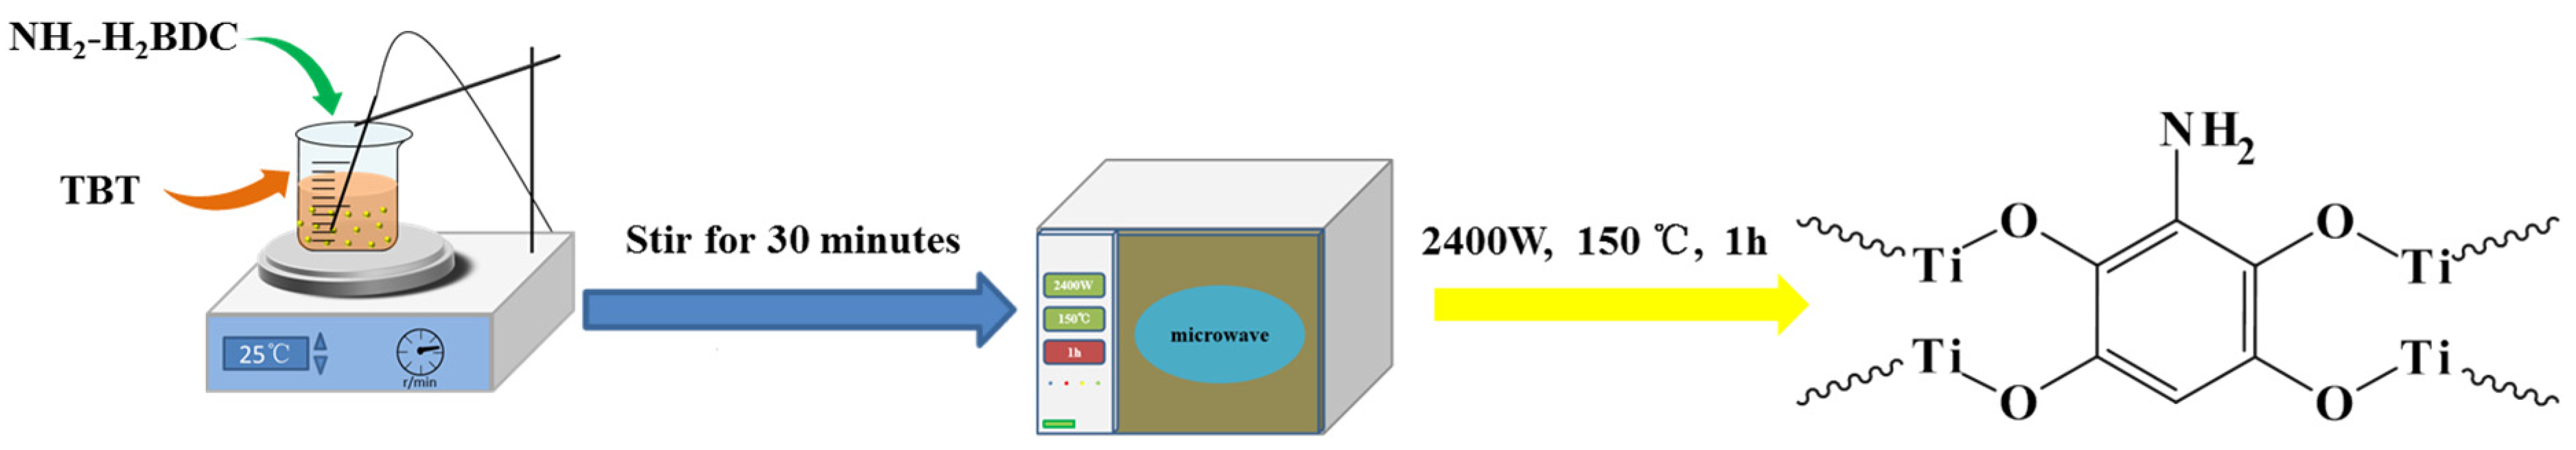
2.2. Synthesis of MOF

An amount of 0.54 g NH2−H2BDC (organic ligand material) was added to a 50 mL glass beaker, and then a mixture of 20 mL DMF and methanol (7:3) was added to the beaker to fully dissolve NH2−H2BDC. Then, 0.52 mL TBT (central ligand ion) was accurately added into the beaker. After stirring for 30 min, the mixed solution was transferred to the microwave digestion tubes, and they were placed symmetrically in the microwave digester. The microwave power was 2400 W, the temperature was 150 °C, and they were fast−synthesized for 1 h. When cooled to about 50 °C, the lining tube of the polytetrafluoroethylene reactor was removed, they were swirled for 1 min, and all the solution was transferred to a 50 mL centrifuge tube. After centrifugation, all the clear liquid was discarded, and the residue was cleaned with methanol 3 times. Then, the residue was dried in a vacuum−drying oven at 60 °C for 12 h. Finally, the obtained MOF material was ground with an agate mortar and stored in a dry place. Figure 1 shows the synthesis roadmap of MIL−125−NH2.

2.3. Preparation of Derivative Reagent

An amount of 1.53 g NPDA was added into a 100 mL volumetric bottle, and 1 mol·L−1 dilute hydrochloric acid solution was used to fix the volume and ultrasound for 5 min to obtain the 0.1 mol·L−1 derivative solution.

2.4. Enrichment of Selenium in Water

The 50 mL water sample was accurately measured in a 50 mL centrifuge tube with a cover, and 15 mg MIL−125−NH2 was added to the centrifuge tube for 10 min. After the selenium in the water sample was fully enriched, it was left to stand for 5 min, centrifuged at 8000 r·min−1 for 4 min, and all the supernatant was abandoned. Then, 2 mL 0.1 mol·L−1 dilute hydrochloric acid was added, the residue was dissolved by swirling for 1 min, then 1 mL 0.1 mol·L−1 NPDA was accurately added, and the reaction was conducted at room temperature for 4 min. After the reaction was completed, 5 mL cyclohexane was added to extract the piaselenole from the reaction solution. Finally, it was purified with 0.22 μm filter, and was then tested.

3. Results and Discussion

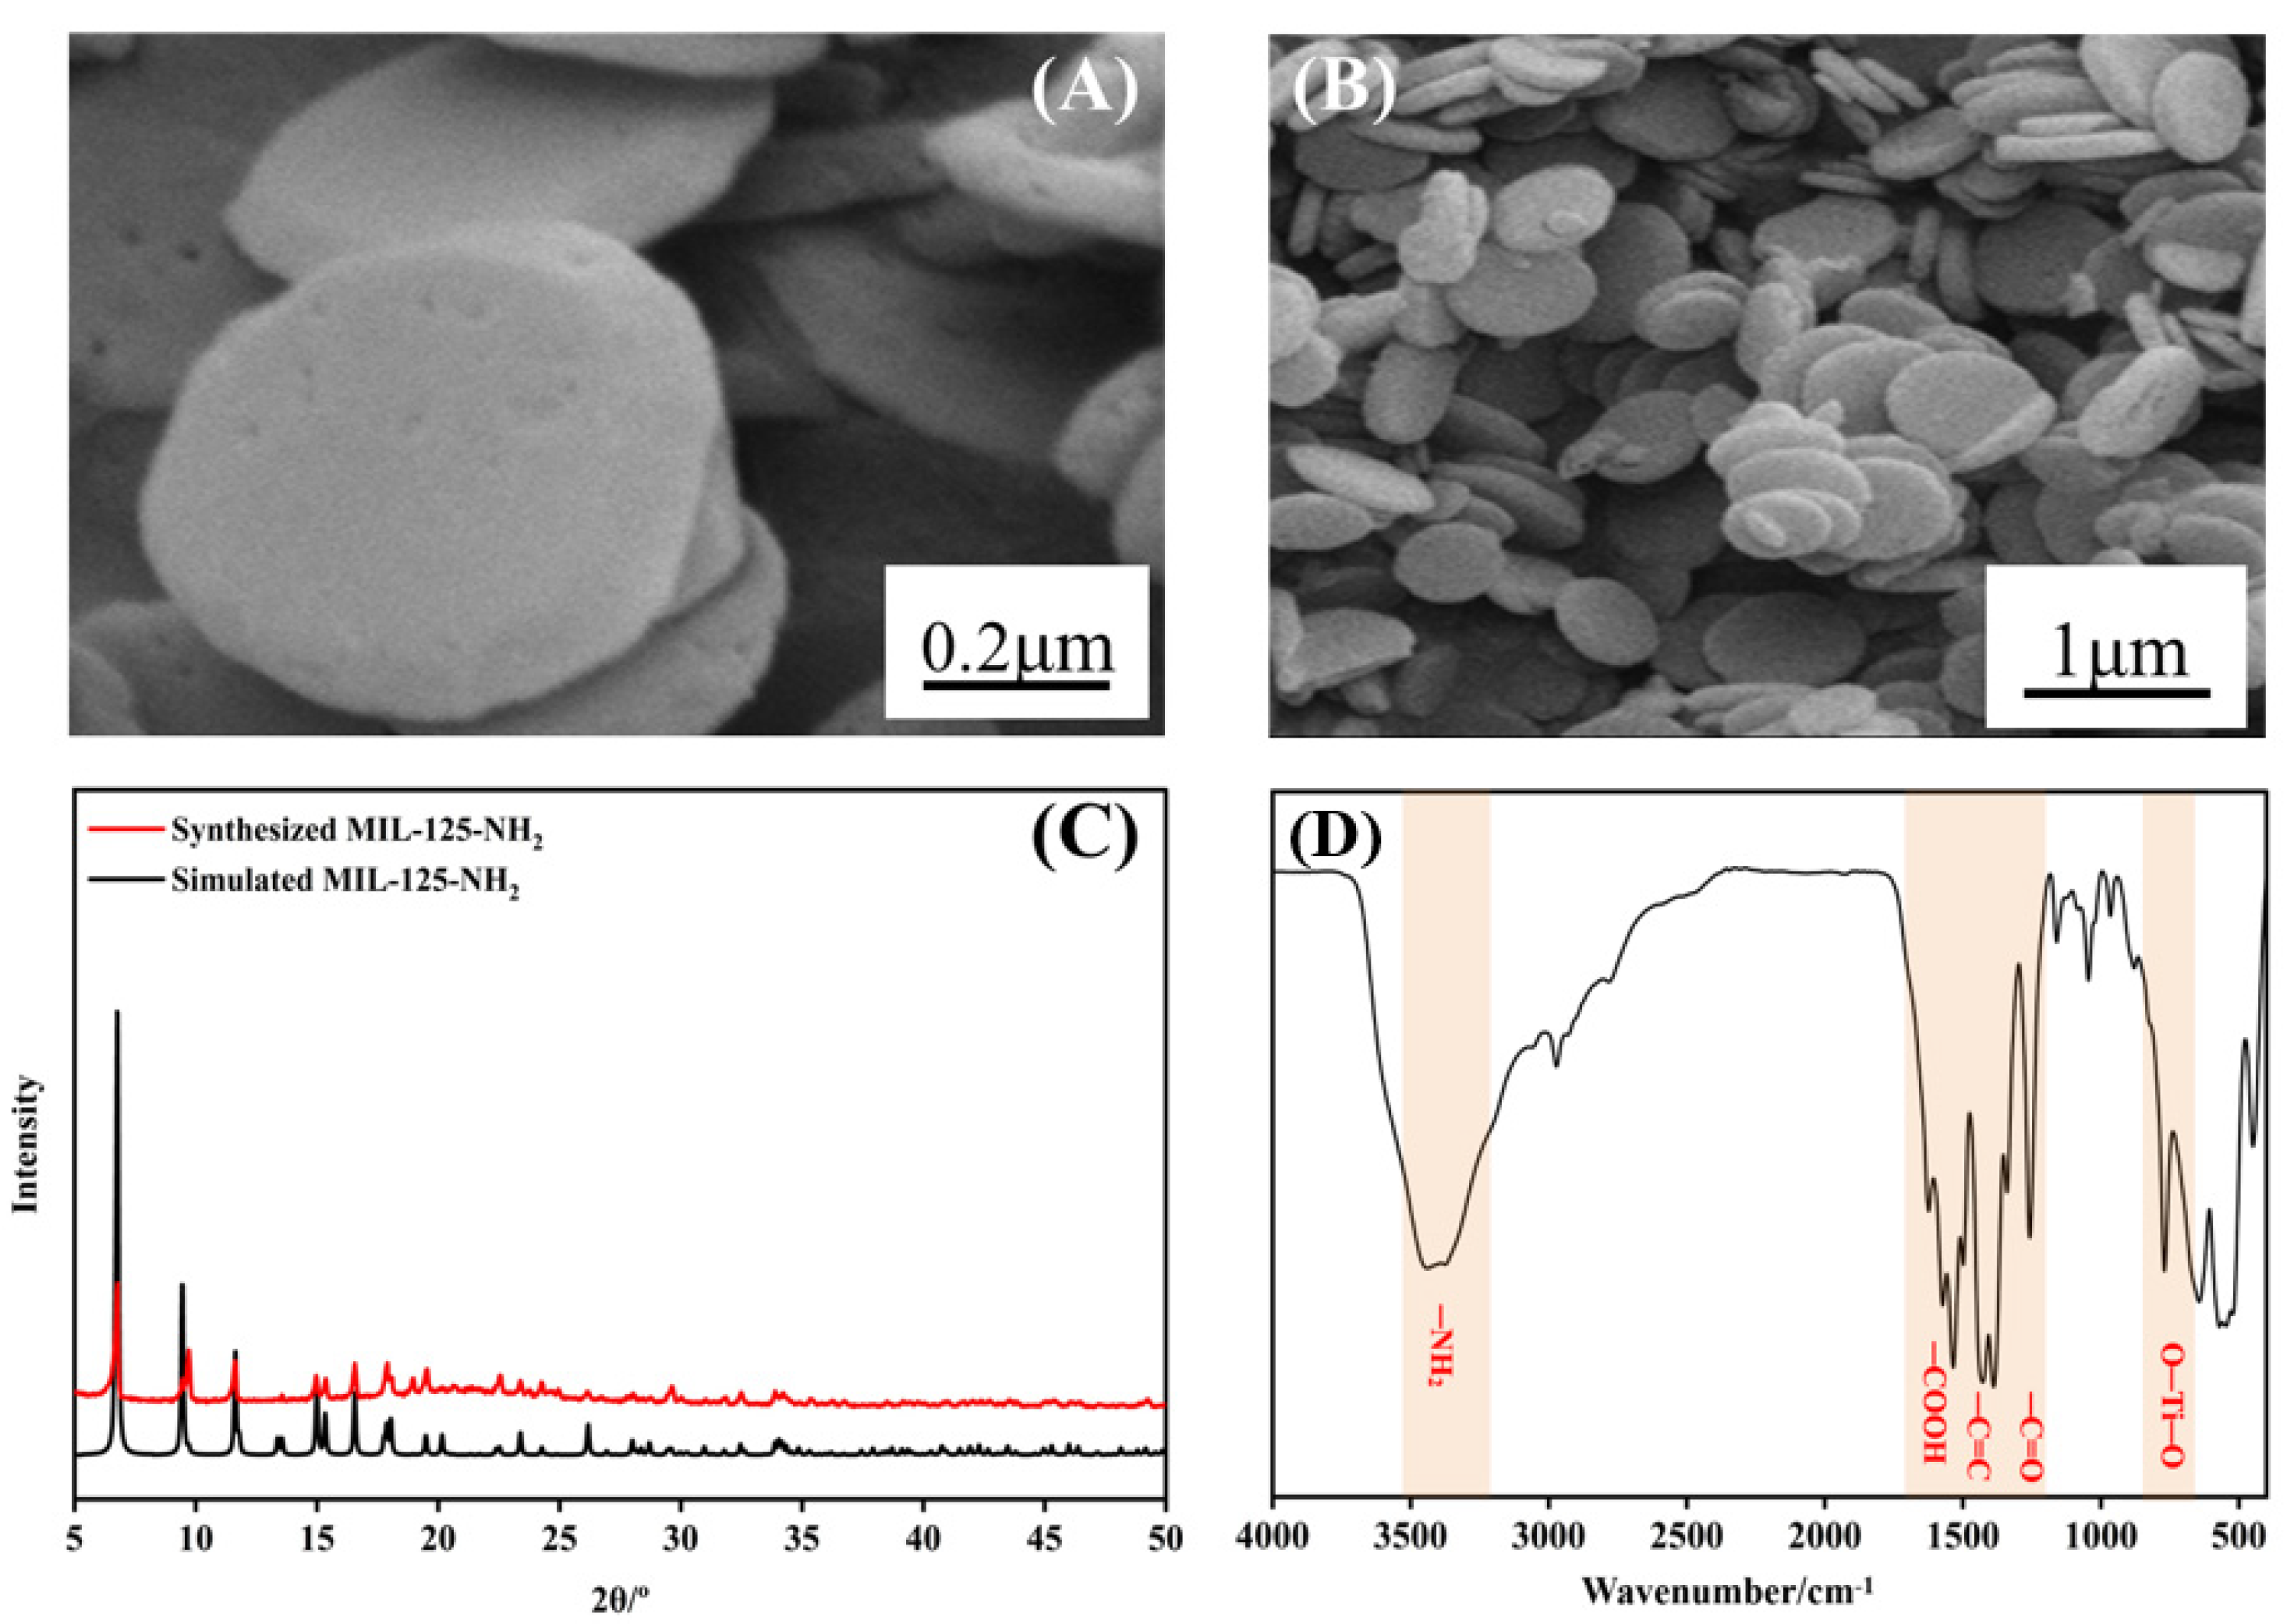
3.1. Characterization of MIL−125−NH2

The morphologies of MIL−125−NH2 at different sizes were observed by SEM, and the results were shown in Figure 2A,B. In Figure 2A,B, it can be seen that the dispersion of the material particles was relatively uniform, the outline was clear, and the material particle size was less than 1 μm, which were conducive to the adsorption of selenium.
The XRD results of MIL−125−NH2 are shown in Figure 2C, from which it can be clearly seen that there were many independent spikes, indicating that the material presents good crystalline properties. By comparing the obtained spectra with the standard spectra, it was found that the peak position, peak relative intensity, and peak shape of the XRD spectra were consistent, which proved that MIL−125−NH2 had been successfully synthesized.
As shown in Figure 2D, the infrared absorption spectrum characterization of MIL−125−NH2 showed that a double peak of −NH2 appeared around 3500 cm−1, and between 1640 and 1350 cm−1, there were −C=C and −C=O on the benzene ring and the coordination structure −COOH stretching vibration peak of Ti [31]. A relatively strong O−Ti−O absorption peak was found at around 770 cm−1 [32].

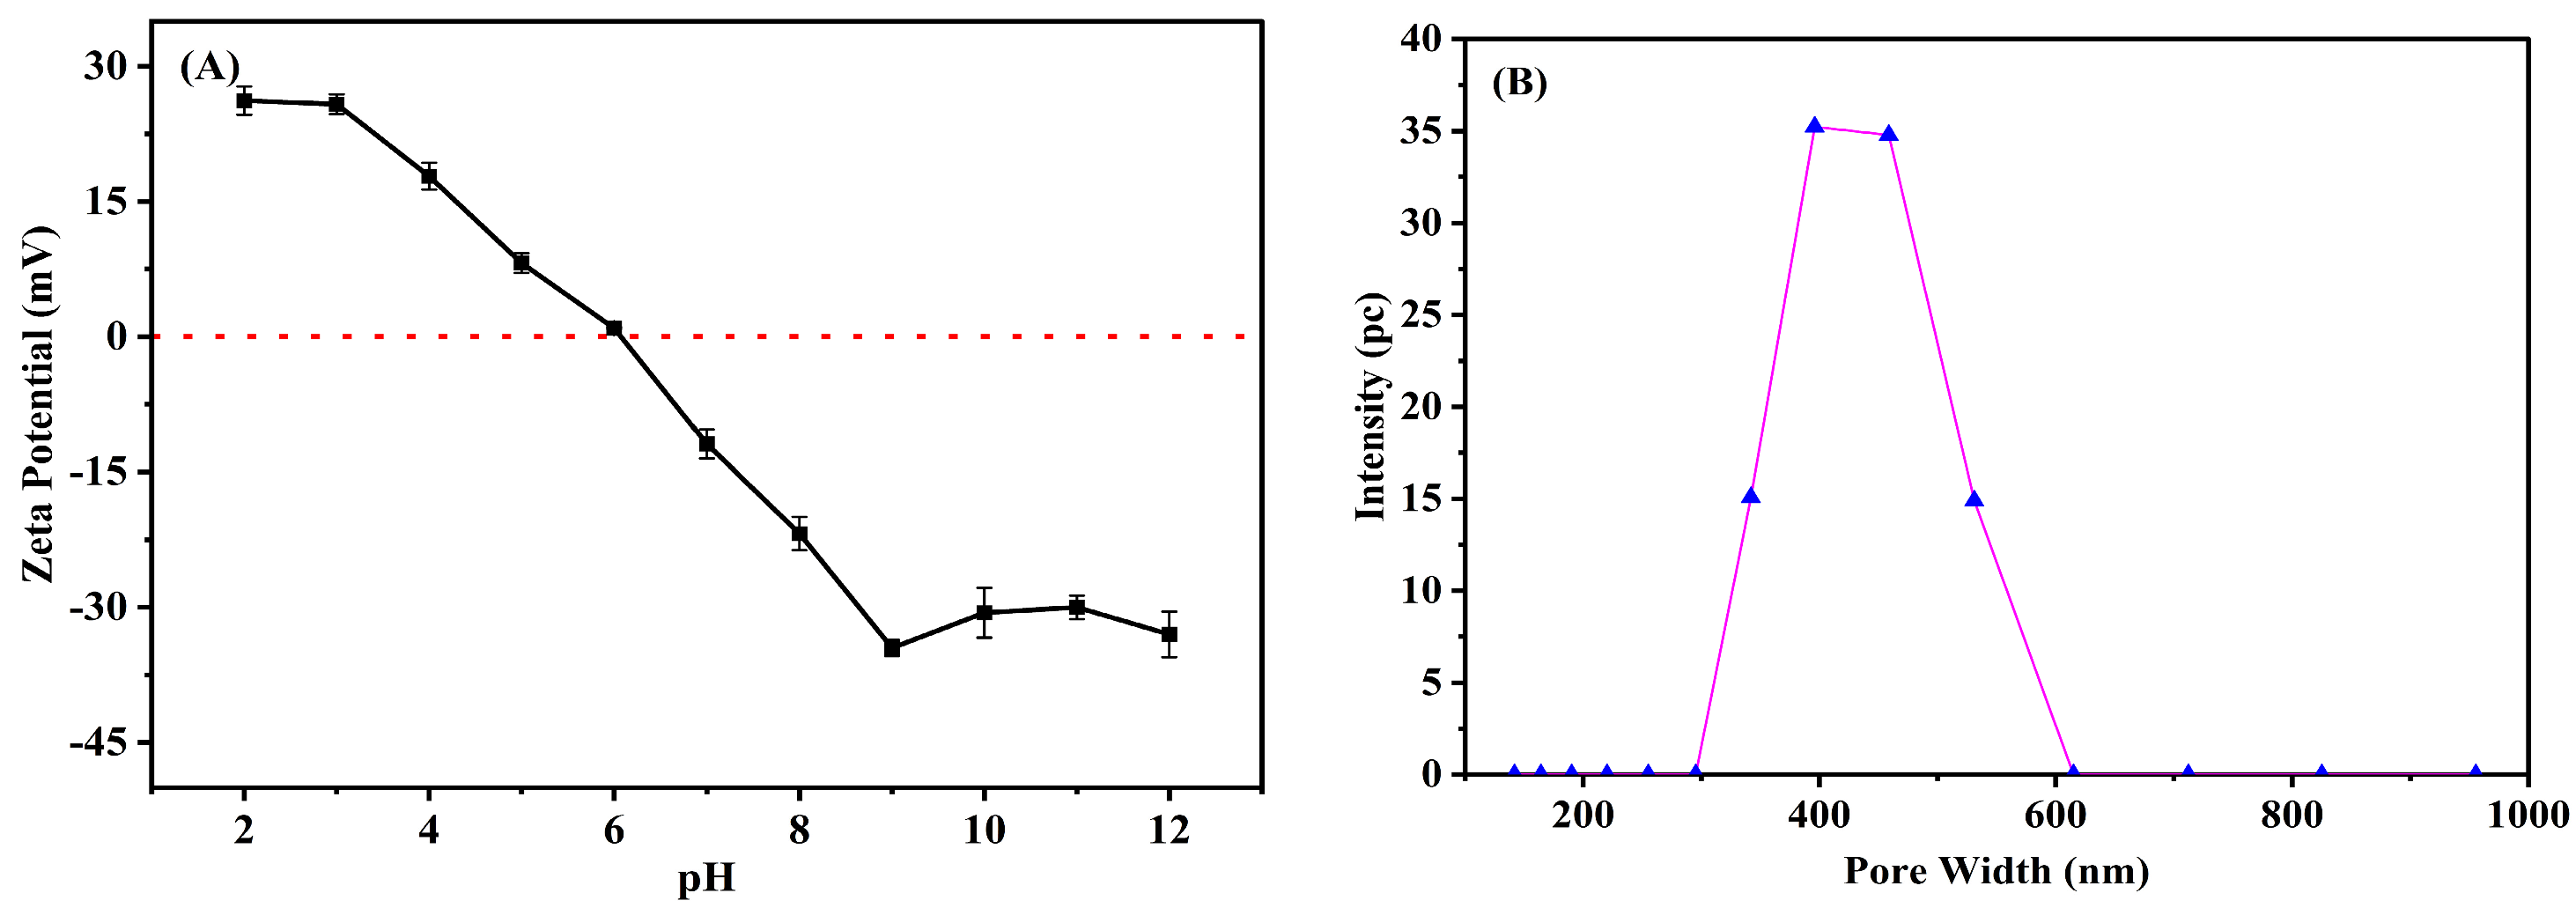
3.2. Zeta Potential and Particle Size

Since electrostatic interactions also play a major role in many adsorption processes, the determination of surface charge can be beneficial to predict the sorption behaviors of materials [33]. The Zeta potential of MIL−125−NH2 was tested at different pH values, and the results are shown in Figure 3A. It can be observed from Figure 3A that the Zeta potential of the material decreased with an increase in pH value, and the isoelectric point (IEP) was about 6.2. When the pH value continued to increase, more and more OH in the aqueous solution were adsorbed to the surface of the material, and the number of negative charges on the surface of the material increased. At this time, Se(IV) in the solution mainly existed in the form of SeO32−, which was not conducive to adsorption. When Ph ≤ 6.2, the surface of the material was positively charged, and Se(IV) in the solution mainly existed in the form of SeO32−, HSeO3, and H2SeO3, which was conducive to adsorption. The result for the particle size test of MIL−125−NH2 was about 400 nm, as shown in Figure 3B, which was consistent with the SEM scanning result.

3.3. Derivative Reaction and Extraction Conditions

The effect of the pH of the solution on the derivative reaction was investigated. According to the step of 2.4, the content of the selenium derivative reaction was measured in the range of pH 1~6. The results were shown in Figure 4A, and the results showed that the content of the selenium derivative reaction was the highest when pH was 1~2.5. When the pH of the solution was adjusted to 1 and the reaction temperature was room temperature, the effect of 2 to 20 min different reaction time on the concentration of piquelenole was measured according to step 2.4. The results showed that there was no significant change in the reaction after 4 min. Therefore, 4 min was selected as the derivation time in the follow−up experiment. In addition, the amount of derivative reagent directly affected the rate and degree of reaction. Under the conditions of a pH of 1 and reaction for 4 min, the influence of the amount of NPDA on the result was discussed. The results are shown in Figure 4C. When 0.1 mol·L1 NPDA was added to 1 mL, the concentration of piaselenole reached the maximum level. The effect of reaction temperature on the results was also investigated in the experiment. The pH of the solution was adjusted to one, the derivational reaction time was 4 min, and the influence of different reaction temperatures at 20~70 °C on the results was measured. The results are shown in Figure 4C, indicating that the derivational reaction temperature had no significant influence on the reaction. Therefore, the room temperature reaction was selected in the follow−up experiment. Finally, five common organic solvents such as n−hexane, cyclohexane, ethyl acetate, benzene, and dichloroethane were investigated as extractants. The extraction volumes were all 5 mL. The relative recovery rate of extraction is shown in Figure 4D, and the results show that cyclohexane had the best extraction effect.

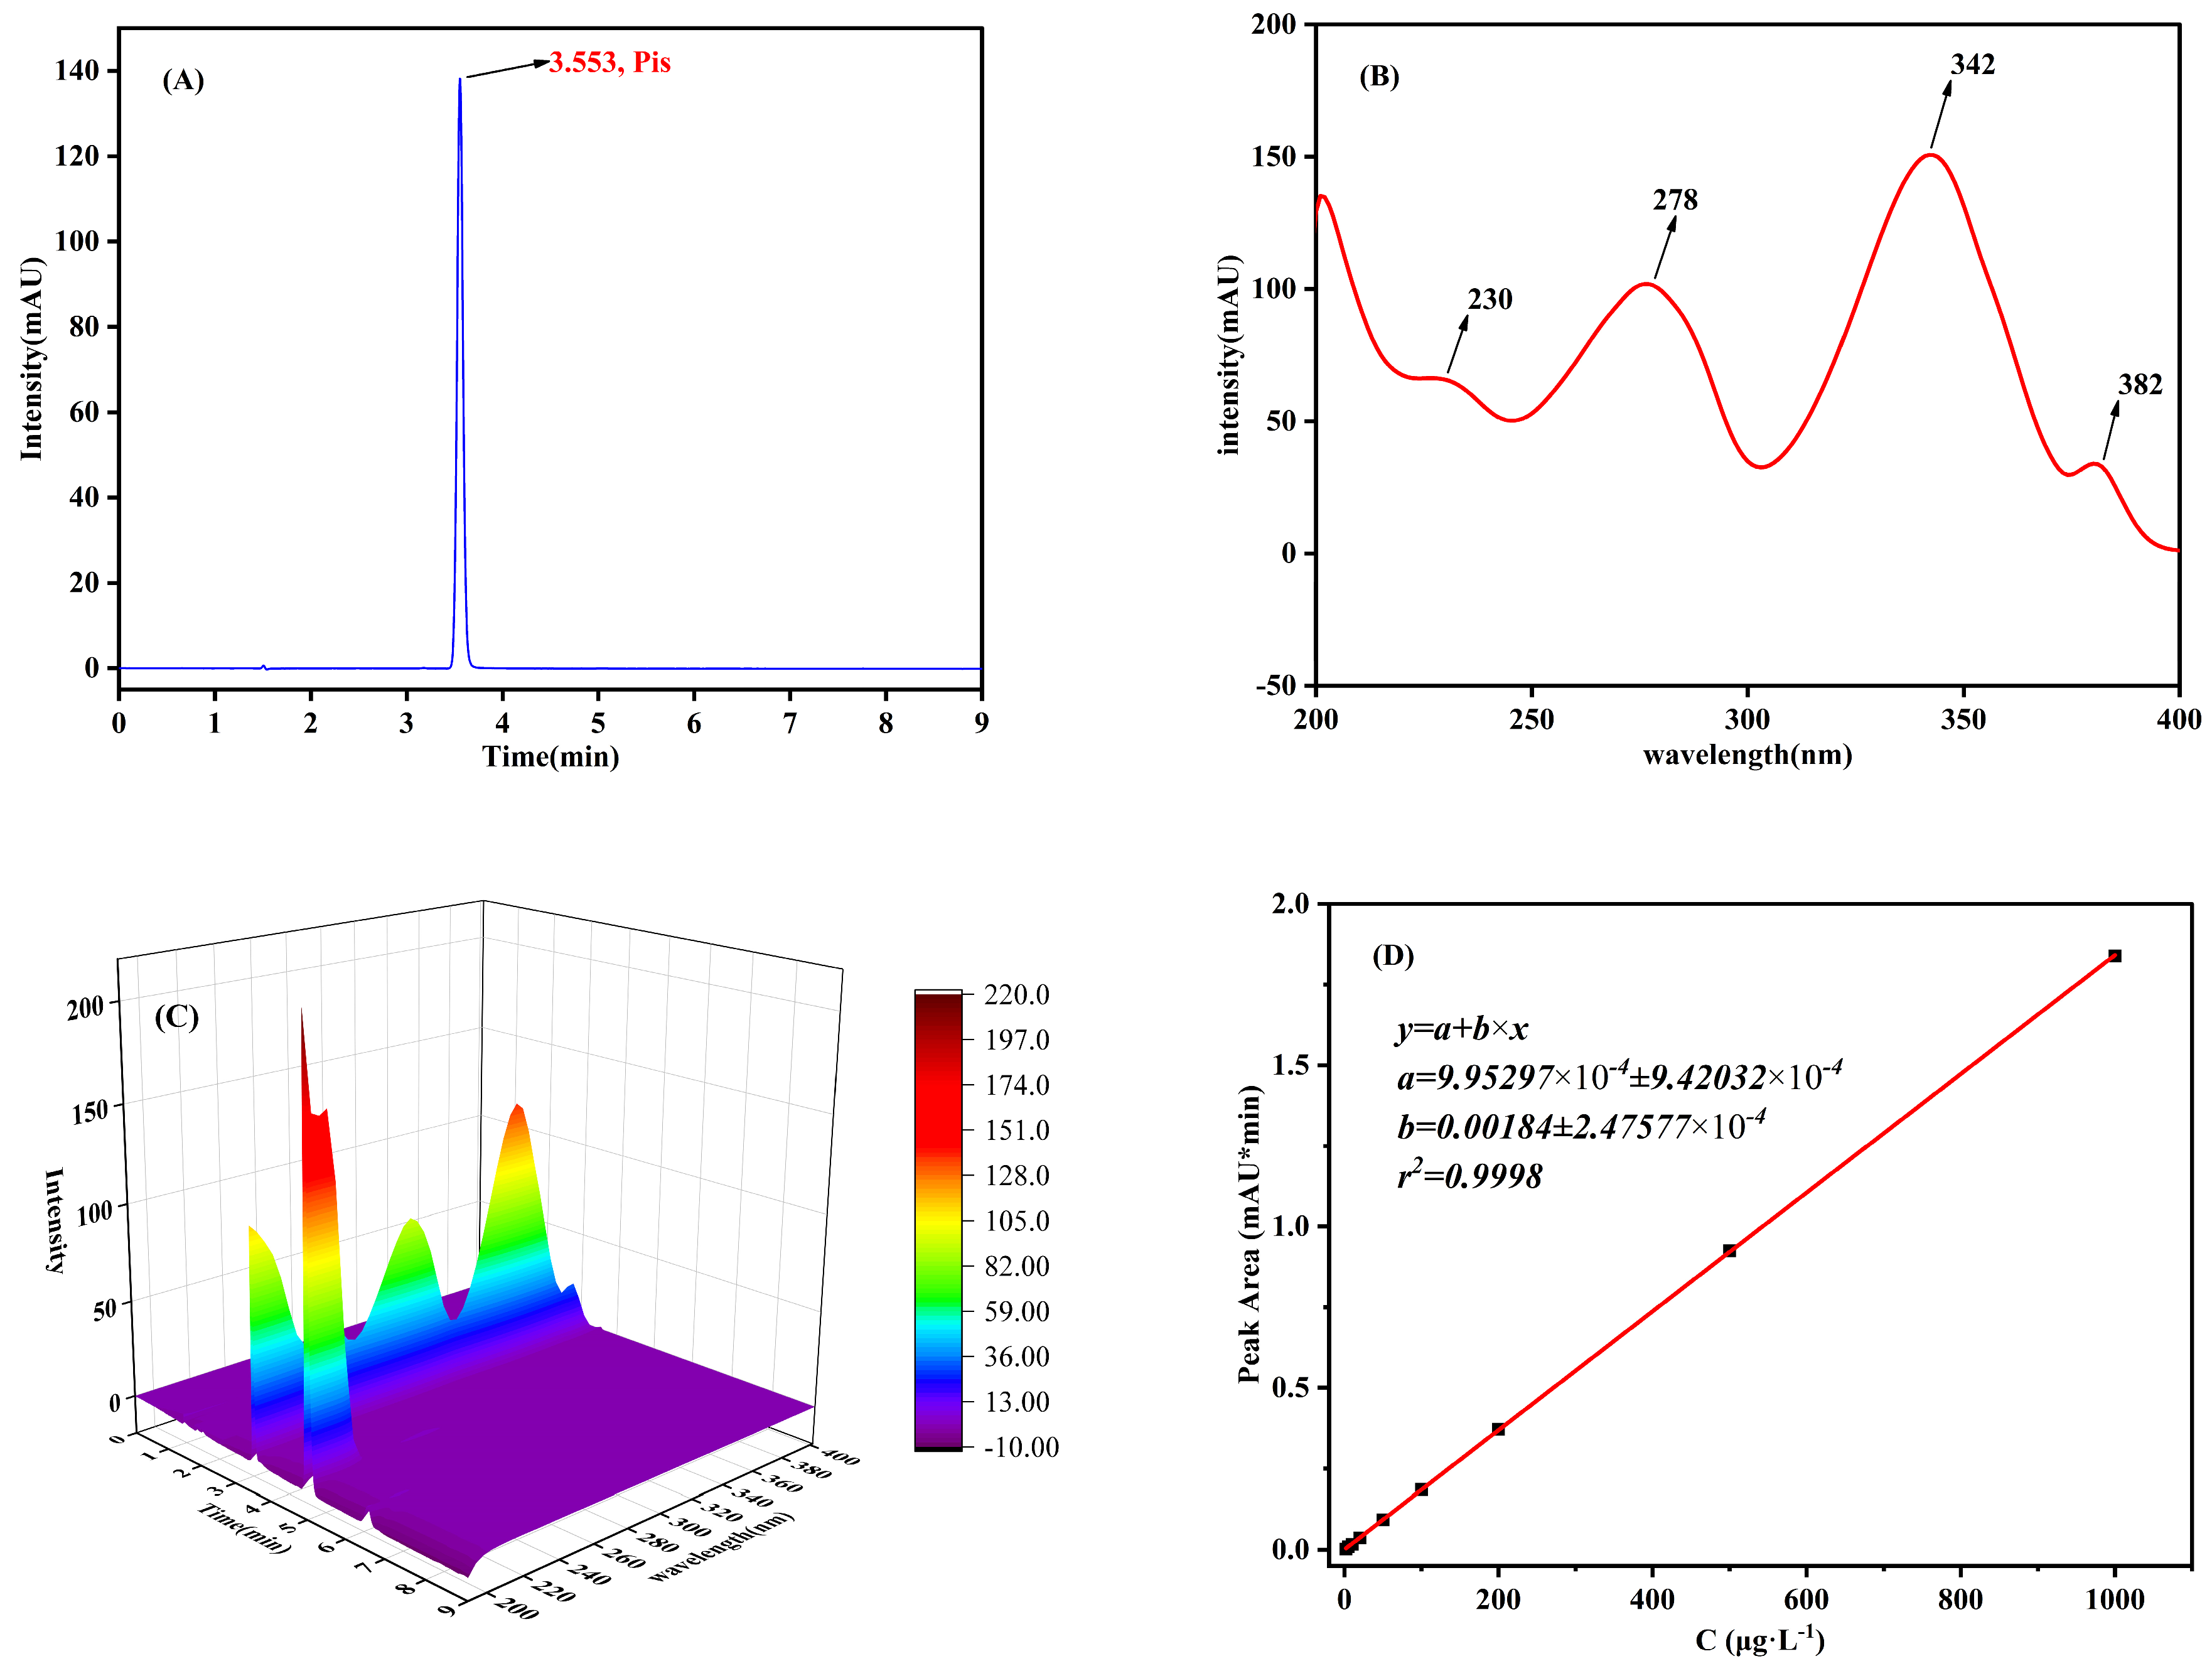
3.4. Analysis Condition

The DAD was used to scan the solution at 2D wavelength of 200~400 nm, and it was detected that the maximum absorption wavelength of the solution was 342 nm, as shown in Figure 5B. Meanwhile, the absorption wavelength of the solution was 3D−scanned in the band of 200~400 nm. The results in Figure 5C show that when the retention time was 3.5 min, the absorption intensity was the highest at 342 nm and there were no other interference peaks. Therefore, 342 nm was selected as the best detection wavelength in the follow−up experiment. Figure 5A is the chromatogram. Finally, the standard series of points in the range of 2~1000 μg·L−1 were prepared, and after the derivative treatment in accordance with step 2.4, the standard curve was established, with the area of piaselenole (mAU*min) as the Y−axis and the concentration of standard solution C (μg·L−1) as the X−axis, as shown in Figure 5D. The correlation coefficient of the calibration curve was R2 = 0.9998.

3.5. MIL−125−NH2 Enrichment Conditions

The change in the pH of aqueous solution had a great influence on the adsorption of selenium by MOF materials. On the one hand, it affected the activity of adsorption sites on the surface of MOF; on the other hand, the form in which selenium existed in different pH solutions was different. Therefore, the adsorption of 200 μg·L−1 selenium solution by MOF materials with pH of 1~12, 15 mg was investigated. The results show that the adsorption effect was best when pH = 6. In addition, the amount of MOF material directly affected the adsorption rate of selenium in water. The experiment compared the adsorption rate of 2000 μg·L−1 selenium in water from 5 mg to 50 mg MOF material. The results showed that when the amount of MOF material was 15 mg, the selenium in water had been fully enriched, and the amount continued to increase without an obvious change. Therefore, the amount of MOF material in subsequent experiments was determined to be 15 mg.

3.6. Adsorption Time and Kinetic Fitting

Twelve selenium solutions of 30 mL 100 mg/L were prepared, the pH was adjusted to six, 15 mg MIL−125−NH2 was added to each solution, and the oscillating time at room temperature was 5–480 min, respectively. Finally, the residual concentration of Se(IV) in the solution was determined by UPLC−DAD, and the adsorption capacity was calculated by Equation (1), as shown in Figure 6. As can be seen from Figure 6, there are more holes and active sites on the surface of MOF at the initial stage of adsorption, and the adsorption is faster. When the adsorption reaches around 50 min, the adsorption becomes slow, and finally reaches saturation. In order to investigate the relationship between the adsorption rate and time of the material, pseudo−first−order and pseudo−second−order kinetic models were used for fitting analysis of the material adsorption process, and the fitting results are shown in Figure 6.
Q t = ( C 0 C t ) V m
where C0 is the initial concentration of selenium, mg/L; Ce is the equilibrium concentration, mg/L; Qt is the adsorption capacity, mg/g; V is the volume of selenium solution, mL; m is the amount of adsorbent added, in mg.
Pseudo−first−order reaction kinetics fitting equation:
lg ( Q e Q t ) = lg Q e k 1 t
Pseudo−second−order reaction kinetics fitting equation:
1 Q t = 1 k 2 Q e 2 + t Q e
where Qe is the equilibrium adsorption capacity (mg/g); Qt is the adsorption capacity (mg·g1) when the adsorption time is t; k1 pseudo−first−order kinetic model constant (min−1); k2 is a pseudo−second−order kinetic model constant (g·mg1·min1). The fitting results show that the fitting coefficient, R2 = 0.995 of MIL−125−NH2, of the pseudo−second−order kinetic model was more relevant than that of the pseudo−first−order kinetic model. Therefore, the pseudo−second−order kinetics more accurately describes the adsorption of selenium by MIL−125−NH2.

3.7. Se(IV) Isothermal Adsorption and Thermodynamic Fitting

A total of 15 Se(IV) solutions of 0.2–200 mg/L were prepared, each of 30 mL, and each of which was added with 15 mg MIL−125−NH2. The pH was adjusted to six, and the solution was oscillated at room temperature for 7 h. Finally, the residual concentration of Se(IV) in the solution was determined by using UPLC−DAD, and the adsorption capacity was calculated by Equation (1). The result is shown in Figure 7. As can be seen from Figure 7, the adsorption capacity of the material for Se(IV) gradually increased with an increase in the mass concentration of Se(IV), and finally reached equilibrium. The Langmuir isotherm adsorption model and Freundlich isotherm adsorption model were used to describe the adsorption behavior of selenium.
The Langmuir adsorption isotherm model is:
1 Q e = 1 Q max + 1 k l Q max C e
where Ce is the adsorption equilibrium concentration of Se (mg·L1), and Qe is the equilibrium adsorption capacity (mg·g1). Qmax(mg·g1) and kl are the maximum adsorption capacity and equilibrium constant (L·mg1), respectively.
The Freundlich adsorption isotherm model is:
ln Q e = ln k f + 1 n ln C e
where kf is Freundlich constant (mg1−1/n·L1/n·g); 1/n is an inhomogeneous factor, indicating the degree of adsorption. The fitting results are shown in Figure 7. The Langmuir isotherm adsorption model R2 = 0.985 for MIL−125−NH2 was greater than that for Freundlich isotherm adsorption model R2 = 0.961. Therefore, the adsorption process was more consistent with the Langmuir isotherm model, with a Qmax of 78.1 mg·g1.

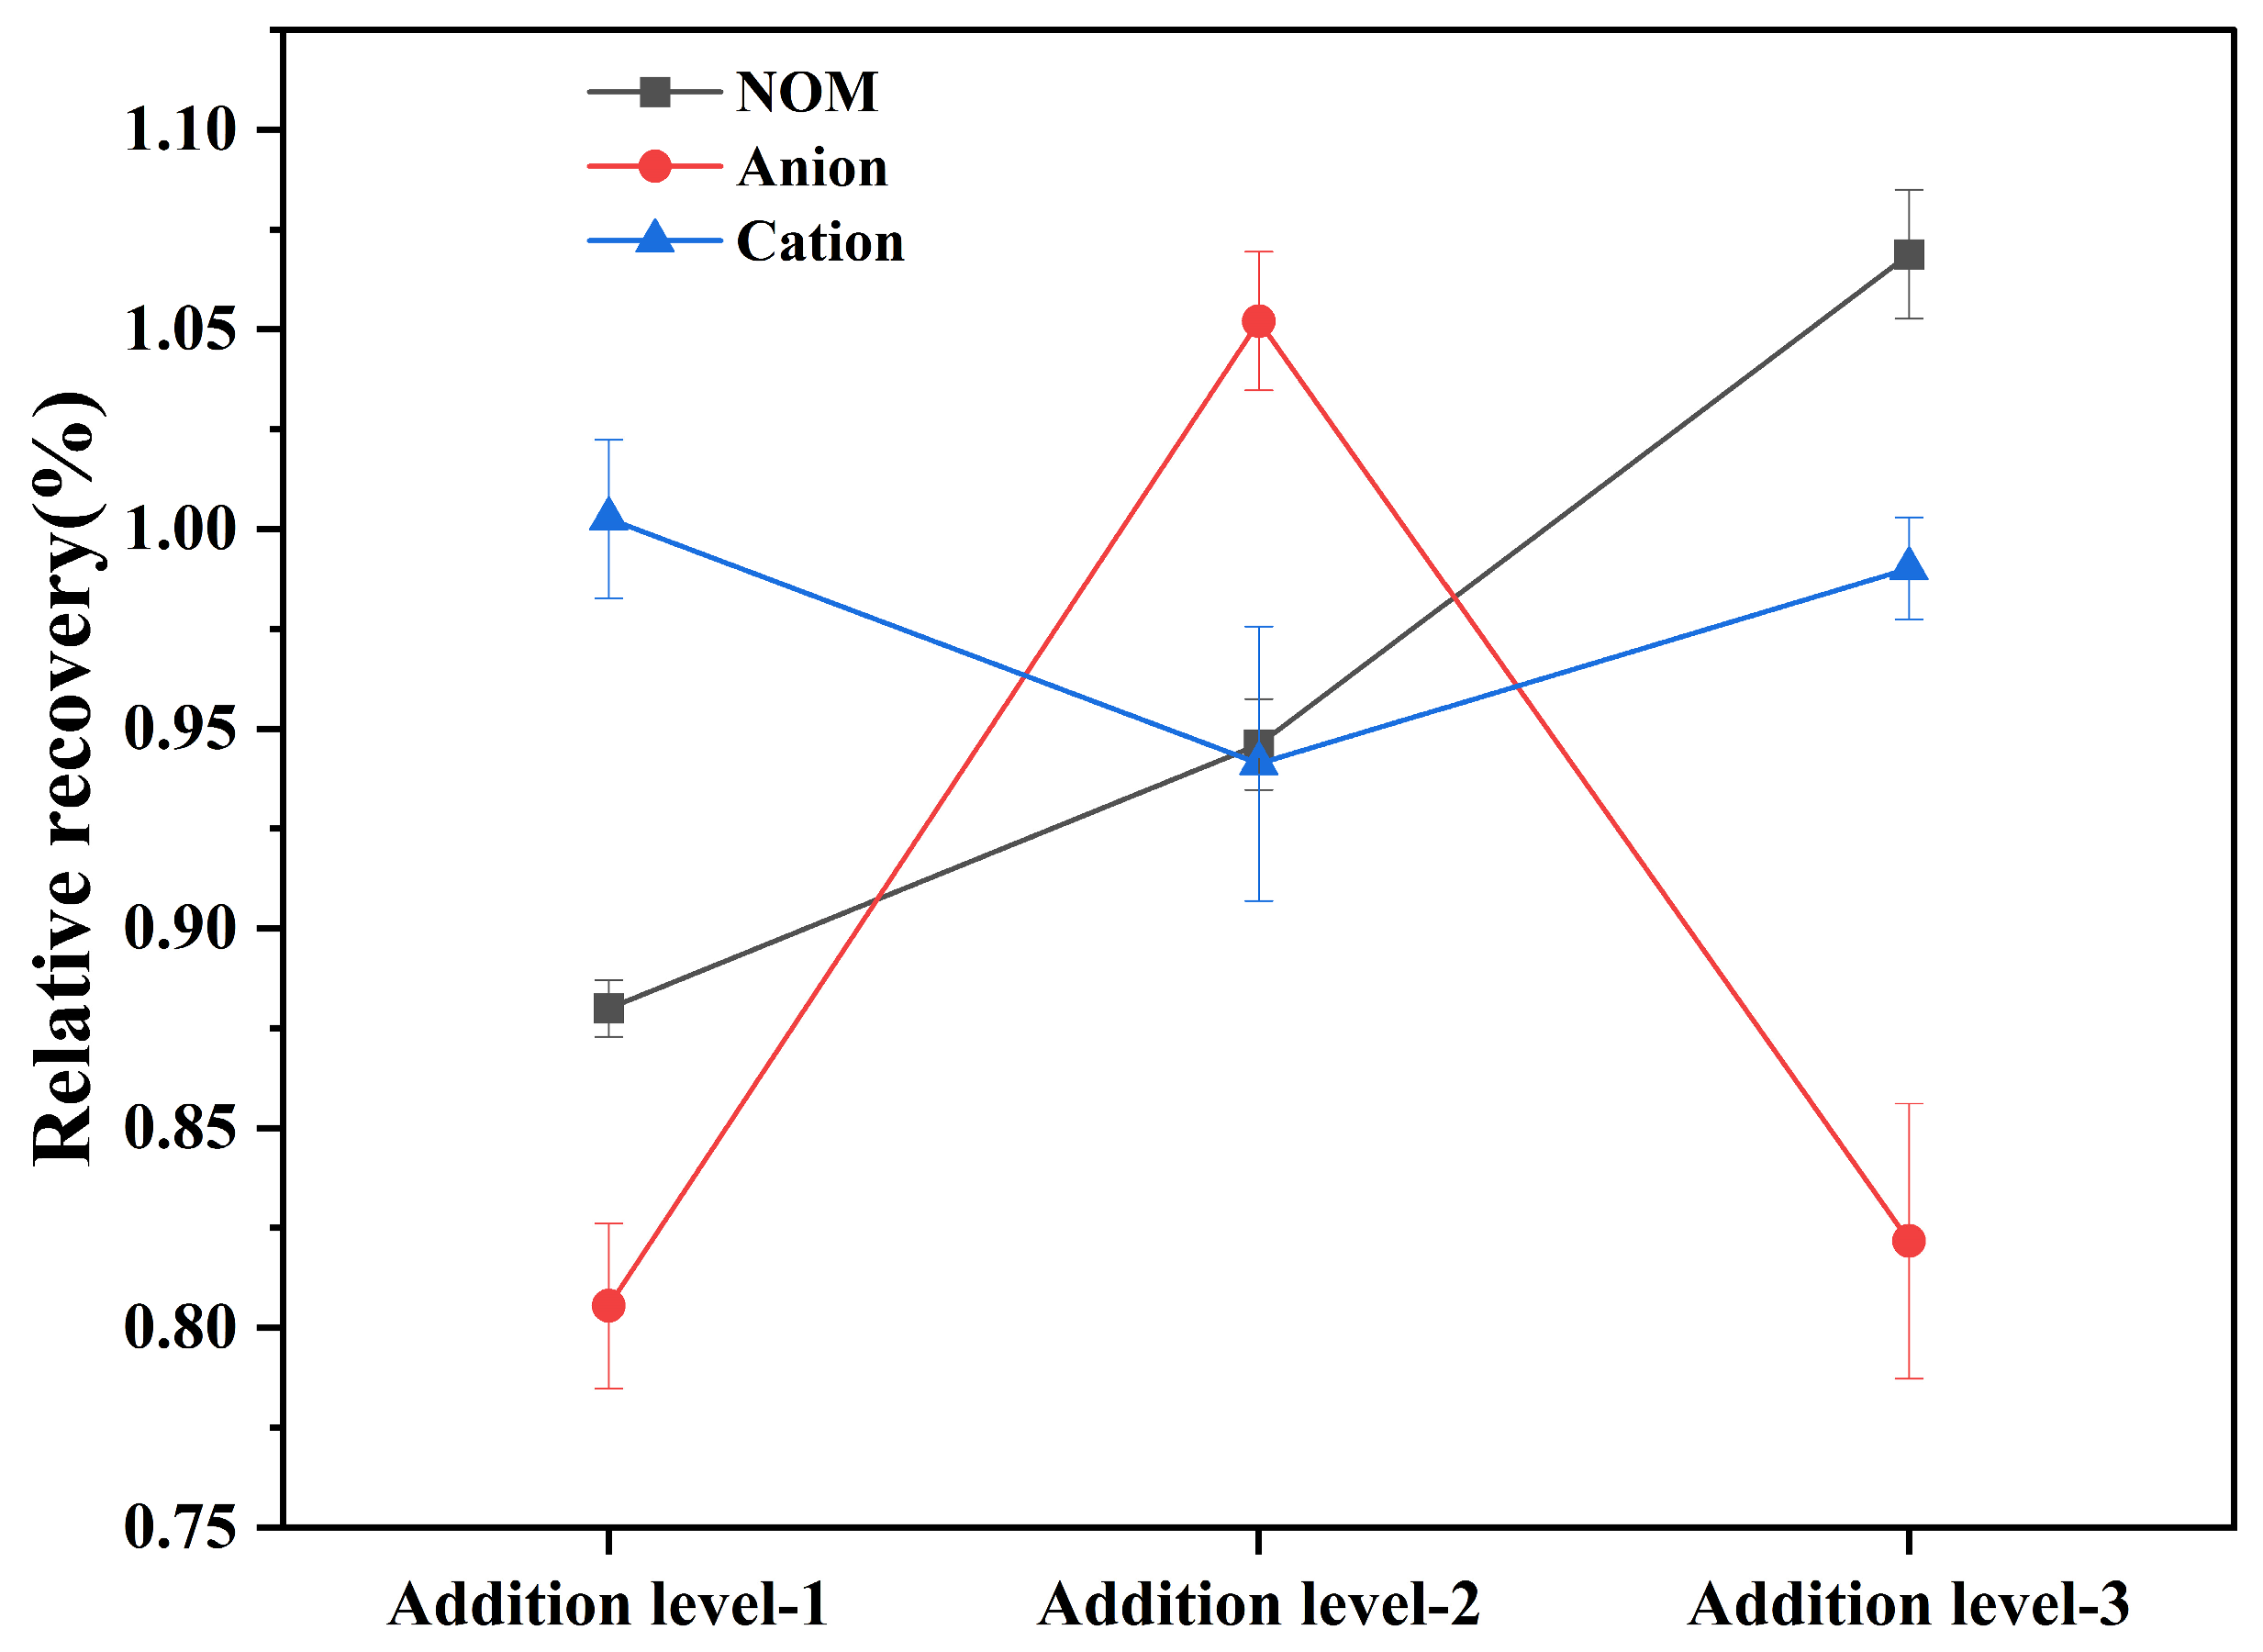
3.8. Interference from the Adsorption Environment
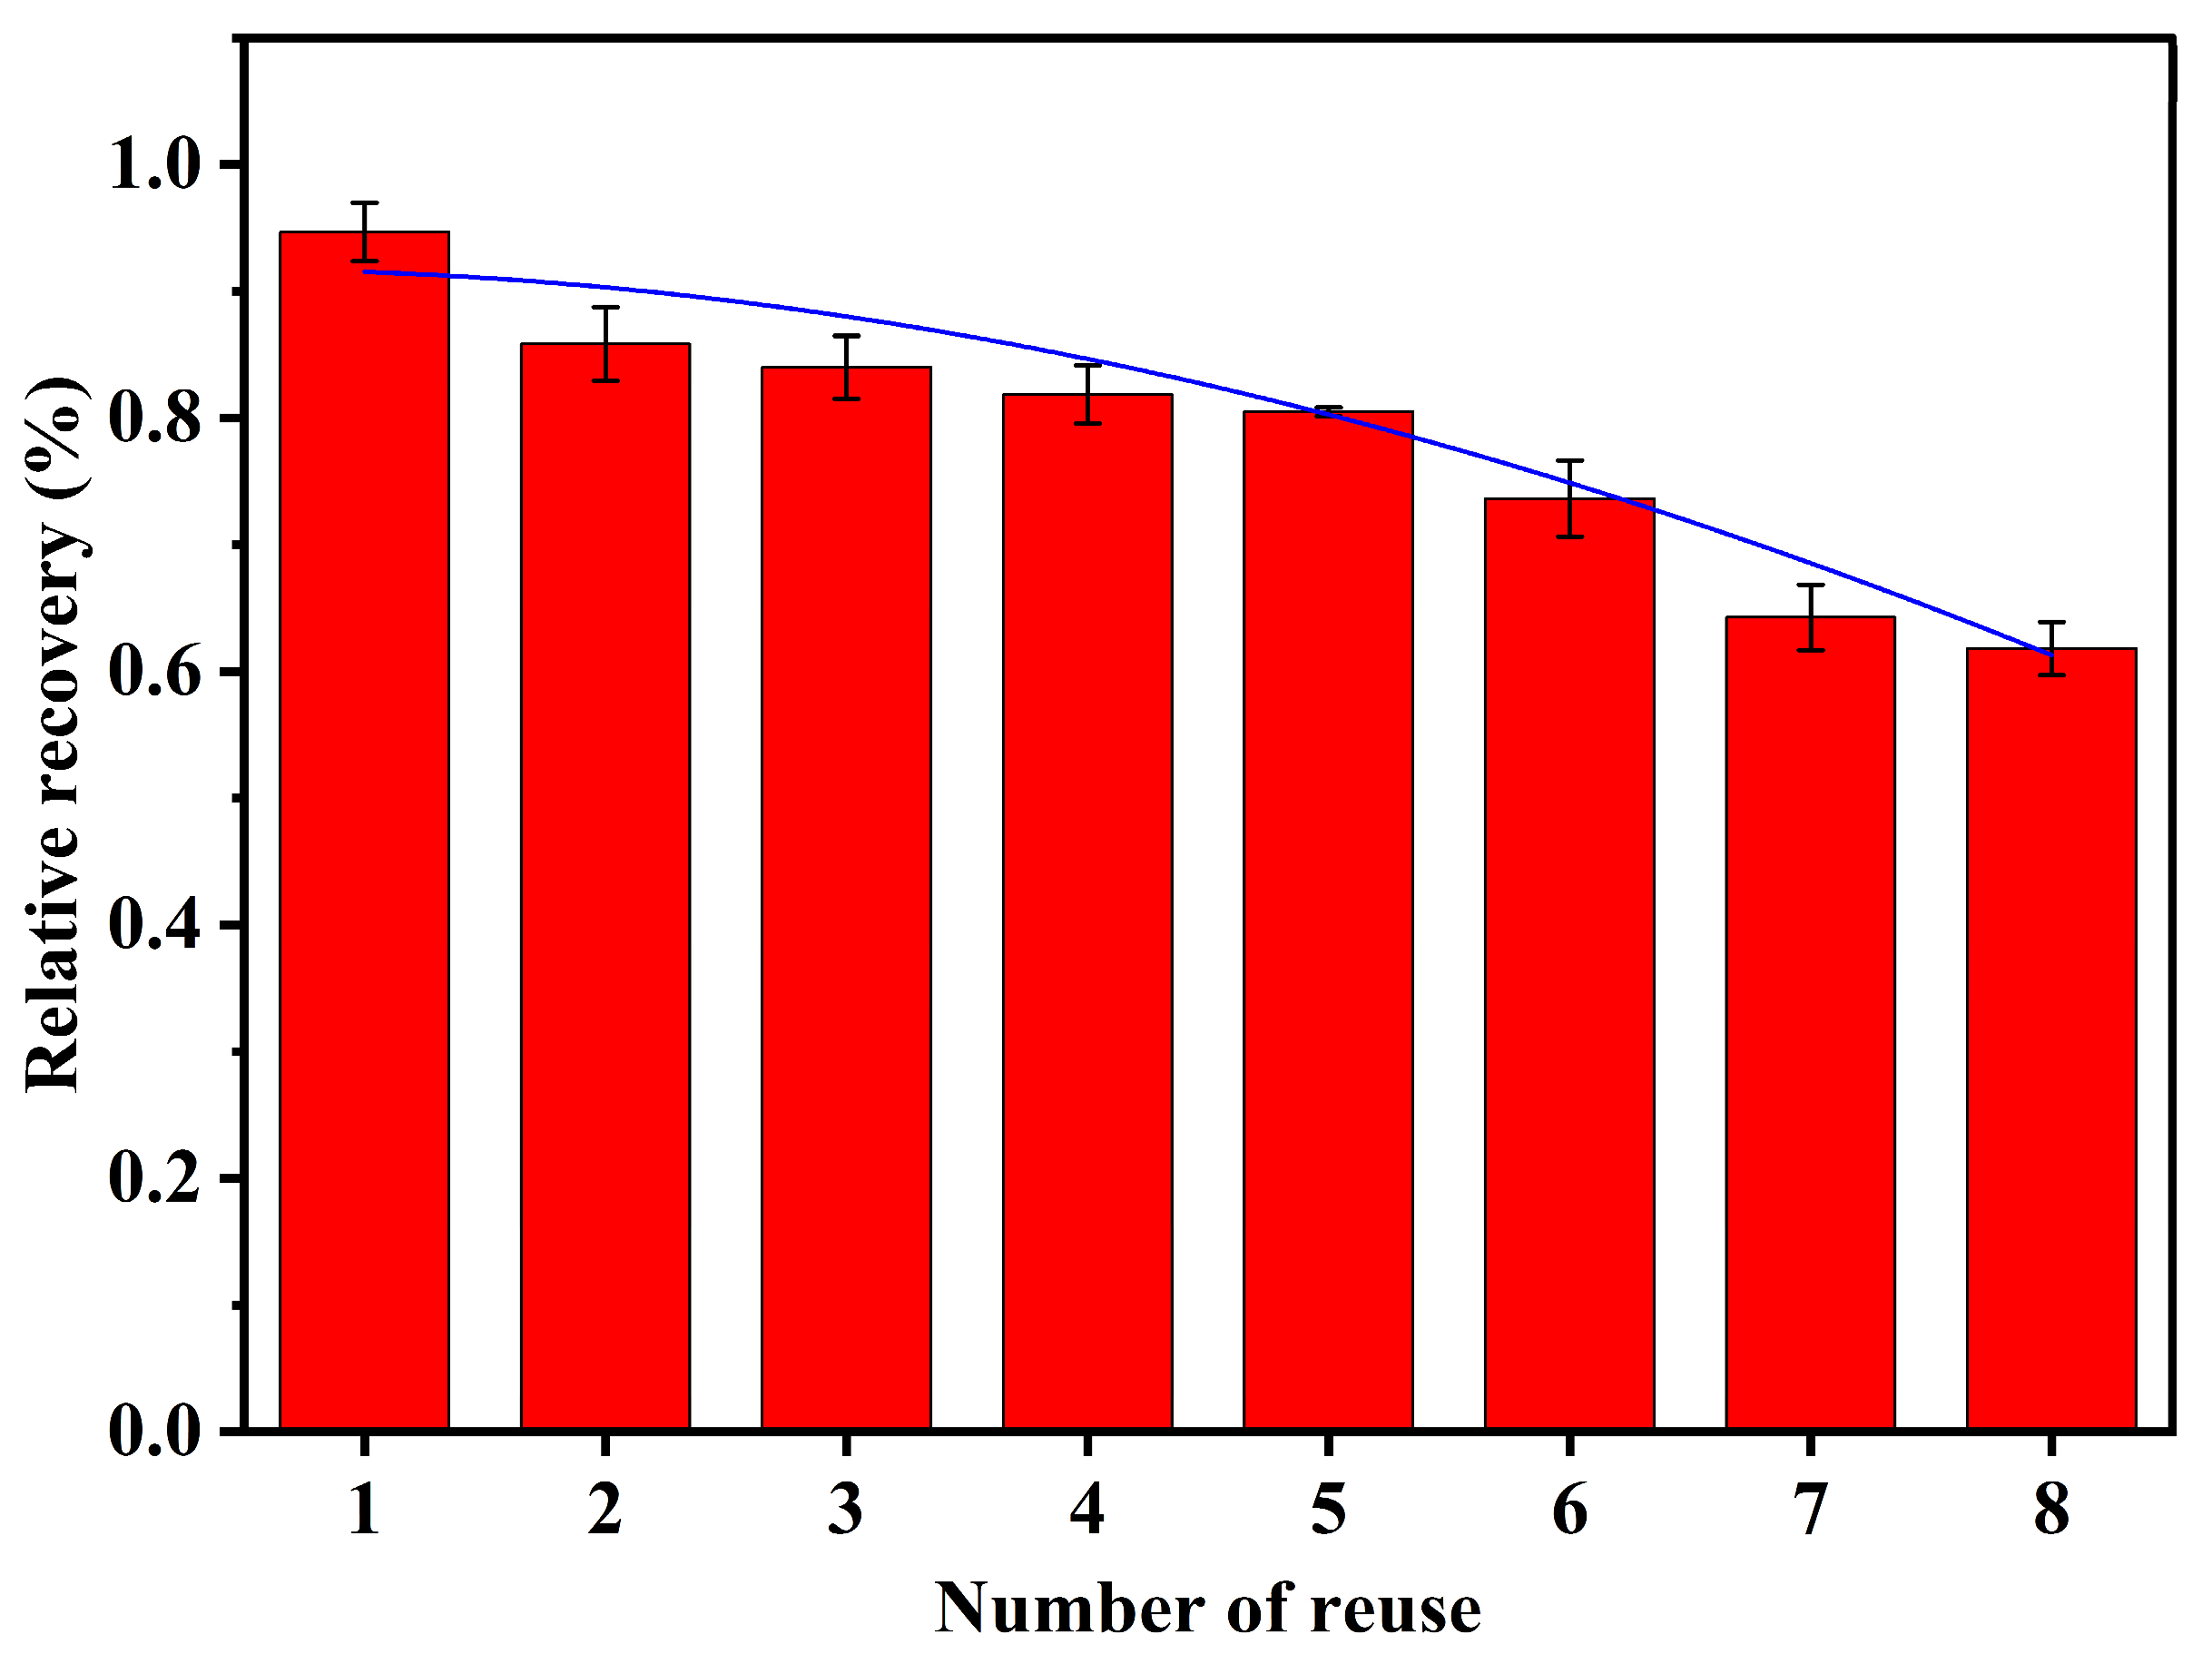
Adsorption experiments were often carried out in some complex environments, such as natural organic matter (NOM), anions, and cations in water, which might interfere with the adsorption effect. So instead of natural organic matter, we used swamp water, simulated anions with SO42−, F, Cl, NO3, NO2, I, Br, K+, Ca2+, Na+, Mg2+, and simulated cations with Cd2+, Zn2+, Ni3+, Mn4+, Cu2+, Ba2+, NH4+,Cr3+, Sc3+, Three levels of low, medium, and high were used to investigate. The result is shown in Figure 8. It can be seen from Figure 8 that natural organic matter, anions, and cations have no obvious interference on the adsorption performance of the material, and the relative recovery rate is between 80 and 110%, with a satisfactory result.

3.9. Material Reuse

The Se(IV) adsorption material was soaked with dilute hydrochloric acid, and the coordination ability of metal ions was reduced under the condition of low pH, so the Se(IV) desorption was realized on the MOF material. After being reused eight times, the results were obtained, as shown in Figure 9. The results showed that MIL−125−NH2 still had a certain adsorption capacity, although the adsorption capacity was reduced after eight times of reuse. In many studies, the stability of MOF materials is a major challenge in its application. Due to the influence of environmental factors such as temperature and humidity, the stability of MOF materials is easy to change, which affects its use properties, so it is necessary to further modify MOF materials.

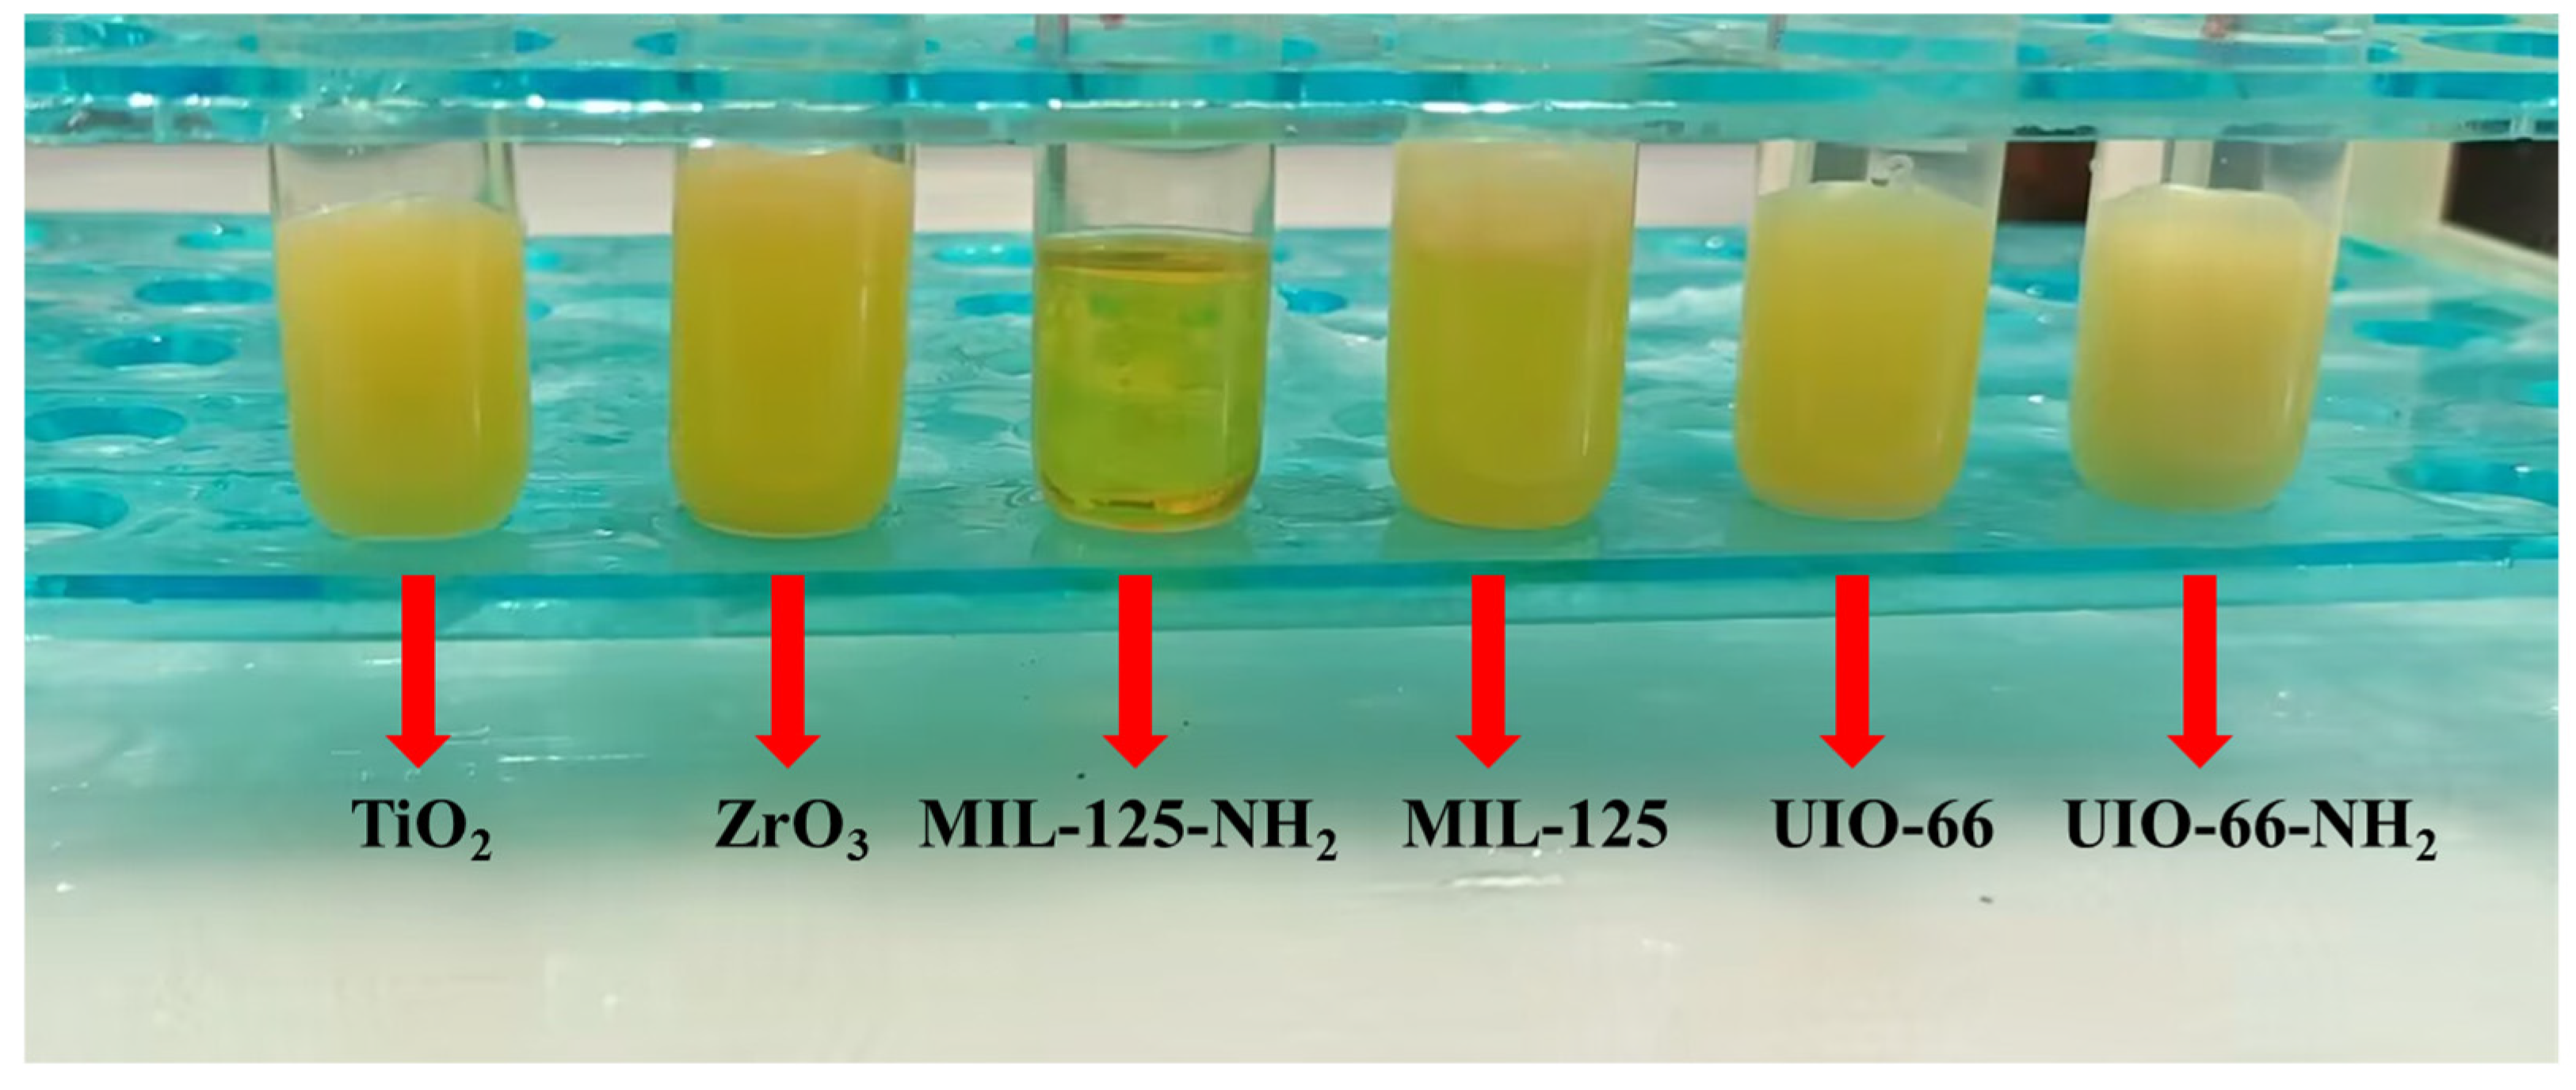
4. Adsorption Material Comparison

The experiment compared six kinds of common adsorbent materials, such as TiO2. To each material, we added 50 mL 500 μg·L−1 Se(IV) solution, adsorbed Se(IV), centrifuged, and then added 5 mL 0.1 mol·L−1 HCl solution and 5 mL NPDA. After the derivative reaction under optimized experimental conditions, the concentration of piaselenole was measured. Each material was repeated three times, and the results are shown in Table 2. The results show that the recovery rate of MIL−125−NH2 was the best, but the detected results in the table are the results of the adsorption material and the derivative reaction process at the same time. The six materials were dissolved with 0.1 mol·L−1 hydrochloric acid after the adsorption of selenium, so the amount of selenium released by different materials may be different, thus affecting the recovery rate of selenium. In addition, by comparing the six materials, it was found that the lower layer solution of MIL−125−NH2 was uniformly dispersed after extraction with cyclohexane after the derivative reaction, while the other materials showed obvious turbidity and agglomeration phenomenon, as shown in Figure 10. Based on this phenomenon, it was speculated that the compatibility between the material and the solvent was different, resulting in the final derivative effect being poor. Therefore, MIL−125−NH2 has obvious advantages over other materials.

4.1. Comparison of Methods

In nature, there are six kinds of stable isodigits of Se, among which 78Se and 80Se are naturally abundant. When ICP−MS was used to determine Se, there was multiple germplasm spectrum interference, as shown in Table 3. It can be seen from Table 3 that 78Se and 80Se are the strongest ICP−MS signals, but molecular ions such as 38Ar38Ar+, 36Ar40Ar+, 38Ar40Ar+, and 40Ar40Ar+ generated by argon ionization interfere with the determination of 78Se and 80Se.
Three real river water samples were detected by ICP−MS, AFS, and UPLC−DAD with 3.0 μg/L In as the internal standard, and interference ions were detected by ion chromatography (IC, Dionex ICS−6000) and an inductively coupled plasma optical emission spectrometer (ICP−OES). In order to reduce the influence of interference, 82Se with lower abundance was selected as the target. The results are shown in Table 4. It can be seen from Table 4 that the detected value of ICP−MS was larger than that of AFS and UPLC−DAD, and the main interference in Se included Ca, SO42−, Cl, and Br, while other ions had less influence on the determination due to their low content. However, it has been proven in previous experiments that when these ions coexist with Se, the DAD detection after adsorption by MIL−125−NH2 does not interfere with the quantification of Se. However, it has also been proven in previous experiments that when these ions coexist with Se, the quantification of Se is not interfered with by using UPLC−DAD detection.
In the experiment, a blank tap water sample was selected, and three standard target concentrations of 10 μg·L−1, 25 μg L−1, and 100 μg·L−1 were added. After six parallel determinations, the precision (RSD) of the method was between 0.7% and 2.7%, and the recovery rate was between 87.8% and 102.1%. A certain amount of selenium was added to the blank tap water sample. When the parallel determination times was n = 10 and the confidence level was 99%, t = 2.821, Equation (6) was used to calculate the detection limit (MDL), and four times the detection limit was used as the quantitative limit. The results in Table 5 showed that the detection limit of this method after 10 times enrichment was 0.013 μg·L−1, which was much lower than the detection limit of 0.1 μg·L−1 of selenium in the current national standard GB/T 5750.6−2023 [34] by ICP−MS, but the cost of using this method is much lower.
M D L = t ( n 1 , 0.99 )   × S
where S is the standard deviation of the n parallel detection.
This method was compared with other analysis methods, as shown in Table 6. it is found that this method has ultra−low LOD, and can be applied to the detection of selenium in various water samples.

4.2. Determination of Real Water Samples

The method was applied to detect the real water samples of tap water, river water, mountain spring water, selenium−rich mineral water, industrial wastewater downstream, etc. In Table 7, the results showed that the concentration of selenium−rich mineral water was 0.029 mg·L−1, which was consistent with the label value, the concentration of industrial wastewater downstream was 0.015 mg·L−1, and the samples recovery rate were ≥88%. This method was suitable for the determination of selenium in water.

5. Conclusions

The maximum adsorption capacity of MIL−125−NH2 synthesized by the microwave method for selenium in water was 78.1 mg/g. It could be reused, and its performance was better than that of traditional adsorption materials. It was used to enrich and desorption selenium in water, and then derivatively react with 4−nitro−o−phenylenediamine (NPDA) to produce piquelenole with strong ultraviolet absorption. Finally, the content of piquelenole was detected by UPLC−DAD. The method can effectively separate impurities and target substances using a chromatographic column, thus improving the qualitative and quantitative accuracy. In addition, the spectral pattern and retention time could be simultaneously characterized to avoid false positives. The results showed that the linear relationship of R2 > 0.999, with a recovery rate over 80%. When Se(VI) was enriched 10 times, the detection limit of the method was 0.013 μg·L−1, which was lower than that of the ICP−MS method (0.1 μg·L−1), but the instrument was cheaper than ICP−MS, the usage cost is cheaper, and ICP−MS was prone to matrix interference. In addition, increasing the amount of MOF material could also achieve a lower detection limit. In summary, after MIL−125−NH2 enrichment of selenium in water and NPDA derivatization, the detection method of UPLC−DAD was feasible.
Finally, due to the photocatalytic performance of MIL−125−NH2, further studies should be conducted on its catalytic reduction in Se(VI), As(V), and other ions, combined with the detection of UPLC−DAD.

Author Contributions

Conceptualization, H.G. and H.J.; methodology, H.C. and H.G.; validation, P.W.; date curation, H.C. and Y.L.; formal analysis, Q.W.; writing—original draft, H.C.; writing—review and editing, H.C. and Z.S.; supervision, Z.S. and J.Z.; project administration, J.Z.; funding acquisition, J.Z. and Z.S. All authors have read and agreed to the published version of the manuscript.

Funding

This work was financially supported by the Science and Technology Project of Sichuan Province (No. 2024JDKY0008), and the Chengdu Science and Technology Project (No. 2022−YF05−00996−SN).

Data Availability Statement

Data are contained within the article.

Conflicts of Interest

Author Hanqing Cai was employed by Sichuan Sainasi Analysis and Testing Company Limited. The remaining authors declare that the research was conducted in the absence of any commercial or financial relationships that could be construed as a potential conflict of interest.

References

  1. He, J. The present situation of drinking water quality testing and the improvement of measures. Clean. World 2024, 40, 136–138. [Google Scholar]
  2. Ekwonna, T.; Akindeju, O.; Amos, B.; Lin, Z.Q. Selenium Removal from Wastewater by Microbial Transformation and Volatilization. In Advances in Biochemical Engineering/Biotechnology; Springer: Berlin/Heidelberg, Germany, 2024; pp. 1–12. [Google Scholar]
  3. Abdolmajid, F.; Abdollah, M. Selenium Removal from Water and Wastewater by Different Technologies: A Systematic Review. Iran. J. Public Health 2023, 52, 64–77. [Google Scholar]
  4. Ganjar, F.; Rahmat, H.; Saleh, T.A. Synthesis of magnetic manganese−based adsorbent for rapid adsorption of selenium ions from water. Environ. Nanotechnol. Monit. Manag. 2023, 20, 100796. [Google Scholar]
  5. Zhou, J.; Gu, S.X.; Xiang, Y.Q.; Xiong, Y.; Liu, G.Y. UiO-67: A versatile metal-organic framework for diverse applications. Coord. Chem. Rev. 2025, 526, 216354. [Google Scholar] [CrossRef]
  6. Gao, T.H.; Yuan, J.W.; Xu, W.Y.; Hao, R.H.; Miao, W.K.; Wang, Z.H.; Dong, Y.B.; Lin, W.X.; Li, Q.Q. MIL−53(Fe)−based catalysts: CO2 hydrogenation performance and three−dimensional structures. Mater. Sci. Eng. B 2024, 310, 117767. [Google Scholar] [CrossRef]
  7. Niroumandpassand, A.; Javadi, A.; Mogaddam, A.R.M.; Fathollahi, I. Dispersive solid phase extraction of fluoroquinolone antibiotic residues in raw cow milk samples using bimetallic organic frameworks and investigating the effect of UV irradiation on antibiotics decontamination. Microchem. J. 2024, 206, 111564. [Google Scholar] [CrossRef]
  8. Lee, J.H.; Park, D.J.; Jin, E.J.; Lee, S.C.; Lee, J.H.; Oh, H.; Choe, W.Y. Programmable Merged−Net Porphyrinic Metal–Organic Frameworks for Water Sorption. Adv. Funct. Mater. 2024, 35, 2413200. [Google Scholar] [CrossRef]
  9. Shi, L.; Kirlikovali, O.K.; Chen, Z.J.; Farha, K.O. Metal−organic frameworks for water vapor adsorption. Chem 2024, 10, 484–503. [Google Scholar] [CrossRef]
  10. Kreno, L.E.; Leong, K.; Farha, O.K.; Allendorf, M.; Van Duyne, R.P.; Hupp, J.T. Metal−Organic Framework Materials as Chemical Sensors. Chem. Rev. 2012, 112, 1105–1125. [Google Scholar] [CrossRef]
  11. Coronado, E.; Minguez Espallargas, G. Dynamic magnetic MOFs. Chem. Soc. Rev. 2013, 42, 1525–1539. [Google Scholar] [CrossRef]
  12. Wilmer, C.E.; Leaf, M.; Lee, C.Y.; Farha, O.K.; Hauser, B.G.; Hupp, J.T.; Snurr, R.Q. Large−scale screening of hypothetical metal−organic frameworks. Nat. Chem. 2012, 4, 83–89. [Google Scholar] [CrossRef]
  13. Liao, P.S.; Zeng, B.N.; Li, S.S.; Zhang, Y.H.; Xiang, R.N.; Kang, J.W.; Liu, Q.H.; Li, G.Q. Cu−Bi Bimetallic Catalysts Derived from Metal−Organic Framework Arrays on Copper Foam for Efficient Glycine Electrosynthesis. Angew. Chem. Int. Ed. Engl. 2025, 64, e202417130. [Google Scholar] [CrossRef] [PubMed]
  14. Tahmasebi, P.; Parsa, B.J.; Iran, J. Bimetallic−organic framework (Fe, Cu)/carbon nanotubes encapsulated Ni nanoparticles as heterogeneous catalyst in Fenton−like process for degradation of acid orange 7 dye. Chem. Soc. 2024, 21, 2587–2605. [Google Scholar] [CrossRef]
  15. Qarah, F.A.; Alkhatib, M.F.; Aljohani, M.M.; Alhasani, M.; Bayazeed, A.; Alrashdi, S.K.; Sayqal, A.; Metwaly, M.E.N. Applications of bimetal–organic frameworks for efficient removal of dacarbazine: Optimization of the adsorption process using Box−Behnken design. Mater. Today Commun. 2024, 335, 126247. [Google Scholar] [CrossRef]
  16. Jin, G.; Huang, L.; Guo, D.; Wang, J.; Wang, H.J. MOFs−based porous liquids: Preparation and application in CO2 adsorption and separation. Fine Chem. 2024, 41, 23–37. [Google Scholar]
  17. Torres, S.; Cerutti, S.; Raba, J.; Pacheco, P.; Silva, F.M. Preconcentration of seleno−amino acids on a XAD resin and determination in regional olive oils by SPE UPLC–ESI−MS/MS. Food Chem. 2014, 159, 407–413. [Google Scholar] [CrossRef]
  18. Krawczyk−Coda, M. Determination of Selenium in Food Samples by High−Resolution Continuum Source Atomic Absorption Spectrometry After Preconcentration on Halloysite Nanotubes Using Ultrasound−Assisted Dispersive Micro Solid−Phase Extraction. Food Anal. Methods 2019, 12, 128–135. [Google Scholar] [CrossRef]
  19. Asiabi, H.; Yamini, Y.; Seidi, S.; Shamsayei, M.; SafariM Rezaei, F. On−line electrochemically controlled in−tube solid phase microextraction of inorganic selenium followed by hydride generation atomic absorption spectrometry. Anal. Chim. Acta 2016, 922, 37–47. [Google Scholar] [CrossRef]
  20. Luo, J.; Xu, F.J.; Tu, J.P.; Wu, X.; Hou, X.D. Amine−functionalized titanium metal organic framework for photochemical vapor generation for determination of selenium by inductively coupled plasma optical emission spectrometry. Microchem. J. 2017, 132, 245–250. [Google Scholar] [CrossRef]
  21. Ashour, M.R.; Abdel−Magied, F.A.; Wu, Q.; Wu, Q.; Olsson, T.R.; Forsberg, K. Green Synthesis of Metal−Organic Framework Bacterial Cellulose Nanocomposites for Separation Applications. Polymers 2020, 12, 1104. [Google Scholar] [CrossRef]
  22. He, Y.; Dong, W.B.; Li, X.P.; Wang, D.B.; Yang, Q.; Deng, P.; Huang, J. Modified MIL−100(Fe) for enhanced photocatalytic degradation of tetracycline under visible−light irradiation. J. Colloid Interface Sci. 2020, 574, 364–376. [Google Scholar] [CrossRef] [PubMed]
  23. Wei, J.M.; Zhang, W.; Pan, W.Y.; Li, C.R.; Sun, W.L. Experimental and theoretical investigations on Se(IV) and Se(VI) adsorption to UiO−66−based metal−organic frameworks. Environ. Sci.−Nano 2018, 5, 1441–1453. [Google Scholar] [CrossRef]
  24. Li, T.Z.; Ma, Y.X.; Li, M.S.; Ye, X.F.; Chai, X.J. Research Progress on Adsorption of Metal−organic Framework Based Materials for Heavy Metal Ions. Mater. Rep. 2024, 38, 267–278. [Google Scholar]
  25. Ferreira, S.L.C.; Victor, C.; Portugal, L.A.; Goncalves, L.B.; Santos, N.J.H.; Pereira, J.J.B.; Palacio, E. State of the art of the methods proposed for selenium speciation analysis by CVG−AFS. Trends Environ. Anal. Chem. 2022, 152, 116617. [Google Scholar] [CrossRef]
  26. Wang, M.; Zhong, Y.Z.; Qin, J.P.; Zhang, Z.H.; Li, S.; Yang, B.Y. Determination of total selenium in food samples by d−CPE and HG−AFS. Food Chem. 2017, 227, 329–334. [Google Scholar] [CrossRef]
  27. Tinkov, A.A.; Skalnaya, M.G.; Ajsuvakova, O.P.; Serebryansky, E.P.; Chao, J.C.; Aschner, M.; Skalny, A.V. Selenium, Zinc, Chromium, and Vanadium Levels in Serum, Hair, and Urine Samples of Obese Adults Assessed by Inductively Coupled Plasma Mass Spectrometry. Biol. Trace Elem. Res. 2021, 199, 490–499. [Google Scholar] [CrossRef]
  28. Yang, Q.; Li, C.H.; Hu, J.; Hou, X.D. Ultrasensitive determination of selenium in water and food samples by ICP−MS: UiO−66−NH2 for preconcentration and direct slurry hydride generation. Anal. Chim. Acta 2023, 1283, 341901. [Google Scholar] [CrossRef]
  29. Altunay, N.; Elik, A.; Kaya, S. Alcohol−DES based vortex assisted homogenous liquid−liquid microextraction approach for the determination of total selenium in food samples by hydride generation AAS: Insights from theoretical and experimental studies. Talanta 2020, 215, 120903. [Google Scholar] [CrossRef]
  30. Masixole, S.; Anele, M.; Marcin, S.; Agnieszka, S.; Nosizo, P.N. Determination of selenium in cereal and biofortified samples by ICP−OES using an alcohol−based deep eutectic solvent in digestion procedure. Adv. Sample Prep. 2023, 8, 100092. [Google Scholar]
  31. Wu, Y.T.; Fan, Y.; Liu, Y.L.; Xu, J.Q. Amino−Functionalization and Enhanced Humidity Sensing Properties of MIL−125 Based on Quartz Crystal Microbalance Sensor. Chin. J. Inorg. Chem. 2019, 35, 635–642. [Google Scholar]
  32. Ren, Z.; Zhang, S.Q.; Shu, Y.Z.; Fu, X.B.; Peng, G.W. Preparation of new function material MIL−125−NH−PO and its adsorption capability for U(VI). Chin. J. Nonferrous Met. 2022, 32, 3406–3418. [Google Scholar]
  33. Ateia, M.; Helbling, D.E.; Dichtel, W.R. Best Practices for Evaluating New Materials as Adsorbents for Water Treatment. ACS Mater. Lett. 2020, 2, 1532–1544. [Google Scholar] [CrossRef]
  34. GB/T 5750.6−2023; Standard Test Methods for Drinking Water Part 6: Metal and Metal−like Indicators. National Standards of the People’s Republic of China: Beijing, China.
  35. Neetha, J.; Abraham, K.E. Detection of Selenium and Nickel Metal Ion in Water Using Mn−Cn−Modified Electrode. Int. J. Electrochem. 2021, 2021, 6650542. [Google Scholar]
  36. Henn, L.E. Determination of selenium in water and industrial effluents by flameless atomic absorption. Anal. Chem. 2002, 47, 428–432. [Google Scholar] [CrossRef]
  37. Luo, J.; Hu, Z.H.; Xu, F.J.; Geng, D.X.; Tang, X.L. MIL−125−NH2 catalyzed photochemical vapor generation coupled with HPLC−ICPMS for speciation analysis of selenium. Microchem. J. 2022, 174, 107053. [Google Scholar] [CrossRef]
  38. Ding, Y.G.; Liu, Y.; Chen, Y.L.; Huang, Y.; Gao, Y. Photochemical Vapor Generation for Colorimetric Speciation of Inorganic Selenium. Anal. Chem. 2019, 91, 3508–3515. [Google Scholar] [CrossRef]
  39. Cao, G.M.; Xu, F.J.; Wang, S.L.; Xu, K.L.; Hou, X.D.; Wu, P. Gold Nanoparticle−Based Colorimetric Assay for Selenium Detection via Hydride Generation. Anal. Chem. 2017, 89, 4695–4700. [Google Scholar] [CrossRef]
  40. Ali, J.; Tuzen, M.; Feng, X.B.; Kazi, T.G. Determination of trace levels of selenium in natural water, agriculture soil and food samples by vortex assisted liquid−liquid microextraction method: Multivariate techniques. Food Chem. 2021, 344, 128706. [Google Scholar] [CrossRef]
Figure 1. Synthesis roadmap of MIL−125−NH2.
Separations 12 00062 g001
Figure 2. SEM (A,B), XRD (C), and FT−IR (D) images of MIL−125−NH2.
Separations 12 00062 g002
Figure 3. (A) Zeta potentials at different pH, and (B) pore width of MIL−125−NH2.
Separations 12 00062 g003
Figure 4. Optimization of pH (A), NPDA (B), temperature (C), and extractant (D) in derived solution.
Separations 12 00062 g004
Figure 5. Chromatogram of piaselenole (A), 2D and 3D scan of 200~400 nm absorption wavelength (B,C), calibration curve (D). The chromatographic column was Athena−C18−WP (3 μm, 4.6 × 100 mm, S/N: Q4680003); column flow rate 0.6 mL·min−1; column temperature 30 °C; mobile−phase (acetonitrile:water = 70:30), equal elution; and the injection volume was 5 μL).
Separations 12 00062 g005
Figure 6. Adsorption kinetics fitting of MIL−125−NH2.
Separations 12 00062 g006
Figure 7. Isotherm experimental data fitted to Langmuir and Freundlich models of MIL−125−NH2.
Separations 12 00062 g007
Figure 8. Effects of environmental interference on adsorption and UPLC−DAD detection of 100 μg/L of Se(IV). Addition levels of NOM were 1 mL, 2 mL, 5 mL; addition levels of anions and cations were 100 μg/L, 200 μg/L, 500 μg/L.
Separations 12 00062 g008
Figure 9. Comparison of adsorption properties of MOF materials reused 8 times.
Separations 12 00062 g009
Figure 10. Comparison of dispersion states of six adsorbent materials after adding extractant.
Separations 12 00062 g010
Table 1. Instrument information.
InstrumentModelProducer
Liquid ChromatographVanquishDionex Softon GmbH, Upper Bavaria, Germany
Microwave Digestion InstrumentXT−9916RayKol Group Company Limited, Xiamen, China
Magnetic StirrerHJ−4BJintan City Chengdong Xinrui Instrument, Changzhou, China
CentrifugeTG−16Sichuan Shuke Instrument Company Limited, Chengdu, China
Scanning Electron MicroscopeZEISSCarl Zeiss Meditec AG, Oberkochen, Germany
Fourier−Transform Infrared SpectrometerPEPerkinElmer, Waltham, MA, USA
X-Ray DiffractometerEmpyream PANalyticalPANalytical B.V., Almelo, The Netherlands
Constant Temperature OscillatorSHA−BCedris Laboratory Analytical Instrument Manufacturing Plant, Tianjin, China
Table 2. Comparison results of six adsorption materials.
NumberMaterialsAmount of Materials (mg)Added
(μg·L−1)
Determination (n)Average Found (μg·L−1)Deviation (μg·L−1)Recovery (%)
1TiO2155003378.5±1.575.7
2ZrO31550039.1±1.01.82
3MIL−125155003378.9±0.3275.7
4UIO−6615500316.2±0.733.24
5UIO−66−NH215500350.9±0.4310.2
6MIL−125−NH2155003418.2±1.883.6
n: number of measurements.
Table 3. Main interfering ions.
Isotope of SeCommon Interfering Ions
Isotopic Abundance/%m/z
0.877439K35Cl+
9.377636Ar40Ar+, 39K37Cl+, 38Ar38Ar+, 60Ni16O+, 75AsH+, 76Ge+
7.637761Ni16O+, 76SeH+, 39K38Ar+, 40Ar37Cl+, 76GeH+, 40Ca37Cl+, 59Co18O+
23.777862Ni16O+, 39K39K+, 77SeH+, 41K37Cl+, 40Ca38Ar+, 38Ar40Ar +, 78Kr+
49.618064Ni16O+, 79BrH+, 40Ca40Ar+, 64Zn16O+, 45Sc35Cl+, 40Ar40Ar+, 40Ca40Ca+, 80Kr+
8.738234S16O3+, 66Zn16O+, 81BrH+, 45Sc37Cl+, 42Ca40Ar+, 32S34S16O+, 82Kr+
Table 4. The detection of interference ions.
Sample82Se(IV) (mg/L) Interference Ions (mg/L)
ICP−MSAFSDADCaSO42−ClBrZn, Ni, Sc, Kr
10.150.00520.005340.2110.4873.15.02<0.001
20.130.00500.004645.1102.8912.24.11<0.001
30.120.00450.004139.693.7830.93.69<0.001
Standard sample
(0.010 mg/L)
0.00950.00970.0097/////
Note: the test was repeated three times for each sample.
Table 5. Detection limit, quantitative limit, and recovery results (n = 6), 10 times enrichment.
CompoundRecovery
(RSD) (%, n = 6)
LOD/
μg·L−1
LOQ/
μg·L−1
10 μg·L−125 μg·L−1100 μg·L−1
Piazselenol87.8 (2.3)98.8 (2.7)102.1 (0.7)0.0130.052
Table 6. Comparison of different detection methods.
TechniquesPreconcentrationLOD, μg·L−1Reference
Mn−Cn−Modified ElectrodeNo0.533[35]
IR−124−AASNo1[36]
MIL−125−NH2/ICP−MSNo0.8[37]
AuNPs/PVG−UV−visNo7[38]
AuNPs/HG−UV−visNo4[39]
ICP−MSNo0.1[34]
VA−LLME/GF−AASYes0.1[40]
MOF/UPLC−DADNo0.13This work
Yes0.013
Table 7. Determination of Se(IV) in real water samples.
SampleSample Value (mg/L)Add Value (mg/L)Found Value (mg/L)nRecovery (%)
Tap waterND0.1000.094 ± 0.008394
River water−1ND0.1000.111 ± 0.0053111
River water−2ND0.1000.106 ± 0.0073106
Selenium−rich mineral water0.029 ± 0.0020.1000.118 ± 0.003389
Spring water−1ND0.1000.090 ± 0.011390
Spring water−2ND0.1000.092 ± 0.009392
Industrial wastewater downstream0.015 ± 0.0010.1000.103 ± 0.003388
ND, not detected; n, the times of the measurement.
Disclaimer/Publisher’s Note: The statements, opinions and data contained in all publications are solely those of the individual author(s) and contributor(s) and not of MDPI and/or the editor(s). MDPI and/or the editor(s) disclaim responsibility for any injury to people or property resulting from any ideas, methods, instructions or products referred to in the content.

