Communication

Validation of a Rapid GC-MS Procedure for Quantitative Distinction between 3-O-Methyl- and 4-O-Methyl-Hexoses and Its Application to a Complex Carbohydrate Sample

Department of Pharmaceutical Biology, Pharmaceutical Institute, Christian-Albrechts-University of Kiel, Gutenbergstr. 76, 24118 Kiel, Germany
*
Author to whom correspondence should be addressed.
Separations 2020, 7(3), 42; https://doi.org/10.3390/separations7030042
Submission received: 17 June 2020 / Revised: 4 July 2020 / Accepted: 24 July 2020 / Published: 31 July 2020

Abstract

:
Methylation of one hydroxyl group of monosaccharides occurs in some bacteria, fungi, worms, molluscs, and also in plants. Although knowledge on the exact functions of this process is missing, methylation is an option to modulate glycan structures thereby leading to new biological activities. In plants, methylated monosaccharides are often present in minor amounts and, therefore, overseen in analytical investigations. A special difficulty is the distinction between 3-O-methyl- and 4-O-methyl-hexoses, due to similar fragmentation patterns of methylated alditol acetates in gas-chromatography with mass spectrometric detection and, in the case of galactose, identical retention times due to symmetry. We, therefore, developed and validated an easy method for the quantitative distinction between 3-O-methyl- and 4-O-methyl-hexoses and showed its functionality by quantification of 3-O-methyl galactose in a high molecular weight polysaccharide mixture from the charophyte Spirogyra. A systematic search for methylated monosaccharides in different plant lineages may offer new insights in plant cell wall evolution.

1. Introduction

Methyl decoration of hydroxyl groups of monosaccharides is a rare modification of different carbohydrates, being described from different phyla of organisms, except mammals. Hexoses are often the target of this kind of modification, but preferences of different organism groups are described: Bacteria seem to have various types of methylated sugars, but methylated hexoses are only minor, while in plants it is the opposite (for an in-depth review on this topic see [1]). The function of this type of modification is only slightly understood. Wohlschlager et al. [2] proposed an endogenous function in the innate immune system in different vertebrates and invertebrates, while Lechner et al. [3] showed a role of transient methylated hexoses in the biosynthesis of sulfated glycoproteins in Halobacterium halobium.
Focusing on plants, galactose is the most common methylated hexose [1]. 4-O-methyl-galactose (4-OMe-Gal) is present for example in the agar fraction of the red alga Gelidium amansii [4], which represents the first description of this sugar modification in nature, and also in a sulfated polysaccharide from the red alga Aeodes ulvoidea [5].
Both the D- and the L-enantiomers of 3-O-methyl-galactose (3-OMe-Gal) occur in polysaccharides of the red alga Jania rubens [6]. Furthermore, 3-OMe-Gal has been reported previously in a neutral polysaccharide of the green alga Chlorella vulgaris [7,8], although it has not been found in any other genera of the Chlorophyta. In land plants, it was detected in sweet chestnut leaves [9], in pectic polysaccharides from elm bark [10,11,12], and in higher concentrations in the cell walls of the young leaves of both homosporous (Lycopodium, Huperzia and Diphasiastrum) and heterosporous (Selaginella) lycophytes. It was proposed that a high content of this methylated hexose is an autapomorphy of the lycophytes, related to their isolated evolutionary position [13]. Recently, 3-OMe-Gal was also found in a pectic polysaccharide fraction of the charophyte Chara vulgaris, but not in the hornwort Anthoceros agrestis, which supports the hypothesis that major steps in plant evolution were accompanied by notable changes in cell-wall chemistry [14].
To the best of our knowledge, there is no simple procedure for one-step identification and quantification of 3-OMe-Gal and 4-OMe-Gal. Past descriptions of methyl-hexoses as components of complex carbohydrate samples often used a structure determination method (e.g., one- or two-dimensional nuclear magnetic resonance spectroscopy (NMR), mass spectrometry (MS)) after a chromatographic separation step (e.g., [13,14,15]).
O’Rourke et al. [14] separated hydrolyzed monosaccharides of Chara vulgaris by HPLC and used a spiking method with 3-OMe-Gal, derived from Lycopodium clavatum [13], for identification as the second step. Capek [15] estimated the quantity of 3-OMe-Gal in Salvia officinalis L. arabinogalactan by GC-MS, but identified the peak by use of two-dimensional NMR experiments.
For quantification of 3-OMe-Gal in cell walls of lycophytes, another two-step procedure has been applied. After separation of monosaccharides by quantitative paper chromatography, identification of the methylated galactose was achieved by NMR [13].
Commonly used derivatization methods for GC analysis (i.e., acetylation) often use reduction as the first step. After this reduction with sodium borohydride, the 4-O- and 3-OMe-Gal residues are identical in the ring-open form, the upper and lower half being mirror images of each other with identical primary fragments after GC-MS (Figure 1A,C). In the case of glucose, distinction is still possible because the retention times of the two mono-methylated monosaccharides differ.
We, therefore, developed and validated a method which allows distinction and quantification of the methylated hexoses in a one-step procedure. Reduction with deuterium prior to acetylation leads to differences in primary fragments of 4-O- and 3-OMe-Gal (Figure 1B,D). The method was applied to an analytical question, the determination of mono-methylated galactose in a polysaccharide fraction from the charophyte Spirogyra pratensis.

2. Materials and Methods

2.1. Derivatization Procedure

A modified version of the procedure of [16] was developed to obtain volatile acetyl derivatives of monosaccharides for later analysis by gas chromatography.
We used the methylated hexose derivatives of glucose (which are the only commercially available 3-OMe- and 4-OMe-hexoses) to validate the procedure for all methylated hexoses. This is possible because the fragmentation patterns are equivalent (compare [17]). In this article we, therefore, use the term 3-OMe-hexose and 4-OMe-hexose instead of –Glc.
The standard monosaccharides 3-O-methyl glucose (Sigma Aldrich Corporation, Taufkirchen, Germany) and 4-O-methyl glucose (Carbosynth Ltd., Compton, UK) were dissolved in double-distilled water (prepared with Finn-Aqua 75 apparatus, Santasalo-Sohlberg AB, Finland) in a concentration of 25 mg/mL. Through serial dilution a set of standards with defined concentrations (12.5 mg/mL; 5 mg/mL; 2.5 mg/mL, 1.25 mg/mL) was obtained. A total of 20 µL of these solutions and 20 µL of myo-inositol (Merck KGaA, Darmstadt, Germany) in a concentration of 5 mg/mL were hydrolyzed in 1 mL 2 M trifluoroacetic acid solution (Carl Roth GmbH and Co. KG, Karlsruhe, Germany) at 120 °C for 1 h in a Pyrotube C vial (Associates of Cape Cod Inc., East Falmouth, MA, USA), which avoids evaporation of sample solution.
After that, 5 mL of double-distilled water was added to the hydrolyzed sample and evaporated to dryness in a rotatory evaporator (Laborota 400 efficient, Heidolph Instruments GmbH and Co. KG, Schwabach, Germany) at 40 °C water bath temperature and a pressure of 10–15 mbar (Vacuumpump CVC 2000, Vacuubrand GmbH and Co. KG, Wertheim, Germany). A threefold evaporation step was performed.
To obtain distinguishable derivatives of the standard mono-methylated hexoses the reduction step was modified by the use of 1 M sodium borodeuteride (Carl Roth GmbH and Co. KG, Karlsruhe, Germany) solution in dimethyl sulfoxide (VWR International LLC., Radnor, PA, USA) instead of sodium borohydride (see [17]), which was added after an alkalization with 100 µL of 2 M ammonia solution (J.T. Baker, Inc., Phillipsburg, NJ, USA) in water. The samples were incubated in an oven at 40 °C for 1.5 h. After that, the remaining borodeuteride was inactivated by the addition of concentrated acetic acid (J.T. Baker, Inc., Phillipsburg, NJ, USA).
Volatile acetyl derivatives were produced by an acetylation step performed with 2 mL of acetic anhydride (Merck KGaA, Darmstadt, Germany), which was dried over a molecular sieve of 4 Å. A total of 200 µL of methyl-imidazole (Merck KGaA, Darmstadt, Germany) was used as a catalyst for the acetylation reaction. The acetylation was performed at room temperature.
After 20 min, the remaining acetic anhydride was destroyed by addition of 10 mL double-distilled water and the volatile components were extracted through liquid-liquid extraction with 1 mL of dichloromethane (VWR International LLC., Radnor, PA, USA) after acidification with 1 mL of 0.1 M sulfuric acid (Sigma Aldrich Corporation, Taufkirchen, Germany).

2.2. Gas Chromatography

A total of 1 µL of the dichloromethane fraction was injected into the gas chromatograph (Agilent 7890B, Agilent Technologies, Santa Clara, CA, USA) with a coupled mass spectrometry detector (Agilent 5977B MSD, Agilent Technologies, Santa Clara, CA, USA). The oven was heated to the initial temperature of 200 °C and after split injection (split ratio 10:1) and subsequent 3 min hold time, a linear gradient of 2 °C/min was used to separate the different acetylated and mono-methylated monosaccharides on the Optima-225 column (25 m, 50 µm, 0.25 µm; Machery-Nagel GmbH and Co. KG, Düren, Germany). For each substance, a quantifier ion and three qualifier ions were determined and used in selective ion mode (SIM) of the MSD. Figure 2 shows qualifier and quantifier ions for 3-OMe-hexose after borodeuteride reduction and acetylation.

2.3. Analysis of Gas Chromatograms

For analysis of the quantifier ions in the obtained SIM chromatograms, a MassHunter Workstation Software (version B.08.00) (Agilent Technologies, Inc., Santa Clara, CA, USA) was used. For automatic peak integration with the internal “Agile 2” integrator, a minimum area ≥ 10 counts was set in the peak filter. The area of quantifier ion peaks was calculated relatively to myo-inositol quantifier ion (m/z = 168) peak.

2.4. Linearity Test

Linearity of the obtained relative peak areas was determined by a calibration curve of five concentrations (25 mg/mL, 12.5 mg/mL, 5 mg/mL, 2.5 mg/mL, 1.25 mg/mL) with a threefold derivatization procedure and a single injection for each sample preparation. The mean value and standard deviation, as well as regression analysis were calculated using Microsoft Excel 2016 (Microsoft Corp., Redmond, WA, USA). Limit of detection (LOD) and limit of quantification (LOQ), respectively, were calculated (as proposed by [18]) as 3.3 times and 10 times, respectively, the standard deviation of y-intercepts of regression divided with the slope of the calibration curve.
Linearity testing was repeated with the same samples after a complete restart of the system with removement and re-installation of the column.

2.5. Repeatability Precision

Repeatability precision was determined by six-fold injection of the same sample in a row. For the resulting relative peak area of the quantifier ions the relative standard deviation (RSD) was calculated using Microsoft Excel 2016 (Microsoft Corp., Redmond, WA, USA).

2.6. Intra-Day Precision

To determine intra-day precision, six standard preparations with the same concentration were single injected and the resulting relative peak areas (relative to myo-inositol) were used to calculate the RSD using Microsoft Excel 2016 (Microsoft Corp., Redmond, WA, USA).

2.7. Inter-Day Precision

Inter-day precision for the day of sample preparation and the two following days was specified by injecting six standard sample preparations once each on all three days. The RSD of the samples on that day together with the previous samples were calculated as above.

2.8. Matrix-Spiking

For recovery testing, a matrix composed of each 20 µL of the three different hexoses d(−)-glucose (Merck KGaA, Darmstadt, Germany), d(+)-galactose (Sigma-Aldrich, Taufkirchen, Germany), and d(+)-mannose (Fluka Analytical, Buchs, Switzerland) was spiked with 20 µL of the highest, the lowest and the middle concentration of the linearity test (25 mg/mL; 5 mg/mL, 1.25 mg/mL). These matrix-spiked mixtures were derivatized according to the procedure stated above. The relative recovery of the used concentration was determined.

2.9. Plant Sample Preparation

Spirogyra pratensis Transeau was cultured in the laboratory of Dr. Klaus von Schwartzenberg at the University of Hamburg. The freeze-dried sample was decolorized and an aqueous extract was done according to the procedure used in [19]. After that, a high-molecular weight fraction was achieved by precipitation of the water extract with the fourfold volume of cold ethanol. After centrifugation, the precipitate was redissolved in water and freeze-dried (Christ Alpha 1–4 LSC, Martin Christ GmbH, Osterode, Germany). This sample was derivatized and measured following the procedure described above.

3. Results

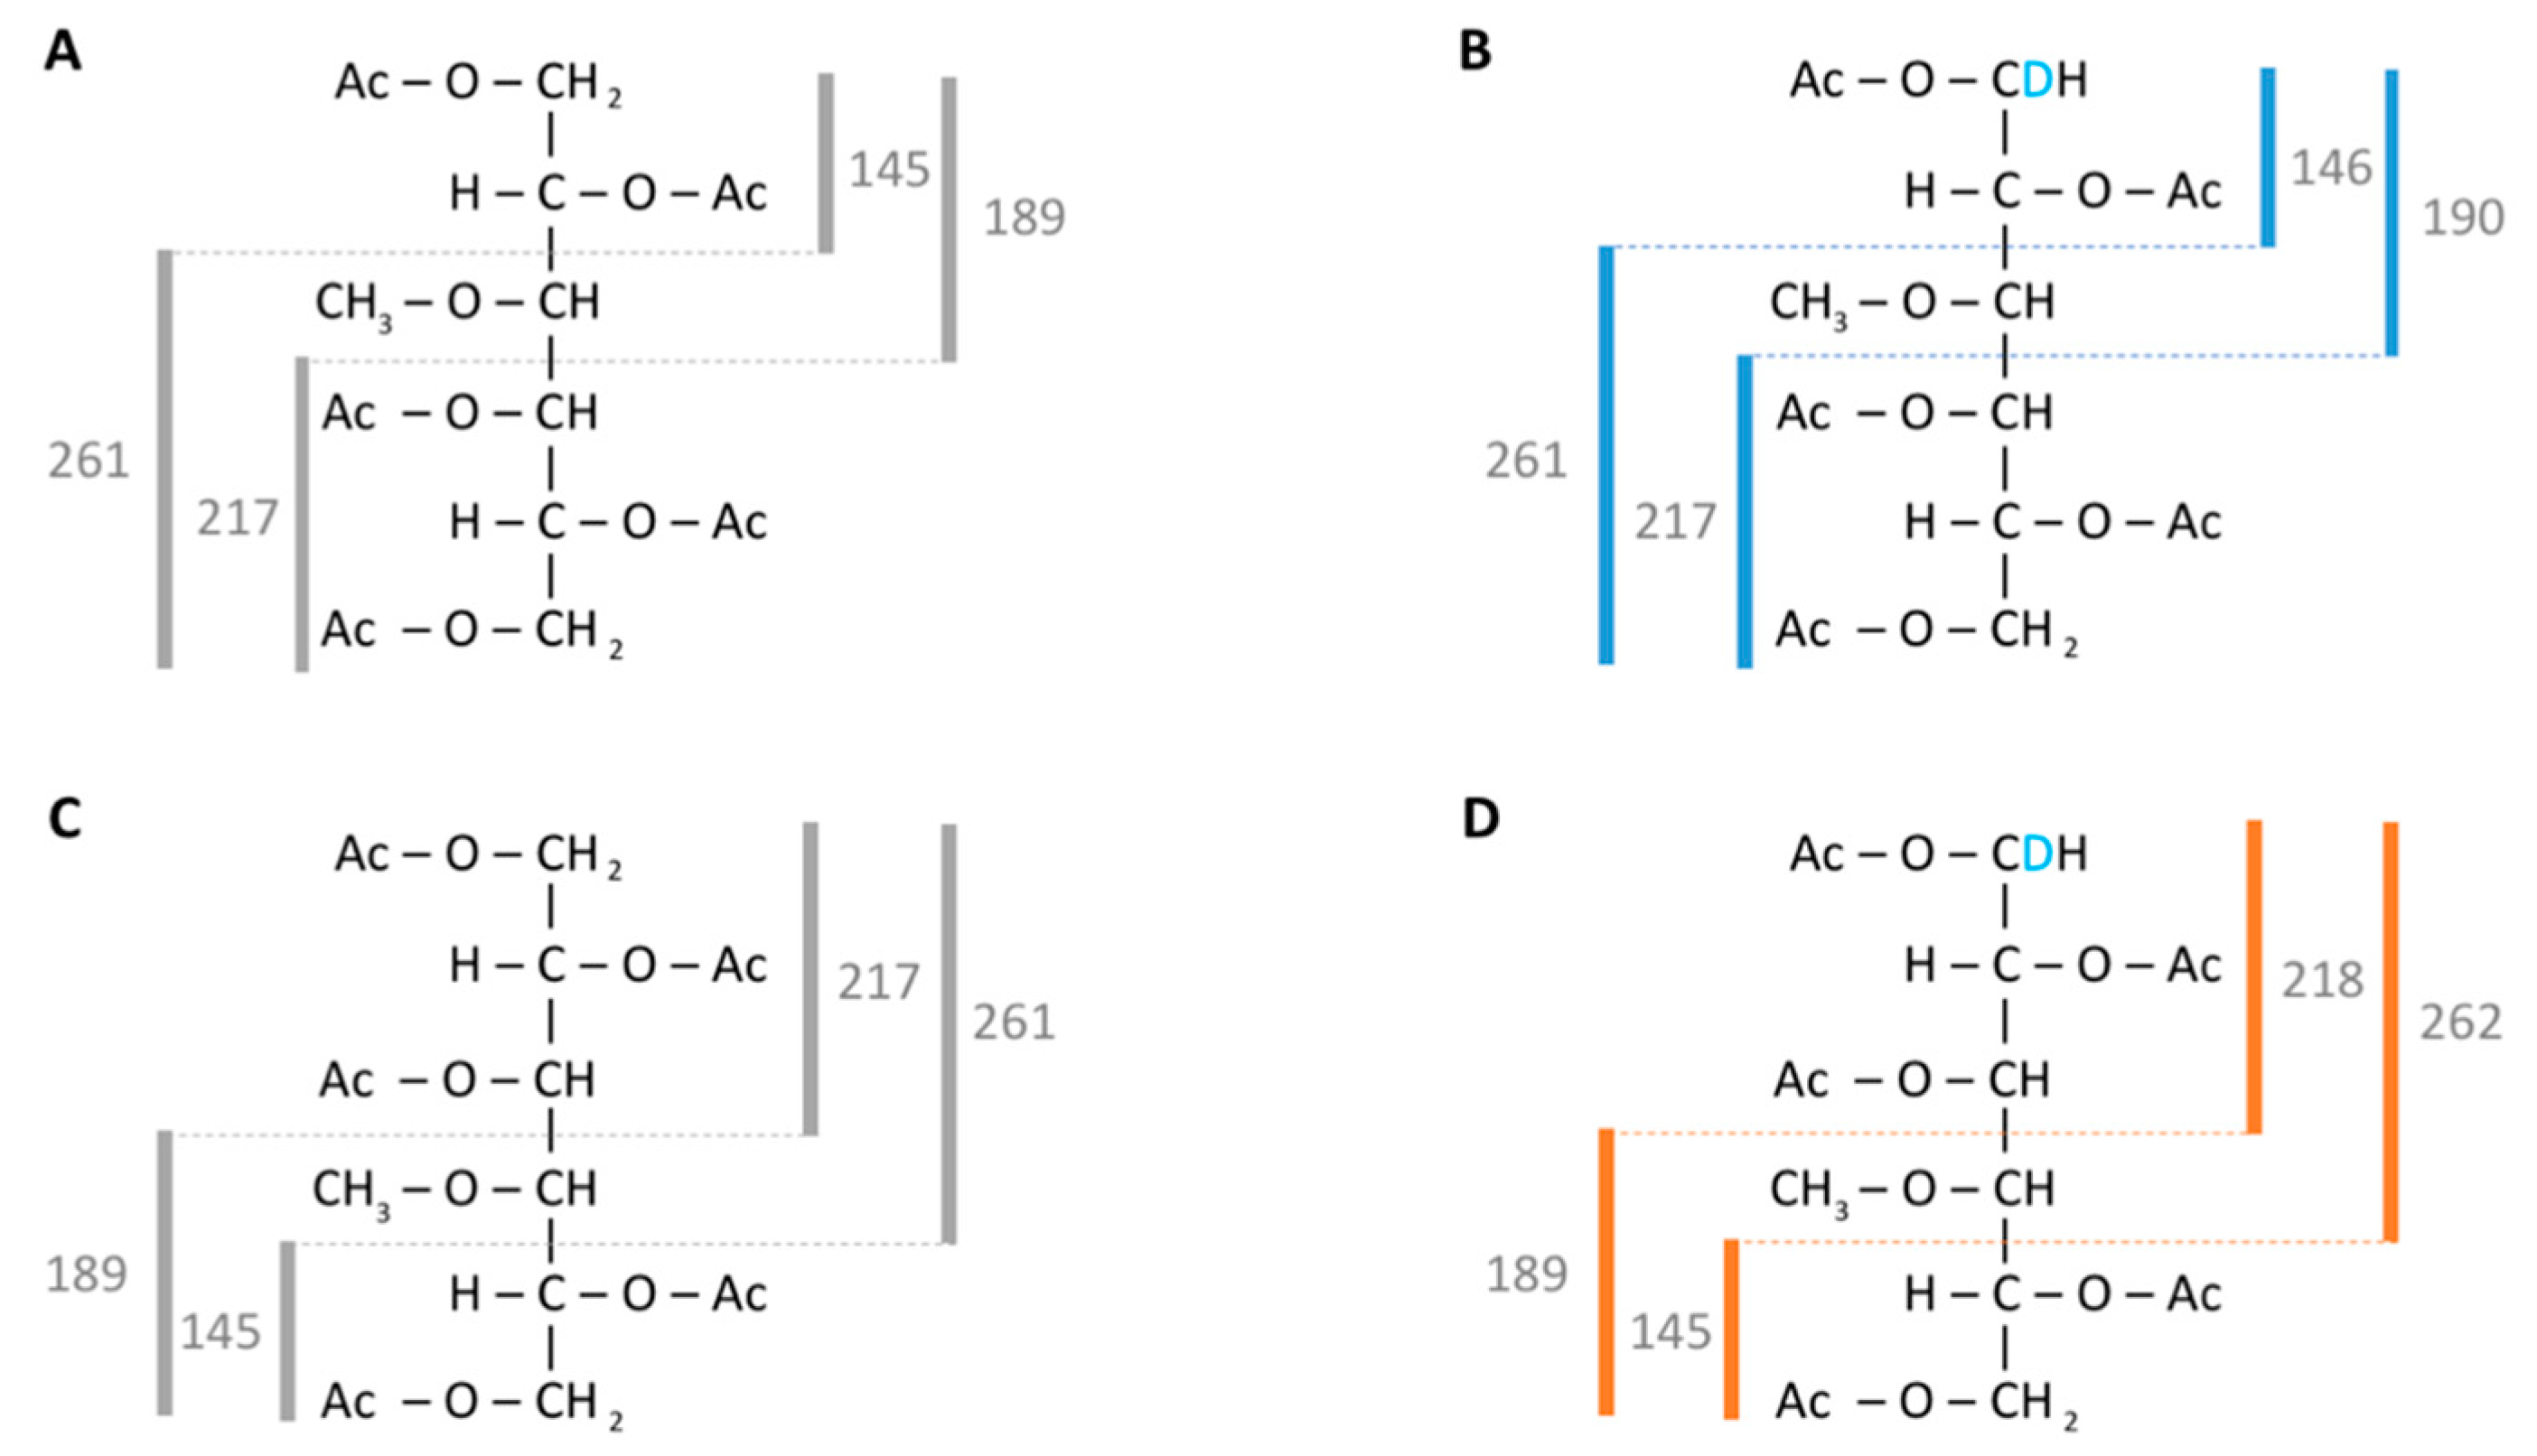
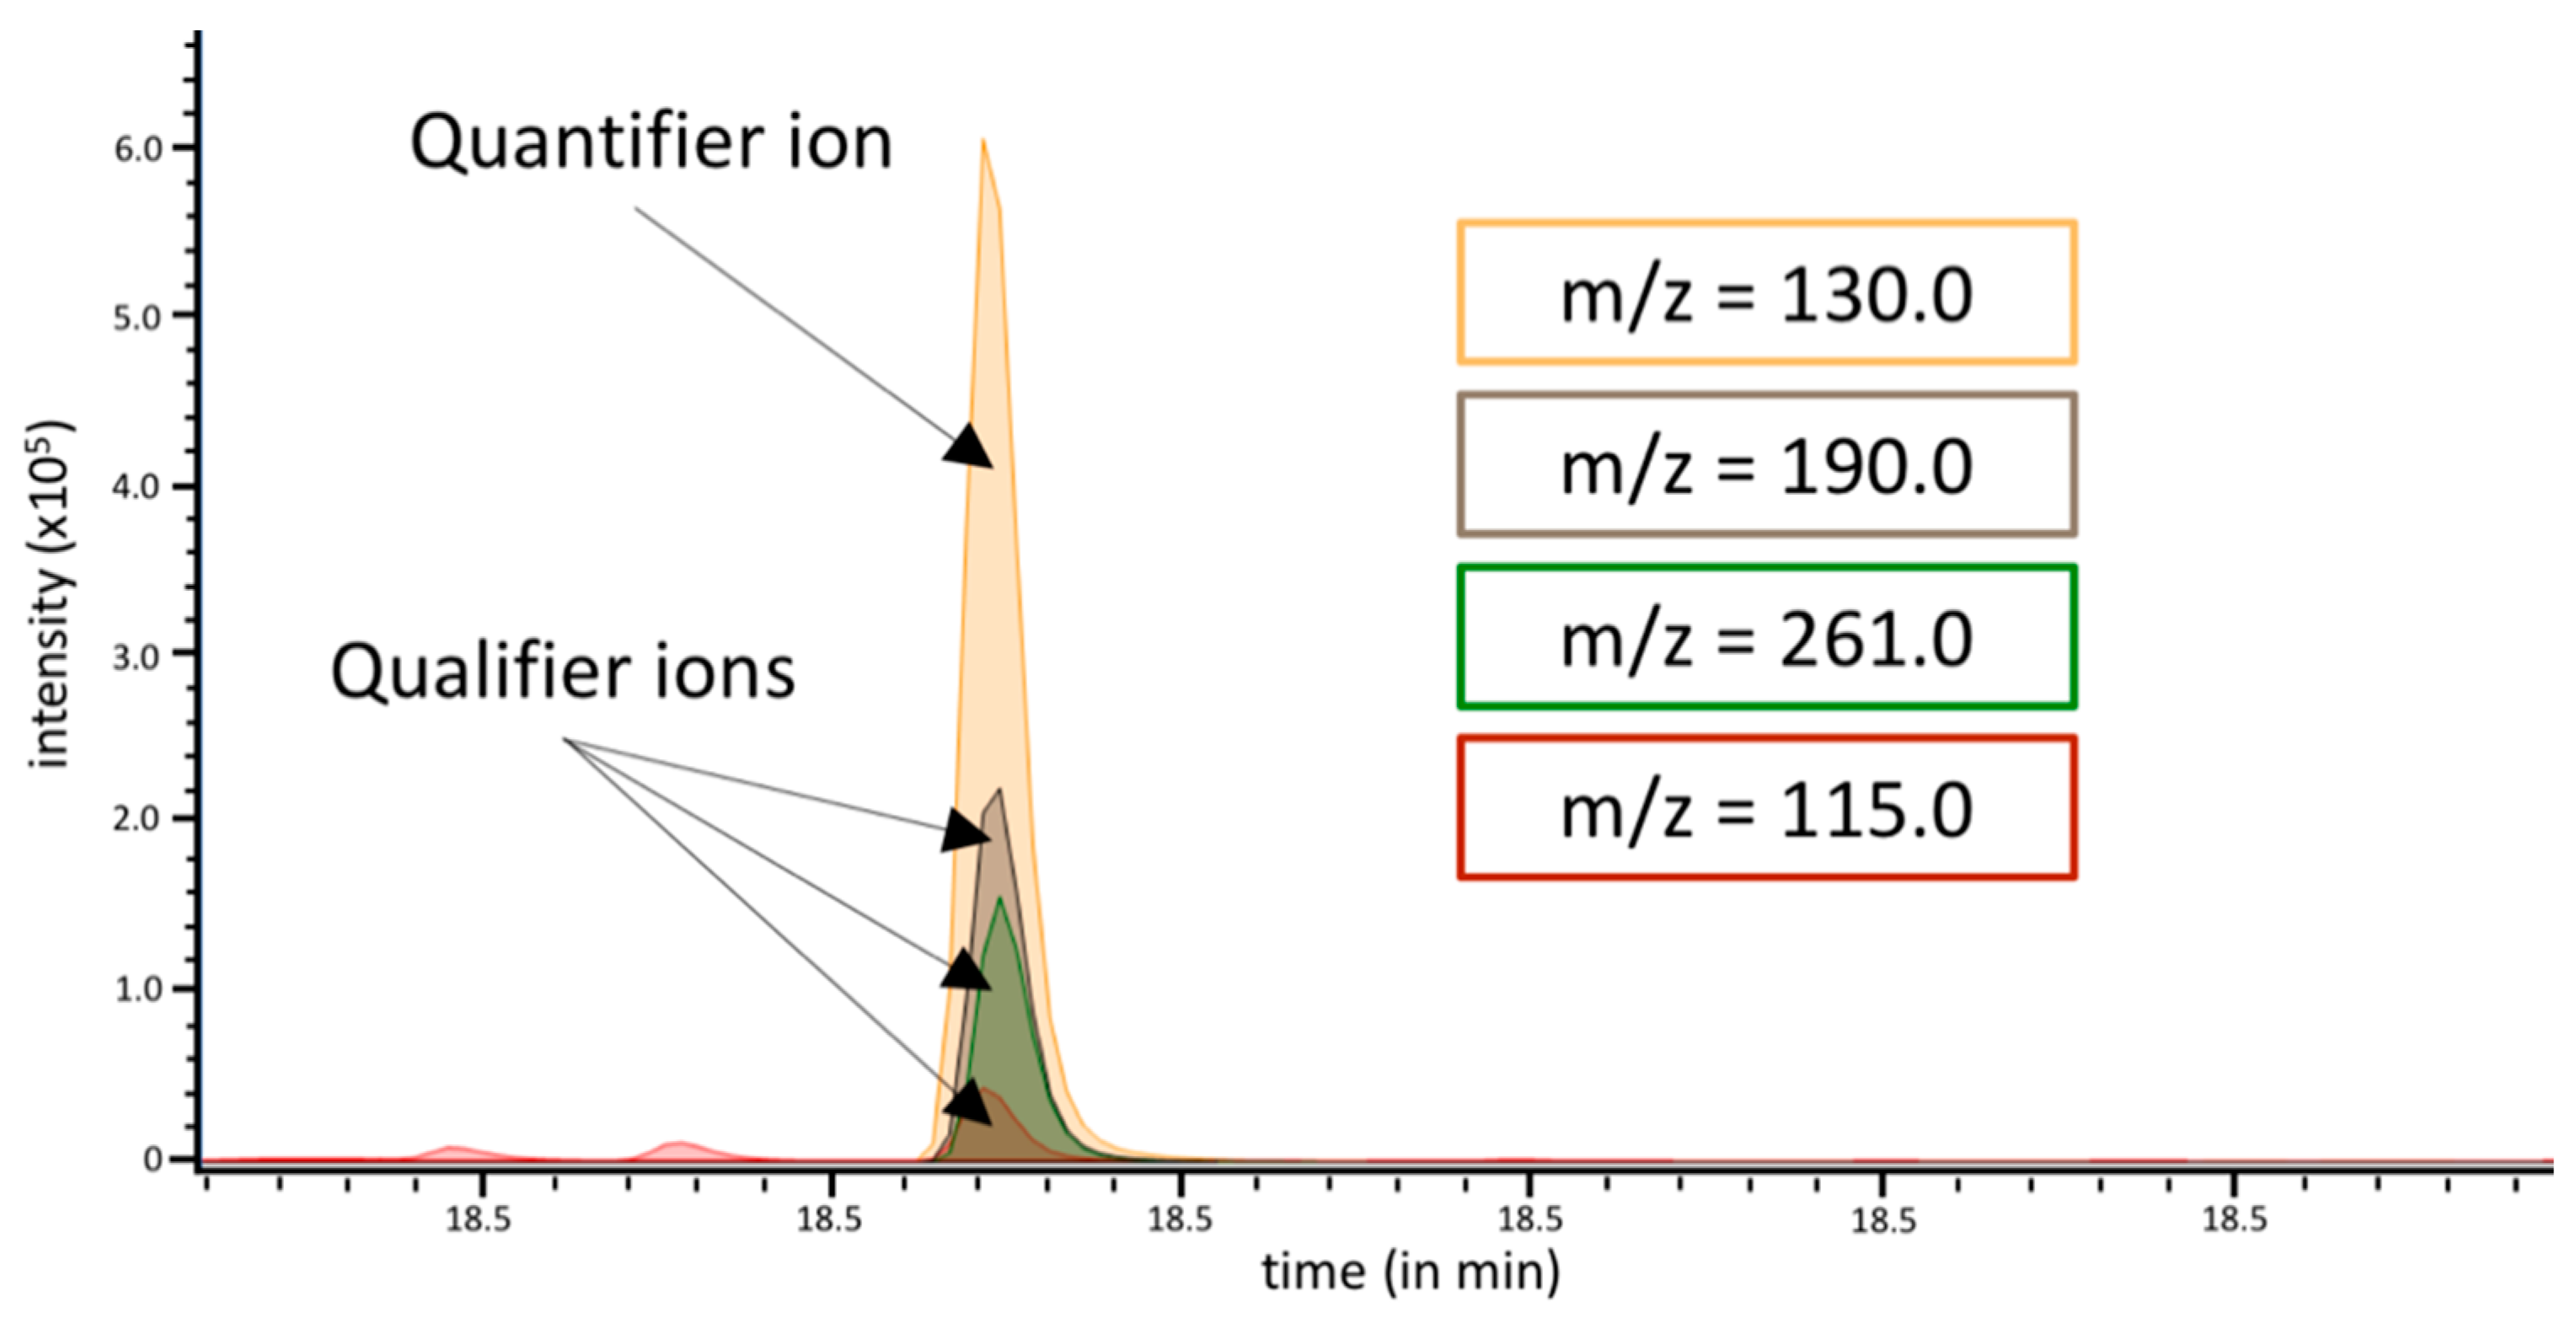
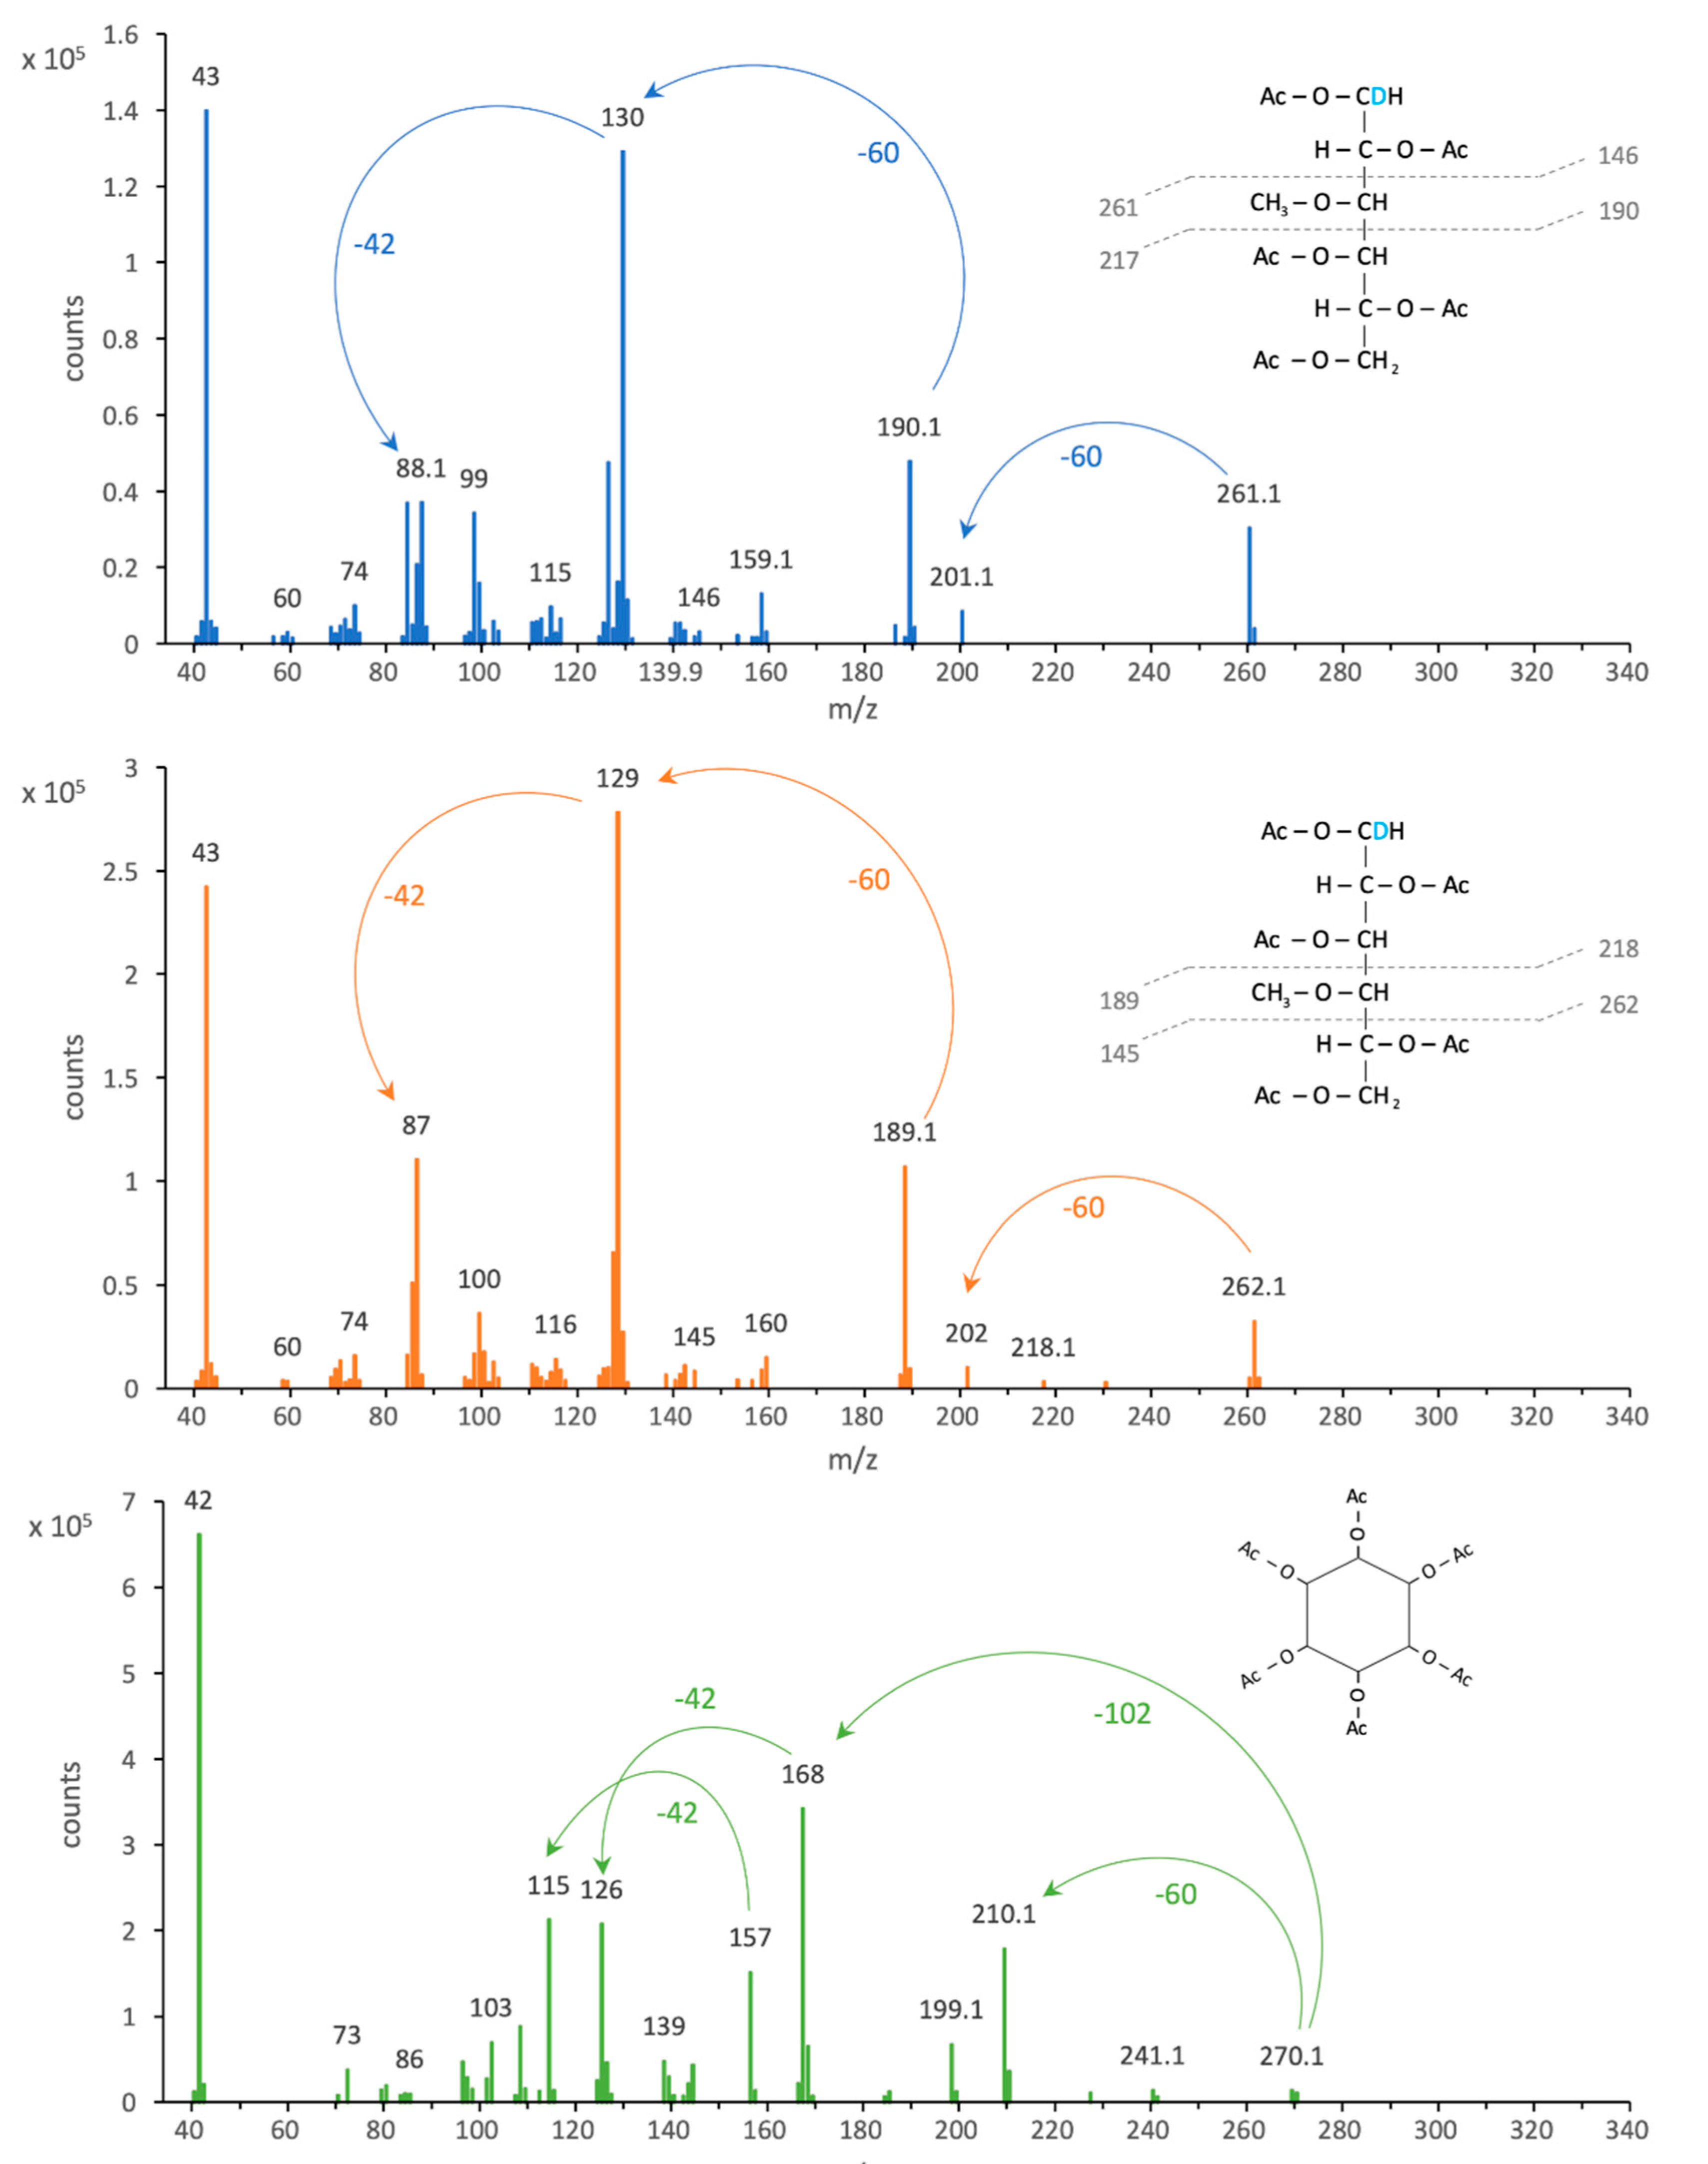
3.1. Analysis of Methylated Hexoses in GC-MS Selective Ion Mode
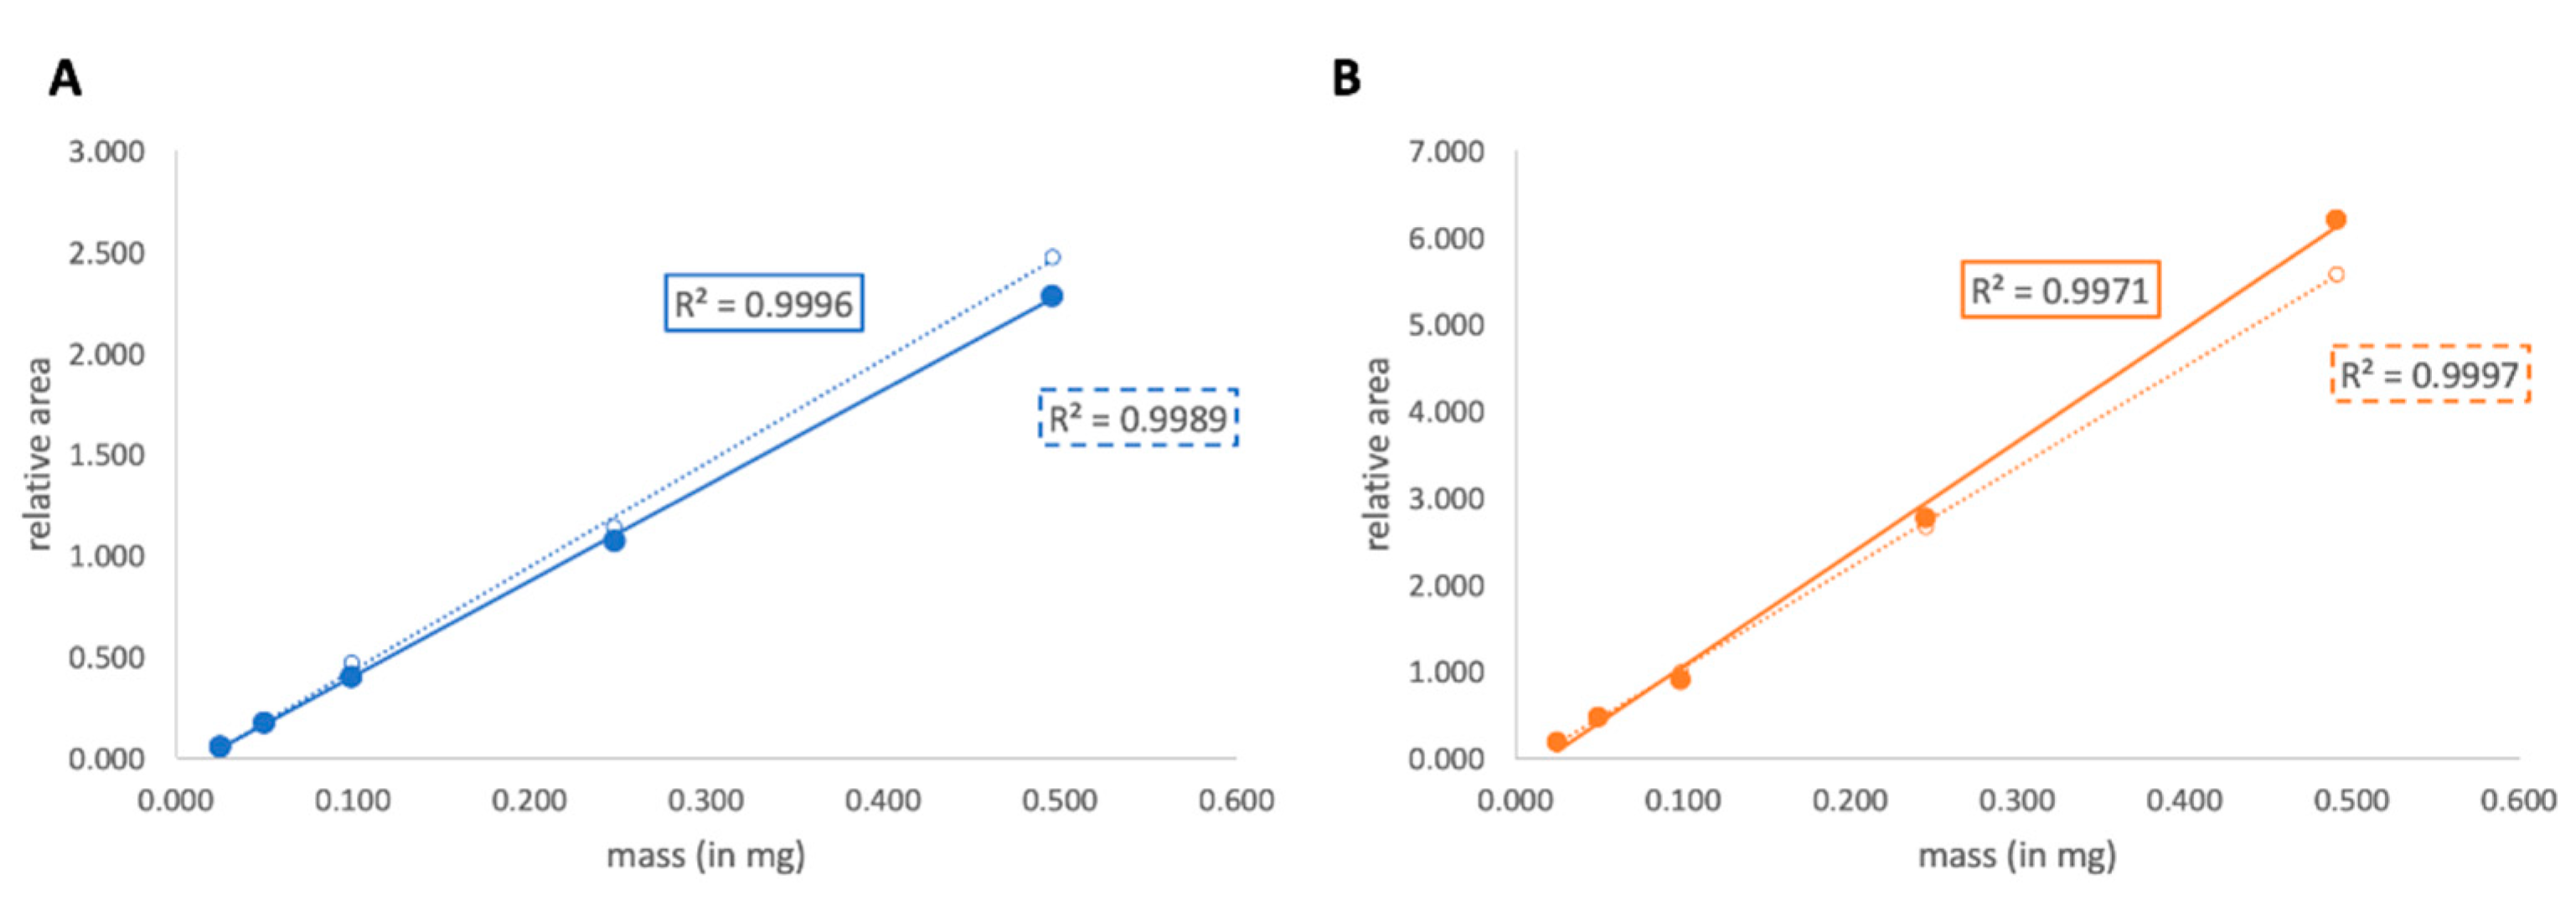
For both mono-methylated monosaccharide derivatives and the standard myo-inositol the ion with the highest intensity (beside m/z = 43, which is the acetic acid fragment) in the mass spectra (see Figure 3) was chosen as quantifier ion. In addition to that, three fragments were selected as qualifier ions. They are listed in Table 1.

3.2. Linearity Test

The results of the linearity tests (Table 2) showed a clear correlation of the area of the tested mass of used methylated hexose in relation to myo-inositol over the investigated range of concentrations (Figure 4). The repetition of the linearity test also showed linear regression with a good correlation.

3.3. Repeatability, Intra-, and Inter-Day Precision

The repeatability of the subsequent derivatization and GC-measurement of six standard samples with the same concentration resulted in precision values for the derivatization procedure (Table 3). For intra- and inter-day precision, the RSD was in a range of 4.68% to 6.45%, which is acceptable according to [20] (guideline for testing drugs in crude matrices).

3.4. Matrix-Spiking

By combining the three hexoses (mannose, galactose and glucose) as a matrix, a complex plant carbohydrate sample was simulated. The matrix also fragmented into some of the qualifier ions, stated above. Therefore, this mixture was assumed to be a good background for spiking to determine the recovery of the mono-methylated hexoses.
At three different stages of the calibration curve the recovery of matrix spikes was determined. The results (Table 4) reveal that the method works well in the concentration ranges applied. Only spike concentration 3 showed a higher recovery of approximately 130%. That concentration was below the LOQ for 4-OMe-hexose. With this low concentration, also possible traces in the matrix sample could elevate the relative recovery in a strong way.

3.5. Plant Sample Evaluation

In the investigated high-molecular weight fraction of Spirogyra pratensis the selective ions (see above) were quantified. One unknown peak (compare Figure 5) at the retention time of 0.915, relative to myo-inositol, was clearly identified as 3-OMe-hexose due to its fragmentation pattern in MS and contained the correspondent quantifier and qualifier ions. As 3-OMe- and 4-OMe-glucose derivatives are eluted at retention times of 0.875 and 0.923, respectively, the unknown peak was identified as 3-OMe-galactose. The possibility of being a methyl derivative of mannose was out of question due to the general observation (compare [16,19]) that methyl groups shorten the retention time of the corresponding monosaccharide. Mannose is detected before the unknown peak.
With this validated procedure, the amount of 3-OMe-galactose in this sample was quantified as 0.35% (m/m) of S. pratensis high molecular-weight fraction.

4. Discussion

The identification and quantification of O-methylated monosaccharides as part of polysaccharides is of relevance in the field of plant biology as more and more insights are gained for possible roles of this modification in various processes [13,14,21,22]. Although these unusual monosaccharides are mostly present in minor amounts, there are also examples where they occur in higher quantities. In arabinogalactan-proteins of the mosses Physcomitrella patens [22] and Sphagnum sp. [23], 3-OMe-Rha makes up over 10% of the glycan moiety, and in AGPs of the seagrass Zostera marina, 4-OMe-GlcA is supposed to be involved in adaption to the marine environment [24]. 3-OMe-Gal residues occur in polysaccharides of the basidiomycete fungi Pleurotus [25] and Phellinus [26] in high concentrations and are a quantitatively appreciable component of cell walls of both homosporous (Lycopodium, Huperzia and Diphasiastrum) and heterosporous (Selaginella) lycophytes [13]. Also in a polysaccharide from the mangrove plant Acanthus ebracteatus, high amounts of 3-OMe-Gal have been detected [27].
With increasing accessibility of modern instrumentation with high sensitivity, also the number of publications on this topic elevates. In addition to the improved possibilities for analytical detection of O-methylated monosaccharides, more information on the active enzymes, especially the DUF 579 protein family [28,29,30], has been gained recently and pushed forward the awareness on the significance of this special modulation of glycan structure. With our newly-validated method we are able to quantify 3-O methylated and 4-O methylated hexoses in quantities of more than 26 µg/mL and 41 µg/mL, respectively, with sufficient linearity. The calibration curve method used for LOD and LOQ determination is only one of a variety of different methods possible (a detailed comparison is given by [31]). These LOQ values also underline the optimal fitting for the use in plant polysaccharide analytics, as for example the Chlorella vulgaris hydrolysate contained around 38 µg 3-OMe-Gal per mg hydrolysate [7] and the arabinogalactan from Salvia officinalis had an amount of 30 µg 3-OMe-Gal per mg crude polysaccharide [15]. The selected quantifier ions showed good repeatability precision for both standards, 3-OMe-Glc and 4-OMe-Glc, which confirms the validity of the chosen mass-per-charge ratios for the use in this study. As we performed a validation procedure with intensive sample preparation (derivatization), we expected higher values for intra- and inter-day precision, compared to simple determinations of pure drug substances or hazardous impurities (e.g., [18,32]), which do not need complex preparation procedures. Despite that expectation, we achieved values in a range near 5% RSD, which is also acceptable for minor components in drug products according to [33]. Recovery as evaluated by matrix-spiking at different concentration levels showed a robust method.
The major advantage of our presented quantification method is the application of the high reliability of SIM-MS methodology for carbohydrate analysis. As common methodologies [16] often identify peaks solely based on retention time, the minor peak in S. pratensis would remain unidentified: The retention times are so close to each other (Figure 5A) that FID or MS (in scan mode) could not distinguish the unknown peak from the following 4-OMe-hexose. Even if the borodeuteride reduction is used, the neighboring peak position would make it difficult to clearly differentiate the two overlaying mass spectra. The use of borodeuteride reduction in a monosaccharide acetylation procedure is not completely new (compare for example [34]), but combining it with SIM-MS quantification decreases the detection limit and therefore enables the user to identify and quantify even very minor methyl-derivatives.
Finally, we tested the developed methodology with regard to the analytical question, whether O-methylated hexoses occur in a water-soluble polysaccharide mixture isolated from the charophyte Spirogyra pratensis. The question whether 3-OMe-Gal occurs in polysaccharides of the charophytes is controversially discussed in literature. Whereas this methylated monosaccharide was proposed to be missing in charophytes [13,35], it has been recently detected in Chara vulgaris [14]. Our finding of 3-OMe-Gal in S. pratensis polysaccharide fits to the results of O’Rourke et al. [14], who proposed that many of the higher charophytes possess this methylated sugar residue. Based on present knowledge, it seems that 3-OMe-Gal is present in polysacharides of higher charophytes and lycophytes, but not in bryophytes, which confirms that cell-wall chemistry has gone through major changes in the course of evolution and between the major phylogenetic groups of plants.

Author Contributions

Conceptualization: B.C. and L.P.; methodology: L.P.; formal analysis: L.P.; investigation: L.P.; writing—original draft preparation: L.P. and B.C.; writing—review and editing: L.P. and B.C.; visualization: L.P.; supervision: B.C. All authors have read and agreed to the published version of the manuscript.

Funding

This research received no external funding.

Acknowledgments

The authors thank K. von Schwartzenberg for culture and provision of Spirogyra pratensis, as well as J. Utermoehlen for extraction and preparation of S. pratensis high-molecular weight fraction. We acknowledge financial support by “Open Access-Publikationsfonds des Landes Schleswig-Holstein für Nachwuchswissenschaftler*innen” for kindly covering the article processing charge.

Conflicts of Interest

The authors declare no conflict of interest.

References

  1. Staudacher, E. Methylation—An uncommon modification of glycans. Biol. Chem. 2012, 393, 675–685. [Google Scholar] [CrossRef] [Green Version]
  2. Wohlschlager, T.; Butschi, A.; Grassi, P.; Sutov, G.; Gauss, R.; Hauck, D.; Schmieder, S.S.; Knobel, M.; Titz, A.; Dell, A.; et al. Methylated glycans as conserved targets of animal and fungal innate defense. Proc. Natl. Acad. Sci. USA 2014, 111, E2787–E2796. [Google Scholar] [CrossRef] [PubMed] [Green Version]
  3. Lechner, J.; Wieland, F.; Sumper, M. Transient Methylation of Dolichyl Oligosaccharides Is an Obligatory Step in Halibacterial Sulfated Glycoprotein Biosynthesis. J. Biol. Chem. 1985, 260, 8984–8989. [Google Scholar] [PubMed]
  4. Araki, S.; Satake, M.; Ando, S.; Hayashi, A.; Fujii, N. Characterization of a Diphosphonopentaosylceramide Containing 3-O-Methylgalactose from the Skin of Aplysia kurodai (Sea Hare). J. Biol. Chem. 1986, 261, 5138–5144. [Google Scholar] [PubMed]
  5. Allsobrook, A.J.R.; Nunn, J.R.; Parolis, H. The Linkage of 4-O-Methyl-L-Galactose in the Sulphated Polysaccharide of Aeodes ulvoidea. Carbohydr. Res. 1974, 36, 139–145. [Google Scholar] [CrossRef]
  6. Navarro, D.A.; Stortz, C.A. The system of xylogalactans from the red seaweed Jania rubens (Corallinales, Rhodophyta). Carbohydr. Res. 2008, 343, 2613–2622. [Google Scholar] [CrossRef] [PubMed]
  7. Ogawa, K.; Yamaura, M.; Maruyama, I. Isolation and Identification of 3-O-Methyl-D-galactose as a constituent of Neutral Polysaccharide of Chlorella vulgaris. Biosci. Biotech. Biochem. 1994, 58, 942–944. [Google Scholar] [CrossRef]
  8. Ogawa, K.; Arai, M.; Nagawa, H.; Ikeda, Y.; Kondo, S. A New β-D-Galactan Having 3-O-Methyl-D-galactose from Chlorella vulgaris. J. Appl. Glycosci. 2001, 48, 325–330. [Google Scholar] [CrossRef]
  9. Bacon, J.S.D.; Cheshire, M.V. Apiose and mono-O-methyl sugars as minor constituents of the leaves of deciduous trees and various other species. Biochem. J. 1971, 124, 555–562. [Google Scholar] [CrossRef] [Green Version]
  10. Hirst, E.L.; Hough, L.; Jones, J.K.N. Constitution of the mucilage from the bark of Ulmus fulva (slippery elm mucilage). Part III. The isolation of 3-monomethyl-D-galactose from the products of hydrolysis. J. Chem. Soc. 1951, 323–325. [Google Scholar] [CrossRef]
  11. Barsett, H.; Paulsen, B.S. Separation of acidic polysaccharides from Ulmus glabra Huds. On Mono-P. J. Chromatogr. 1985, 329, 315–320. [Google Scholar] [CrossRef]
  12. Barsett, H.; Paulsen, B.S. Separation, isolation and characterization of acidic polysaccharides from the inner bark of Ulmus glabra Huds. Carbohydr. Polym. 1991, 17, 137–144. [Google Scholar] [CrossRef]
  13. Popper, Z.A.; Sadler, I.H.; Fry, S.C. 3-O-Methyl-D-galactose residues in lycophyte primary cell walls. Phytochemistry 2001, 57, 711–719. [Google Scholar] [CrossRef]
  14. O’Rourke, C.; Gregson, T.; Murray, L.; Sadler, I.H.; Fry, S.C. Sugar composition of the pectic polysaccharides of charophytes, the closest algal relatives of land-plants: Presence of 3-O-methyl-D-galactose residues. Ann. Bot. 2015, 116, 225–236. [Google Scholar] [CrossRef] [PubMed] [Green Version]
  15. Capek, P. An arabinogalactan containing 3-O-methyl-D-galactose residue isolated from the aerial parts of Salvia officinalis L. Carbohydr. Res. 2008, 343, 1390–1393. [Google Scholar] [CrossRef]
  16. Blakeney, A.B.; Haris, P.J.; Stone, B.A. A simple and rapid preparation of alditol acetates for monosaccharide analysis. Carbohydr. Res. 1983, 113, 291–299. [Google Scholar] [CrossRef]
  17. Fox, A.; Morgan, S.L.; Gilbart, J. Chapter 5: Preparation of Alditol Acetates and Their Analysis by Gas Chromatography (GC) and Mass Spectrometry (MS). In Analysis of Carbohydrates by GLC and MS.; Biermann, C.J., McGinnis, G.D., Eds.; CRC Press: Boca Raton, FL, USA, 1988; pp. 87–118. [Google Scholar]
  18. International Conference on Harmanization. Harmonized Tripartite Guideline, Validation of Analytical Procedures, Text and Methodology, ICH Q2R1; European Medicines Agency: London, UK, 2006.
  19. Bartels, D.; Classen, B. Structural investigations on arabinogalactan-proteins from a lycophyte and different monilophytes (ferns) in the evolutionary context. Carbohydr. Polym. 2017, 172, 342–351. [Google Scholar] [CrossRef]
  20. United Nations Office on drugs and crime. Guidelines for Testing Drugs under International Control in Hair, Sweat and Oral Fluid, ST/NAR/30/Rev.2; United Nations office: Vienna, Austria, 2014. [Google Scholar]
  21. Classen, B.; Baumann, A.; Utermoehlen, J. Arabinogalactan-proteins in spore-producing land plants. Carbohydr. Polym. 2019, 210, 215–224. [Google Scholar] [CrossRef]
  22. Fu, H.; Yadav, M.P.; Nothnagel, E.A. Physcomitrella patens Arabinogalactan Proteins Contain Abundant Terminal 3-O-methyl-L:-Rhamnosyl Residues Not Found in Angiosperms. Planta 2007, 226, 1511–1524. [Google Scholar] [CrossRef]
  23. Bartels, D.; Baumann, A.; Maeder, M.; Geske, T.; Heise, E.M.; von Schwartzenberg, K.; Classen, B. Evolution of plant cell wall: Arabinogalactan-proteins from three moss genera show structural differences compared to seed plants. Carbohydr. Polym. 2017, 163, 227–235. [Google Scholar] [CrossRef]
  24. Pfeifer, L.; Shafee, T.; Johnson, K.L.; Bacic, A.; Classen, B. Arabinogalactan-proteins of Zostera marina L. contain unique glycan structures and provide insight into adaption processes to saline environments. Sci. Rep. 2020, 10, 8232. [Google Scholar] [CrossRef] [PubMed]
  25. Rosado, F.R.; Carbonero, E.R.; Claudino, R.F.; Tischer, C.A.; Kemmelmeier, C.; Iacomini, M. The presence of partially 3-O-methylated mannogalactan from the fruit bodies of edible basidiomycetes Pleurotus ostreatus ‘florida’ Berk. and Pleurotus ostreatoroseus Sing. FEMS Microbiol. Lett. 2003, 221, 119–124. [Google Scholar] [CrossRef] [Green Version]
  26. Yang, Y.; Zhang, J.S.; Liu, Y.F.; Tang, Q.J.; Zhao, Z.G.; Xia, W.S. Structural elucidation of a 3-O-methyl-D-galactose-containing neutral polysaccharide from the fruiting bodies of Phellinus igniarius. Carbohydr. Res. 2007, 342, 1063–1070. [Google Scholar] [CrossRef]
  27. Hokputsa, S.; Harding, S.E.; Inngjerdingen, K.; Jumel, K.; Michaelsen, T.E.; Heinze, T.; Koschella, A.; Paulsen, B.S. Bioactive Polysaccharide from the Stems of the Thai Medicinal Plant Acanthus ebracteatus: Their Chemical and Physical Features. Carbohydr. Res. 2004, 339, 753–762. [Google Scholar] [CrossRef] [PubMed]
  28. Smith, P.J.; O’Neill, M.A.; Backe, J.; York, W.S.; Peña, M.J.; Urbanowicz, B.R. Analytical Techniques for Determining the Role of Domain of Unknown Function 579 Proteins in the Synthesis of O-Methylated Plant Polysaccharides. SLAS Technol. 2020, 25. [Google Scholar] [CrossRef] [PubMed]
  29. Temple, H.; Mortimer, J.C.; Tryfona, T.; Yu, X.; Lopez-Hernandez, F.; Sorieul, M.; Anders, N.; Dupree, P. Two members of the DUF 579 family are responsible for arabinogalactan methylation in Arabidopsis. Plant. Direct. 2019, 3, e00117. [Google Scholar] [CrossRef] [Green Version]
  30. Urbanowicz, B.R.; Peña, M.J.; Ratnaparkhe, S.; Avci, U.; Backe, J.; Steet, H.F.; Foston, M.; Li, H.; O’Neill, M.A.; Ragauskas, A.J.; et al. 4-O-methylation of glucuronic acid in Arabidopsis glucuronoxylan is catalyzed by a domain of unknown function family 579 protein. Proc. Natl. Acad. Sci. USA 2012, 109, 14253–14258. [Google Scholar] [CrossRef] [Green Version]
  31. Şengül, Ü. Comparing determination methods of detection and quantification limits for aflatoxin analysis in hazelnut. J. Food Drug Anal. 2016, 24, 56–62. [Google Scholar] [CrossRef] [Green Version]
  32. Food and Drug Agency (USA). Guidance for Industry: Analytical Procedures and Methods Validation: Chemistry, Manufacturing and Controls Documentation; U.S. Department of Health and Human Service: Rockville, MD, USA, 2000.
  33. National Health and Welfare CA. Drugs Directorate Guidelines, Acceptable Methods; National Health and Welfare, Health Protection Branch: Ottawa, ON, Canada, 1994.
  34. Sassaki, G.L.; Iacomini, M.; Gorin, P.A.J. Methylation-GC-MS analysis of arabinofuranose- and galactofuranose-containing structures: Rapid synthesis of partially O-methylated alditol acetate standards. An. Acad. Bras. Cienc. 2005, 77, 223–234. [Google Scholar] [CrossRef]
  35. Popper, Z.A.; Fry, S. Primary Cell Wall Composition of Bryophytes and Charophytes. Ann. Bot. 2003, 91, 1–12. [Google Scholar] [CrossRef] [Green Version]
Figure 1. Primary fragments of 4-O- and 3-OMe-galactose after reduction and acetylation. (A + C) after common reduction performed with sodium borohydride and following peracetylation. (B + D) after our modified reduction with sodium borodeuteride and following peracetylation. Deuterium is marked in light blue. The upper two panels show 3-OMe-galactose, while the lower two show 4-OMe-galactose.
Separations 07 00042 g001
Figure 2. Gas chromatogram of the corresponding SIM peaks of 3-OMe-Glc after borodeuteride reduction and acetylation. Chosen quantifier and qualifier ions are highlighted by arrows.
Separations 07 00042 g002
Figure 3. Mass spectra of the two deuterated hexose derivatives (blue = 3-OMe-hexose and orange = 4-OMe-hexose), as well as the standard myo-inositol (green) after reduction with borodeuteride and subsequent acetylation. The most intense fragments are marked and further fragmentation is explained by arrows.
Separations 07 00042 g003
Figure 4. Calibration curves for 3-OMe-hexose (A) and 4-OMe-hexose (B) with corresponding R2 values. The repeated regression curves and their R2 values are indicated by dotted lines.
Separations 07 00042 g004
Figure 5. Gas chromatogram (A) of the SIM lanes for the quantifier ions of 3-OMe-hexose (blue) and 4-OMe-hexose (orange) and the unknown peak (grey). The retention time was calculated relative to the quantifier ion (m/z = 168) of myo-inositol. (B) shows the mass spectrum for the unknown peak.
Separations 07 00042 g005
Table 1. Selected quantifier and qualifier ions for the two fully acetylated methylated hexoses as well as for the fully-acetylated standard myo-inositol.
MonosaccharideQuantifier IonQualifier Ions
3-O-hexosem/z = 130m/z = 190, m/z = 261, m/z = 115
4-O-hexosem/z = 129m/z = 189, m/z = 262, m/z = 116
myo-inositolm/z = 168m/z = 115, m/z = 210, m/z = 157
Table 2. Linearity parameters determined for the two methylated hexoses. LOD: limit of detection; LOQ: limit of quantification (both given in mg/mL).
MonosaccharideEquation of the Regression CurveR2 ValueCalculated LODCalculated LOQ
3-OMe-hexosey = 4.718x − 0.06640.99960.0090.026
4-OMe-hexosey = 12.964x − 0.240.99710.0130.041
Table 3. Parameters from the measurements of repeatability, intra- and inter-day precision. Values in percent represent the relative standard deviation (RSD).
MonosaccharideRepeatability PrecisionIntra-Day PrecisionInter-Day Precision (Day 2)Inter-Day Precision (Day 3)
3-OMe-hexose0.60%5.91%6.45%6.23%
4-OMe-hexose0.41%4.68%5.46%5.46%
Table 4. Calculated relative recoveries (given in percent) of the methylated hexoses in the spiked matrix. Spike concentration is decreasing from 1 to 3. In brackets the standard deviation of the mean is given.
MonosaccharideSpike Concentration 1Spike Concentration 2Spike Concentration 3
3-O-hexose99.47% (±3.11%)92.77% (±2.10%)110.25% (±1.57%)
4-O-hexose87.02% (±2.15%)99.24% (±1.66%)130.37% (±2.13%)

