1. Introduction
Phosphorylation is one of the most widely investigated post-translational modifications (PTMs) of proteins. This ubiquitous PTM is responsible for several biological functions—for example, signal transduction, switching on/off the functionality of a protein, or growth regulation during cancer [
1]. The phosphate group is usually attached to serine, threonine, or tyrosine side chains with different abundance (pSer >> pThr >> pTyr) [
2], but there has been evidence for histidine and arginine phosphorylation as well [
3]. Despite its widespread presence, the overall ratio of phosphorylated proteins to non-phosphorylated proteins and the coverage of phosphosites are relatively small. The analysis is further complicated due to their low electrospray ionization efficiency compared to non-phosphorylated analogs [
4]. Although mass spectrometry (MS) is an established and powerful analytical technique with its ever-growing sensitivity, low-abundance PTMs are still easily overlooked during the analysis due to sensitivity limitations. Taking all these into consideration, it is advisable to perform an enrichment/isolation step before MS measurements. The most common way is to perform affinity-based solid-phase extraction (SPE) or chromatography enrichment/fractionation [
5]. These methods incorporate, on the one hand, immobilized metal affinity chromatography (IMAC) and metal oxide affinity chromatography (MOAC) mainly but not only for SPE. On the other hand, reversed-phase (RP), hydrophilic interaction (HILIC), electrostatic repulsion hydrophilic interaction (ERLIC), and ion-exchange methods are mainly used for the chromatographic fractionation of proteolytic peptides [
6,
7,
8]. The MOAC stationary phases show a large variety: titania, zirconia, alumina, boehmite, hydro crystalline aluminum hydroxide, etc. [
9,
10,
11]. Of these methods, TiO
2-based MOAC methods are the most widespread, since the stationary phase is reasonably cheap, easily accessible, and easy to use.
Most of the enrichment methods need large amounts of starting material (several milligrams usually) [
12,
13]. Alternatively, methods for investigating a single protein from small amounts of complex samples have also been developed (e.g., casein analysis) [
14,
15]. There are hardly any literature protocols available [
16] for the TiO
2-based phosphopeptide enrichment of sub-microgram complex samples like tissue microbiopsies, despite the fact that the above-mentioned methods are not directly applicable for these kinds of samples. However, there have been some IMAC methods providing satisfactory enrichment performance down to 1 µg of complex samples, yet posing the problem of moderate specificity [
17,
18,
19]. Literature evidence and our experience suggested that the amount of the starting material and the analyte/stationary phase ratio was a major factor influencing the performance of the enrichment [
20]. Different and individually optimized methods are necessary for simple and complex matrices and also when processing small (e.g., 1 µg) or large amounts (e.g., over 1 mg) of starting material [
21]. Our focus was to develop a fast and simple manual MOAC method for the future investigation of phosphorylation changes of proteins in tissue microarray samples (approximately 500–1000 ng protein content).
For TiO
2-based MOAC enrichment, the amphoteric property of the stationary phase is used to retain the analytes. At low pH, TiO
2 behaves as a Lewis base and the phosphate groups form strong secondary interactions with the stationary phase while the protonated non-phosphorylated peptides cannot bind efficiently. However, at high pH, the stationary phase behaves as a Lewis acid; thus, formerly bound phosphopeptides will be released and eluted [
22]. The elution is quite simple: it can be achieved by increasing the pH of the mobile phase using usually ammonia or ammonium bicarbonate in combination with organic bases. However, proper sample loading is a crucial step for the efficient enrichment of phosphopeptides. For this reason, many different loading methods have been used and can be found in the literature. The proper binding of the phosphopeptides can be achieved by applying appropriately low pH (ca. pH = 1–2) to achieve the protonation of peptides and retain the ionic form of the phosphate groups [
23]. The undesired binding of non-phosphorylated peptides can be further suppressed by displacing agents (e.g., benzoic acid derivatives, citric acid, lactic acid, tartaric acid, glycolic acid, oxalic acid, etc.) [
9,
23,
24]. The use of displacing agents may solve the problem of binding efficiency decrease caused by interfering acidic peptides with pK
a values similar to that of the phosphate group or add additional selectivity for the binding of phosphorylated peptides [
25,
26]. Due to the large variety of methods developed for sample loading, many studies addressed the optimization of the loading solvent composition for titania enrichment systems [
21,
27]. An additional and rarely considered factor playing an important part in MOAC is the morphology of the stationary phase that substantially influences the performance of the enrichment system; thus, we examined two different stationary phases.
Performance of the enrichment method cannot be described using only one parameter; several properties must be taken into consideration. The most important parameters are the number of phosphopeptides/phosphoproteins identified from a given sample, the enrichment factor (the change in the ratio of phosphopeptides/non-phosphorylated peptides), recovery, and repeatability. Furthermore, the selectivity for various phosphorylation sites, mono/multiply phosphorylated peptides, or different hydrophobicity and isoelectric point ranges also need to be considered.
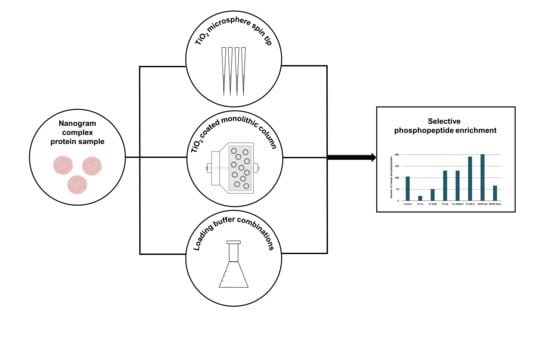
We aimed to investigate, optimize, and describe the performance of various TiO2-MOAC systems for the enrichment of small amounts of complex samples carrying out a detailed performance test of two different stationary phases (spin tip filled with TiO2 microspheres and a TiO2 nanoparticle-coated monolithic column) and various sample loading solvent combinations (including trifluoroacetic acid, lactic acid, 2,5-dihydroxybenzoic acid, citric acid, heptafluorobutyric acid, and acetic acid).
2. Results and Discussion
We performed a detailed investigation of loading solvents providing different degrees of selectivity in TiO2-based MOAC systems for enriching complex samples in the nanogram range. A mixture of 500 ng HeLa tryptic digest (HeLa hereinafter) and 500 fmol synthetic phosphopeptide mix (PP mix hereinafter) was subjected to phosphopeptide enrichment. Half of the resulting sample was analyzed using nanoLC-MS/MS; therefore, theoretically, 250 ng HeLa and 250 fmol PP mix. Five parallel enrichments were performed with all the methods tested. The control sample was subjected only to C18 clean-up. This type and amount of sample is a good model system for small amounts of complex samples such as tissue biopsies or tissue microarrays.
Two different stationary phases were investigated: spin tip filled with TiO
2 microspheres and TiO
2 nanoparticle-coated monolithic column. Five methods were investigated for the spin tip setup and two for the TiO
2 functionalized monolithic column, applying identical solvent compositions to two of the spin-tip methods. The tested methods are summarized in
Table 1. One of the spin tip methods (ST-50CA) was further modified to decrease the non-specific binding of non-phosphorylated peptides (discussed separately). The enrichment performance of the tested methods is described by the number of identified PPs, selectivity, repeatability, and recovery.
2.1. Phosphopeptide Identification
Performance concerning phosphopeptide (PP) identification has been characterized using several factors: the total number of identified PPs in five parallel runs; the average number of identified PPs (average of five runs); and the enrichment factor (EF), which describes the change in the ratio of the number of PPs to the number of non-phosphorylated peptides (NPs).
Among the methods studied, four (ST-AA, ST-1000CA, ST-50CA, and MON-AA) gave the expected result, i.e., the number of identified PPs increased, while the number of NPs decreased. Surprisingly, in the other cases (ST-LA, ST-DHB, and MON-50CA), less PPs were identified after sample preparation than from the control sample (no enrichment). This is likely due to insufficient binding of phosphopeptides to the stationary phase.
The best results were obtained using the ST-50CA and MON-AA methods, which both resulted in two times larger numbers of PPs identified. Among these, ST-50CA is preferable, as in this case, the enrichment factor is higher (i.e., over 90% of the NPs were removed; see
Table 2).
The results indicate that both the loading conditions and the TiO2 stationary phases have a large influence on performance. Note also that while 50 mM citric acid-based loading is best with the spin tip, acetic acid-based loading performs better with the monolithic column. These results suggest that the stationary phase’s morphology strongly determines the performance.
The next important parameter is the enrichment factor (EF), which describes the changes in the PP/NP ratio in comparison to that of the control sample (calculated based on average identification numbers; see
Table 2). There is an extremely high EF for the ST-LA and ST-DHB methods due to the near-complete removal of the NPs; however, their overall performance is poor. The two methods applying citric acid (ST-50CA and ST-1000CA) showed outstanding results (EF = 35.1 and 77.8, respectively). This implies that citric acid is an effective displacing agent in this spin tip setup. The MON-AA method resulted in a moderate EF, implying that the NP removal of the setup should be further improved.
2.2. Selectivity
Another important parameter besides enrichment efficiency is selectivity. This can be subdivided based on the degree and site of phosphorylation and also the length, the isoelectric point, and the hydrophobicity of the peptide backbone. These comparisons are based on the total number of identified PPs.
All methods, except MON-50CA, showed an increased selectivity towards doubly phosphorylated peptides (
Figure 1). In most cases, doubly phosphorylated peptides were enriched by a factor of 1.7–4.3 more than monophosphorylated peptides. In the case of samples enriched using the ST-AA method, the ratio of doubly phosphorylated peptides increased from 1.9% (control sample) to 13.0% (
Figure 1a), a 7.7-fold increase. This is also the method which identified the largest number of doubly phosphorylated peptides (altogether 17). This is over 1.9 times more than that using the otherwise most favorable ST-50CA and MON-AA methods (6 and 9, respectively); therefore, ST-AA is the method of choice for analyzing doubly phosphorylated peptides.
In contrast to a recent publication [
25], we observed only a moderate increase in the selectivity of the ST-1000CA method towards doubly phosphorylated peptides compared to the ST-50CA method. The cause of the difference between the two findings is presumably the different form of TiO
2 used.
Regarding phosphorylation sites, remarkable differences were observed compared to the distribution of the control sample. All enrichment methods showed 2–4 times increased selectivity towards threonine phosphorylated (pT) peptides (
Figure 1b). Most methods showed an approximately 1.9–2.5-fold increase towards enrichment and identification of tyrosine phosphorylation (pY,
Figure 1b).
The peptide backbone bearing the phosphorylation also has a marked influence on phosphopeptide enrichment. The peptide length had a relatively small but well identifiable influence on the enrichment of phosphopeptides (
Figure 2a). The peptide length distribution was similar for all methods, providing increased phosphopeptide identification (ST-AA, ST-1000CA, ST-50CA, MON-AA). In all of these cases, a preferred enrichment/identification of small-size peptides was shown. This might be expected, as the influence of the phosphate group on peptide behavior is more pronounced if the peptide is smaller. The other methods provided non-conventional distributions due to the improper binding of the phosphopeptides.
The acidity of the peptide backbone (as measured by the isoelectric point) has a large influence on the selectivity of phosphopeptide enrichment (
Figure 2b). In the control sample, over 92% of the PP backbones identified were acidic, and the mean pI was 4.29. The MON-50CA method conserved this distribution. In the case of all other methods, the pI distribution of PPs identified shifted significantly towards the basic range. The mean pI in the case of the most favorable ST-50CA method was 5.47, while the largest shift (mean pI = 6.59) was observed in the case of the ST-DHB method. These findings indicate that the enrichment of neutral or basic phosphopeptides is more efficient than those having an acidic backbone (
Figure 2b).
The hydrophobicity of the enriched peptides as measured by the Grand Average of Hydropathy (GRAVY) index is also a good descriptor of selectivity. Enrichment slightly favors hydrophobic peptides, but the change was only very small (
Figure 2c).
We have compared the identity of PPs identified using the two most promising methods (ST-50CA and MON-AA) to that of the control sample. This showed a fairly large variability of PPs identified using different enrichment methods (
Figure 3). As noted above (
Table 2), using either ST-50CA or MON-AA enrichment, around two-times more PPs are identified. However, a significant amount of PPs successfully identified without enrichment are not observed in the enriched samples. Note that there is a significant difference between the ST-50CA and MON-AA enriched samples as well (
Figure 3c); only around half of the PPs are observed in both samples. This also means that performing both ST-50CA and MON-AA enrichment would increase PP hits by ca. 30% compared to using only one technique. More detailed comments and discussion on the effect of the stationary phases and loading solvent combinations are given in the
Supplementary Information.
2.3. Repeatability
The repeatability of the methods can be assessed from two points of view: the variations in the PPs identified and variations in the relative amount of the various PPs identified (qualitative and quantitative aspects). Qualitative analysis in LC-MS is usually based on data-dependent analysis (DDA), which is very sensitive but has a significant chance factor when identifying compounds of low abundance. For this reason, it is typical that in parallel runs, various compounds are sometimes identified and some other times not found. We have performed five parallel experiments, both in the case of the control sample and in the case of samples enriched by various methods. A qualitative measure of the repeatability is the comparison of the number of PPs which were identified in all five runs, with the number of PPs which were identified in only one run, but not in the other four. In the control (unenriched) sample, there were nearly three-times more PPs identified in one run than those PPs which were identified in all five runs (
Figure 4). The enriched samples, in general, showed much better repeatability. Results of the two most promising methods (ST-50CA and MON-AA) are shown in
Figure 4. Repeatability is best in the case of the ST-50CA method, where more PPs are identified in all five parallel runs than in those observed only once. This is due to two favorable circumstances: first, the enriched samples contain a larger portion of PPs. Second, and probably more importantly, the amount of non-phosphorylated peptides is significantly reduced, simplifying the sample complexity. Both effects help to diminish the negative influence of DDA analysis. Note that despite this negative feature, DDA analysis is essential for the sensitive analysis of complex samples. Further details on repeatability are given in the
Supplementary Information.
The assessment of quantitative repeatability was evaluated based on the relative standard deviation (RSD) of the peak areas of four PPs mixed in low amounts (250 fmol) into the HeLa cell lysate (
Table 3). In the case of the control sample (no enrichment), the average RSD was on average 24.2%, which is a typical value when analyzing complex mixtures (without any normalization). The enriched samples showed similar RSD values, indicating that sample treatment did not increase the RSD values significantly. In fact, RSD values in the case of the ST-50CA and MON-AA methods were somewhat better, on average 21.5% and 16.0%, respectively.
2.4. Improving the Selectivity of the Spin Tip Method
Based on the results and practical considerations presented above, the ST-50CA gave the best overall performance. The results discussed above suggest that reducing non-specific binding of NPs to the stationary phase may result in further improvement. With this in mind, we tested two variants: in one case, we increased the TFA content of the loading solvent from 0.1% to 1.5% (ST-50CA-B method), while in the other case, we used a more complex loading solvent (0.1% TFA + 50mM CA + 0.2% HFBA + 1.5% AA, indicated as the ST-50CA-C method).
Table 4 summarizes the changes in their performance compared to the original ST-50CA method.
There was very little change in the number of PPs identified, but the number of NPs identified decreased significantly, especially in the case of the ST-50CA-B method. This simplified the chromatograms and improved the enrichment factor by nearly tenfold. There was no significant change in selectivity, concerning peptide length, GRAVY score, pI, phosphorylation site, and phosphorylation extent, compared to the ST-50CA method. Only a minor difference was observed among the PPs identified: 60% of PPs were identified using all the three methods, and over 70% of the PPs, were commonly identified in each pair of methods (
Figure S3 in Supplementary Information). This overlap is significantly higher than that observed with any other method pairs discussed in
Section 2.2. There was only a marginal change in repeatability compared to the ST-50CA method (
Figure S5 in the Supplementary Information). In summary, the ST-50CA-B method gave the best overall performance; therefore, this is the method of choice for the phosphopeptide enrichment of complex protein mixtures in the nanogram range.
3. Materials and Methods
3.1. Reagents and Samples Used
Acetonitrile (ACN), LC-MS grade water (H
2O), and methanol (MeOH) were purchased from VWR International (Debrecen, Hungary). Ammonium dihydrogen phosphate (ADPH), 2,5-dihydroxybenzoic acid (DHB), citric acid (CA), glacial acetic acid (AA), trifluoroacetic acid (TFA), heptafluorobutyric acid (HFBA), and pyrrolidine were purchased from Sigma-Aldrich (Budapest, Hungary). Ammonia and sodium chloride (NaCl) were purchased from Reanal (Budapest, Hungary). Lactic acid (LA), Pierce™ C
18 SPE columns, and Pierce™ TiO
2 Spin Tips were purchased from Unicam Plc. (Budapest, Hungary). The CIM-OH-TiO
2 porous TiO
2 nanoparticle-coated monolithic column was made by BIA Separations (Ajdovščina, Slovenia) during the FP7 EU Project “Prot-HiSPRA” for the Medical University of Vienna [
28].
For testing the enrichment performance of the different setups, we used the mixture of 500 ng Thermo Fisher Pierce HeLa cell line tryptic digest (Unicam Plc, Budapest, Hungary) and 500 fmol Enolase MassPrep Phosphopeptide mix (Waters Hungary, Budapest, Hungary). The Enolase phosphopeptide mix contains four synthetically phosphorylated peptides (one serine, threonine, tyrosine, and double serine phosphorylated, respectively) besides the tryptic digest of the protein. After the enrichment and C18 clean-up, the resulting samples were reconstituted in 10 µL 98% H2O, 2% ACN, 0.1% FA injection solvent, of which 5 µL was injected (250 ng, theoretical, HeLa peptide and 250 fmol, theoretical, synthetic phosphopeptide content). In the case of control samples, only C18 clean-up was performed.
3.2. Phosphopeptide Enrichment
3.2.1. Loading Solvent Dependence of TiO2 Spin Tip Setup
Pierce™ TiO2 Spin Tips (ST) were used for all the below-listed methods. The following centrifugation speeds were applied: 1000× g, 10 min for loading; 1000× g, 5 min for elution; 2000× g, 2 min for all the other steps.
The impact of lactic acid on phosphopeptide enrichment was assessed using the slightly modified version of the manufacturer’s protocol (ST-LA). The spin tips were first conditioned with 20 µL of Loading Solvent A (LBA; 80% ACN, 20% H2O, 2% TFA), followed by equilibration with 20 µL of Loading Solvent B (LBB; 26% lactic acid in LBA). The samples were loaded and re-loaded onto the column in 150 µL LBB, then washed with 20 µL LBB and 3 × 20 µL LBA. The first elution step was performed using 50 µL of 1.5% ammonia (in 100% H2O), followed by 50 µL 5% pyrrolidine (in 100% H2O). After the elution, the samples were lyophilized and prepared for the C18 clean-up.
The impact of 2,5-dihydroxybenzoic acid and citric acid (ST-DHB, ST-50CA, and ST-1000CA) on the enrichment performance was tested using the following protocol. The spin tips were first conditioned with 2 × 50 µL washing solvent (WB; 40% ACN, 60% H2O, 0.1% TFA), then they were equilibrated with 2 × 50 µL sample loading solvent. The samples were loaded and re-loaded onto the column in 150 µL loading solvent consisting of 80% ACN, 20% H2O, 0.1% TFA, and the displacing agent. The displacing agents were as follows: 250 mg mL−1 DHB, 50 mM citric acid, and 1000 mM citric acid. The columns were then washed with 2 × 50 µL loading solvent and 2 × 50 µL washing solvent. The first elution step was performed with 50 µL of 4% ammonia (in 80% ACN, 16% H2O), followed by 2 × 50 µL of 4% ammonia (in 100% H2O). After the elution, the samples were lyophilized and prepared for the C18 clean-up.
The impact of acetic acid (ST-AA) was tested using identical solvents as in 3.2.2; however, the protocol was adapted to fit the spin tip column dimensions. The spin tips were first conditioned with 2 × 50 µL washing solvent (80% ACN, 20% H2O, 0.1% TFA), then equilibrated with 2 × 50 µL sample loading solvent (20% AA, 100 mM NaCl, 50 mg mL−1 DHB, 0.2% HFBA in H2O). The samples were loaded and re-loaded onto the column in 150 µL loading solvent. The columns were then washed with 2 × 50 µL loading solvent, 2 × 50 µL washing solvent. Elution was performed with 3 × 50 µL of 4% ammonia, 25 mM ADPH (in 50% ACN, 50% H2O). After the elution, the samples were lyophilized and prepared for the C18 clean-up.
3.2.2. Loading Solvent Dependence of CIM-OH-TiO2 Setup
The monolithic column was operated off-line; solvents and samples were loaded on the column with a syringe pump at 100 µL min−1 for loading and elution and 200 µL min−1 for all the other steps.
The loading solvent dependence of the TiO2 functionalized monolithic column (MON) was tested with two different solvent setups, both comparable with the spin tip methods: one of the methods was a slightly modified version of a method previously optimized specifically for this column (same solvents as the acetic acid method for the spin tips), while the other was the most promising method (50 mM CA, 0.1% TFA) in the spin tip setup.
The AA-based method (MON-AA) was the following. The column was equilibrated with 2 × 200 µL sample loading solvent (20% AA, 100 mM NaCl, 50 mg mL−1 DHB, 0.2% HFBA in H2O). The samples were loaded and re-loaded onto the column in 200 µL loading solvent. Then, the column was washed with 200 µL loading solvent, then with 2 × 250 µL washing solvent (80% ACN, 20% H2O, 0.1% TFA). The elution was performed using 2 × 200 µL of 4% ammonia, 25 mM ADPH (in 50% ACN, 50% H2O). The first 50 µL of the elution fraction was discarded since it was the washing solvent contained in the dead volume of the column. After the elution, the samples were lyophilized and prepared for the C18 clean-up.
The 50 mM CA-based method (MON-50CA) was the following. The column was equilibrated with 2 × 200 µL sample loading solvent (50 mM CA, 0.1% TFA in 80% ACN, 20% H2O). The samples were loaded and re-loaded onto the column in 200 µL loading solvent. Then, the column was washed with 200 µL loading solvent, then with 2 × 250 µL washing solvent (80% ACN, 20% H2O, 0.1% TFA). The elution was performed with 200 µL of 4% ammonia (in 80% ACN, 20% H2O) and followed by 200 µL of 4% ammonia (in 100% H2O). The first 50 µL of the elution fraction was discarded since it was the washing solvent contained in the dead volume of the column. After the elution, the samples were lyophilized and prepared for the C18 clean-up.
3.2.3. Optimization of Citric Acid–TiO2 Spin Tip Setup
The 50 mM CA–TiO
2 spin tip setup was modified to reduce the amount of non-specifically bound peptides. There were two loading solvents compared to the original ST-50CA method (50 mM CA, 0.1% TFA in 80% ACN, 20% H
2O): (i) 50 mM CA, 1.5% TFA in 80% ACN, 20% H
2O (ST-50CA-B method); (ii) 50 mM CA, 0.1% TFA, 1.5% AA, 0.2% HFBA in 80% ACN, 20% H
2O (ST-50CA-C method). All the other solvents and the loading, washing, and elution procedures were the same as described in
Section 3.2.1.
3.3. C18 Sample Clean-Up
For desalting and clean-up, Thermo Fisher Scientific PierceTM C18 spin columns were used. The column was conditioned with 2 × 200 µL of 50% MeOH, 50% H2O, then washed with 2 × 200 µL 0.5% TFA, 95% H2O, 5% ACN and equilibrated with 2 × 200 µL loading solvent (0.1% TFA in H2O). The samples were loaded and re-loaded onto the column in 50 µL loading solvent and washed twice with 100 µL loading solvent. Elution was performed with 2 × 50 µL 0.1% TFA in 70% ACN, 30% H2O. After the elution, the samples were lyophilized and stored at −20 °C until reconstitution for injection.
3.4. Mass Spectrometry and Chromatography Analysis
Samples were dissolved in 10 µL injection solvent (98% H2O, 2% ACN and 0.1% FA) out of which 5 µL was subjected to nanoLC-MS/MS analysis using a Dionex Ultimate 3000 RSLC nanoLC (Dionex, Sunnyvale, CA, USA) coupled to a Bruker Maxis II Q-TOF (Bruker Daltonik GmbH, Bremen, Germany) via CaptiveSpray nanoBooster ionization source (0.1% FA in ACN as booster liquid). Trapping was performed on an Acclaim PepMap100 C18 (5 µm, 100 µm × 20 mm, Thermo Fisher Scientific, Waltham, MA, USA) trap column with 0.1% TFA (H2O) as the transport liquid. Peptides were separated on an Acquity M-Class BEH130 C18 analytical column (1.7 µm, 75 µm × 250 mm Waters, Milford, MA, USA) using 1-step linear gradient elution (4–50% eluent B in 90 minutes); Solvent A was 0.1% FA in H2O, Solvent B was 0.1% FA in ACN, flow rate 300 nL min−1. Spectra were collected using a fixed cycle time of 2.5 sec and the following scan speeds: MS spectra at 3 Hz, while CID was performed on multiply charged precursors at 16 Hz for abundant ones and at 4 Hz for low-abundance ones. Internal calibration was performed by infusing sodium formate and data were automatically recalibrated using the Compass Data Analysis (v4.3; Bruker Daltonik GmbH, Bremen, Germany) software.
3.5. Data Evaluation
For the integration of extracted ion chromatogram (EIC) peak areas, Compass Data Analysis v4.3 was used. For the database search, Byonic (v3.6.0, Protein Metrics Inc, San Carlos, CA, USA) was used. First, a focused database was prepared with loose criteria (25 ppm precursor mass tolerance, 2% false discovery rate (FDR), other parameters same as the strict search), then the searches were performed against this focused database to maximize PTM identification performance. The parameters were the following: precursor mass tolerance 15 ppm, fragment mass tolerance 35 ppm, cleavage at lysine and arginine C terminal, maximum 2 missed cleavages, and 1% FDR limit. The set PTMs were the following: Carbamidomethyl/+57.021464 @ C | fixed; Oxidation/+15.994915 @ M | common2; Gln->pyro-Glu/-17.026549 @ NTerm Q | rare1; Glu->pyro-Glu/-18.010565 @ NTerm E | rare1; Ammonia-loss/-17.026549 @ NTerm C | rare1; Acetyl/+42.010565 @ Protein NTerm | rare1; Phospho/+79.966331 @ S, T, Y | common3; Deamidated/+0.984016 @ N, Q | rare1; Methyl/+14.015650 @ NTerm, H, K, N, R | rare1. The common modifications were maximized in 3 instances, and the rare modifications were limited to 2. From the hits, only peptides with negative logarithm of probability (AbsLogProb parameter in Byonic) ≥ 1.3 were considered reliable hits.
3.6. Isoelectric Point and GRAVY Score Calculation
The isoelectric points were calculated using the IPC—Isoelectric Point Calculator—by Kozlowsky [
29], and GRAVY (Grand Average of Hydropathy) scores [
30] were calculated with Microsoft Excel.
3.7. Data Visualization
Data visualization was done using Microsoft Excel, VIB-BEG Venn-diagram maker [
31], and the R package eulerr [
32].
3.8. Data Availability
The mass spectrometry proteomics data have been deposited in the ProteomeXchange Consortium via the PRIDE partner repository [
33] with the dataset identifier PXD019439.

 ,
, 


