Article

Rapid, Highly-Sensitive and Ecologically Greener Reversed-Phase/Normal-Phase HPTLC Technique with Univariate Calibration for the Determination of Trans-Resveratrol

1
Department of Pharmacognosy, College of Pharmacy, Prince Sattam Bin Abdulaziz University, Al-Kharj 11942, Saudi Arabia
2
Department of Pharmaceutics, College of Pharmacy, King Saud University, Riyadh 11451, Saudi Arabia
3
Department of Pharmacy Practice, College of Pharmacy, AlMaarefa University, Ad Diriyah 13713, Saudi Arabia
*
Author to whom correspondence should be addressed.
Separations 2021, 8(10), 184; https://doi.org/10.3390/separations8100184
Submission received: 15 September 2021 / Revised: 3 October 2021 / Accepted: 9 October 2021 / Published: 12 October 2021
(This article belongs to the Section Analysis of Food and Beverages)

Abstract

:
The rapid, highly-sensitive and ecologically greener reversed-phase (RP)/normal-phase (NP) high-performance thin-layer chromatography (HPTLC) densitometric technique has been developed and validated for the determination of trans-resveratrol (TRV). The reversed-phase HPTLC-based analysis of TRV was performed using ethanol–water (65:35, v v−1) combination as the greener mobile phase, while, the normal-phase HPTLC-based estimation of TRV was performed using chloroform–methanol (85:15, v v−1) combination as the routine mobile phase. The TRV detection was carried out at 302 nm for RP/NP densitometric assay. The linearity was recorded as 10–1200 and 30–400 ng band−1 for RP and NP HPTLC techniques, respectively. The RP densitometric assay was observed as highly-sensitive, accurate, precise and robust for TRV detection in comparison with the NP densitometric assay. The contents of TRV in commercial formulation were recorded as 101.21% utilizing the RP densitometric assay, while, the contents of TRV in commercial formulation were found to be 91.64% utilizing the NP densitometric assay. The greener profile of RP/NP technique was obtained using the analytical GREEnness (AGREE) approach. The AGREE scales for RP and NP densitometric assays were estimated 0.75 and 0.48, respectively. The recorded AGREE scale for the RP densitometric assay indicated that this technique was highly green/the ecologically greener compared to the NP densitometric assay. After successful optimization of analytical conditions, validation parameters, AGREE scale and chromatography performance, the RP densitometric assay with univariate calibration was found to be better than the NP densitometric assay for the analysis of TRV.

1. Introduction

Naturally derived bioactive compounds especially polyphenols have a significant impact on the management and treatment of various human disorders [1,2]. Trans-resveratrol (TRV) (IUPAC name: 3,5,4-trihydroxystilbene) is one of the leading compounds of the polyphenols category [3]. TRV has been found in various plants such as peanuts, grapes and berries, etc. [3,4]. TRV had several therapeutic activities due to its multiple intracellular targeting properties [2]. Several therapeutic activities such as antioxidant [5], anti-inflammatory [6], anti-carcinogenic [7,8], cardiovascular [9] and neuroprotective [10] properties have been reported in TRV. Due to great therapeutic effects of TRV, the researchers are moving forward towards the development of suitable analytical methodologies for the determination of TRV in the variety of samples such as plant extracts, pharmaceutical products, herbal products, polyherbal formulations, wines and physiological fluids.
Several analytical techniques have been established for the determination of TRV either alone or in combination with other bioactive compounds in plant extracts, pharmaceutical products, herbal products, polyherbal formulations, wines and body fluids. Some high-performance liquid chromatography (HPLC) assays are available for the quantification of TRV in polymeric nanoparticles, lipidic nanoemulsions and plant extracts [11,12,13,14]. Various HPLC assays are also available for the detection of TRV in different varieties of wine samples [15,16,17,18,19]. Various HPLC assays are also utilized for TRV analysis in the plasma samples of rats and humans [12,20,21,22,23]. HPLC assay was also utilized for the quantification of TRV in combination with quercetin in the whole blood sample [24]. Some HPLC analysis was also performed for the quantitation of TRV in dietary supplements [25,26]. Standard method performance requirements and validation protocols have also been set by the Association of Official Agricultural Chemists for the determination of TRV in dietary supplements and dietary ingredients [27]. Some liquid chromatography–mass spectrometry (LC-MS) assays were also utilized for TRV analysis in plant materials, wine samples and plasma samples [28,29,30,31]. Different high-performance thin-layer chromatography (HPTLC) techniques have also been utilized for TRV analysis in a variety of samples such as wine samples, plant extracts, pharmaceutical products, herbal products and polyherbal products [3,4,32,33,34,35]. Some other pharmaceutical assays such as gas chromatography–mass spectrometry (GC-MS), capillary electrophoresis, electrochemical and fluorimetry based assays have also been utilized for the determination of TRV in different samples [36,37,38,39].
Recently, the analytical techniques associated to the green analytical chemistry (GAC) or environmentally benign analytical chemistry are enhancing day by day in the analysis of natural/herbal compounds in their plant-based materials and polyherbal dosage forms [40,41,42,43,44,45]. Various analytical/metric approaches were applied for the prediction of greener profiles of the different analytical techniques for pharmaceutical, phytochemical and biomedical analysis [46,47,48,49,50]. Among those techniques, only the analytical GREEnness (AGREE) approach uses all 12 principles of the GAC for the assessment of greener profile of the analytical technique [48]. Therefore, the AGREE metric approach was used for the evaluation of the greener profile of current reversed-phase (RP)/normal-phase (NP) HPTLC technique [48].
Based on thorough literature analysis, it was observed that various pharmaceutical assays have been reported for the quantification of TRV either alone or in combination with other natural compounds in a variety of samples. Unfortunately, the greener profile of literature pharmaceutical assays was not assessed and hence not reported for any pharmaceutical assay. Greener HPTLC methods for the determination of various natural antioxidants such as cinnamaldehyde, eugenol, hesperidin, piperine, pterostilbene and thymoquinone have been reported in literature [43,51,52,53,54]. However, greener HPTLC methods have not been reported for the determination of TRV. Therefore, the present study was an attempt to establish and validate a rapid, highly-sensitive and ecologically greener (greenness is better than previously reported analytical methods of TRV) RP/NP HPTLC densitometric assay for the quantification of TRV in commercial formulation. The ecologically greener RP/NP HPTLC densitometric assay for the quantification of TRV was validated in terms of linearity, system efficiency parameters, accuracy, precision, robustness, sensitivity and specificity/peak purity according to The International Council for Harmonization for the Technical Requirements for Pharmaceuticals for Human Use (ICH) Q2 (R1) recommendations [55].

2. Materials and Methods

2.1. Materials

Standard TRV (purity > 99%) was procured from Sigma Aldrich (St. Louis, MO, USA). Chromatography-grade solvents such as chloroform (CLF), methanol (METH) and ethanol (EOTH) were obtained from E-Merck (Darmstadt, Germany). High purity deionized/Milli-Q water (WTR) was procured from a Milli-Q unit. The marketed capsules of TRV were obtained from a local pharmacy shop in Riyadh, Saudi Arabia.

2.2. Chromatography and Analytical Conditions

For the quantification of TRV by the RP/NP HPTLC densitometric assay, the analytical conditions and various parameters tabulated in Table S1 were utilized.

2.3. TRV Univariate Calibration Curve

The standard solution of TRV (100 μg mL−1) was prepared by dissolving the required amount of TRV in mobile phase of RP/NP densitometric assay. The variable volumes of the TRV standard solution were diluted with mobile phase to obtain TRV concentrations in the range of 10–1200 and 30–400 ng band−1 for RP and NP densitometric techniques, respectively. The obtained solutions with different TRV concentrations were applied to RP-plates for the ecologically greener RP densitometric technique and NP-phase plates for NP densitometric technique. The chromatographic response for TRV was noted for each concentration using RP/NP densitometric assay. The classical univariate calibration curve (UCC) for TRV was obtained by taking its concentrations on the X-axis and spot area on the Y-axis for RP/NP densitometric assay [56,57]. The UCC of TRV for the ecologically greener RP densitometric assay was evaluated in the 10–1200 ng band−1 range, while, the UCC of TRV for routine NP densitometric assay was evaluated in the 30–400 ng band−1 range.

2.4. Sample Processing for the Quantification of TRV in Commercial Formulations

In order to quantify TRV contents in commercial formulations, 10 commercial capsules (each capsule having 500 mg of TRV) were taken and an average weight was evaluated. The capsules’ contents were removed from the capsule shells and mixed homogenously to get the fine powder. The powder containing 500 mg of TRV was dispensed in 100 mL of the respective mobile phase systems. Then, 5 mL of the above solutions were further diluted to obtain 100 mL using the same solvent systems for RP/NP densitometric assay. The resultant mixtures were filtered to eliminate insoluble excipients of the capsules and sonicated for about 15 min. The processed samples were utilized for the determination of TRV contents in commercial capsules using RP/NP densitometric assay.

2.5. Validation Parameters

The current RP/NP densitometric assay for the quantitation of TRV was validated for linearity range, system efficiency, accuracy, precision, robustness and sensitivity as per ICH-Q2A recommendations [55]. The TRV linearity was evaluated by plotting the TRV concentrations on the X-axis against its spot area on the Y-axis. The linearity was determined at the 10–1200 ng band−1 range for the ecologically greener RP densitometric technique and the 30–400 ng band−1 range for NP densitometric technique [55]. The system efficiency parameters for RP/NP densitometric assay were obtained by the determination of retardation factor (Rf), asymmetry factor (As), and number of theoretical plates per meter (N m−1) [49,55]. The values of Rf, As and N m−1 were obtained by adopting their standard formulae, mentioned in literature [49].
The accuracy for RP/NP HPTLC densitometric assay was determined as % recovery. The accuracy was determined at three different concentrations such as lower quality control (LQC; 10 ng band−1), middle quality control (MQC; 400 ng band−1) and high quality control (HQC; 1200 ng band−1) for the ecologically greener RP densitometric assay. The accuracy for NP densitometric assay was obtained at LQC (30 ng band−1), MQC (100 ng band−1) and HQC (400 ng band−1). The % recovery of TRV was determined at each QC level (n = 6) for RP/NP densitometric assay [55].
The precision for RP/NP densitometric assay was evaluated in terms of instrumental, intraday and intermediate variation. The instrumental variation was determined by the analysis of constant concentration of TRV (n = 6). It was measured at MQC for RP/NP densitometric assay. Intraday variation was evaluated by the analysis of TRV solutions at LQC, MQC, and HQC on the same day for RP/NP HPTLC densitometric assay (n = 6). However, intermediate variation was evaluated by the analysis of TRV solutions at LQC, MQC, and HQC on three different days for RP/NP densitometric assay (n = 6) [55].
The robustness for RP/NP densitometric assay was assessed by introducing small modifications in determination parameters such as the small deliberate changes in mobile phase components, total run length, detection wavelength and saturation time for RP/NP densitometric assay. For the ecologically greener RP densitometric technique, the proposed EOTH-WTR (65:35, v v−1) greener mobile phase was modified slightly and the chromatographic response was recorded. For the NP densitometric technique, the proposed CLF-METH (85:15, v v−1) routine mobile phase was also changed slightly and the chromatographic response was recorded [49,55]. Similarly, the proposed run-length, saturation time and wavelength for TRV detection were also changed slightly for RP/NP densitometric assay and analytical response was noted [49].
The sensitivity for RP/NP densitometric assay was determined as detection (LOD) and quantification (LOQ) limits by adopting the standard deviation method. The blank analyte was injected three times (n = 3) and its standard deviation was calculated for RP/NP densitometric assay. The LOD and LOQ of TRV for RP/NP densitometric assay were obtained using following formulae [55]:
LOD = 3.3 × σ S
LOQ = 10 × σ S
where, σ = standard deviation of the blank sample and S = slope of the UCC of TRV.
The method specificity was evaluated by comparing the Rf values and UV spectra of TRV in commercial formulations with that of the standard TRV for RP/NP densitometric assay.

2.6. Quantification of TRV in Marketed Formulations

The prepared samples of marketed capsules were spotted on TLC plates for RP/NP densitometric assay and respective TLC responses were determined. The HPTLC area of TRV in commercial formulations was then noted. The amounts of TRV in marketed capsule dosage forms were estimated from the UCC of TRV for RP/NP densitometric assay.

2.7. Greenness Evaluation Using AGREE

The greenness scales for RP/NP densitometric assay were evaluated using AGREE method [48]. The AGREE scales (0.0–1.0) for RP/NP densitometric assay were determined using AGREE: The Analytical Greenness Calculator (version 0.5, Gdansk University of Technology, Gdansk, Poland, 2020) for RP/NP densitometric assay.

3. Results and Discussion

3.1. Method Development

Various HPTLC techniques are utilized for the estimation of TRV [3,4,32,33,34,35]. However, the greenness profile of reported HPTLC techniques was not studied. Therefore, the current study involves the development and validation of a rapid, highly-sensitive, and the ecologically greener RP/NP HPTLC-densitometric assay for the quantification of TRV in its capsule dosage forms.
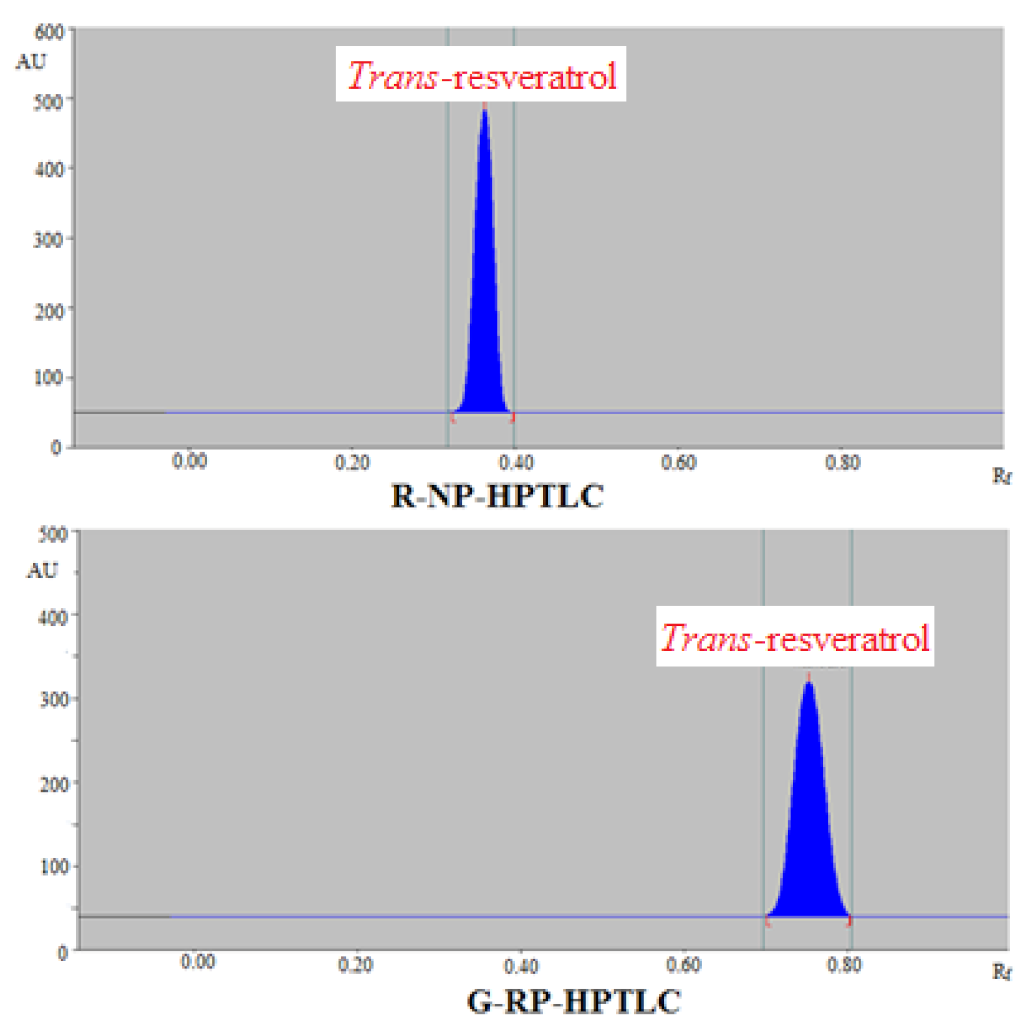
For the ecologically greener RP HPTLC estimation of TRV, various proportions of EOTH and WTR such as EOTH-WTR (55:45, v v−1), EOTH-WTR (65:35, v v−1), EOTH-WTR (75:25, v v−1), EOTH-WTR (85:15, v v−1), and EOTH-WTR (95:5, v v−1) were evaluated as the greener mobile phase for the establishment of a suitable chromatogram for the quantification of TRV. The results summarized in this study indicated that EOTH-WTR (55:45, v v−1), EOTH-WTR (75:25, v v−1), EOTH-WTR (85:15, v v−1), and EOTH-WTR (95:5, v v−1) greener mobile phases presented a low-quality densitogram of TRV with a low As value (˃1.30). While, EOTH-WTR (65:35, v v−1) greener mobile phase showed a well-separated and intact chromatographic peak of TRV with an excellent As value (1.04) at Rf = 0.75 ± 0.01 (Figure 1). Based on these observations, EOTH-WTR (65:35, v v−1) was optimized as the greener mobile phase for the estimation of TRV in its capsule dosage forms utilizing the ecologically greener RP densitometric assay.
For the routine NP densitometric assay of TRV, various proportions of CLF and METH including CLF-METH (55:45, v v−1), CLF-METH (65:35, v v−1), CLF-METH (75:25, v v−1), CLF-METH (85:15, v v−1), and CLF-METH (95:5, v v−1) were evaluated as the routine mobile phases for the establishment of an acceptable band for the quantification of TRV. The results obtained indicated that CLF-METH (55:45, v v−1), CLF-METH (65:35, v v−1), CLF-METH (75:25, v v−1), and CLF-METH (95:5, v v−1) mobile phases showed a low-quality chromatographic peak of TRV with low As value (>1.25). While, CLF-METH (85:15, v v−1) showed a well-separated and compact densitometric peak of TRV with an excellent As value (1.02) at Rf = 0.38 ± 0.01 (Figure 1). Based on these observations, the CLF-METH (85:15, v v−1) was optimized as the mobile phase for the estimation of TRV in commercial formulations using the routine NP densitometric assay.
The bands spectra for RP/NP densitometric assay were obtained under densitometric mode and the highest chromatographic response was found at 302 nm for RP/NP densitometric assay. Hence, the entire quantification of TRV was conducted at 302 nm for RP/NP densitometric assay.

3.2. Validation Parameters

The proposed RP/NP densitometric assay for TRV analysis was validated for linearity, system efficiency parameters, accuracy, precision, robustness, sensitivity, and specificity as per ICH-Q2 (R1) recommendations [55]. The results for the classical UCC/least square analysis of TRV for RP/NP densitometric assay are presented in Table 1. The TRV UCC was observed as linear in the range of 10–1200 ng band−1 for the ecologically greener RP densitometric assay, while, the TRV UCC was found to be linear in the range of 30–400 ng band−1 for the routine NP densitometric assay. The values of determination coefficient (R2) for TRV were estimated as 0.9968 and 0.9998 for the RP and routine NP densitometric assay, respectively. These results showed that RP/NP densitometric assay offered a good linearity between the concentration and chromatographic spot area. Nevertheless, the linearity range for the ecologically greener RP densitometric assay was much broader than the routine NP densitometric assay. Therefore, the ecologically greener RP densitometric assay is considered as more reliable for the estimation of TRV.
The system efficiency parameters for RP/NP densitometric assay were obtained and resulting data are tabulated in Table 2. The Rf, As and N m−1 for RP/NP densitometric assay were found to be acceptable for the quantification of TRV.
The results of accuracy measurement for RP/NP densitometric assay are tabulated in Table 3. The % accuracy of TRV for the ecologically greener RP densitometric method was estimated as 98.03–101.80% at various QC levels. The % accuracy of TRV for NP densitometric technique was estimated as 90.86–93.55% at various QC levels. The obtained values of % accuracy suggested that the ecologically greener RP densitometric assay was highly accurate for the estimation of TRV compared to the NP densitometric technique.
The different kinds of precision for RP/NP densitometric assay were measured as % CV. The results for instrumental precision for RP/NP densitometric assay are tabulated in Table S2. However, the results for intraday and intermediate variations are tabulated in Table 4. For the determination of instrumental variation, a single band (MCQ) for RP/NP densitometric assay was analyzed several times and % CV was calculated. The % CV for the ecologically greener RP and routine NP densitometric assay were determined as 0.46 and 2.37 %, respectively. The % CVs of TRV for the ecologically greener RP densitometric assay were predicted as 0.40–0.91% at various QC levels for intraday precision. The % CVs of TRV for the routine NP densitometric assay were predicted as 0.42–1.02% at various QC levels for intermediate precision. The % CV values of TRV for the routine NP densitometric assay were estimated as 1.41–3.42% at various QC levels for intraday variation. The % CV values of TRV for the routine NP densitometric assay were estimated as 1.52–3.20% at various QC levels for inter-day variation. The obtained data of instrumental and intraday and intermediate variations suggested that the ecologically greener RP densitometric technique was more precise over the NP densitometric technique for the determination of TRV.
The resulting data of robustness analysis after modifying the mobile phase proportions for the RP/NP densitometric assay are tabulated in Table 5. The % CVs and Rf values for TRV were predicted as 0.43–0.49% and 0.74–0.76, respectively, for the ecologically greener RP densitometric technique. While, the % CVs and Rf values for TRV were predicted as 3.17–3.50% and 0.37–0.39, respectively, for the NP densitometric technique. The results for the robustness evaluation after changing run-length for the RP/NP densitometric technique are tabulated in Table S3. The % CVs and Rf values for TRV after this modification were estimated as 0.28–0.35% and 0.73–0.77, respectively, for the ecologically greener RP densitometric technique. However, the % CVs and Rf values for TRV after this modification were estimated as 2.67–2.91% and 0.36–0.40, respectively, for the NP densitometric technique. The resulting data of the robustness analysis after changing the saturation time for the RP/NP densitometric technique are tabulated in Table S4. The % CVs and Rf values for TRV after this modification were estimated as 0.41–0.47% and 0.74–0.75, respectively, for the ecologically greener RP densitometric technique. However, the % CVs and Rf values for TRV after this modification were estimated as 2.78–3.32% and 0.37–0.38, respectively, for the NP densitometric technique. The resulting data for robustness analysis after changing the detection wavelength for the RP/NP densitometric technique are tabulated in Table S5. The % CVs for TRV after modifying detection wavelength were determined as 0.49–0.52% for the ecologically greener RP densitometric technique. The Rf value of TRV after changing detection wavelength was not changed in all sets of conditions for the ecologically greener RP densitometric technique. However, the % CVs after modifying detection wavelength were estimated as 3.09–3.44% for the NP densitometric technique. The Rf value for TRV after modifying detection wavelength was also not changed in all sets of conditions for the NP densitometric technique. The small variations in Rf values of TRV and lower % CVs suggested that RP/NP densitometric technique was robust for the quantification of TRV. However, the ecologically greener RP densitometric technique was more robust than routine NP densitometric assay for the quantification of TRV.
The sensitivity for RP/NP densitometric assay was evaluated by the determination of LOD and LOQ which are tabulated in Table 1. The LOD and LOQ for the ecologically greener RP densitometric assay were determined as 3.64 ± 0.10 and 10.92 ± 0.30 ng band−1, respectively, for TRV. However, the LOD and LOQ for the routine NP densitometric assay were determined as 10.84 ± 0.22 and 32.52 ± 0.66 ng band−1, respectively, for TRV. These data and observations showed that the ecologically greener RP densitometric technique was highly sensitive over the NP densitometric technique.
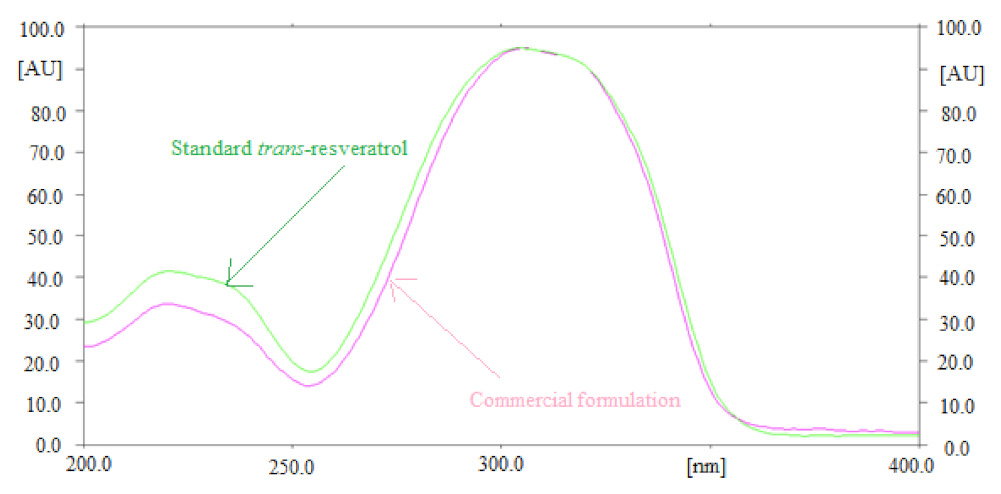
The specificity for RP/NP densitometric assay was evaluated by comparing the overlaid UV spectra of TRV in marketed formulations with that of pure TRV. The overlaid UV spectra of pure TRV and TRV in capsule dosage forms for RP/NP densitometric assay are shown in Figure 2. The maximum chromatographic response of TRV in pure and marketed capsule dosage forms was recorded at λmax = 302 nm for RP/NP densitometric assay. The identical UV spectra, same Rf values and λmax of TRV in pure TRV and marketed capsule dosage forms indicated the specificity/peak purity for RP/NP densitometric assay.

3.3. Quantification of TRV in Marketed Capsule Dosage Forms

The applicability of RP/NP densitometric assay was verified in the analysis of TRV in marketed capsule dosage forms of TRV. The chromatographic peak of TRV from marketed capsule dosage forms was identified by comparing its single chromatographic spot at Rf = 0.75 with that of pure TRV for the ecologically greener RP densitometric assay. The ecologically greener RP densitometric assay chromatogram of TRV in marketed formulations for the RP densitometric assay is presented in Figure 3 which was observed as similar with that of pure TRV. The chromatographic peak of TRV from marketed formulations was identified by comparing its single chromatographic spot at Rf = 0.38 with that of pure TRV for the routine NP densitometric assay. The NP densitometric assay chromatogram of TRV in marketed formulations for the routine NP densitometric assay is also presented in Figure 3 which was also observed similar with that of pure TRV. The TRV contents of marketed products were quantified using the UCC of TRV for the RP/NP densitometric assay. The % TRV contents in marketed formulations were determined as 101.21% using the ecologically greener RP densitometric assay, while, the % TRV contents of marketed formulations were determined as 91.64% utilizing the NP densitometric assay. These results indicated that the ecologically greener RP densitometric assay was better than routine NP densitometric assay for the quantification of TRV in marketed formulations.

3.4. Evaluation of Greenness Profile Using AGREE

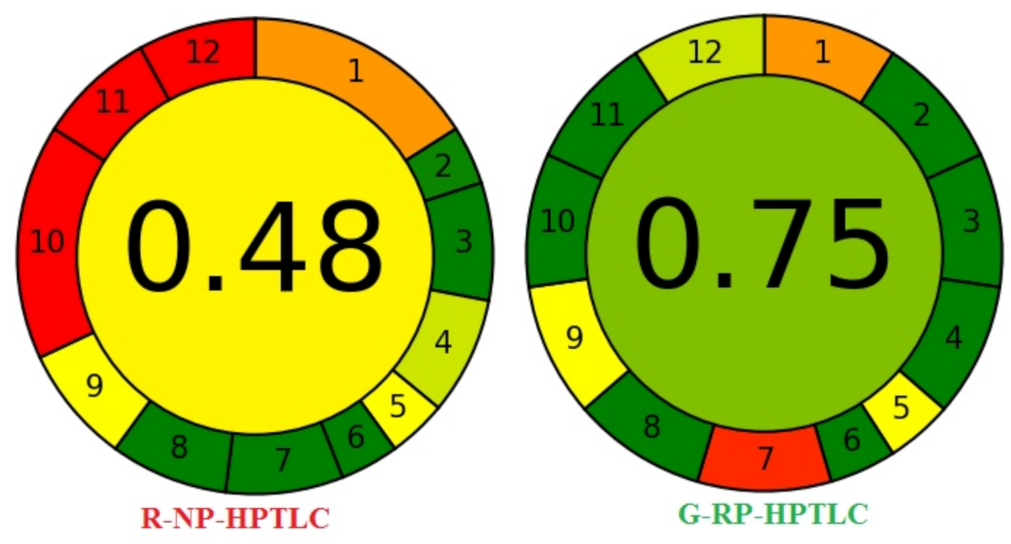
Different analytical/metric approaches are utilized for the evaluation of greenness profiles of the pharmaceutical assays [46,47,48,49,50]. However, AGREE applies all 12 principles of GAC for this purpose compared to other approaches [48]. Hence, in this work, the greener profile for RP/NP densitometric assay was evaluated using AGREE: The Analytical Greenness Calculator (version 0.5, Gdansk University of Technology, Gdansk, Poland, 2020). The AGREE scales for RP/NP densitometric assay are summarized in Figure 4. The AGREE scales for the ecologically greener RP densitometric assay and routine NP densitometric assay were found to be 0.75 and 0.48, respectively. The AGREE scale in the range of 0.75–1.0 indicated the excellent greenness for the analytical technique. However, the AGREE scale of 0.50 could be considered as an acceptable value for an analytical technique. On the other hand, the AGREE scale of less than 0.50 showed the unacceptability of an analytical technique [48]. Based on AGREE scales obtained in this study, only the ecologically greener RP densitometric assay was found as the excellent greener analytical technique for the quantification of TRV.

3.5. Comparison with Reported Techniques

The RP/NP densitometric assay for the quantification of TRV was compared with reported HPTLC-densitometric assays for the quantification of TRV. The results for comparative evaluation are tabulated in Table 6. Various parameters for validation such as linearity range, accuracy, and precision of RP/NP densitometric assay were compared with literature analytical techniques. The linearity of one of the literature HPTLC densitometric assays has been reported as the 500–3000 ng band−1, which was inferior to the current RP densitometric assay (linearity range = 10–1200 ng band−1) as well as the NP densitometric assay (linearity range = 30–400 ng band−1). However, other validation parameters such as accuracy and precision of the literature HPTLC densitometric assay were similar to the current RP densitometric assay but superior to the current NP densitometric assay [4]. The linearity range of another HPTLC densitometric assay was also found to be inferior to the current RP densitometric assay and superior to the current NP densitometric assay [32]. The linearity range and accuracy of the other reported HPTLC densitometric assay was also found to be inferior to the current RP densitometric assay and superior to the current NP densitometric assay [34,35]. The accuracy and precision of another reported HPTLC densitometric assay were found to be similar to the current RP densitometric assay and superior to the current NP densitometric assay. However, its linearity was much inferior to the current RP densitometric assay [3]. Overall, the ecologically greener RP densitometric assay was superior over reported HPTLC densitometric assays for the estimation of TRV.

4. Conclusions

The quantitative analysis of TRV in commercial formulations was performed by the RP/NP HPTLC densitometric assay. The proposed RP/NP densitometric assay was validated for linearity, system efficiency parameters, accuracy, precision, robustness, sensitivity, and specificity for the quantification of TRV. The greener profile for RP/NP densitometric assay was determined using the AGREE method. The ecologically greener RP densitometric assay was highly-sensitive, accurate, precise, and robust for the quantification of TRV in comparison with routine NP densitometric assay. The applicability of RP/NP densitometric assay was verified in the quantitative analysis of TRV in marketed capsule dosage forms. The ecologically greener RP densitometric assay was observed as superior over the routine NP densitometric assay in TRV analysis. The AGREE scale for the ecologically greener reversed-phase densitometric assay showed the excellent greener profile of RP densitometric assay compared to the NP densitometric assay. Both RP and NP densitometry methods were able to analyze several samples in parallel using low amount of mobile phase and hence reduced the analysis time. Using ecologically greener RP densitometric assay, the amount of toxic organic solvents can be reduced compared to the routine NP densitometric assay. Based on various chromatographic runs, optimization of mobile phase, various validation parameters, pharmaceutical assay, and greener profile, the ecologically greener RP densitometric assay is proposed as superior to the routine NP densitometric assay. Therefore, the ecologically greener RP densitometric assay can be utilized for the quantification of TRV in the variety of plant materials, pharmaceutical products, herbal products, and polyherbal formulations having TRV as one of the phytoconstituents.

Supplementary Materials

The following are available online at https://www.mdpi.com/article/10.3390/separations8100184/s1, Table S1: Chromatographic conditions and instrumentations utilized for the estimation of TRV for the G-RP-HPTLC and R-NP-HPTLC assays, Table S2: Results of instrumental precision for G-RP-HPTLC and R-NP-HPTLC assays, Table S3: Results of robustness evaluation by modifying total run length for G-RP-HPTLC and R-NP-HPTLC assays, Table S4: Results of robustness evaluation by modifying the saturation time for G-RP-HPTLC and R-NP-HPTLC techniques, Table S5: Results of robustness evaluation by modifying the wavelength of TRV detection for G-RP-HPTLC and R-NP-HPTLC techniques.

Author Contributions

Conceptualization, P.A. and S.A.; methodology, P.A., M.H.A. and A.I.F.; software, M.M.G.; validation, P.A., S.A. and F.S.; formal analysis, M.M.G.; investigation, P.A. and M.H.A.; resources, S.A.; data curation, M.H.A.; writing—original draft preparation, F.S.; writing—review and editing, P.A., M.H.A. and S.A.; visualization, A.I.F.; supervision, S.A.; project administration, S.A.; funding acquisition, S.A. All authors have read and agreed to the published version of the manuscript.

Funding

This research was funded by the Researchers Supporting Projects (Number RSP-2021/146) at King Saud University, Riyadh, Saudi Arabia and the APC was funded by RSP.

Data Availability Statement

This study did not report any data.

Acknowledgments

The authors are thankful to the Researchers Supporting Projects (Number RSP-2021/146) at King Saud University, Riyadh, Saudi Arabia for supporting this work.

Conflicts of Interest

The authors declare no conflict of interest.

References

  1. Caddeo, C.; Nacher, A.; Vassallo, A.; Armentano, M.F.; Pons, R.; Fernàndez-Busquets, X.; Carbone, C.; Valenti, D.; Fadda, A.M.; Manconi, M. Effect of quercetin and resveratrol co-incorporated in liposomes against inflammatory/oxidative response associated with skin cancer. Int. J. Pharm. 2016, 513, 153–163. [Google Scholar] [CrossRef]
  2. Lee, K.W.; Bode, A.M.; Dong, Z. Molecular targets of phytochemicals for cancer prevention. Nat. Rev. Cancer 2011, 11, 211–218. [Google Scholar] [CrossRef]
  3. Imran, M.; Iqubal, M.K.; Ahmad, S.; Ali, J.; Baboota, S. Stability-indicating high-performance thin-layer chromatographic method for the simultaneous determination of quercetin and resveratrol in the lipid-based nanoformulation. J. Planar Chromatogr. 2019, 32, 393–400. [Google Scholar] [CrossRef]
  4. Babu, S.K.; Kumar, K.V.; Subbaraju, G.V. Estimation of trans-resveratrol in herbal extracts and dosage forms by high-performance thin-layer chromatography. Chem. Pharm. Bull. 2005, 53, 691–693. [Google Scholar] [CrossRef] [Green Version]
  5. Gulcin, I. Antioxidant properties of resveratrol: A structure-activity insight. Innov. Food Sci. Emerg. Technol. 2010, 11, 210–218. [Google Scholar] [CrossRef]
  6. Zhou, Z.X.; Mou, S.F.; Chen, X.Q.; Gong, L.L.; Ge, W.S. Anti-inflammatory activity of resveratrol prevents inflammation by inhibiting NF-kB in animal models of acute pharyngitis. Mol. Med. Rep. 2018, 17, 1269–1274. [Google Scholar] [PubMed] [Green Version]
  7. Jang, M.; Cai, L.; Udeani, G.O.; Slowing, K.V.; Thomas, C.F.; Beecher, C.W.W.; Fong, H.H.S.; Farnsworth, N.R.; Kinghorn, A.D.; Mehta, R.G.; et al. Cancer chemopreventive activity of resveratrol a natural product derived from grapes. Science 1997, 275, 218–220. [Google Scholar] [CrossRef] [PubMed] [Green Version]
  8. Park, C.S.; Lee, Y.C.; Kim, J.D.; Kim, C.H. Inhibitory effects of Polygonum cuspidatum water extract (PCWE) and its component resveratrol [correction of rasveratrol] on acyl-coenzyme A-cholesterol acyltransferase activity for cholesteryl ester synthesis in HepG2 cells. Vasc. Pharmacol. 2004, 40, 279–284. [Google Scholar] [CrossRef] [PubMed]
  9. Cote, B.; Carlson, L.J.; Rao, D.A.; Alani, A.W.G. Combination of resveratrol and quercetin polymeric micelles mitigates doxorubicin induced cardiotoxicity in vitro and in vivo. J. Control. Release 2015, 213, 128–133. [Google Scholar] [CrossRef]
  10. Rao, Y.L.; Ganaraja, B.; Joy, T.; Pai, M.M.; Ullal, S.D.; Murlimanju, B.V. Neuroprotective effects of resveratrol in Alzheimer’s disease. Front. Biosci. 2020, 12, 130–149. [Google Scholar]
  11. Singh, G.; Pai, R.S. A rapid reversed-phase HPLC method for analysis of trans-resveratrol in PLGA nanoparticulate formulation. ISRN Chromatogr. 2014, 2014, E248635. [Google Scholar] [CrossRef]
  12. Nasr, M.; Rahman, M.H.A. Simultaneous determination of curcumin and resveratrol in lipidic nanoemulsion formulation and rat plasma using HPLC: Optimization and application to real samples. J. AOAC Int. 2019, 402, 1095–1101. [Google Scholar] [CrossRef]
  13. Jagwani, S.; Jalalpure, S.; Dhamecha, D.; Hua, G.S.; Jadhav, K. A stability indicating reversed phase HPLC method for estimation of trans-resveratrol in oral capsules and nanoliposomes. Anal. Chem. Lett. 2019, 9, 711–726. [Google Scholar] [CrossRef]
  14. Xu, S.; Luo, H.; Chen, H.; Guo, J.; Yu, B.; Zhang, H.; Li, W.; Chen, W.; Zhou, X.; Huang, L.; et al. Optimization of extraction of total trans-resveratrol from peanut seeds and its determination by HPLC. J. Sep. Sci. 2020, 43, 1024–1031. [Google Scholar] [CrossRef] [PubMed]
  15. Souto, A.A.; Carneiro, M.C.; Seferin, M.; Senna, M.J.H.; Conz, A.; Gobbi, K. Determination of trans-resveratrol in Brazilian red wines by HPLC. J. Food Compos. Anal. 2001, 14, 441–445. [Google Scholar] [CrossRef]
  16. Kolouchova-Hanzlikova, I.; Melzoch, K.; Filip, V.; Smidrkal, J. Rapid method for resveratrol determination by HPLC with electrochemical and UV detections in wines. Food Chem. 2004, 87, 151–158. [Google Scholar] [CrossRef]
  17. Ratola, N.; Faria, J.L.; Alves, A. Analysis and quantification of trans-resveratrol in wines from Alentejo region (Portugal). Food Technol. Biotechnol. 2004, 42, 125–130. [Google Scholar]
  18. Cvejic, J.M.; Djekic, S.V.; Petrovic, A.V.; Atanackovic, M.T.; Jovic, S.M.; Brceski, I.D.; Gojkovic-Bukarica, L.C. Determination of a trans- and cis-resveratrol in Serbian commercial wines. J. Chromatogr. Sci. 2010, 48, 229–234. [Google Scholar] [CrossRef] [PubMed] [Green Version]
  19. da Silva, L.F.; Guerra, C.C.; Czermainski, A.B.C.; Ferrari, L.; Bergold, A.M. Validation of a chromatographic method to routine analysis of trans-resveratrol and quercetin in red wines. Pesq. Agropec. Bras. Bras. 2017, 51, 335–343. [Google Scholar] [CrossRef] [Green Version]
  20. Juan, M.E.; Lamuela-Raventos, R.M.; Torre-Boronat, C.D.M.L.; Planas, J.M. Determination of trans-resveratrol in plasma by HPLC. Anal. Chem. 1999, 71, 747–750. [Google Scholar] [CrossRef]
  21. Katsagonis, A.; Atta-Politou, J.; Koupparis, M.A. HPLC method with UV detection for the determination of trans-resveratrol in plasma. J. Liq. Chromatogr. Relat. Technol. 2005, 28, 1393–1405. [Google Scholar] [CrossRef]
  22. Chen, X.; He, H.; Wang, G.; Yang, B.; Ren, W.; Ma, L.; Yu, Q. Stereospecific determination of cis- and trans-resveratrol in rat plasma by HPLC: Application to pharmacokinetic studies. Biomed. Chromatogr. 2007, 21, 257–265. [Google Scholar] [CrossRef]
  23. Singh, G.; Pai, R.S.; Pandit, V. Development and validation of a HPLC method for the determination of trans-resveratrol in spiked human plasma. J. Adv. Pharm. Technol. Res. 2012, 3, 130–135. [Google Scholar]
  24. Biasutto, L.; Marotta, E.; Garbisa, S.; Zoratti, M.; Paradisi, C. Determination of quercetin and resveratrol in whole blood-implications for bioavailability studies. Molecules 2010, 15, 6570–6579. [Google Scholar] [CrossRef] [Green Version]
  25. Omar, J.M.; Yang, H.; Li, S.; Marquartd, R.R.; Jones, P.J.H. Development of an improved reverse-phase high-performance liquid chromatography method for the simultaneous analyses of trans-/cis-resveratrol, quercetin, and emodin in commercial resveratrol supplements. J. Agric. Food Chem. 2014, 62, 5812–5817. [Google Scholar] [CrossRef] [PubMed]
  26. Brizzi, A.; Brizzi, V.; Corradini, D. Identification and quantification of trans-resveratrol in dietary supplements by a rapid and straightforward RP-HPLC method. J. Liq. Chromatogr. Relat. Technol. 2008, 31, 2089–2100. [Google Scholar] [CrossRef]
  27. Breeman, R.V.; Bzhelyansky, A.; Es-Safi, N.E.; Jennens, M.; Johnson, H.E.; Krepich, S.; Kuszak, A.; Monagas, M.; Reif, K.; Rimmer, C.A.; et al. Standard method performance requirements (SMPRs®) 2018.004: Determination of trans resveratrol in dietary supplements and dietary ingredients. J. AOAC Int. 2018, 101, 1254–1255. [Google Scholar] [CrossRef]
  28. Ares, A.M.; Soto, M.E.; Nozal, M.J.; Bernal, J.L.; Higes, M.; Bernal, J. Determination of resveratrol and piceid isomers in bee pollen by liquid chromatography coupled to electrospray ionization-mass spectrometry. Food Anal. Methods 2015, 8, 1565–1575. [Google Scholar] [CrossRef]
  29. Vlase, L.; Kiss, B.; Leucuta, S.E.; Gocan, S. A rapid method for determination of resveratrol in wines by HPLC-MS. J. Liq. Chromatogr. Relat. Technol. 2009, 32, 2105–2121. [Google Scholar] [CrossRef]
  30. Su, M.X.; Di, B.; Hang, T.J.; Wang, J.; Yang, D.S.; Wang, T.H.; Meng, R. Rapid, sensitive and selective analysis of trans-resveratrol in rat plasma by LC-MS-MS. Chromatographia 2011, 73, 1203–1210. [Google Scholar] [CrossRef]
  31. Muzzio, M.; Huang, Z.; Hu, S.C.; Johnson, W.D.; McCormick, D.L.; Kapetanovic, I.M. Determination of resveratrol and its sulfate and glucuronide metabolites in plasma by LC-MS/MS and their pharmacokinetics in dogs. J. Pharm. Biomed. Anal. 2012, 59, 201–208. [Google Scholar] [CrossRef] [PubMed] [Green Version]
  32. Lotz, A.; Milz, B.; Spangenberg, B. A new and sensitive TLC to measure trans-resveratrol in red wine. J. Liq. Chromatogr. Relat. Technol. 2015, 38, 1104–1108. [Google Scholar] [CrossRef]
  33. Malele, R.S.; Zvikomborero, M.C. Estimation of trans-resveratrol in grape berry skin extract by high-performance thin-layer chromatography (HPTLC). Int. J. Res. Health Sci. 2014, 2, 213–223. [Google Scholar]
  34. Pillai, D.; Pandita, N. Validated high-performance thin-layer chromatography method for quantification of bioactive marker compounds in Draksharishta, an ayurvedic polyherbal formulation. Rev. Bras. Pharmacog. 2016, 26, 558–563. [Google Scholar] [CrossRef] [Green Version]
  35. Paul, A.; Rajiung, M.; Zaman, K.; Chaudhary, S.K.; Shakya, A. Quantification of the bioactive resveratrol in Morus alba Linn. fruits by high-performance thin-layer chromatography. J. Planar Chromatogr. 2020, 33, 481–487. [Google Scholar] [CrossRef]
  36. Goldberg, D.M.; Yan, J.; Ng, E.; Diamandis, E.P.; Karumanchiri, A.; Soleas, G.; Waterhouse, A.L. Direct injection gas chromatographic mass spectrometric assay for trans-resveratrol. Anal. Chem. 1994, 66, 3959–3963. [Google Scholar] [CrossRef]
  37. Gu, X.; Creasy, L.; Kester, A.; Zeece, M. Capillary electrophoretic determination of resveratrol in wines. J. Agric. Food Chem. 1999, 47, 3223–3227. [Google Scholar] [CrossRef]
  38. Liu, L.; Zhou, Y.; Kang, Y.; Huang, H.; Li, C.; Xu, M.; Ye, B. Electrochemical evaluation of trans-resveratrol levels in red wines based on the interaction between resveratrol and grapheme. J. Anal. Methods Chem. 2017, 2017, E5749025. [Google Scholar] [CrossRef] [Green Version]
  39. Li, C.P.; Tan, S.; Ye, H.; Cao, J.; Zhao, H. A novel fluorescence assay for resveratrol determination in red wine based on competitive host-guest interaction. Food Chem. 2019, 283, 191–198. [Google Scholar] [CrossRef]
  40. Foudah, A.I.; Alam, P.; Anwer, M.K.; Yusufoglu, H.S.; Abdel-Kader, M.S.; Shakeel, F. A green RP-HPTLC-densitometry method for the determination of diosmin in pharmaceutical formulations. Processes 2020, 8, 817. [Google Scholar] [CrossRef]
  41. Bhandari, P.; Kumar, N.; Gupta, A.P.; Singh, B.; Kaul, V.K. A rapid RP-HPTLC densitometry method for simultaneous determination of major flavonoids in important medicinal plants. J. Sep. Sci. 2007, 30, 2092–2096. [Google Scholar] [CrossRef] [PubMed]
  42. Sharma, U.K.; Sharma, N.; Gupta, A.P.; Kumar, V.; Sinha, A.K. RP-HPTLC determination and validation of vanillin and related phenolic compounds in accelerated solvent extract of Vanilla planifolia. J. Sep. Sci. 2007, 30, 3174–3180. [Google Scholar] [CrossRef] [PubMed]
  43. Alam, P.; Shakeel, F.; Alqarni, M.H.; Foudah, A.I.; Faiyazuddin, M.; Alshehri, S. Rapid, sensitive, and sustainable reversed-phase HPTLC method in comparison to the normal-phase HPTLC for the determination of pterostilbene in capsule dosage form. Processes 2021, 9, 1305. [Google Scholar] [CrossRef]
  44. Foudah, A.I.; Shakeel, F.; Alqarni, M.H.; Yusufoglu, H.S.; Salkini, M.A.; Alam, P. Determination of trans-anethole in essential oil, methanolic extract and commercial formulations of Foeniculum vulgare Mill using a green RP-HPTLC-densitometry method. Separations 2020, 7, 51. [Google Scholar] [CrossRef]
  45. Foudah, A.I.; Shakeel, F.; Yusufoglu, H.S.; Ross, S.A.; Alam, P. Simultaneous determination of 6-shogaol and 6-gingerol in various ginger (Zingiber officinale Roscoe) extracts and commercial formulations using a green RP-HPTLC-densitometry method. Foods 2020, 9, 1136. [Google Scholar] [CrossRef] [PubMed]
  46. Abdelrahman, M.M.; Abdelwahab, N.S.; Hegazy, M.A.; Fares, M.Y.; El-Sayed, G.M. Determination of the abused intravenously administered madness drops (tropicamide) by liquid chromatography in rat plasma; an application to pharmacokinetic study and greenness profile assessment. Microchem. J. 2020, 159, E105582. [Google Scholar] [CrossRef]
  47. Duan, X.; Liu, X.; Dong, Y.; Yang, J.; Zhang, J.; He, S.; Yang, F.; Wang, Z.; Dong, Y. A green HPLC method for determination of nine sulfonamides in milk and beef, and its greenness assessment with analytical eco-scale and greenness profile. J. AOAC Int. 2020, 103, 1181–1189. [Google Scholar] [CrossRef]
  48. Pena-Pereira, F.; Wojnowski, W.; Tobiszewski, M. AGREE-Analytical GREEnness metric approach and software. Anal. Chem. 2020, 92, 10076–10082. [Google Scholar] [CrossRef]
  49. Foudah, A.I.; Shakeel, F.; Alqarni, M.H.; Alam, P. A rapid and sensitive stability-indicating green RP-HPTLC method for the quantitation of flibanserin compared to green NP-HPTLC method: Validation studies and greenness assessment. Microchem J. 2021, 164, E105960. [Google Scholar] [CrossRef]
  50. Alam, P.; Salem-Bekhit, M.M.; Al-Joufi, F.A.; Alqarni, M.H.; Shakeel, F. Quantitative analysis of cabozantinib in pharmaceutical dosage forms using green RP-HPTLC and green NP-HPTLC methods: A comparative evaluation. Sustain. Chem. Pharm. 2021, 21, E100413. [Google Scholar] [CrossRef]
  51. Foudah, A.I.; Shakeel, F.; Alqarni, M.H.; Ross, S.A.; Salkini, M.A.; Alam, P. Simultaneous estimation of cinnamaldehyde and eugenol in essential oils and traditional and ultrasound-assisted extracts of different species of cinnamon using a sustainable/green HPTLC technique. Molecules 2021, 26, 2054. [Google Scholar] [CrossRef]
  52. Foudah, A.I.; Shakeel, F.; Alam, P.; Alqarni, M.H.; Abdel-Kader, M.S.; Alshehri, S. A sustainable reversed-phase HPTLC method for the quantitative estimation of hesperidin in traditional and ultrasound-assisted extracts of different varieties of citrus fruit peels and commercial tablets. Agronomy 2021, 11, 1744. [Google Scholar] [CrossRef]
  53. Alqarni, M.H.; Alam, P.; Foudah, A.I.; Muharram, M.M.; Shakeel, F. Combining normal/reversed-phase HPTLC with univariate calibration for the piperine quantification with traditional and ultrasound-assisted extracts of various food spices of Piper nigrum L. under green analytical chemistry viewpoint. Molecules 2021, 26, 732. [Google Scholar] [CrossRef] [PubMed]
  54. Foudah, A.I.; Shakeel, F.; Alqarni, M.H.; Ross, S.A.; Salikini, M.A.; Alam, P. Green NP-HPTLC and green RP-HPTLC methods for the determination of thymoquinone: A contrast of validation parameters and greenness assessment. Phytochem. Anal. 2021. [Google Scholar] [CrossRef]
  55. International Conference on Harmonization (ICH). Q2 (R1): Validation of Analytical Procedures–Text and Methodology; International Conference on Harmonization (ICH): Geneva, Switzerland, 2005. [Google Scholar]
  56. Escandar, G.M.; Goicoechea, H.C.; Pena, A.D.M.L.; Olivieri, A.C. Second- and higher-order data generation and calibration: A tutorial. Anal. Chim. Acta 2014, 806, 8–26. [Google Scholar] [CrossRef] [PubMed]
  57. Mazivila, S.J.; Ricardo, I.A.; Leitao, J.M.M.; da Silva, J.C.J.E. A review on advanced oxidation process: From classical to new perspectives coupled to two- and multi-way strategies to monitor degradation of contaminants in environmental samples. Trends Environ. Anal. Chem. 2019, 24, e00072. [Google Scholar] [CrossRef]
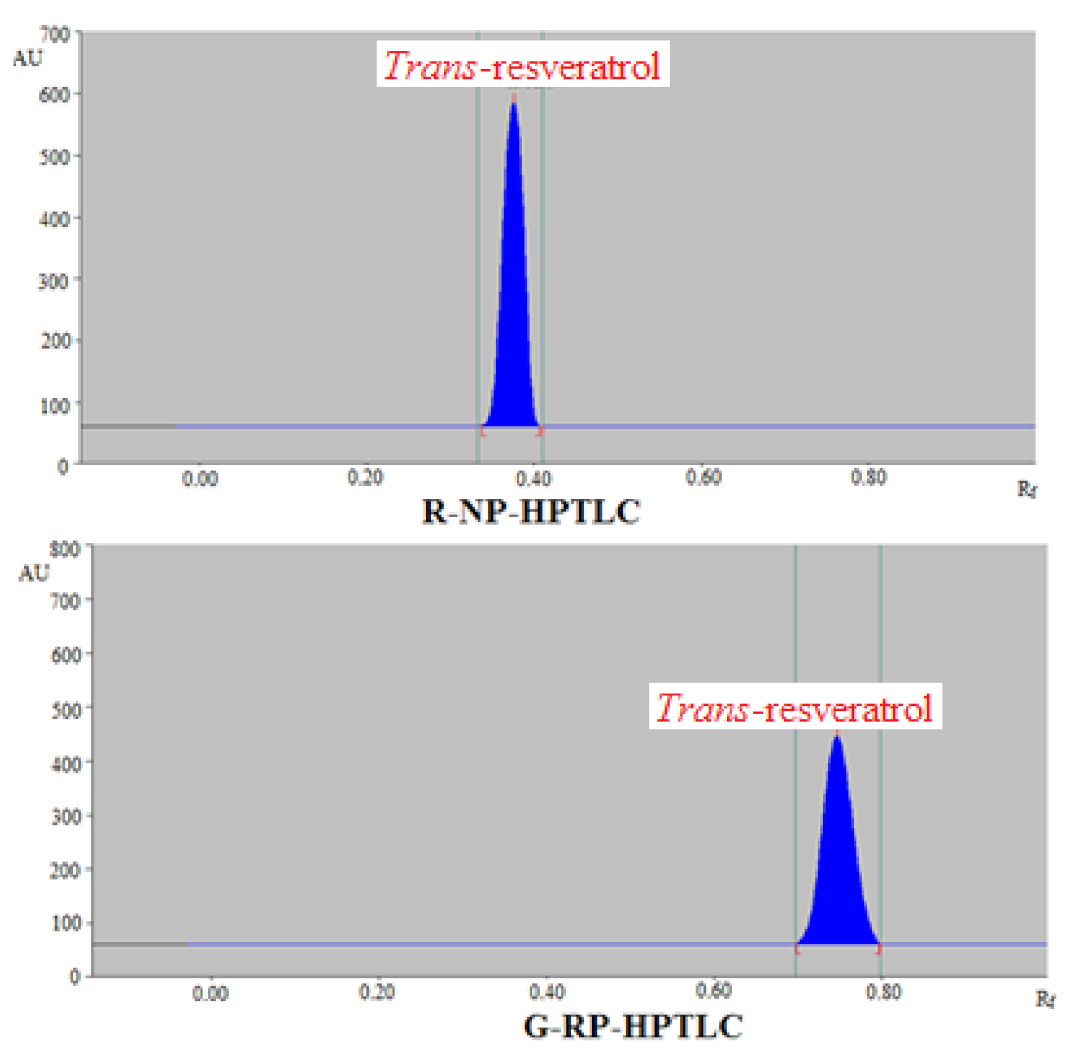
Figure 1. Representative densitometric chromatograms of standard trans-resveratrol (TRV) obtained using routine normal-phase high-performance thin-layer chromatography (R-NP-HPTLC) and ecologically greener reversed-phase HPTLC (G-RP-HPTLC) methods.
Separations 08 00184 g001
Figure 2. Overlaid ultraviolet (UV) absorption spectra of standard TRV and TRV in marketed capsule dosage forms.
Separations 08 00184 g002
Figure 3. Representative densitometric chromatograms of TRV in marketed capsule dosage form obtained using R-NP-HPTLC and G-RP-HPTLC methods.
Separations 08 00184 g003
Figure 4. Greener images for analytical GREEnness (AGREE) scales for R-NP-HPTLC and G-RP-HPTLC methods obtained using AGREE: The Analytical Greenness Calculator.
Separations 08 00184 g004
Table 1. Results for least square regression analysis of trans-resveratrol (TRV) for a routine normal-phase high-performance thin-layer chromatography (R-NP-HPTLC) and the ecologically greener reversed-phase HPTLC (G-RP-HPTLC) techniques (mean ± SD; n = 6).
ParametersR-NP-HPTLCG-RP-HPTLC
Linearity range (ng band−1)30–40010–1200
Regression equationy = 34.87x + 453.32y = 63.53x + 26.83
R20.99980.9968
Slope ± SD34.87 ± 1.7263.53 ± 1.81
Intercept ± SD453.32 ± 5.3626.83 ± 0.28
Standard error of slope0.700.73
Standard error of intercept2.180.11
95% confidence interval of slope31.84–37.8960.34–66.71
95% confidence interval of intercept443.90–462.7326.33–27.32
LOD ± SD (ng band−1)10.84 ± 0.223.64 ± 0.10
LOQ ± SD (ng band−1)32.52 ± 0.6610.92 ± 0.30
Table 2. System efficiency parameters in terms of retardation factor (Rf), asymmetry factor (As) and number of theoretical plates per meter (N m−1) of TRV for R-NP-HPTLC and G-RP-HPTLC techniques (mean ± SD; n = 3).
ParametersR-NP-HPTLCG-RP-HPTLC
Rf0.38 ± 0.010.75 ± 0.01
As1.02 ± 0.021.04 ± 0.03
N m−14672 ± 8.124598 ± 7.96
Table 3. Results for accuracy evaluation of TRV for R-NP-HPTLC and G-RP-HPTLC methods (mean ± SD; n = 6).
Conc. (ng Band−1)Conc. Found
(ng Band−1) ± SD
Recovery (%)CV (%)
R-NP-HPTLC method
3027.26 ± 1.2590.864.58
10091.31 ± 2.2891.312.49
400374.21 ± 4.6593.551.24
G-RP-HPTLC method
1010.18 ± 0.08101.800.78
400392.14 ± 1.5898.030.40
12001189.28 ± 3.6499.100.30
Table 4. Measurement of intra/inter-day precision of TRV for R-NP-HPTLC and G-RP-HPTLC methods (mean ± SD; n = 6).
Conc.
(ng Band−1)
Intraday PrecisionIntermediate
Area ± SDStandard ErrorCV (%)Area ± SDStandard ErrorCV (%)
R-NP-HPTLC method
301225 ± 4217.143.421184 ± 3815.513.20
1004258 ± 11245.732.634172 ± 12048.992.87
40013,984 ± 19880.841.4114,128 ± 21688.191.52
G-RP-HPTLC method
10764 ± 72.850.91778 ± 83.261.02
40025,884 ± 13253.890.5026,154 ± 13856.340.52
120076,248 ± 312127.390.4075,654 ± 321131.070.42
Table 5. Results of robustness evaluation for R-NP-HPTLC and G-RP-HPTLC methods (mean ± SD; n = 6).
Conc.
(ng Band−1)
Mobile Phase Composition (Chloroform–Methanol)Results
OriginalUsed Area ± SD% CVRf
R-NP-HPTLC method
87:13+2.04138 ± 1323.180.37
10085:1585:150.04082 ± 1433.500.38
83:17−2.03964 ± 1263.170.39
G-RP-HPTLC method
Mobile phase composition (ethanol–water)
67:33+2.026,012 ± 1380.490.74
40065:3565:350.025,956 ± 1160.440.75
63:37−2.025,836 ± 1130.430.76
Table 6. Comparison of present R-NP-HPTLC and G-RP-HPTLC assays with literature HPTLC assays for the quantitation of TRV.
Analytical MethodLinearity RangeAccuracy (% Recovery)Precision (% CV)Ref.
HPTLC500–3000 (ng band−1)99.85–100.700.37–1.84[4]
HPTLC20–500 (ng band−1)--[32]
HPTLC50–100 (ng band−1)85.33–87.000.05–0.12[34]
HPTLC50–2500 (ng band−1)99.54–100.600.57–1.78[3]
HPTLC100–1600 (ng band−1)90.32–96.490.45–1.90[35]
R-NP-HPTLC30–400 (ng band−1)90.86–93.551.41–3.42Present work
G-RP-HPTLC10–1200 (ng band−1)98.03–101.800.40–1.02Present work
Publisher’s Note: MDPI stays neutral with regard to jurisdictional claims in published maps and institutional affiliations.