Article

On Process Intensification through Membrane Storage Reactors

by
John Lowd III
1,
Theodore Tsotsis
2 and
Vasilios I. Manousiouthakis
1,*
1
Department of Chemical and Biomolecular Engineering, University of California at Los Angeles (UCLA), Los Angeles, CA 90095, USA
2
Mork Family Department of Chemical Engineering & Materials Science, University of Southern California, Los Angeles, CA 90089, USA
*
Author to whom correspondence should be addressed.
Separations 2021, 8(11), 195; https://doi.org/10.3390/separations8110195
Submission received: 16 September 2021 / Revised: 8 October 2021 / Accepted: 11 October 2021 / Published: 20 October 2021
(This article belongs to the Special Issue Modeling, Simulation, and Optimization of Membrane Processes)

Abstract

:
In this work, a dynamic, one-dimensional, first principle-based model of a novel membrane storage reactor (MSR) process is developed and simulated. The resulting governing equations are rendered dimensionless and are shown to feature two dimensionless groups that can be used to affect process performance. The novel process is shown to intensify production of a desired species through the creation of two physically distinct domains separated by a semipermeable boundary, and dynamic operation. A number of metrics are then introduced and applied to a case study on Steam Methane Reforming, for which a parametric study is carried out which establishes the superior performance of the MSR when compared to a reactor operating at steady state (SSR).

1. Introduction

Over the course of the last forty years, process intensification (PI) has continued to develop as an area of active chemical engineering research, incorporating numerous considerations, including process safety [1] and process systems engineering [2]. PI encompasses any process design strategy that leads to a smaller, cleaner, safer, and/or more energy-efficient technology. Additionally, PI also includes system designs which reduce the number of devices employed [3]. To this end, chemical reactor design incorporating separation technologies continues to be an active area of PI research, with prominent examples being membrane reactors (MR) carrying out steam methane reforming (SMR)-based hydrogen production at lower temperatures [4], dividing-wall columns combining multiple distillation channels into a single unit [5], and compact catalytic plate reactors for Fischer–Tropsch synthesis [6]. Our team has designed and analyzed intensified reactor configurations for hydrogen production via the Water Gas Shift (WGS) reaction. At the lab-scale, we have investigated the efficacy of carbon molecular sieve (CMS)-based membrane reactors for use in combined reactive separation networks [7]. We have also developed and experimentally studied a novel hybrid membrane reactor-adsorptive reactor (MR-AR) configuration. This technology, which is currently being field-tested, produces high-purity hydrogen with simultaneous carbon dioxide capture for application to Integrated Gas Combined Cycle (IGCC)-based power generation [8].
As advances in computational software have continued, there has also been a substantial increase in the number of tools developed for identifying new PI methodologies at the theoretical level. Advanced mathematical formulations, such as our Infinite DimEnsionAl State-Space (IDEAS) framework [9] and multi-objective optimization techniques [10], have helped introduce systematic approaches for developing and identifying PI pathways for various chemical systems. These advances have naturally led to the development of software for the generation of sustainable design alternatives to be used for PI purposes [11], and for using thermodynamic analysis to assess the viability of proposed technologies [12].
In addition to our experimental efforts noted above, we have carried out extensive theoretical research in developing PI models. These efforts include the design and simulation of multi-scale reactor models whose constitutive equations are derived through application of conservation laws and the Reynolds Transport Theorem. Through our rigorous mathematical development, we have successfully modeled transport at the reactor and catalyst pellet scales [13], and have implemented advanced transport models, such as the Dusty Gas Model (DGM), Stefan–Maxwell model (SMM), and Chapman–Enskog framework [14]. We have also proposed methodologies for the synthesis of intensified processes, through the aforementioned IDEAS framework that has been used to identify performance limits for reactive separation networks [15], and the Energetically Enhanced Process (EEP) concept that has been used to synthesize energy-intensified flowsheets using MR networks [16].
The focus of this paper is the continued development of the novel Membrane Storage Reactor (MSR) process, which aims to intensify traditional steady-state reactor designs. This work expands on our previous studies on the subject [17], by incorporating spatial variation into the mathematical development of the MSR model, and demonstrating that the MSR process can intensify high temperature/pressure processes subjected to limitations stemming from either reaction equilibrium or kinetics [18]. In the current paper, the proposed process is shown to incorporate several PI features, such as simultaneously carrying out reaction, separation, and storage in a single unit, in addition to driving force maximization through dynamic operation, while avoiding reliability issues currently associated with high-temperature membranes.

2. Mathematical Formulation

In this study, a composite one-dimensional model for the intensified MSR process is derived which captures and highlights several attractive MSR characteristics. Following non-dimensionalization, dimensionless groups governing the MSR behavior are identified. The MSR is considered to be a composite thermodynamic system ( r ) comprised of three domains that are spatially distributed and exclusive of each other (reactor voids ( v ) , catalyst pellet ( c ) , and storage pellet ( s ) ), and a maximum of two phases (gas ( g ) , and solid ( s o ) ). The volume fractions of the voids ( v ) , catalyst ( c ) , and storage ( s ) domains are denoted as ε v ,   ε c ,   ε s , respectively, while the volume fractions of the gas and solid phases in the storage domain are denoted as ε g s ,   ε s o s , respectively. In the context of this study, the following are then considered to hold:
{ ε v + ε c + ε s = 1 ,   ε g s +   ε s o s = ε s }
The communication between the catalyst and reactor voids (gas phase) domains is quantified using an effectiveness factor approach, and the communication between the storage domain and reactor gas phase domains through a permselective layer on the storage domain’s control surface is quantified using species transport equations obeying Sieverts’ Law. The composite system ( r ) is considered to be isothermal, whereas the reactor voids domain ( v ) is also considered to be isobaric. The molar diffusion flux of gaseous species in the voids domain is considered to be negligible compared to the species convective molar flux. No reaction occurs within the storage domain. The reacting mixture is considered to be an ideal gas. The equation describing Mass Conservation (molar form) of species i in phase g within domain v on a system r volumetric basis is:
[ t ( ε v c i , g v ( t , z ) ) + z ( ε v v g ( t , z ) c i , g v ( t , z ) ) ] = [ ε c ρ c η r i ( { c k , g v ( t , z ) } k = 1 N C , T ) + S i , g v , g s ( t , z ) ]   i = 1 , N C  
The Peclet number, P e = v e f f L c h a r D e f f , is typically used to determine whether a process is dominated by convective or diffusive mass transport processes, where v e f f is a gas velocity, L c h a r is a characteristic length, and D e f f is the effective diffusion coefficient of the transferrable species. Although there is still considerable debate regarding the choice of these parameters, which depend on the structure and geometry of the system at hand [19], it is generally agreed that P e 1 is sufficient to ignore diffusive effects. For example, the porosity of the system that is available for diffusion is generally smaller than the total porosity itself [20]. The parameter D e f f is evaluated as D e f f = ε v D A B using the binary diffusion coefficient, D A B , of the transferrable species, which in turn can be evaluated using the Chapman–Enskog solution to the Boltzmann Equation along with a Lennard-Jones potential for estimating the effects of intermolecular forces. Using the formulation established in our previous results [14], the values of D A B for the species present in the considered case study fall in the range of 0.02 D A B 0.15   ( c m 2 s ) . Values for the characteristic length can be obtained by considering L c h a r to be equal either to the length or the radius of the reactor, which in turn yield P e values that satisfy P e 1 × 10 5 and P e 100 , respectively, and justify neglecting diffusion in the void domain.”
The equation describing Mass Conservation (molar form) of species i in phase g within domain s on a system r volumetric basis is:
t ( ε g s c i , g s ( t , z ) ) = S i , g s , g v ( t , z )   i = 1 , N C  
where the temporal and spatial dependence of all volume fractions, the effectiveness factor, and the catalyst pellet density are not shown, because they will next be considered constant.
Sieverts’ Law has commonly been employed in quantifying species’ molar fluxes through Pd membrane layers [18]. For such membranes, it has been shown, both theoretically [21] and experimentally [22], that the molar flow rate is proportional to a nth power differential of partial pressures, where 0.5 < n < 1. In this work we employ the same transport equation with n = 1, because it has been shown to hold true for high-temperature SiC membranes [23]. The resulting equation is then:
S i , g s , g v ( t , z ) = S i , g v , g s ( t , z ) = α s , v β i ( P i , g v ( t , z ) P i , g s ( t , z ) ) i = 1 , ... , N C
where β i is the i t h species molar permeance through the permselective layer, α s , v is the storage-void interfacial area per unit reactor volume, and P i , g v ,   P i , g s are the i t h species partial pressures in the gas phase of the reactor void and storage domains. Considering an ideal gas mixture, the following relations hold:
{ P i , g v ( t , z ) = c i , g v ( t , z ) R T ,   P i , g s ( t , z ) = c i , g s ( t , z ) R T   i = 1 , , N C }
where R is the universal gas constant, and T is the reactor temperature that is considered to be constant over both time and space. Combining the above equations yields:
{ P i , g v ( t , z ) t + z ( v g ( t , z ) P i , g v ( t , z ) ) = R T ε v [ ε c ρ c η r i ( { P k , g v ( t , z ) R T } k = 1 N C , T ) β i α s , v ( P i , g v ( t , z ) P i , g s ( t , z ) ) ]   i = 1 , N C P i , g s ( t , z ) t = R T ε g s α s , v β i ( P i , g v ( t , z ) P i , g s ( t , z ) )   i = 1 , N C }
Summing the gas phase species conservation equations in the void domain and utilizing the isobaric void domain assumption yields:
v g ( t , z ) z = R T ε v k = 1 N C P k , g v [ ε c ρ c η l = 1 N C r l ( { P k , g v R T } k = 1 N C , T ) α s , v l = 1 N C [ β l ( P l , g v P l , g s ) ] ]
Substitution of Equation (7) into Equation (6) then yields:
{ P i , g v ( t , z ) t + v g ( t , z ) P i , g v ( t , z ) z = R T ε v [ ε c ρ c η [ r i ( { P k , g v ( t , z ) R T } k = 1 N C , T ) P i , g v ( t , z ) k = 1 N C P k , g v l = 1 N C r l ( { P k , g v ( t , z ) R T } k = 1 N C , T ) ] α s , v [ β i ( P i , g v ( t , z ) P i , g s ( t , z ) ) P i , g v ( t , z ) k = 1 N C P k , g v l = 1 N C [ β l ( P l , g v ( t , z ) P l , g s ( t , z ) ) ] ] ]   i = 1 , N C P i , g s ( t , z ) t = R T ε g s α s , v β i ( P i , g v ( t , z ) P i , g s ( t , z ) )   i = 1 , N C v g ( t , z ) z = R T ε v k = 1 N C P k , g v [ ε c ρ c η l = 1 N C r l ( { P k , g v ( t , z ) R T } k = 1 N C , T ) α s , v l = 1 N C [ β l ( P l , g v ( t , z ) P l , g s ( t , z ) ) ] ] }
Next, dimensionless variables are introduced, and dimensionless groups are identified governing MSR behavior:
z ¯ z L ,   v ¯ g v g v ,   t L v ,   t ¯ t t ,   P ¯ i , g v P i , g v P ,   P ¯ i , g s P i , g s P ,   Θ   t R T α s , v β 1 ε v = 1 P e   D a R T P ρ c r t ,   r ¯ i ( { P ¯ k , g v P R T } k = 1 N C , T ) r i ( { P k , g v R T } k = 1 N C , T ) r
where P is the operating pressure of the reactor, L is the length of the reactor, v is the inlet velocity to the reactor at time zero, and t = L / v is the reactor’s residence time at time zero, and r* is defined later in this paper. Given that z is the reactor’s axial coordinate, L is the length of the reactor, and z ¯ z L , the reactor inlet and outlet can be designated as z ¯ = 0   ,   z ¯ = 1 , respectively.
Given that the reactor voids domain ( v ) is considered isobaric, with operating pressure P , then k = 1 N C P k , g v = P , which implies that k = 1 N C P ¯ k , g v = 1 . Then, the resulting dimensionless equations for the MSR model are:
{ [ P ¯ i , g v ( t ¯ , z ¯ ) t ¯ + + v ¯ g ( t ¯ , z ¯ ) P ¯ i , g v ( t ¯ , z ¯ ) z ¯ ] = [ D a ε c ε v η [   r ¯ i ( { P ¯ k , g v ( t ¯ , z ¯ ) P R T } k = 1 N C , T ) P ¯ i , g v ( t ¯ , z ¯ ) l = 1 N C   r ¯ i ( { P ¯ k , g v ( t ¯ , z ¯ ) P R T } k = 1 N C , T ) ] Θ [ β i β 1 ( P ¯ i , g v ( t ¯ , z ¯ ) P ¯ i , g s ( t ¯ , z ¯ ) ) P ¯ i , g v ( t ¯ , z ¯ ) l = 1 N C [ β l β 1 ( P ¯ l , g v ( t ¯ , z ¯ ) P ¯ l , g s ( t ¯ , z ¯ ) ) ] ] ]   i = 1 , N C P ¯ i , g s ( t ¯ , z ¯ ) t ¯ = Θ ε v ε g s β i β 1 ( P ¯ i , g v ( t ¯ , z ¯ ) P ¯ i , g s ( t ¯ , z ¯ ) )   i = 1 , N C v ¯ g ( t ¯ , z ¯ ) z ¯ = [ D a ε c ε v η l = 1 N C   r ¯ i ( { P ¯ k , g v ( t ¯ , z ¯ ) P R T } k = 1 N C , T ) Θ l = 1 N C [ β l β 1 ( P ¯ l , g v ( t ¯ , z ¯ ) P ¯ l , g s ( t ¯ , z ¯ ) ) ] ] }
The above MSR dimensionless model suggests that two dimensionless numbers determine the MSR’s dynamic behavior. The first dimensionless quantity, Θ = 1 / P e , provides a measure of how effectively the desired product species is being extracted from the reactor void domain into the gas storage domain, as compared to its axial convective transport in the reactor void domain. The Peclet number, Pe, is a dimensionless group commonly used in the analysis of membrane reactors [24,25,26,27]. The Damkohler number, D a , captures the importance of the rate of convection compared to the reaction rate and can be thought as the ratio of the characteristic time for convective flow to the characteristic time for reaction. The use of these dimensionless numbers in assessing the performance of membrane reactor systems reduces the dimensionality of the design parameter space for the MSR process and is widely practiced in MR experimental and theoretical research [28,29].
As mentioned earlier, the proposed MSR process is operated in a dynamic (periodic) manner. A possible such dynamic operation is a “Partial Pressure Swing Operation” (PPSO) of the MSR, which keeps the reactor pressure and temperature constant, and involves three modes of operation. In the first Operating Mode (OM), with duration τ 1 (dimensionless duration τ ¯ 1 ), the MSR operates in a Loading-Reaction mode for phase ( g ) in domain ( v ) (where the reactants are being loaded (fed) into the MSR and the desired reactions are carried out in the presence of ( c ) and accounted for in ( v ) ), and in a Storage mode for phase ( g ) in domain ( s ) (where the desired species is preferentially transported from ( v ) to ( s ) , where they are stored). In the second OM, with duration τ 2 (dimensionless duration τ ¯ 2 ), the MSR operates in a Reactant-Flushing mode for phase ( g ) in domain ( v ) (where the reactants are being removed from ( v ) ), and in Storage-Maintenance mode in phase ( g ) in domain ( s ) (where the desired species is maintained in storage within ( s ) ). In the third and final OM, with duration τ 3 (dimensionless duration τ ¯ 3 ), the MSR operates in an Emptying mode for phase ( g ) in domain ( s ) (where the desired chemicals are emptied from storage within ( s ) , and transported into ( v ) ), and in Unloading-Production mode for phase ( g ) in domain ( v ) (where the desired species are removed from ( v ) , to yield the desirable MSR products).
Comparing the performance of a periodic process with that of a traditionally steady-state process necessitates the introduction of several performance metrics. These metrics can be defined for each OM and for the process as a whole, namely for the duration of all three aforementioned OMs. To this end, the axial molar flowrate of the i t h species F i , g v is expressed in terms of a reference molar flowrate F and a dimensionless molar flowrate F ¯ i , g v , as follows:
F P v ε v A r R T ,   F ¯ i , g v F i , g v F = c i , g v v g ε v A r F = P P ¯ i , g v v v ¯ g ε v A r R T F = P ¯ i , g v v ¯ g
Then, the following dimensionless metrics are defined and explained below:

2.1. Limiting Reactant Conversion

An important metric for the assessment of MSR performance is the conversion of a limiting reactant R L I M . Typically, this reactant will be fed in the MSR during one OM, but may be removed from the MSR during multiple OMs. Thus, we define its conversion over all OM as follows:
X R L I M [ 0 k = 1 N O M τ k F R L I M , g v ( t , 0 ) d t 0 k = 1 N O M τ k F R L I M , g v ( t , L ) d t ] 0 k = 1 N O M τ k F R L I M , g v ( t , 0 ) d t = [ 0 k = 1 N O M τ ¯ k F ¯ R L I M , g v ( t ¯ , 0 ) d t ¯ 0 k = 1 N O M τ ¯ k F ¯ R L I M , g v ( t ¯ , 1 ) d t ¯ ] 0 k = 1 N O M τ ¯ k F ¯ R L I M , g v ( t ¯ , 0 ) d t ¯

2.2. Desired Product Ratio

Another important metric for the assessment of MSR performance is one that captures the extent to which the desired product is formed as the limiting reactant is converted. Thus, the following OM-dependent metric is introduced that is equal to the ratio of the i t h species amount generated during OM k over the limiting reactant’s R L I M amount fed throughout all OMs.
ω i , k [ k = 0 k = k 1 τ k k = 0 k = k τ k F i , g v ( t , L ) d t k = 0 k = k 1 τ k k = 0 k = k τ k F i , g v ( t , 0 ) d t ] 0 k = 1 N O M τ k F R L I M , g v ( t , 0 ) d t = [ k = 0 k = k 1 τ ¯ k k = 0 k = k τ ¯ k F ¯ i , g v ( t ¯ , 1 ) d t ¯ k = 0 k = k 1 τ ¯ k k = 0 k = k τ ¯ k F ¯ i , g v ( t ¯ , 0 ) d t ¯ ] 0 k = 1 N O M τ ¯ k F ¯ R L I M , g v ( t ¯ , 0 ) d t ¯ k = 1 , N O M ,   i = 1 , N C
where τ 0 = 0 ,   τ ¯ 0 = 0 .
An overall OM-independent metric is also introduced that is equal to the ratio of the i t h species amount generated during all OMs over the limiting reactant’s R L I M amount fed throughout all OMs.
Ω i [ 0 k = 1 N O M τ k F i , g v ( t , L ) d t 0 k = 1 N O M τ k F i , g v ( t , 0 ) d t ] 0 k = 1 N O M τ k F R L I M , g v ( t , 0 ) d t = [ 0 k = 1 N O M τ ¯ k F ¯ i , g v ( t ¯ , 1 ) d t ¯ 0 k = 1 N O M τ ¯ k F ¯ i , g v ( t ¯ , 0 ) d t ¯ ] 0 k = 1 N O M τ ¯ k F ¯ R L I M , g v ( t ¯ , 0 ) d t ¯ | i = 1 , N C
This is often referred to as product yield. It then holds:
Ω i = k = 1 N O M ω i , k

2.3. Desired Product Recovery Fraction

Finally, we define the fraction of product generated during a given OM over the total product generated over the duration of all OMs as the Product Recovery fraction, defined as:
R i , k ω i , k Ω i   k = 1 , N O M   i = 1 , , N C  
The system of non-linear first-order partial differential equations described by Equation (10) is used to simulate all three OMs of the MSR PPSO, and is solved using a direct finite element solver with implicit multistep free backward differentiation (BDF) with total time discretization consisting of 1 × 10⁶ time steps for each simulation. A fractional initial step for backward Euler consistent initialization was used, and linear first-order Lagrange shape functions were used for space discretization and consistent stabilization based on full calculation of the residual was employed. Because of the changing boundary conditions, a minimum non-linear damping factor of 1 × 10⁻⁹ was used during the Newton–Raphson iteration. The above solution strategy was coded and implemented using the COMSOL Multiphysics software platform. The MSR concept is next illustrated for the SMR process. We demonstrate, through parametric analysis, the impact of the previously identified dimensionless parameters D a ,   Θ on the performance of an SMR-MSR process operating under PPSO.

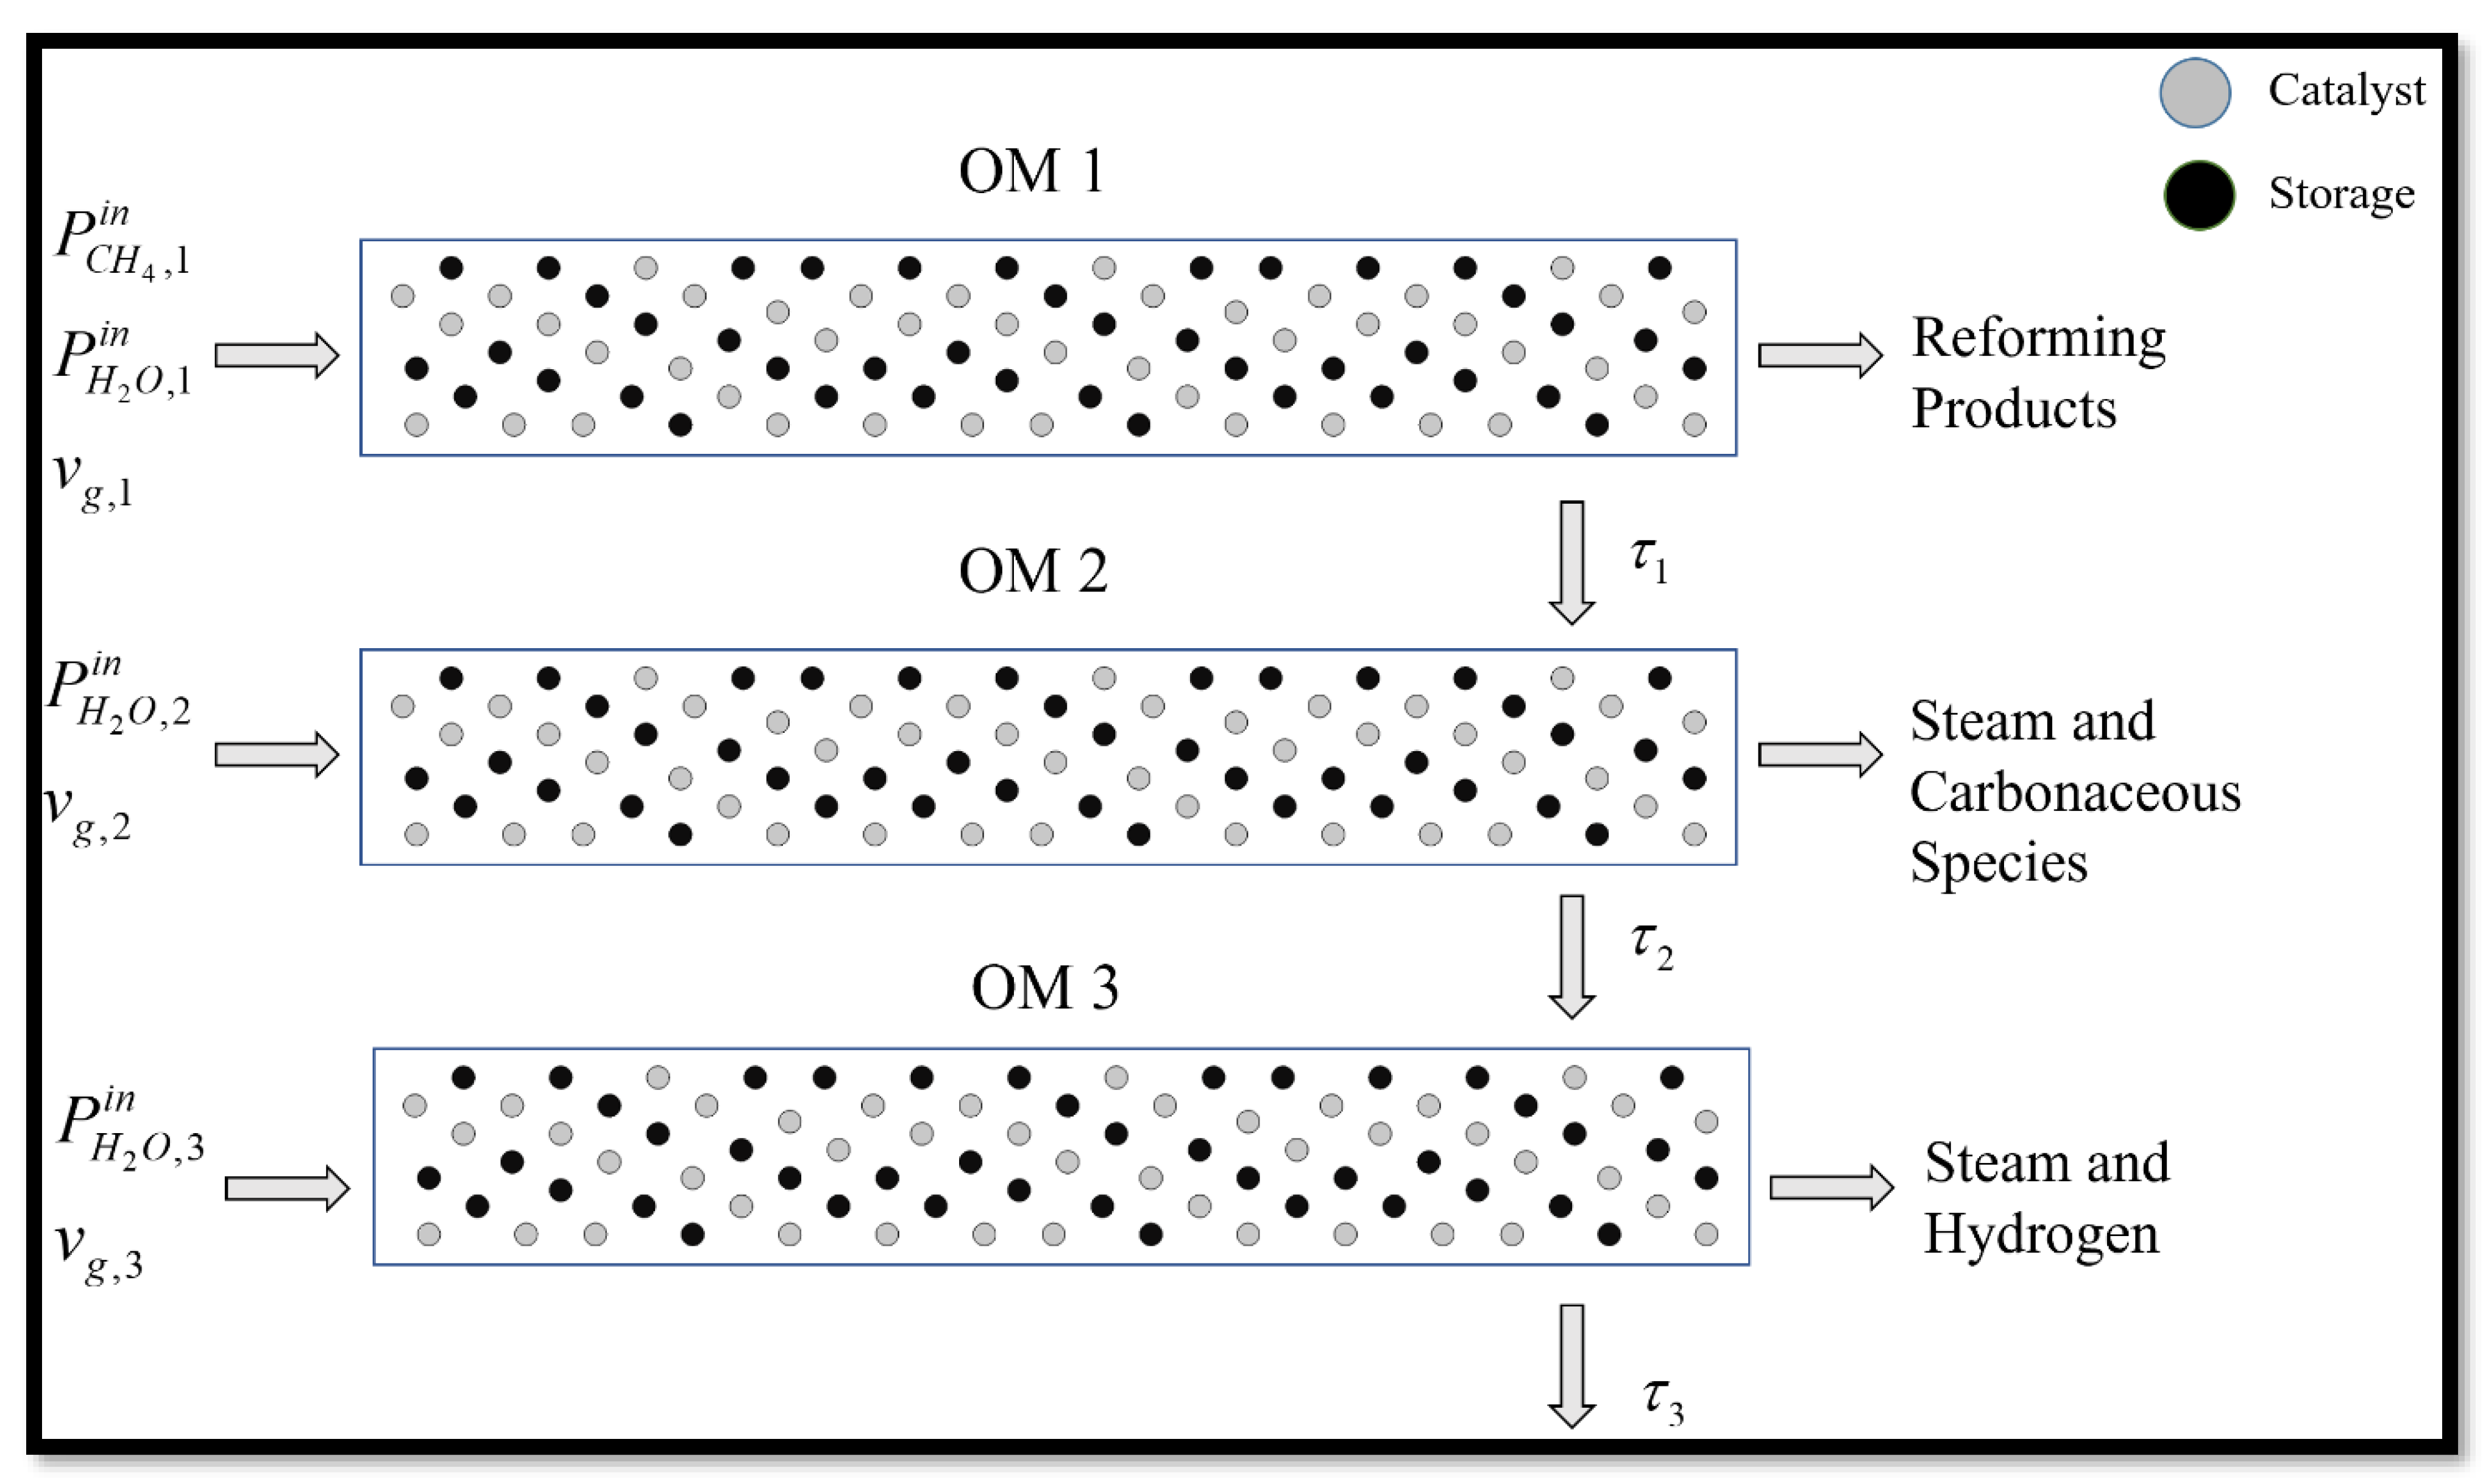
3. Steam Methane Reforming (SMR) Case Study

In this case study we propose intensifying SMR-based hydrogen production, using a MSR under PPSO whose design is pursued using the above developed dimensionless MSR model. It is shown through the use of quantifiable design metrics that the proposed SMR-MSR outperforms a conventional SMR-SSR. Approximately 95% of the hydrogen presently produced industrially in the United States is obtained via the SMR reaction [30]. Industrial reactors operate at or near equilibrium, and due in part to the high endothermicity of the SMR reaction, encompass a large portion of the operating cost of a refinery. Although membrane separation technology, using polymeric and inorganic membranes, has been investigated and shows promise for broad industrial applications [18], there is still a need for high pressure and temperature gas-phase applications.
According to Xu and Froment [31] SMR is carried out through three reversible reactions R X 1 , R X 2 , and R X 3 , with enthalpies of formation and kinetic rates as shown below:
C H 4   +   H 2 O   C O   +   3 H 2   Δ H 1 :   206.1   k J m o l   ( R X 1 )
C O   +   H 2 O   C O 2   +   H 2   Δ H 2 :   41.15   k J m o l   ( R X 2 )
C H 4   +   2 H 2 O     C O 2   +   4 H 2   Δ H 3 :   164.9   k J m o l   ( R X 3 )
{ R 1 , R 2 , R 3 } = { k 1 ( P H 2 , g v ) 2.5 ( P C H 4 , g v P H 2 O , g v ( P H 2 , g v ) 3 P C O , g v K 1 ) ( DEN ) 2   , k 2 P H 2 , g v ( P C O , g v P H 2 O , g v P H 2 , g v P C O 2 , g v K 2 ) ( DEN ) 2   , k 3 ( P H 2 , g v ) 3.5 ( P C H 4 , g v ( P H 2 O , g v ) 2 ( P H 2 , g v ) 4 P C O , g v K 3 ) ( DEN ) 2 }  
with
DEN = 1 + K C O P C O , g v + K H 2 P H 2 , g v + K C H 4 P C H 4 , g v + K H 2 O P H 2 O , g v P H 2 , g v
The kinetic and equilibrium constant values in the above expressions are listed in Table 1 and Table 2.
The above kinetic rates can be brought in dimensionless form, as suggested in [17,32]. In the definition of the Damkohler number, the reference reaction generation rate r is selected as the reaction rate for R X 1 evaluated at the reactor entrance conditions during OM 1:
r r 1 ( { ( P i , g v ( 0 , 0 ) ) R T } i = 1 N C , T ) = k 1 ( P C H 4 , g v ( 0 , 0 ) P H 2 O , g v ( 0 , 0 ) ( P H 2 , g v ( 0 , 0 ) ) 3 P C O , g v ( 0 , 0 ) K 1 ) ( P H 2 , g v ( 0 , 0 ) ) 2.5 ( 1 + K C O P C O , g v ( 0 , 0 ) + K H 2 P H 2 , g v ( 0 , 0 ) + K C H 4 P C H 4 , g v ( 0 , 0 ) + K H 2 O P H 2 O , g v ( 0 , 0 ) P H 2 , g v ( 0 , 0 ) ) 2
The resulting dimensionless reaction rates become:
R ¯ 1 = k 1 ( P ) 0.5 ( P ¯ H 2 , g v ) 2.5 ( P ¯ C H 4 , g v P ¯ H 2 O , g v ( P ) 2 ( P ¯ H 2 , g v ) 3 P ¯ C O , g v K 1 ) ( 1 + K C O P P ¯ C O , g v + K H 2 P P ¯ H 2 , g v + K C H 4 P P ¯ C H 4 , g v + K H 2 O P ¯ H 2 O , g v P ¯ H 2 , g v ) 2 r  
R ¯ 2 = k 2 P P ¯ H 2 , g v g ( P ¯ C O , g v P ¯ H 2 O , g v P ¯ H 2 , g v P ¯ C O 2 , g v K 2 ) ( 1 + K C O P P ¯ C O , g v + K H 2 P P ¯ H 2 , g v + K C H 4 P P ¯ C H 4 , g v + K H 2 O P ¯ H 2 O , g v P ¯ H 2 , g v ) 2 r
R ¯ 3 = k 3 ( P ) 0.5 ( P ¯ H 2 , g v ) 3.5 ( P ¯ C H 4 , g v ( P ¯ H 2 O , g v ) 2 ( P ) 2 ( P ¯ H 2 , g v ) 4 P ¯ C O , g v K 3 ) ( 1 + K C O P P ¯ C O , g v + K H 2 P P ¯ H 2 , g v + K C H 4 P P ¯ C H 4 , g v + K H 2 O P ¯ H 2 O , g v P ¯ H 2 , g v ) 2 r
The PPSO of the SMR-MSR is carried out in three distinct operating modes: OM 1 (Loading-Reaction/Storage), OM 2 (Decarbonization/Maintenance), and OM 3 (Unloading-Production/Emptying) each of which is characterized by different processes occurring in the ( v ) and ( s ) domains. These three OMs have a time duration designated as τ 1 , τ 2 , and τ 3 , as described next and shown in the Figure 1 below.

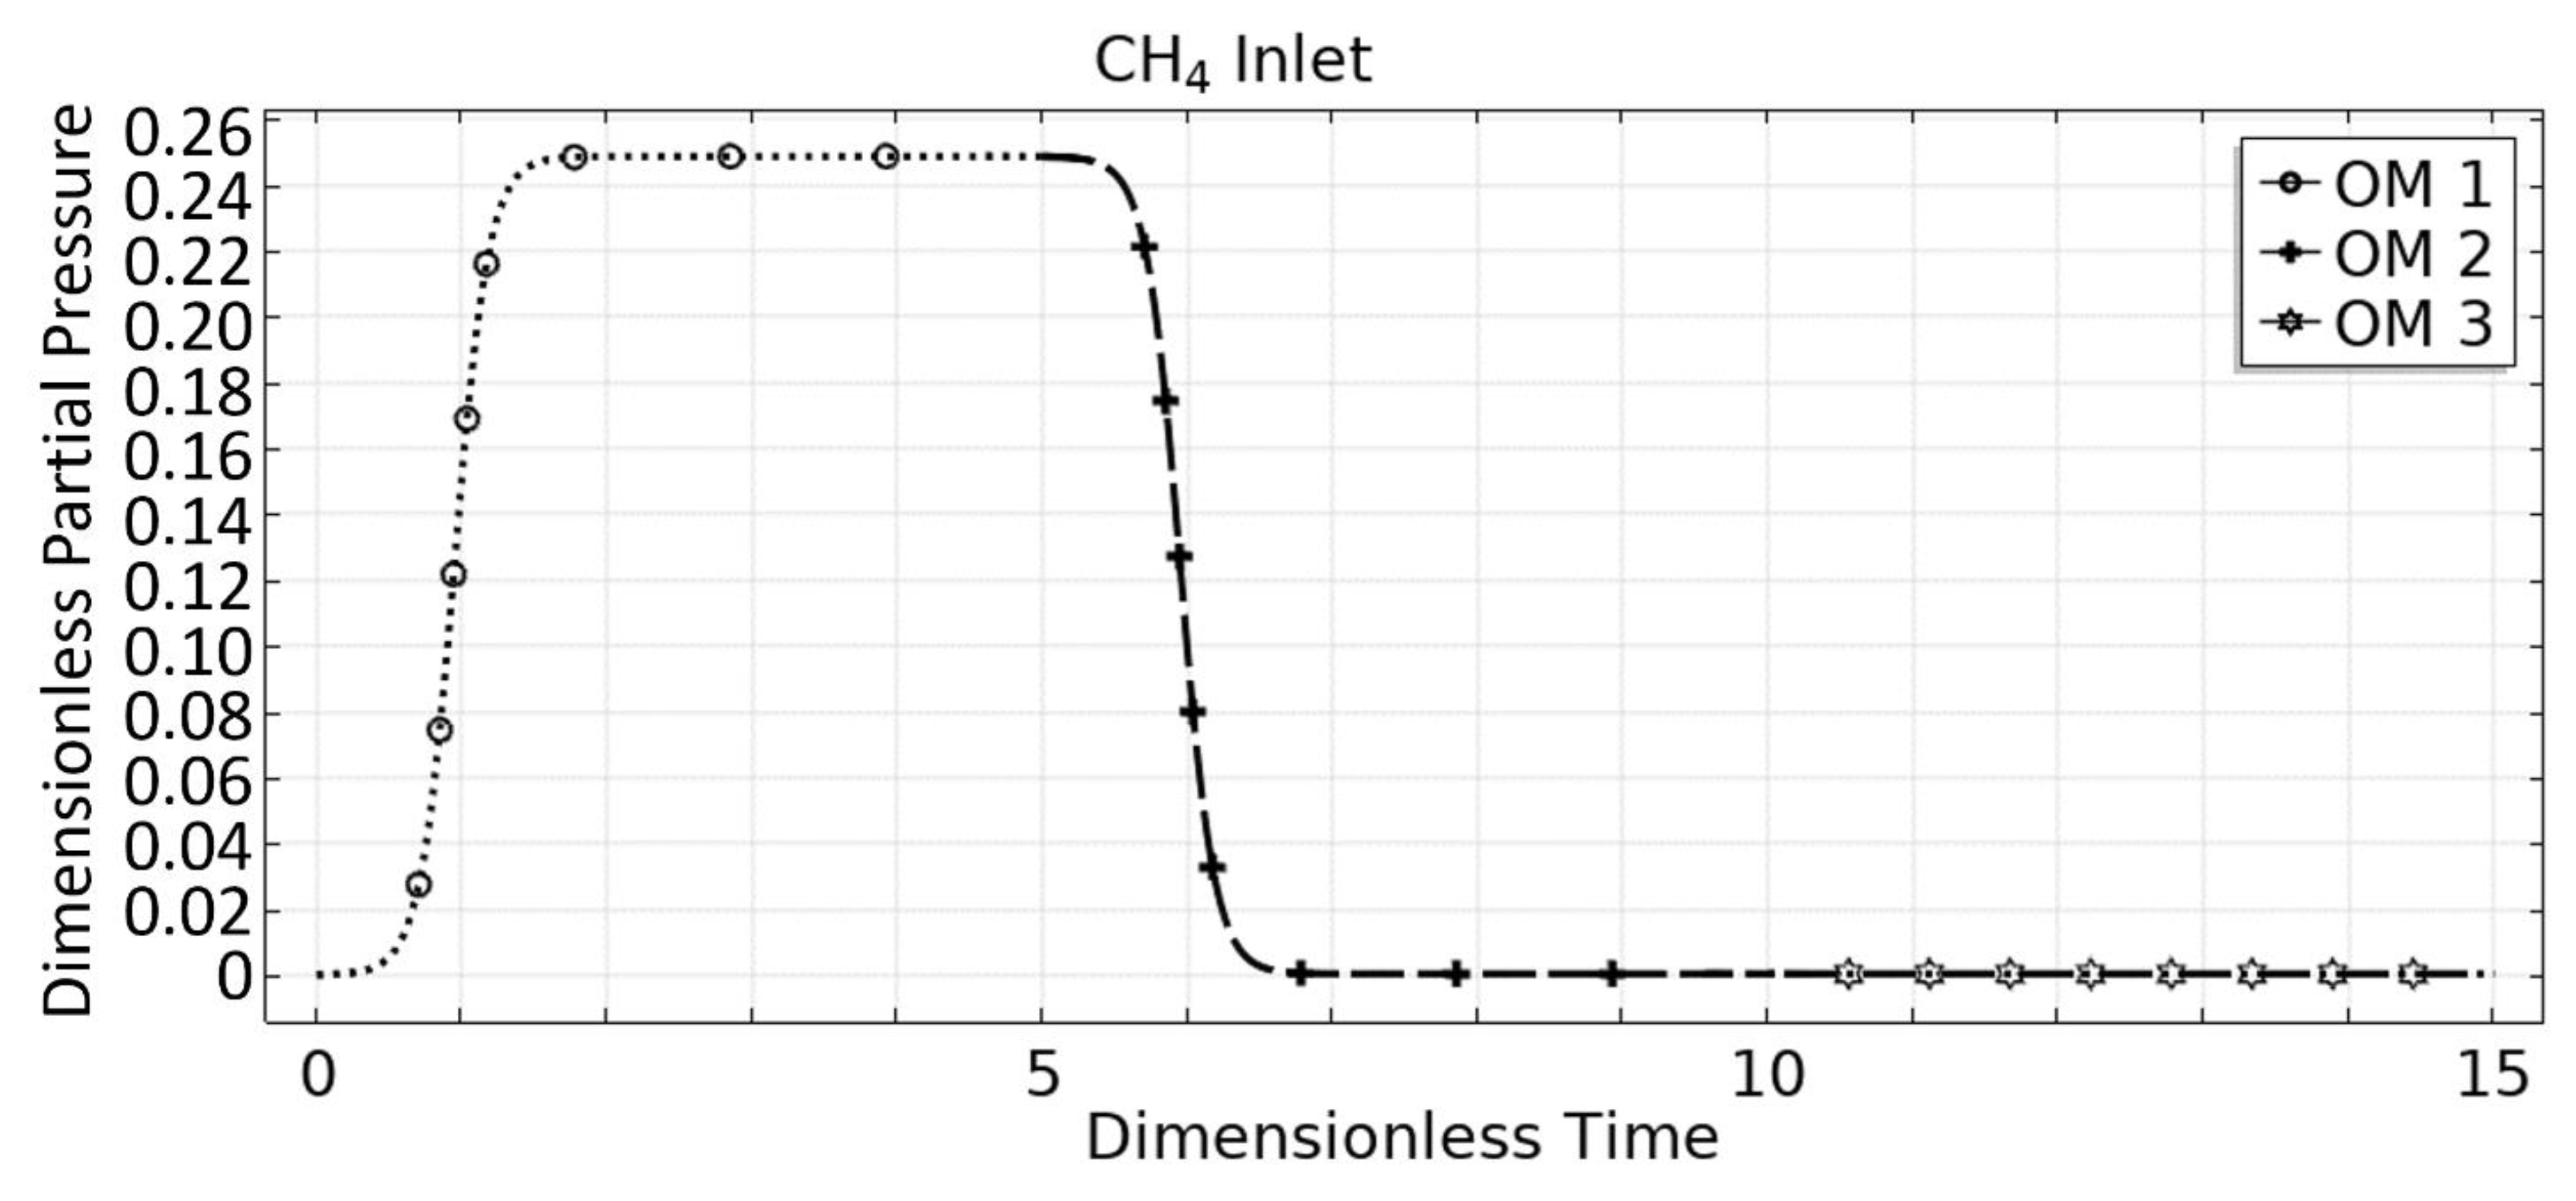
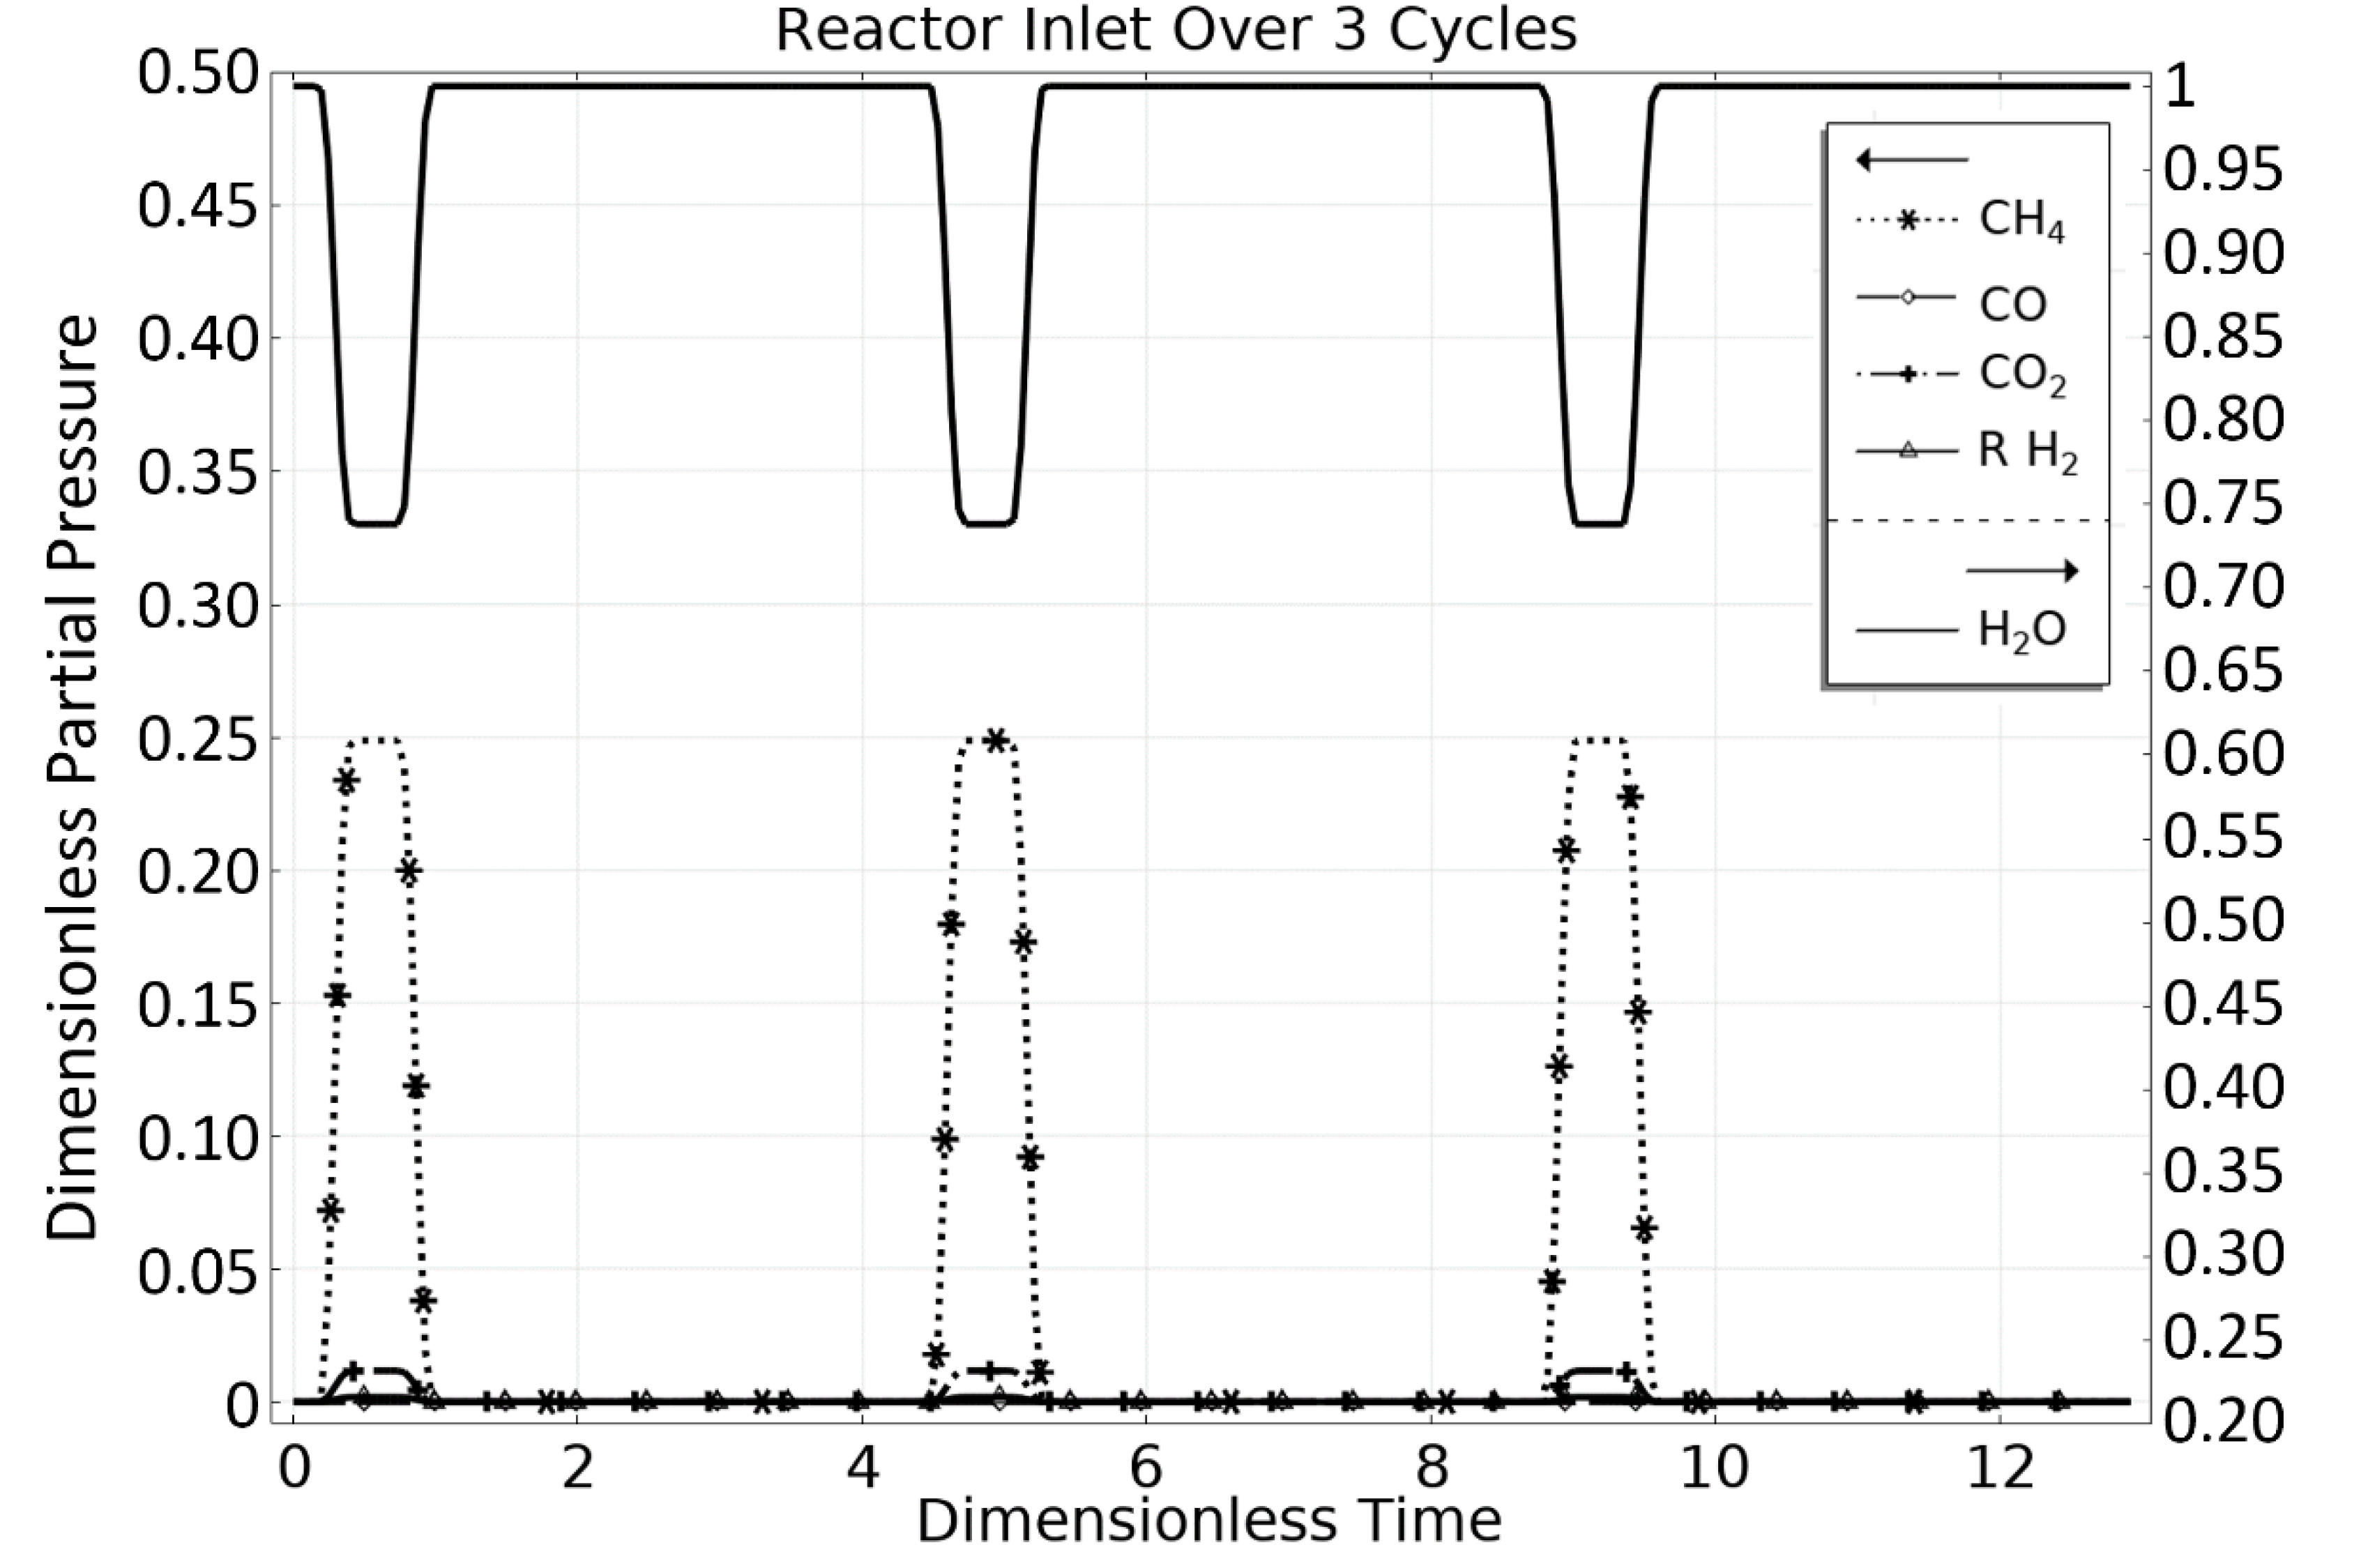
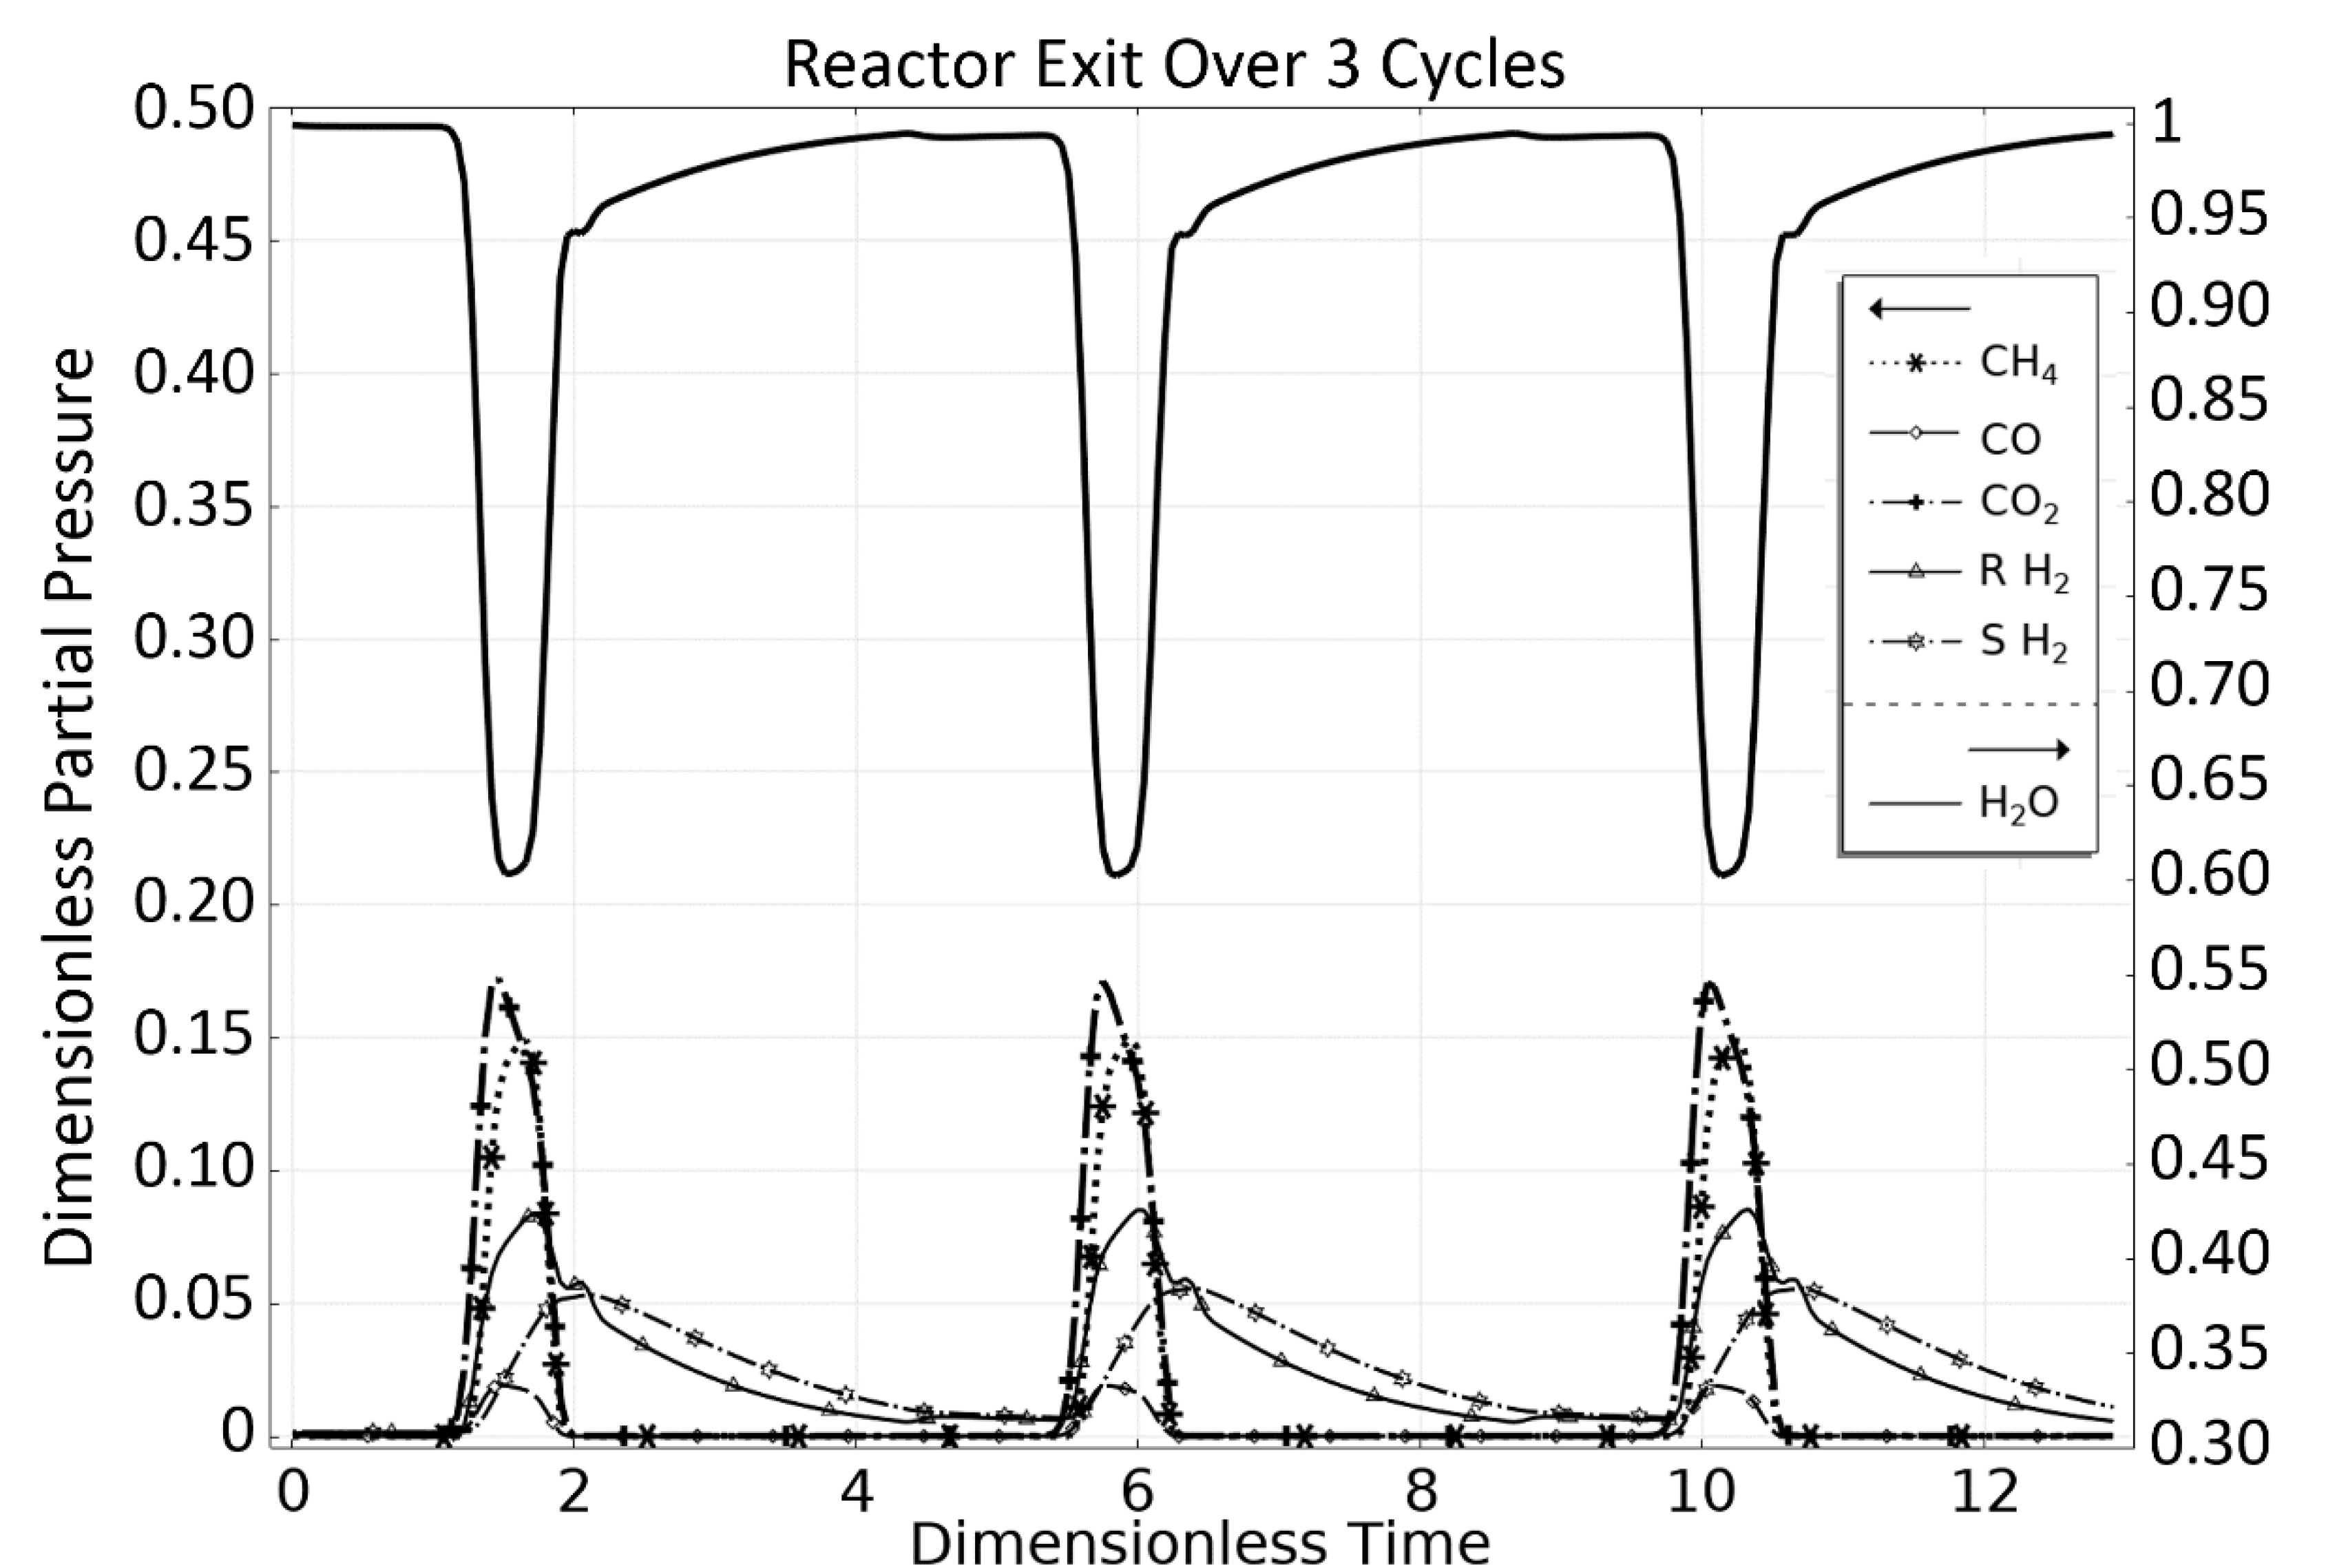
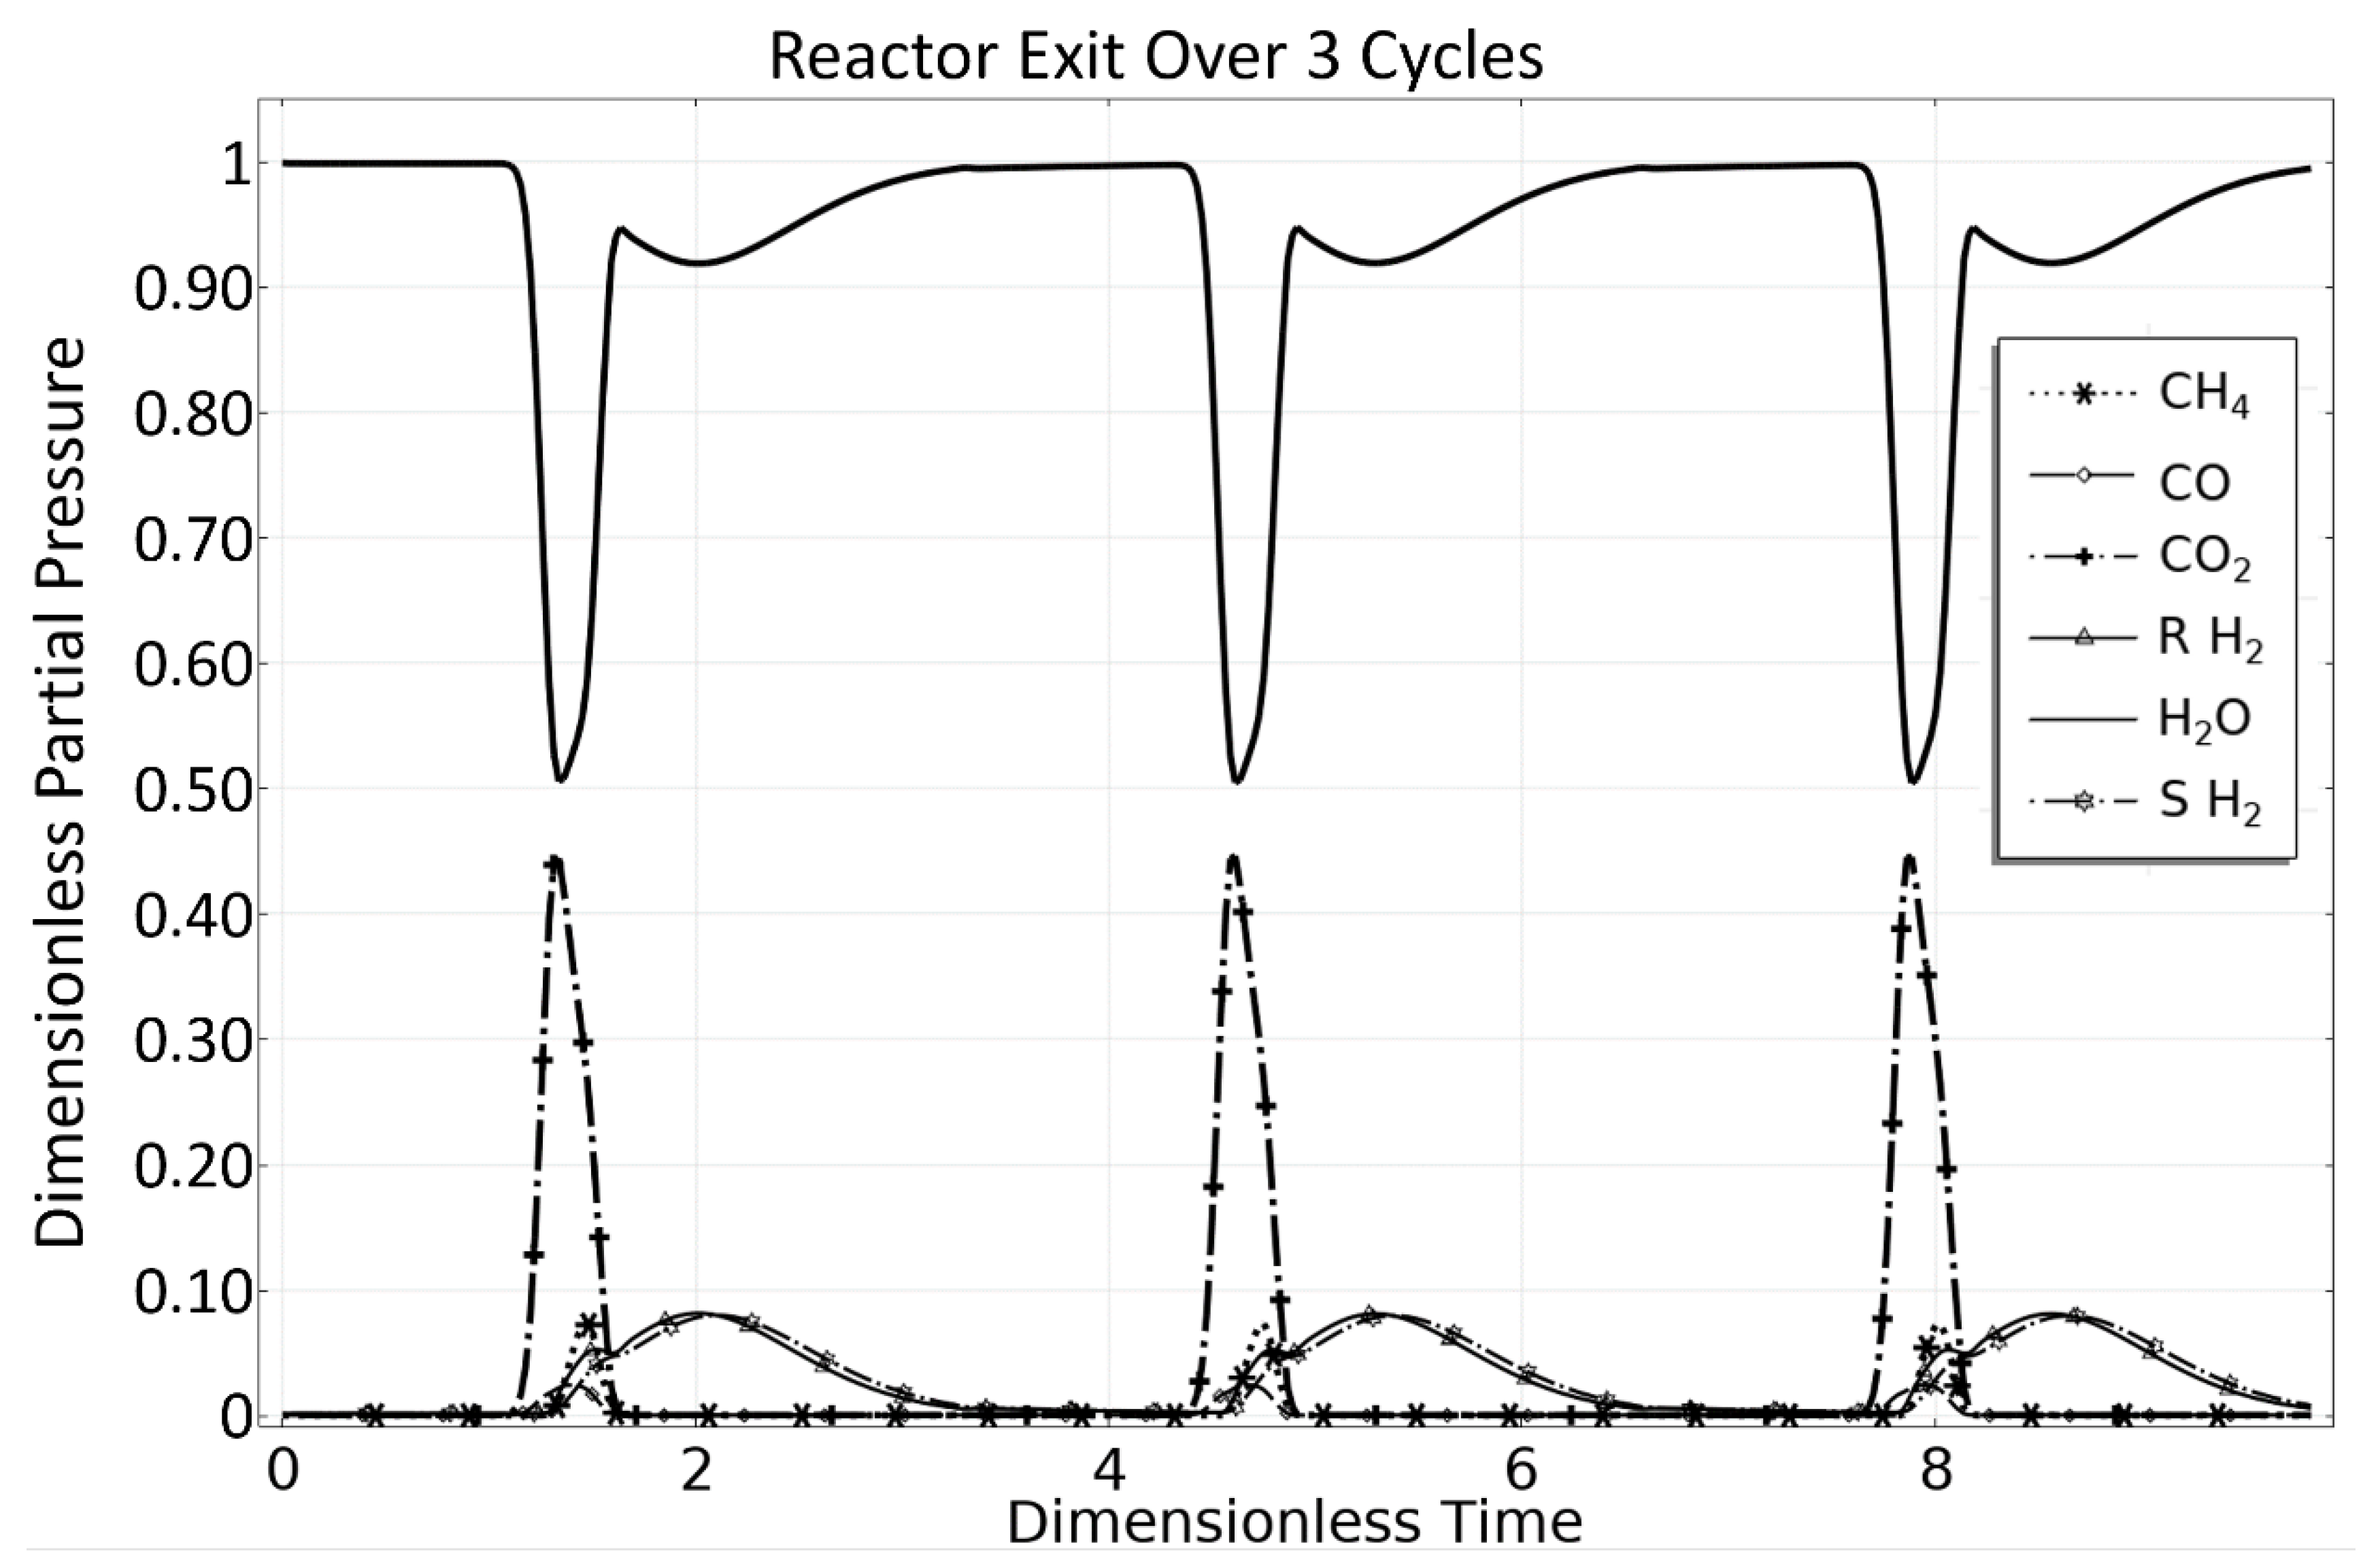
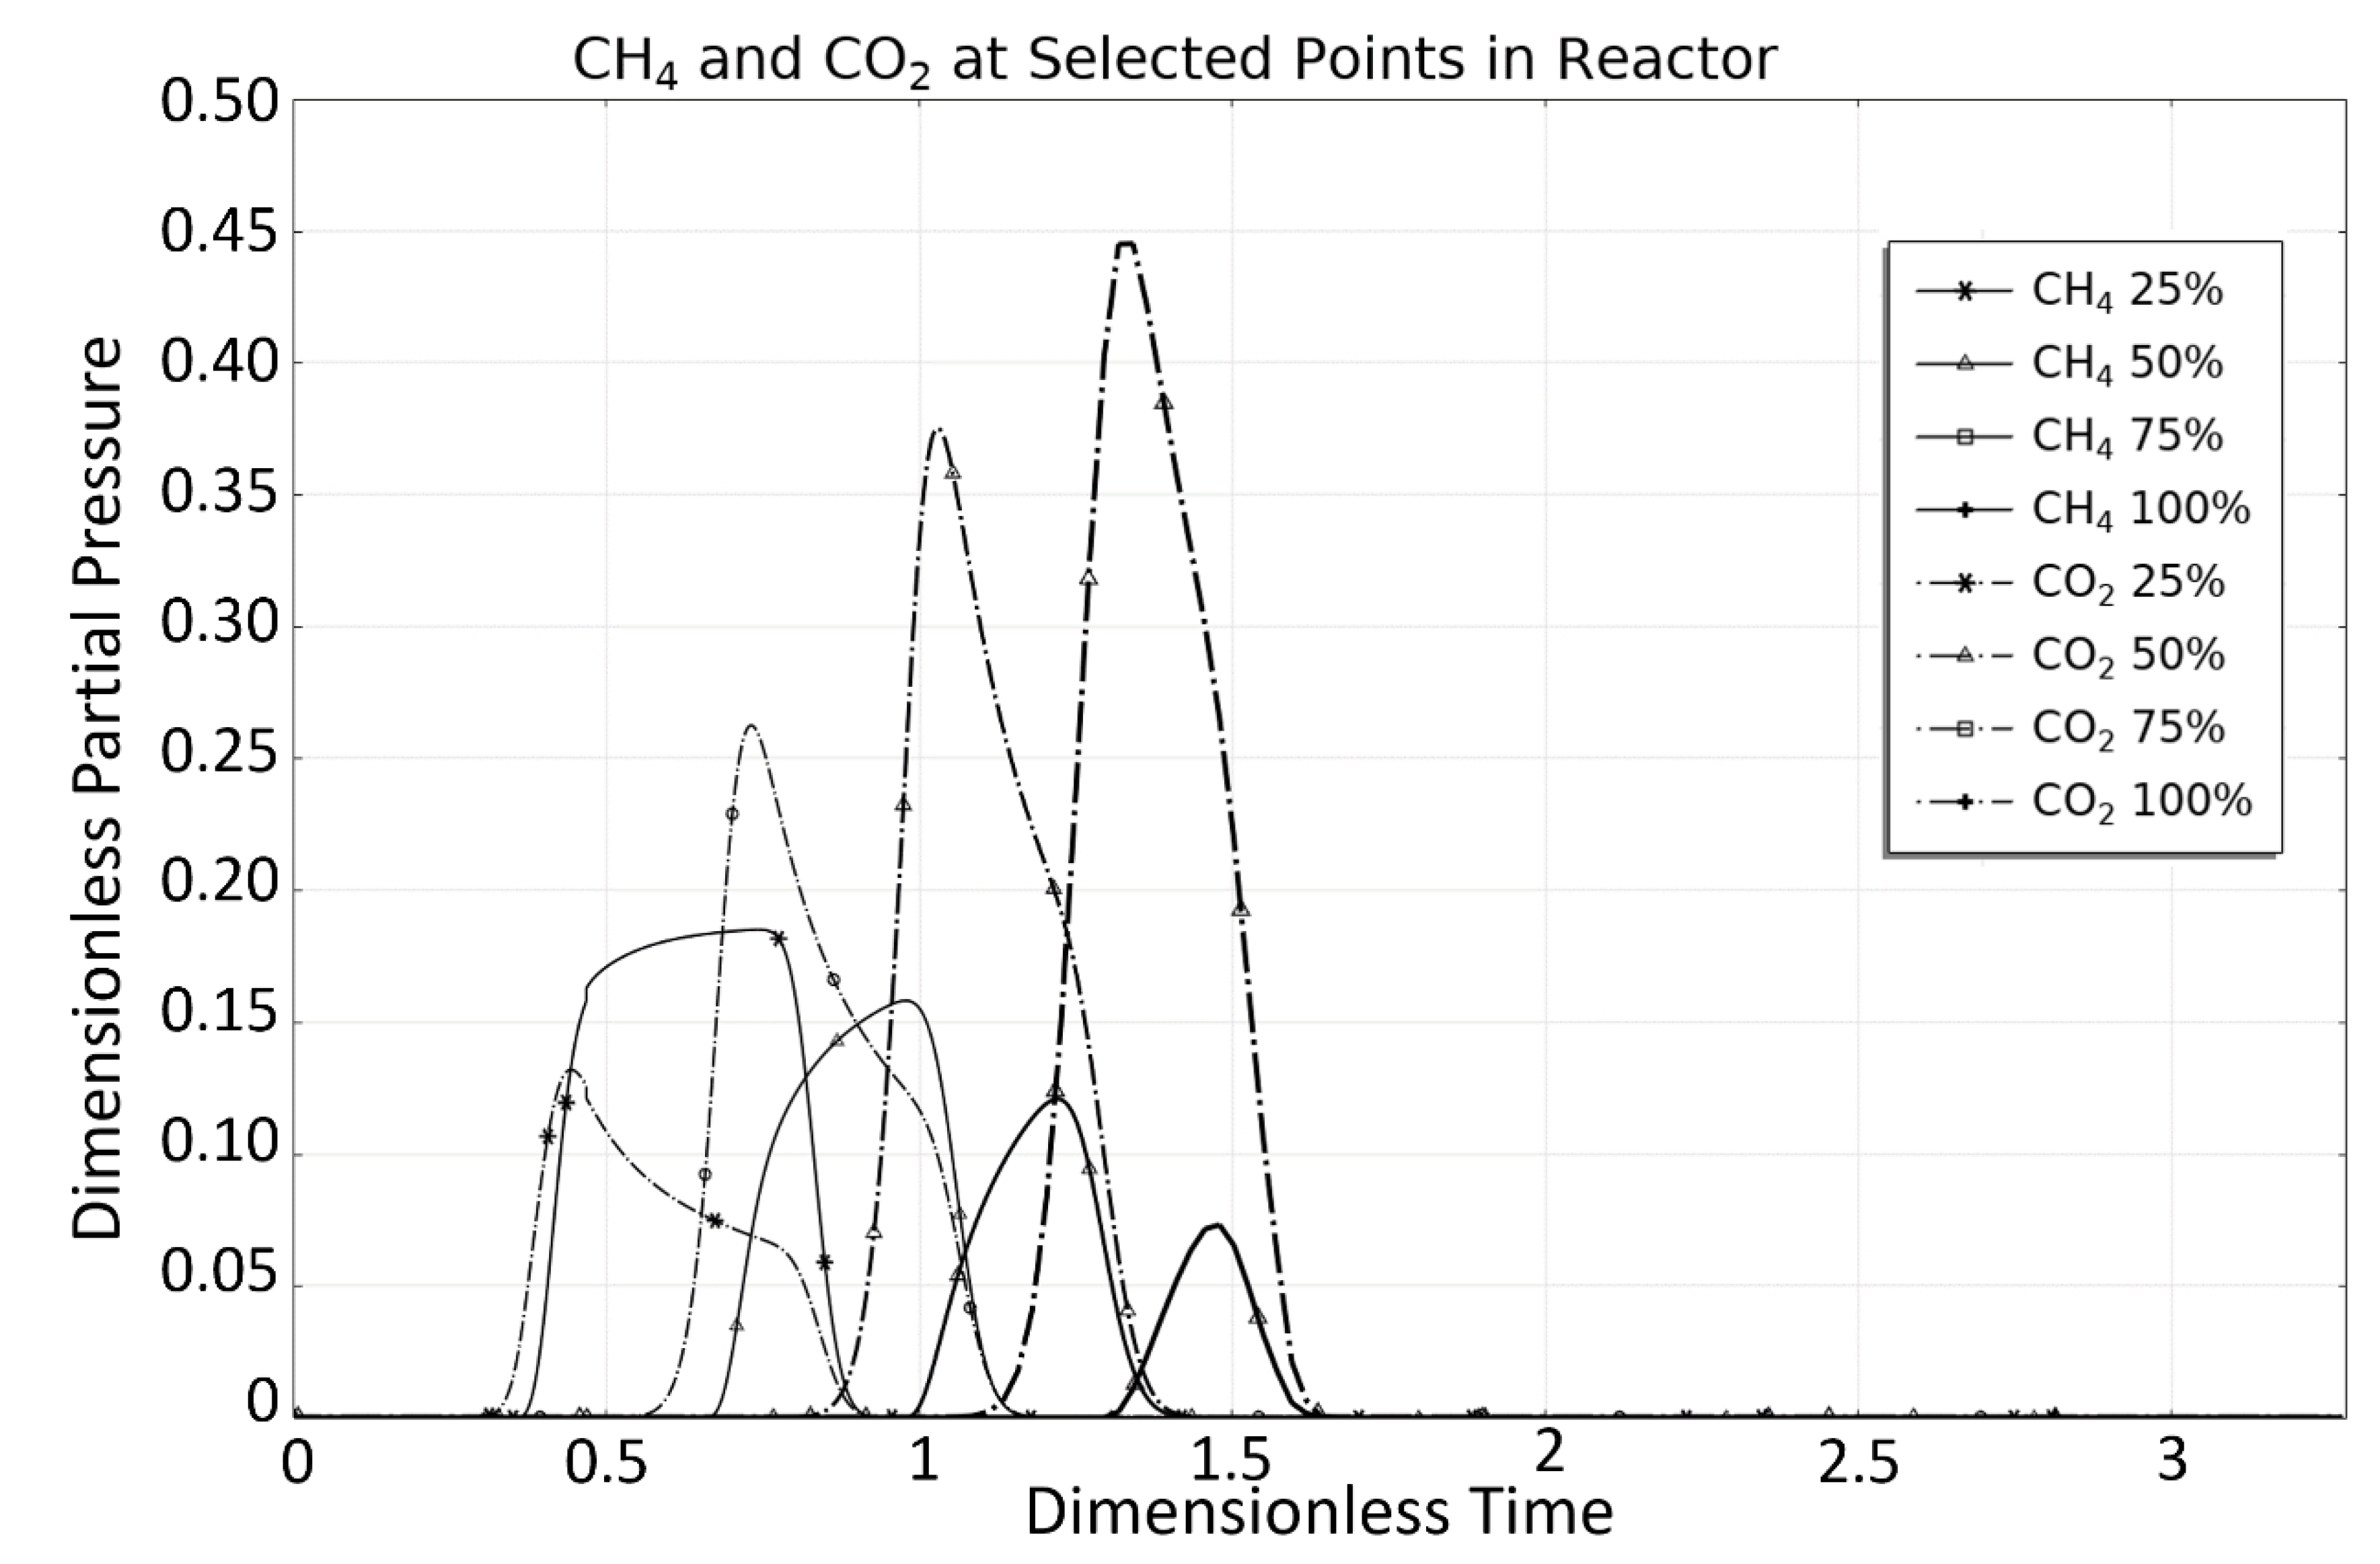
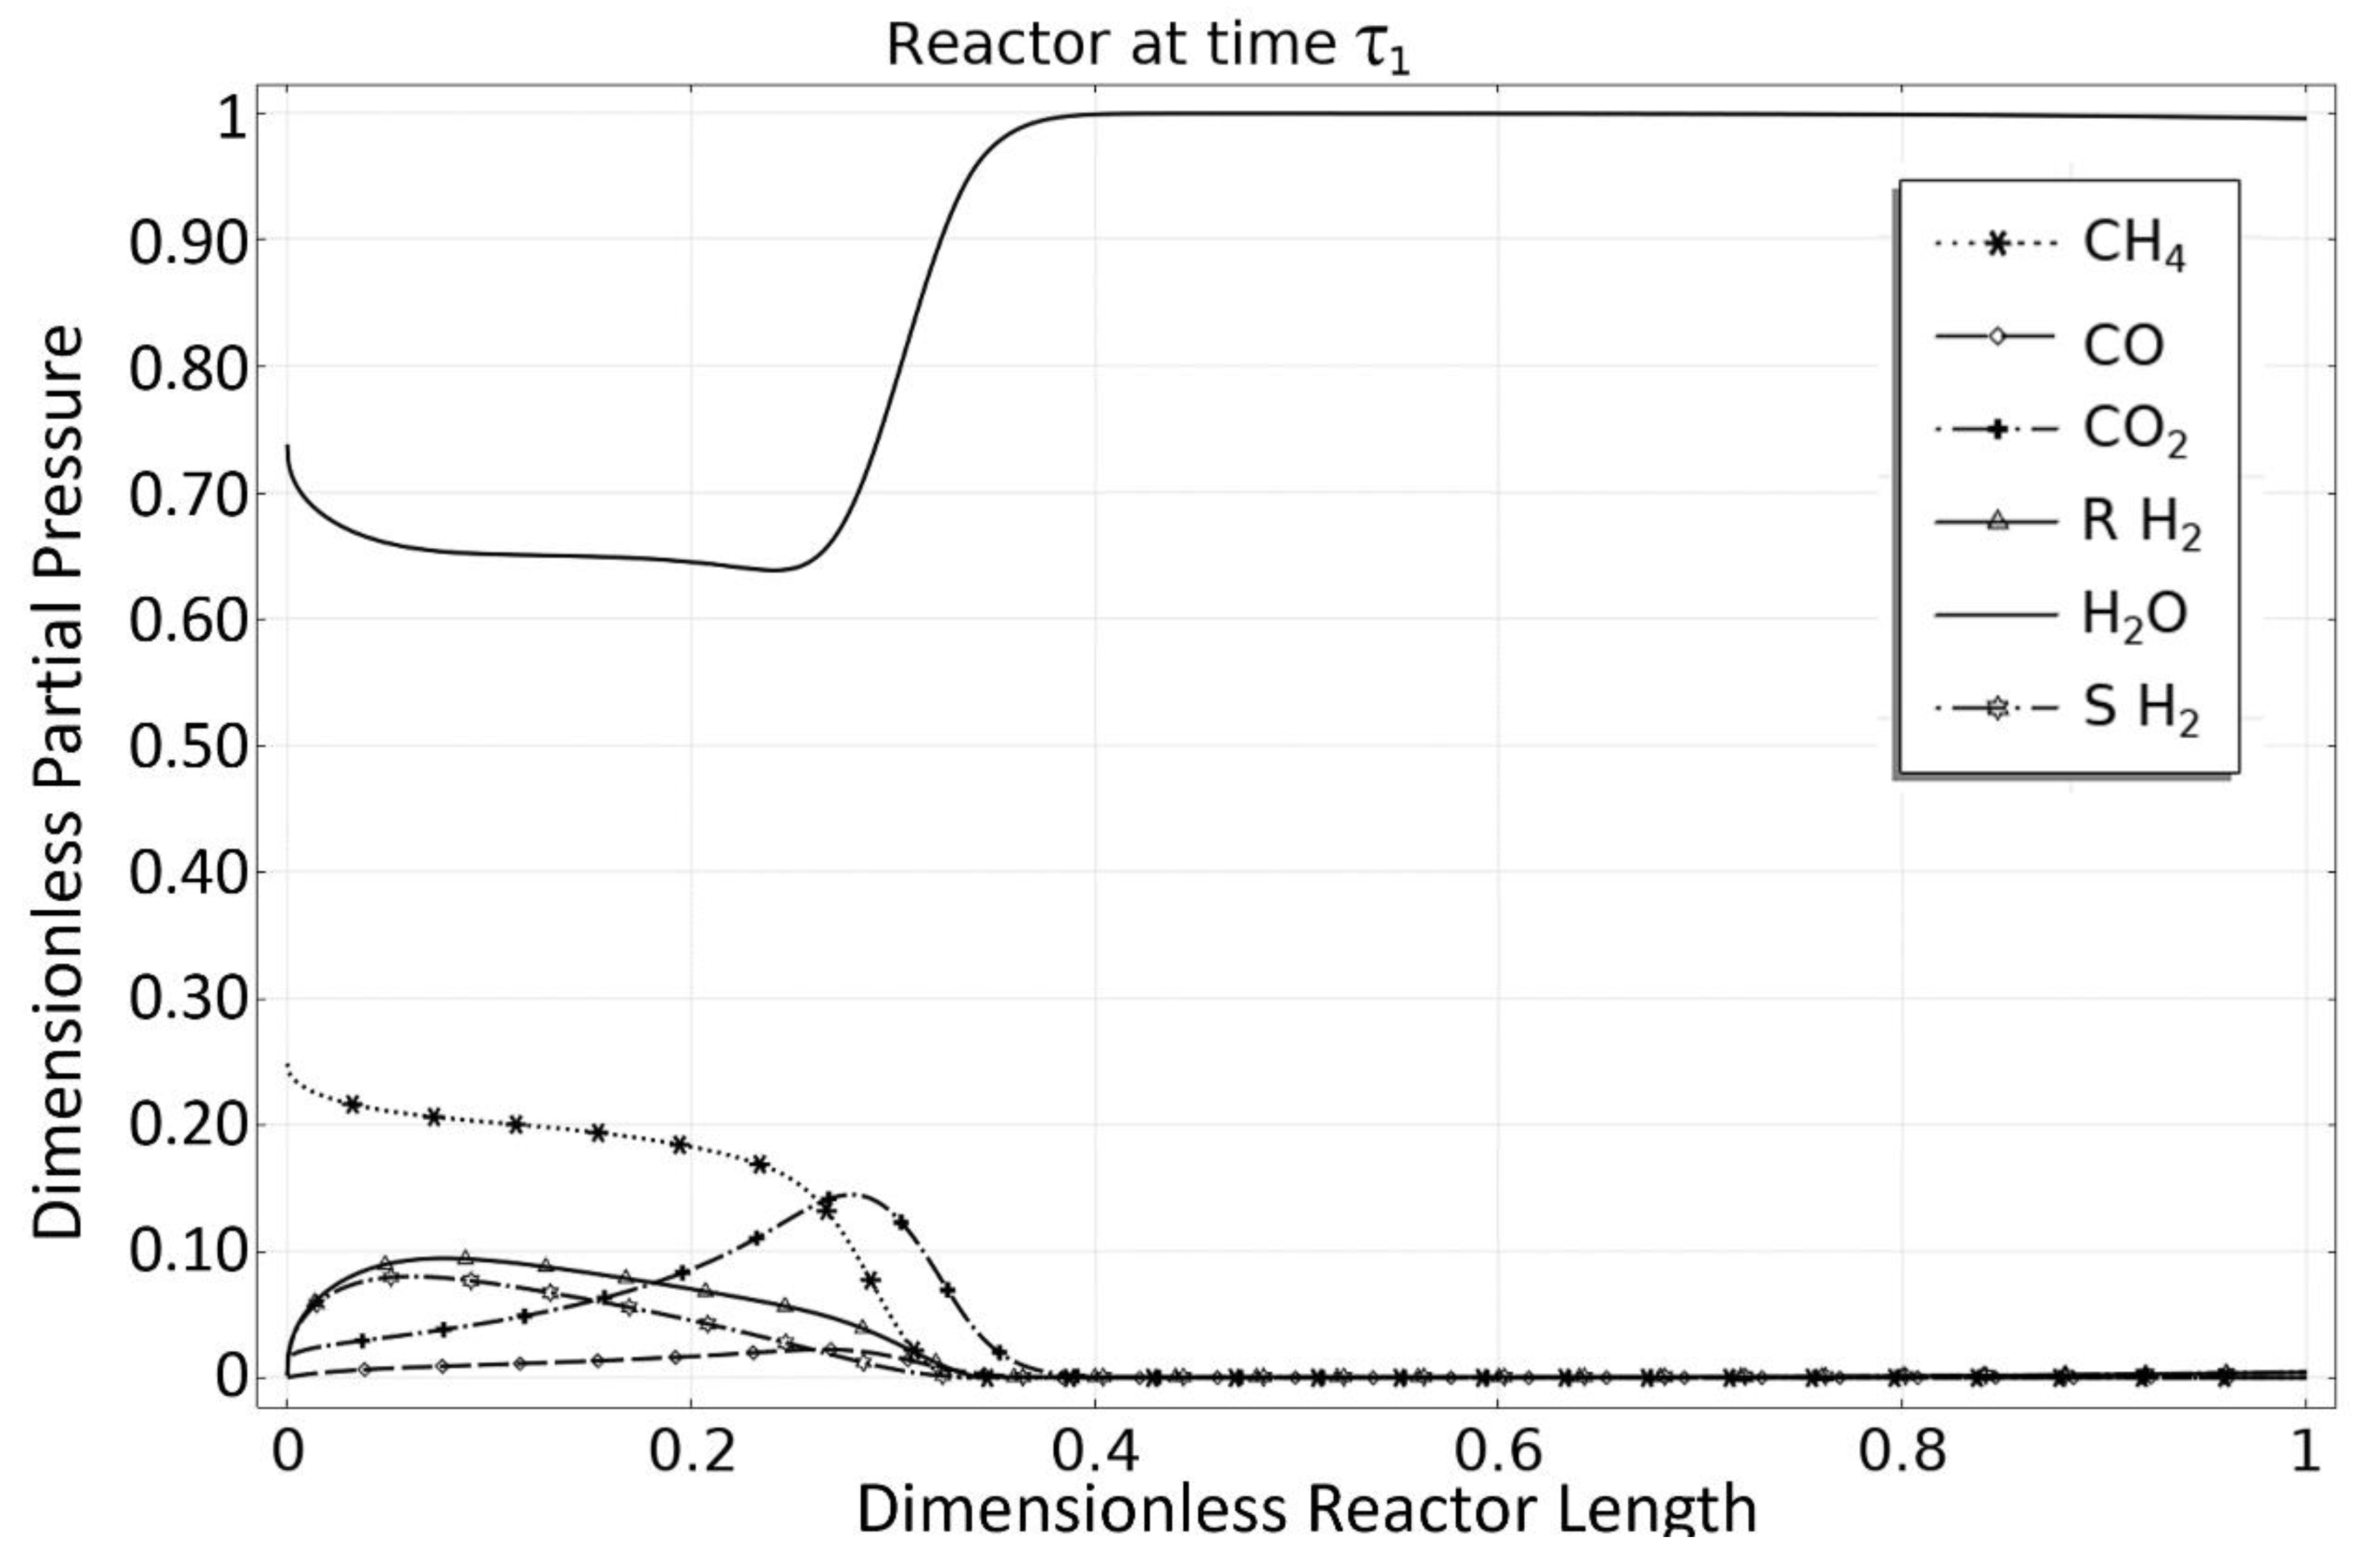
3.1. OM 1: MSR Loading-Reaction/Storage Phase

At the beginning of this OM, phase ( g ) in domain ( v ) is largely composed of steam and minute amounts of hydrogen, phase ( g ) in domain ( s ) only contains hydrogen at a pressure slightly above the partial pressure of hydrogen in ( v ) , and a mixture of methane and steam at a constant flowrate is fed into the MSR. During this OM, the hydrogen that is produced from the SMR reactions taking place begins to permeate into ( s ) as its partial pressure in ( v ) increases above the total pressure of ( s ) . Under isobaric conditions in ( v ) , the outlet flowrate varies, as described in Equation (10). The duration τ 1 of OM 1 is chosen so that a desirable level of limiting reactant conversion is attained. Reactant conversion, as defined by Equation (12), is defined over all three OMs. Typically, however, the limiting reactant is fed to the MSR only during OM 1, whereas any unreacted limiting reactant exits the MSR during OM 1 and OM 2. As discussed below, the duration of OM 2 is fixed and chosen to be equal to the reactor’s OM 2 residence time. Thus, the duration τ 1 of OM 1 is the only degree of freedom that can be chosen so that the amount of unreacted limiting reactant that exits the MSR over τ 1 + τ 2 (i.e., over the duration of OM 1 and OM 2) is acceptably low, compared to the amount of limiting reactant fed to the MSR during OM 1, so that a desirable level of limiting reactant conversion can be attained.

3.2. OM 2: MSR Decarbonization/Maintenance Phase

OM 2 begins at the final conditions of OM 1, and the reactor is then fed pure steam at a constant flowrate. If the reactor is operating under plug flow conditions with no diffusional effects, as is the case here, a sharp steam front is formed that propagates through the reactor and reaches the reactor outlet in time equal to the reactor’s OM 2 residence time. In the reactor section ahead of the steam front, the SMR reaction continues to occur in the void domain, and hydrogen is transported from the void to the storage domain. Behind the steam front hydrogen is transported from the storage to the void domain. Thus, under plug flow conditions, the duration τ 2 of OM 2 is chosen to be equal to the reactor’s OM 2 residence time, because at that time complete reactor decarbonization has been attained. (If dispersion was to be present in the reactor, the steam front would not be as sharp. In that case, the duration τ 2 of OM 2 may need to be chosen to be greater than the reactor’s OM 2 residence time for the desired level of reactor decarbonization to take place).

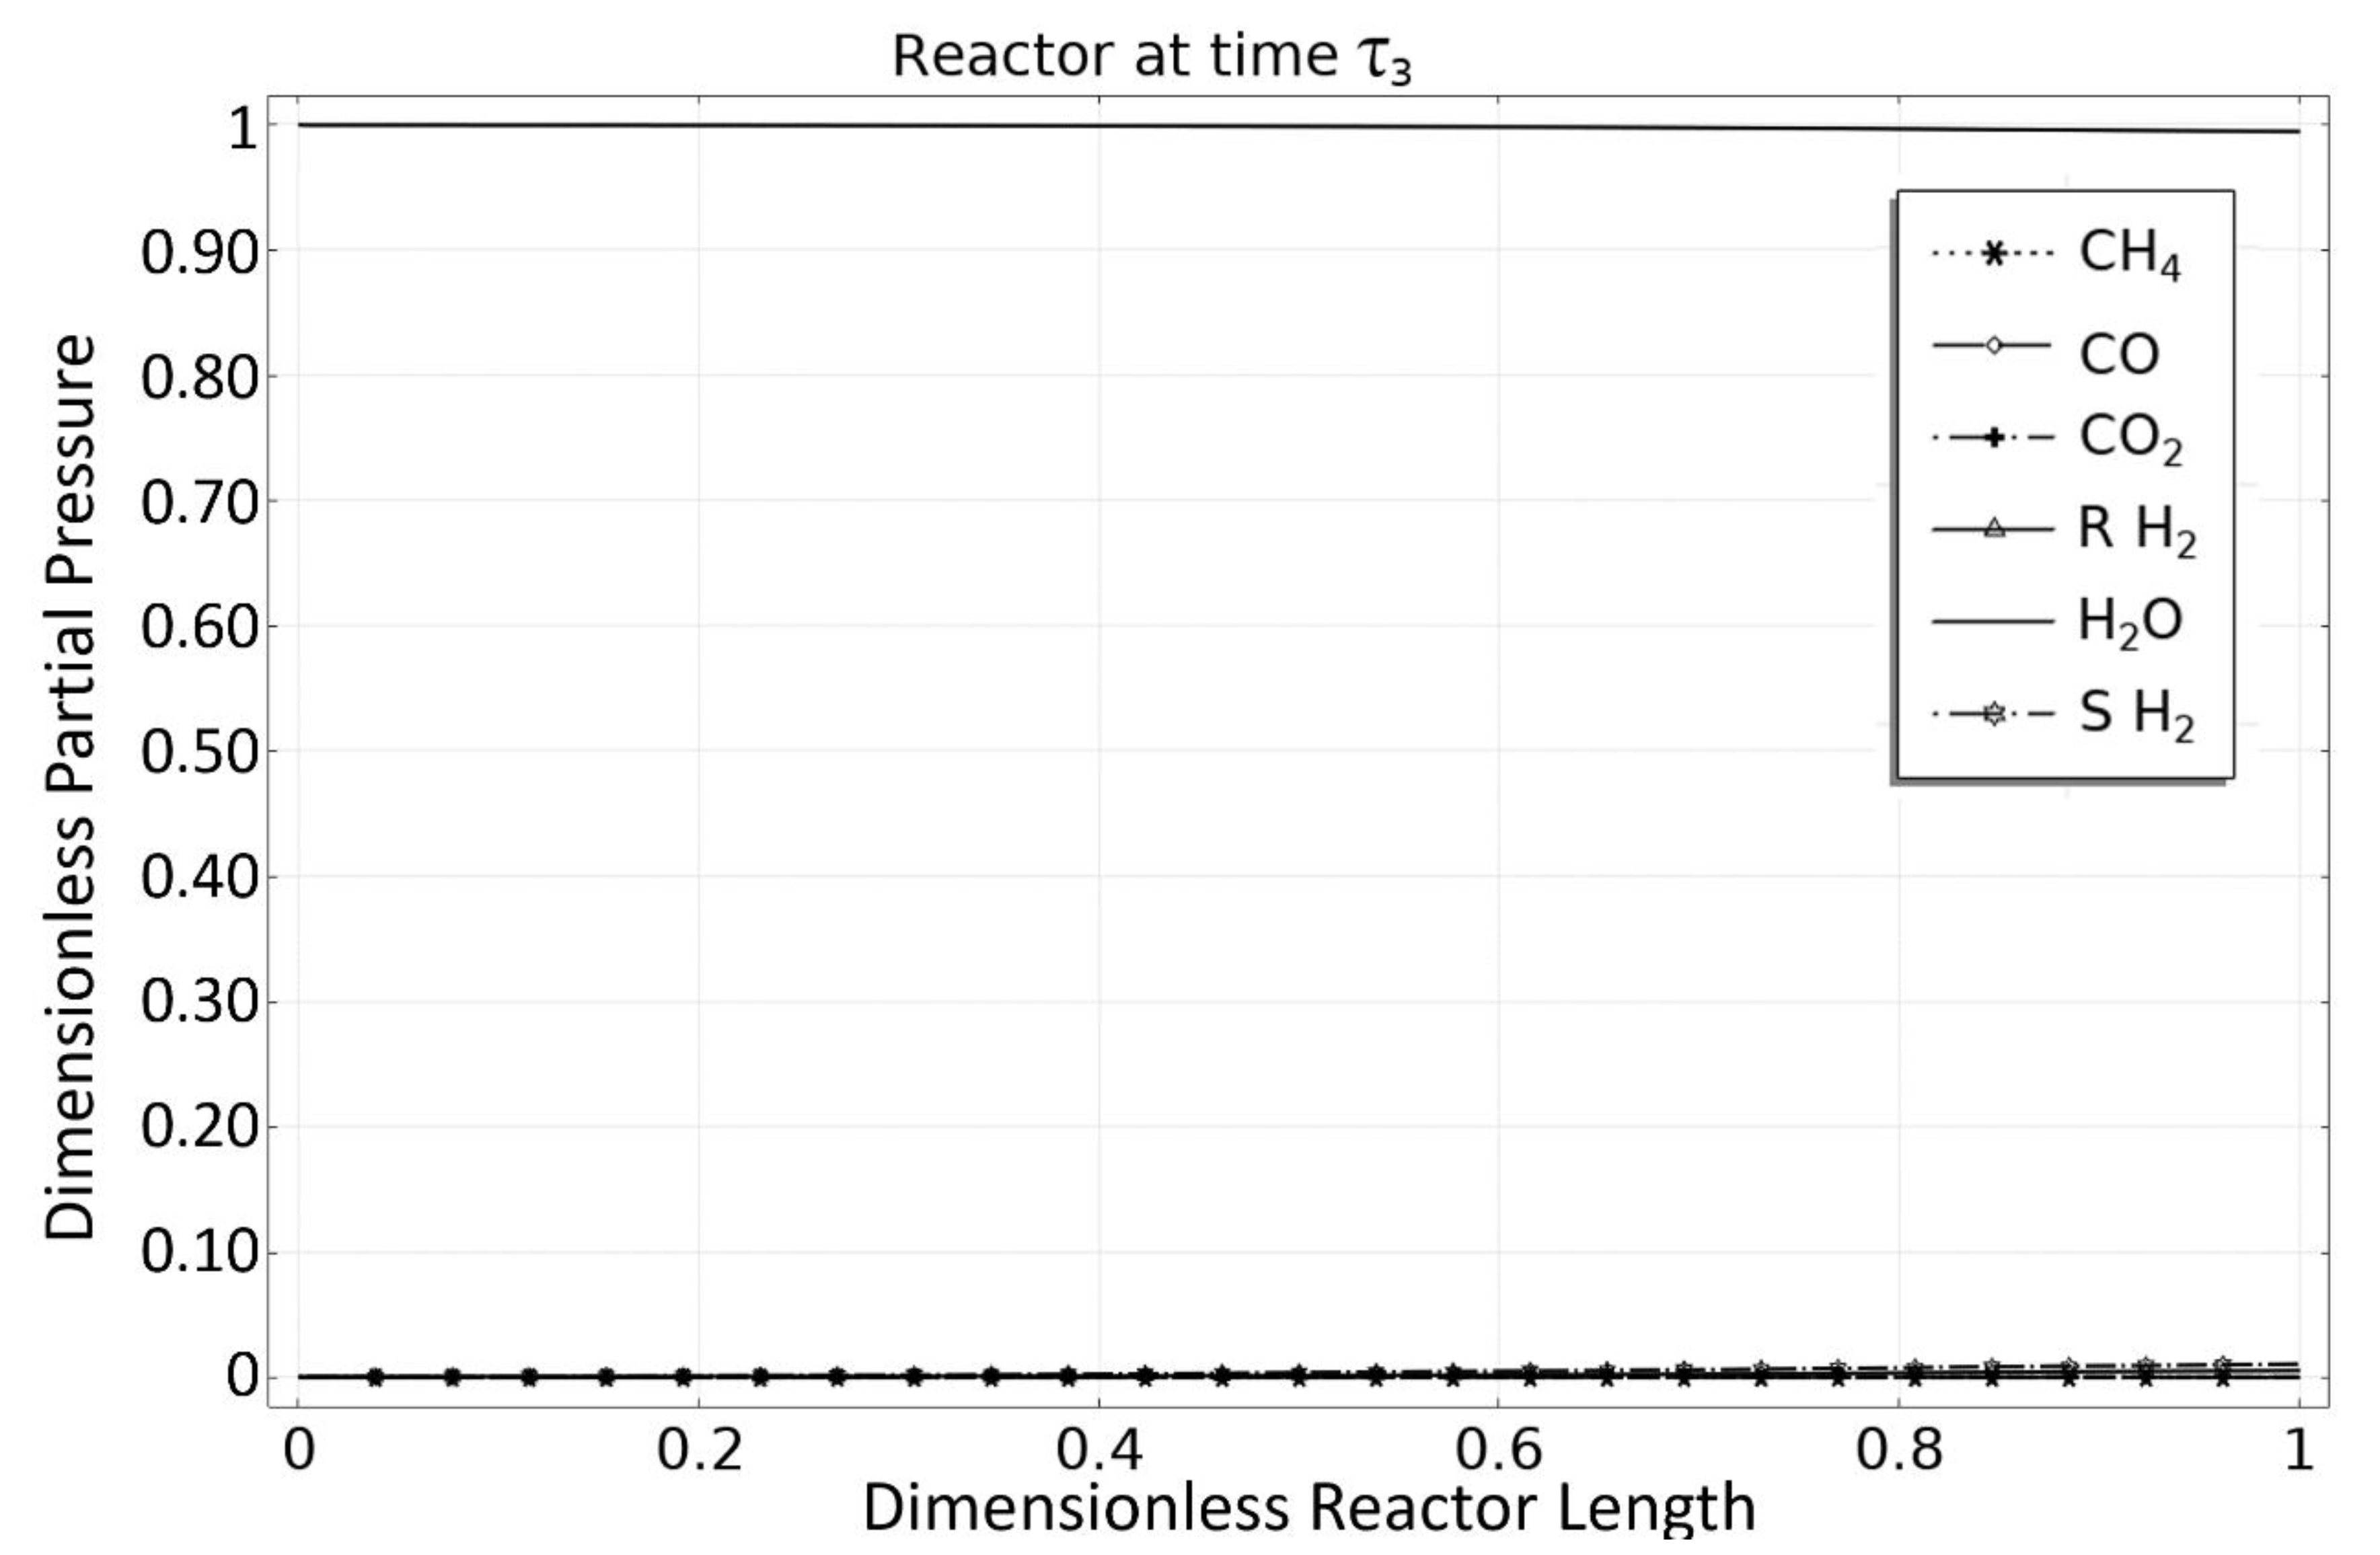
3.3. Phase 3: MSR Unloading-Production/Emptying Phase

Similarly, OM 3 begins at the final conditions of OM 2, and the reactor is again fed pure steam at a constant flowrate. This action empties the contents of ( s ) back into ( v ) , generating a mixture of readily separable, high-pressure hydrogen and steam as the SMR-MSR product. The duration τ 3 of OM 3 is chosen so that the hydrogen in the domains ( v ) , ( s ) is below a desirable low level.
To compare the performance of the SMR-MSR under PPSO with that of a traditional SMR-SSR, we utilized the process performance metrics defined by Equations (12)–(16) for the SMR case study. To this end, identifying methane as our limiting reactant, Equation (12) becomes:
X C H 4 = [ 0 k = 1 N O M τ ¯ k F ¯ C H 4 , g v ( t ¯ , 0 ) d t ¯ 0 k = 1 N O M τ ¯ k F ¯ C H 4 , g v ( t ¯ , 1 ) d t ¯ ] 0 k = 1 N O M τ ¯ k F ¯ C H 4 , g v ( t ¯ , 0 ) d t ¯
Similarly, Equations (13)–(16) can be expressed for all products (carbon monoxide, carbon dioxide, and hydrogen), and are listed below for hydrogen.
ω H 2 , 1 [ 0 τ ¯ 1 F ¯ H 2 , g v ( t ¯ , 1 ) d t ¯ 0 τ ¯ 1 F ¯ H 2 , g v ( t ¯ , 0 ) d t ¯ ] 0 k = 1 N O M τ ¯ k F ¯ C H 4 , g v ( t ¯ , 0 ) d t ¯  
Ω H 2 = [ 0 k = 1 N O M τ ¯ k F ¯ H 2 , g v ( t ¯ , 1 ) d t ¯ 0 k = 1 N O M τ ¯ k F ¯ H 2 , g v ( t ¯ , 0 ) d t ¯ ] 0 k = 1 N O M τ ¯ k F ¯ C H 4 , g v ( t ¯ , 0 ) d t ¯  
R H 2 , 3 = ω H 2 , 3 Ω H 2 = [ τ ¯ 1 + τ ¯ 2 τ ¯ 1 + τ ¯ 2 + τ ¯ 3 F ¯ H 2 , g v ( t ¯ , 1 ) d t ¯ τ ¯ 1 + τ ¯ 2 τ ¯ 1 + τ ¯ 2 + τ ¯ 3 F ¯ H 2 , g v ( t ¯ , 0 ) d t ¯ ] [ 0 τ ¯ 1 + τ ¯ 2 + τ ¯ 3 F ¯ H 2 , g v ( t ¯ , 1 ) d t ¯ 0 τ ¯ 1 + τ ¯ 2 + τ ¯ 3 F ¯ H 2 , g v ( t ¯ , 0 ) d t ¯ ]  
Equation (24) captures the H2 molar production ratio in OM 1 over the total amount of methane fed. Equation (25) describes the hydrogen yield over all three OMs, i.e., the total moles of hydrogen produced divided by the moles of methane fed to the reactor. Lastly, Equation (26) is used to calculate the hydrogen recovery ratio during the 3rd OM, which is of importance because it quantifies how much hydrogen is produced in readily purifiable form.
To determine the time duration τ ¯ 1 , τ ¯ 2 , and τ ¯ 3 for the three OMs, a criterion for terminating each OM must be selected. The reactor contents at the beginning of OM 1 consist largely of steam, while the reactor feed at that time switches to an appropriately chosen methane steam mixture, which in turn leads to a methane front propagating through the reactor. Thus, at each fixed reactor location, methane partial pressure initially increases, reaches a maximum value, and then decreases as the reactor feed is switched to steam at the beginning of OM 2. The maximum methane partial pressure attained becomes ever lower at downstream reactor length locations. With this behavior in mind, our selection τ ¯ 1 for the duration of OM 1 will be related to the conversion (utilization) of the raw material (methane).
The duration τ ¯ 2 of OM 2 is selected to be equal to the OM 2 residence time, ensuring that the dimensionless pressure of all carbon-containing gas phase components in the domain will be zero, as will be the level of carbon impurities in the hydrogen product generated during OM 3. Similarly, the duration of OM 3 is selected as the time τ ¯ 3 at which the dimensionless partial pressure of hydrogen in domain ( v ) at the reactor exit falls below a set value, e.g., P ¯ H 2 , g v ( τ ¯ 1 + τ ¯ 2 + τ ¯ 3 , 1 ) 0.01 , which ensures that most of the hydrogen in both domains ( v ) and ( s ) has been removed and thus the reactor is largely filled with unreacting steam.
Simulation of the dimensionless Equation (10) of the MSR model requires that a number of model parameters first be specified. It is considered that the reactor pressure and temperature are P = 25   b a r and T = 900 K , respectively, and the MSR feed at the beginning of OM 1 contains steam and methane at a molar ratio of 3, and minute amounts of all other species. Knowledge of these parameters enables the computation of the reference reaction generation rate r using Equation (19), and expression of the dimensionless reaction rates R ¯ 1 , R ¯ 2 , R ¯ 3 in terms of the dimensionless species pressures, using Equations (20)–(22). Selection of the storage domain, catalyst domain, and gas phase in storage domain volume fractions as ε s = 0.5 ,   ε c = 0.35 ,   ε g s = 0.495 , respectively, of the effectiveness factor as η = 0.5 , and of the gas permeance ratios for all species (the first species being hydrogen) as β j / β 1 = { 0   i f   j 1 1   i f   j = 1 } , enables the simulation of dimensionless Equation (10) of the MSR model as long as the values of the parameters D a ,   Θ ,   τ ¯ 1 ,   τ ¯ 2 ,   τ ¯ 3 are known.
In this work, assessment of SMR-MSR performance was performed by carrying out sixteen combinations (trials) of the above five parameters, as listed in Table 3 below. The values for D a and Θ were chosen by selecting a range of reasonable values for the parameters shown in Equation (8). Fixing the operating pressure P = 25 ( b a r ) , temperature T = 900 ( K ) , catalyst density ρ c = 2355.2 ( k g m 3 ) [14], and reference reaction rate r r 1 ( { ( P i , g v ( 0 , 0 ) ) R T } i = 1 N C , T ) = 13.606 ( m o l k g s ) , leaves residence time t ( s ) as the only free parameter for calculation of D a . Because of the rapid rate at which the SMR reactions attain equilibrium, the range of considered residence times was 0.01 t ( s ) 0.5 , so that the concentration profiles along the reactor do not immediately reach equilibrium. The resulting D a range is 1 D a 6 . Given the above range of residence times 0.01 t ( s ) 0.5 , and pressure P = 25 ( b a r ) , temperature T = 900 ( K ) values, evaluation of a range for Θ requires range information for the species membrane permeance β i ( m o l   i P a ( m 2   v o i d s t o r a g e   i n t e r f a c e ) s ) and the storage-void interfacial area per unit volume of reactor α s , v ( m 2   s t o r a g e v o i d   i n t e r f a c e m 3   s y s t e m   r ) . The β 1 range is 1.05 10 8 β 1 1.21 10 6 for hydrogen [23,33], and the α s , v range is selected so that the resulting Θ range is 1 Θ 50 .
Each trial was simulated in COMSOL for three cycles of operation in order to ensure that dynamic operation had reached its long-term periodic behavior. COMSOL implementation of the alternating feed compositions for each OM was carried out by approximating for each OM an OM-specific Heaviside function h k with an OM-specific Verhulst function, W k , as shown in Equation (27) below:
h k ( t ¯ ) = { 0 ,   if   ( t ¯ k = 0 k 1 τ ¯ k < 0 )   [ 0 , 1 ] ,   if   ( t ¯ k = 0 k 1 τ ¯ k = 0 )   1 ,   if   ( t ¯ k = 0 k 1 τ ¯ k > 0 ) } W k ( t ¯ ) = 1 1 + exp ( a ( t ¯ k = 0 k 1 τ ¯ k ) + a c ) ,   k = 1 , N O M
Figure 2 below illustrates the dynamic behavior of the methane inlet partial pressure at the reactor inlet as a function of dimensionless time, considering τ ¯ 1 = τ ¯ 2 = τ ¯ 3 = 5 , a = 1 and c = 8.5 .
In Figure 3 the time evolution of all species’ (except, of course, for the hydrogen in the storage domain) dimensionless partial pressures at the reactor inlet is shown, over three operating cycles. It is assumed that the conditions at the inlet of the reactor at the beginning of OM 1 is the same as its condition at the end of OM 3. During OM 1, the reactor’s feed consists mainly of steam and methane, at a 3:1 steam/methane ratio, and trace amounts of carbon monoxide and carbon dioxide. During OM 2 and OM 3 the reactor’s feed consists only of steam. Similarly, Figure 4 shows the time evolution of species dimensionless partial pressures at the outlet of the reactor through the same three cycles of operation. Because the reactor’s condition at the beginning of OM 1 is the same as its condition at the end of OM 3, at early operational times the reactor outlet consists mainly of steam. As the reaction proceeds, a mixture of methane, carbon dioxide, and carbon monoxide begins to exit the reactor. The hydrogen in the void domain continues to rise until it reaches its peak, which coincides with the end of OM 2.
Figure 5 shows the time evolution of the dimensionless partial pressure of hydrogen in the void and storage (represented by R H2 and S H2) domains, during the last cycle of operation, at four different reactor locations (25%, 50%, 75%, and 100% of the total reactor length), and Figure 6 shows the dimensionless partial pressures of methane and carbon dioxide in the void domain, during the last cycle of operation, at the same four reactor locations. In Figure 5 it can be seen that at the 25% length location the hydrogen concentration in the void domain is initially practically zero; then, as methane reacts to generate hydrogen, it increases, first rapidly and then less so as it begins to transport into the storage domain; finally, the concentration decreases as steam is fed into the reactor. The same behavior is observed at larger lengths.
In Figure 6, at the 25% reactor length location during the last cycle of operation, the methane and carbon dioxide concentrations are shown to first increase, reach a maximum, and then decrease, in correspondence with the composition changes at the inlet of the reactor shown in Figure 3. The methane (carbon dioxide) maximum occurs at the latter (earlier) part of a plateau-like region in time. At points further down the reactor (50%, 75%, and 100% of the reactor length), the methane (carbon dioxide) pulse exhibits a progressively lower (higher) maximum, which is indicative of its role as a reactant (product) in the reaction that takes place. The magnitude of the methane pulse remains larger than that of the carbon dioxide pulse until it reaches the end of the reactor. In the Supplementary Materials section, Figures S1–S3 (Figures S4–S6) show the dimensionless pressure profiles for all species vs. time for three reactor locations (25%, 50%, and 75% of the reactor length), for the last cycle of the 7th (13th) trial D a = 2 ,   Θ = 10 ( D a = 4 ,   Θ = 50 ), which are qualitatively similar to the behavior shown in in Figure 4 and Figure 5 above.
Figure 7, Figure 8 and Figure 9 show the dimensionless partial pressure profiles for all species along the length of the reactor at the end of OM 1, OM 2, and OM 3, respectively, for the 7th trial D a = 2 ,   Θ = 10 . In these simulations we selected the end of OM 1 to be when P ¯ C H 4 , g v | z ¯ = 0.3 = 0.05 occurs for an operating time for the first OM of τ ¯ 1 = 0.566. From Figure 7 one observes that the contents of the reactor void domain up to point ( z = 0.3 ) contain a mixture of reforming products, whereas at larger reactor lengths there exists only water, validating that the reactor is operating in plug flow and that no species diffusion has occurred down the reactor. From the reactor inlet ( z = 0 ) to ( z = 0.3 ) , the dimensionless partial pressure of the hydrogen in the storage shows a marked difference from the dimensionless partial pressure of hydrogen in the reactor void, which highlights the time-dependent nature of the process. As seen later in the analysis of the influence of the parameter Θ, reducing this difference during early operational times correlates to higher conversion and better overall reactor performance. Figure 8 and Figure 9 show the corresponding profiles at the end of OM 2 with τ ¯ 2 = 1.00, and at the end of OM 3 with τ ¯ 3 = 2.51, respectively. From Figure 8 one sees that at the end of OM 2 the reactor void contains a mixture of steam and hydrogen only, and that hydrogen has been successfully transferred to and stored in the storage domain. From Figure 9 one sees that, at the end of a cycle of operation, the reactor has returned to its initial state of operation, with the reactor void being filled with only steam and the contents of the storage medium having been emptied.
With the operating times for each OM set, it is now possible to calculate the metrics as described by Equations (23)–(26). These are shown for the different cases studied in Table 4. The SMR-MSR shows higher overall conversion than the traditional SMR-SSR for all cases studied. In addition, the SMR-MSR enables the in situ separation of the hydrogen product, which is a distinct advantage over the traditional SMR-SSR that requires an additional downstream separation step. For the design parameters employed in trial 7 (Da = 2, Θ = 10) for which the SMR-MSR behavior has been described in detail above, the SMR-MSR exhibits a 116% increase in methane conversion over the SMR-SSR from 0.2564 to 0.5553. Additionally, the hydrogen recovery is 83%, indicating that a significant portion of the total generated hydrogen exits the reactor during OM 3 in the form of ultra-high purity (UHP) hydrogen. For the case studies conducted here (see Table 4), a maximum increase in methane conversion of 235% was observed, indicating the significant benefit that can be gained by appropriately selecting design parameters. The substantial increases in conversion are accompanied by simultaneous significant gains in hydrogen yield. The hydrogen recovery ratios reported in Table 4 are comparatively higher than those by similar membrane reactors operating at steady state [34]. These high SMR-MSR metric values suggest that the SMR-MSR outperforms the SMR-SSR, and that the SMR-MSR operating at the selected temperature T = 900   K (which is lower than the temperatures traditionally used in SMR [35]), may be economically viable and realizable [36].
The effect of Θ (the inverse Peclet number) on reactor performance is also shown in Table 3 (operational times) and 4 (performance metrics), with an increase in all metrics shown for increasing Θ. The cases with the lowest Θ value (Θ = 1) studied are characterized by minimal increases in methane conversion and hydrogen yield over their traditional reactor counterparts, and low recovery ratios, suggesting a lower limit threshold of Θ > 1 for desirable SMR-SSR performance. For a constant value of Da (and thus a constant value of the SMR-MSR dimensionless residence time), as Θ increases, the operating time τ ¯ 1 in OM 1 can be increased, because reactor conversion then increases as Θ increases and it takes a longer time for the unreacted methane to reach the outlet of the reactor in substantial amounts. In contrast, operational times τ ¯ 3 in OM 3 decrease upon increase in Θ for each fixed Da. These beneficial changes in OM duration times, coupled with the increase in the hydrogen recovery ratio as Θ increases (for fixed value of Da), suggest that Θ should be increased as much as possible in order to achieve desirable reactor performance.
Figure 10, Figure 11, Figure 12 and Figure 13 show corresponding results for the 13th trial (Da = 4 and Θ = 50). Figure 10 shows the time evolution of the dimensionless partial pressure for the various species at the outlet of the reactor through three cycles of operation. Figure 11 shows the time evolution of the dimensionless hydrogen partial pressure in the void and storage domains during the last cycle of operation at four locations in the reactor (25%, 50%, 75%, and 100% of the total reactor length). Figure 12 shows the time evolution of dimensionless partial pressures for methane and carbon dioxide in the void domain during the last cycle of operation at the same four reactor locations. Figure 13 shows the dimensionless partial pressure profiles for all species along the length of the reactor during cycle 3 at the end of OM 1. Figures S4–S6 in the Supplementary Materials show the dimensionless partial pressure for all species during the last cycle of operation at different locations in the reactor (at a position equal to 25%, 50%, and 75% of the reactor length, respectively).
Comparing Figure 10 with Figure 4, we observe a large increase (decrease) in the amount of carbon dioxide (methane) exiting the reactor. Figure 5 and Figure 11 show similar patterns of behavior for hydrogen in the reactor and storage void domains, with the hydrogen in the storage medium exhibiting a noticeably shorter response time in Figure 11. This is attributed to the higher Θ value, which allows the hydrogen to be more easily transferred between domains. Comparing Figure 6 and Figure 12, we see a dramatic change in the behavior for both methane and carbon dioxide. In Figure 6, the methane waveform retains its three distinct phases through all measured points, and is also always greater in magnitude until the exit of the reactor. This is not the case for Da = 4 and Θ = 50, where the magnitude of the carbon dioxide pulse becomes greater than that of the methane pulse at the 50% location. This behavior is also seen in Figures S4–S6, which show (for the case with Da = 4 and Θ = 50) the dimensionless partial pressures for all species during the last cycle of operation at locations equal to 25%, 50%, and 75% of reactor length, respectively. This is particularly highlighted in Figure 13, which shows the species profiles in the reactor at the end of OM 1. When compared with Figure 7, it can also be seen in Figure 13 that the dimensionless partial pressures of hydrogen in the storage and reactor void are much closer in value, indicating a much higher rate of transfer of separated hydrogen.
From a process design and operational perspective, there are several parameters that can be adjusted to alter Da and Θ. For a fixed inlet composition at the beginning of OM 1, the Da can be increased (decreased) by increasing (decreasing) the reactor’s residence time, which in turn can be achieved by increasing (decreasing) the reactor’s length and/or by decreasing (increasing) the reactor’s residence time. The dimensionless parameter Θ can be increased (decreased) by increasing (decreasing) the residence time, storage-void domain interfacial area and hydrogen permeance, and/or by decreasing (increasing) the void domain volume fraction. Θ can be altered even while keeping the Da fixed, by altering the last three aforementioned design parameters. In particular, increasing the preferential hydrogen permeance through the storage medium’s permselective layer will increase Θ and can be accomplished through appropriate selection of the layer’s pore structure and material properties.

4. Conclusions

In this work, a novel, first principle-based, spatially dependent model capturing the membrane storage reactor behavior was presented and simulated. This novel intensified process, termed the MSR, is capable of overcoming operational limitations of traditional reactor design by combining multiple mass transport processes into a single unit, and increases the production rate through dynamic operation. The resulting desired products are delivered at high pressure and in readily separable form, which leads to additional energetic and operational cost saving. The assessment of MSR behavior was described by a one-dimensional dynamic model which, when cast in dimensionless form, revealed two dimensionless parameters, D a (the Damkohler number) and Θ = 1 / P e m e m (the inverse Peclet number), that capture MSR behavior. Performance analysis of the MSR process was undertaken by introducing a number of metrics, and a case study on Steam Methane Reforming for the production of hydrogen was subsequently carried out. Numerous simulations of the developed spatially dependent dynamic model enabled parametric studies of the effect of the aforementioned D a and Θ = 1 / P e m e m dimensionless groups, and established that maximizing both groups leads to improved MSR performance. A comparative analysis between SMR-MSR and SSR showed that the SMR-MSR process obtained a higher methane conversion, X C H 4 , and a greater yield of hydrogen, Ω H 2 . It was also shown that the SMR-MSR hydrogen recovery ratio, R H 2 , 3 , was comparable to or above those obtained by currently investigated membrane technologies.
There are several notable advantages of the proposed MSR process, the first being its ability to be modularized and to accommodate a variety of economic production scales. Although the current case study emphasized application to hydrogen production for use at the level of a refinery or a large plant, smaller scales of production are also quite feasible. The MSR process can conceivably be applied to hydrogen-fueling stations so as to facilitate the creation of sustainable decentralized hydrogen generation. Additionally, implementation of the MSR process into existing plants would help reduce many of the economic barriers faced by industrial operations when converting to new technology. Using SMR as an example, retrofitting of an existing plant would consist mainly of reactor repacking with catalyst and storage media. Because of the need for the MSR process to direct material flow, it is imagined that additional fluid lines (for both feed and effluent) need to be constructed. This additional cost, however, is not expected to be large, especially when considering that no additional exogenous chemical components are required. Additional component cost from MSR implementation can also be expected from the need to incorporate dynamic control equipment because, as noted earlier, most industrial reactors operate at steady state. All of this suggests that the MSR process has the potential to overcome many of the barriers that hinder many potential process intensification technologies and be implemented at an industrial scale.
The presented one-dimensional dynamic model was used to demonstrate the novel MSR concept. Because the MSR process is shown to offer significant performance advantages, future work will attempt to rigorously quantify energetic savings by incorporating energy balances into the MSR model. Additionally, development of a MSR model that can capture multi-scale effects and help quantify storage media structural parameters will be investigated.

Supplementary Materials

The following are available online at https://www.mdpi.com/article/10.3390/separations8110195/s1, Figure S1: All Species 25% Reactor Length, Figure S2: All Species 50% Reactor Length, Figure S3: All Species 75% Reactor Length, Figure S4: All Species 25% Reactor Length, Figure S5: All Species 50% Reactor Length, Figure S6: All Species 75% Reactor Length.

Author Contributions

Conceptualization, V.I.M.; Formal analysis, T.T. and V.I.M.; Funding acquisition, V.I.M.; Methodology, V.I.M.; Project administration, V.I.M.; Software, J.L.III; Supervision, V.I.M.; Validation, T.T.; Writing–original draft, V.I.M.; Writing–review & editing, T.T. All authors have read and agreed to the published version of the manuscript.

Funding

Financial support from the American Chemical Society Petroleum Research Fund under award #57511-ND9 titled “A Novel Pressure Swing Steam Reforming Reactor” is gratefully acknowledged.

Conflicts of Interest

The authors declare no conflict of interest.

Nomenclature

English Symbols
a Verhulst function parameter.
A r ( m 2 ) Reactor cross section area
c Verhulst function parameter.
c i , g v ( m o l   i   i n   g   o f   v m 3   g   o f   v ) ,   c i , g s ( m o l   i   i n   g   o f   s m 3   g   o f   s ) i t h species concentration in gas phase of void and storage domains
D e f f ( c m 2 s ) effective diffusivity
D A B ( c m 2 s ) binary diffusion coefficient
D a Reference Damköhler number
d p e l ( m ) Pellet diameter
F i , g v ( m o l   i s ) Axial   molar   flowrate   of   i t h species
F ( m o l s ) Reference axial molar flowrate
F ¯ i , g v Dimensionless   axial   molar   flowrate   of   i t h species
h k operating mode (OM) specific Heaviside function.
k 1   ( kmol   bar 0 . 5 kg cat   hr ) ,   k 2   ( kmol   kg cat   hr   bar ) ,   k 3   ( kmol   bar 0 . 5 kg cat   hr ) Rate coefficients for SMR reactions
K 1 ( bar 2 ) ,   K 2   , K 3 ( bar 2 )   Equilibrium constants for SMR reactions
K C H 4 ( bar 1 ) , K H 2 ( bar 1 ) ,   K C O ( bar 1   ) ,   K H 2 O ,   Species adsorption constants for SMR reactions
L ( m ) Reactor Length
L c h a r ( m ) Characteristic length
N C Number of species
N O M Number of reactor operating modes
O M Operating mode
P i , g v ( P a ) ,   P i , g s ( P a ) i t h species partial pressure in gas phase of void and storage domains
P ¯ i , g v ,   P ¯ i , g s i t h species dimensionless partial pressure in gas phase of void and storage domains
( P ¯ ˜ i , g v ) i n , k Ratio of inlet partial pressure for species i for operating mode k-1, based on operating mode k = 1
( P ¯ ˜ i , g v ) o u t , k Ratio of inlet partial pressure for species i for operating mode k, based on operating mode k = 1
P ( P a ) Reference pressure
P e Peclet number for convective to diffusive mass transport
P e Peclet number for membrane to convective transport
r i ( m o l   i k g   c a t a l y s t   s ) i t h species reaction-based generation rate
r ¯ i i t h species dimensionless reaction-based generation rate
r ( m o l   k g   c a t a l y s t   s ) Reference reaction generation rate
R i , k Molar   ratio   of   i t h species   produced   during   OM   k over   i t h species produced during all OM’s
R i Rate   of   i t h SMR reaction
R ¯ i Dimensionless   rate   of   i t h SMR reaction
R ( J m o l K ) 8.314462 Universal Gas Constant
R L I M Limiting reactant used in performance metric calculations
S i , g v , g s   ( m o l   o f   s p e c i e s   i   i n   p h a s e   g   f r o m   s   t o   v ( m 3   s y s t e m   r ) s ) Molar   generation   rate   of   i t h species into the gas phase of the voids domain due to transport from the gas phase in the storage domain
S i , g s , g v   ( m o l   o f   s p e c i e s   i   i n   p h a s e   g   f r o m   v   t o   s ( m 3   s y s t e m   r ) s ) Molar   generation   rate   of   i t h species into the gas phase of the storage domain due to transport from the gas phase in the voids domain
t ( s ) Time
t ¯ Dimensionless time
t ( s ) Reference time, chosen as the residence time
T ( K ) Temperature in all reactor domains
V ( m 3 ) Total reactor volume
v e f f ( m s ) effective velocity
v g ( m s ) gas velocity in reactor void domain
v ( m s ) Reference velocity, chosen as gas inlet velocity during OM 1
v ¯ g Dimensionless gas velocity in reactor void domain
X R L I M Conversion   of   limiting   reactant R L I M over all OM’s
W k Verhulst function for switching between inlet boundary conditions during OM change.
z ( m ) Reactor axial coordinate
z ¯ Reactor dimensionless axial coordinate
Geek Symbols
α s , v ( m 2   s t o r a g e v o i d   i n t e r f a c e m 3   s y s t e m   r ) Storage-void domain interfacial area per unit volume of reactor system
β i   ( m o l   i P a ( m 2   v o i d s t o r a g e   i n t e r f a c e ) s )   i = 1 , N C i t h species permeance through storage medium permselective layer
ε v ,   ε c ,   ε s ,   ε g s ,   ε s o s Volume fractions of voids, catalyst, storage, gas phase in storage domain, and solid phase in storage domain
η Catalyst effectiveness factor
Θ Dimensionless number quantifying membrane permeation to convection (inverse Peclet)
ρ c ( k g   c a t a l y s t m 3   c a t a l y s t   p e l l e t ) Catalyst pellet density
ω i , k Molar   ratio   of   i t h species   produced   during   OM   k over limiting reactant fed throughout all OM’s
Ω i Overall   molar   ratio   of   i t h species produced during all OMs over limiting reactant fed throughout all OM’s
Ω i Desired   product   yield   of   species   i
τ k Duration   of   k t h operating mode
τ ¯ k Dimensionless   duration   of   k t h operating mode

References

  1. Mannan, M.S.; Reyes-Valdes, O.; Jain, P.; Tamim, N.; Ahammad, M. The Evolution of Process Safety: Current Status and Future Direction. Annu. Rev. Chem. Biomol. Eng. 2016, 7, 135–162. [Google Scholar] [CrossRef]
  2. Stankiewicz, A.; Moulijn, J.A. Re-Engineering the Chemical Processing Plant: Process Intensification; CRC Press: Boca Raton, FL, USA, 2003. [Google Scholar]
  3. Baldea, M. From process integration to process intensification. Comput. Chem. Eng. 2015, 81, 104–114. [Google Scholar] [CrossRef]
  4. Basile, A.; Campanari, S.; Manzolini, G.; Iulianelli, A.; Longo, T.; Liguori, S.; De Falco, M.; Piemonte, V. Methane steam reforming in a Pd–Ag membrane reformer: An experimental study on reaction pressure influence at middle temperature. Int. J. Hydrogen Energy 2011, 36, 1531–1539. [Google Scholar] [CrossRef]
  5. Asprion, N.; Kaibel, G. Dividing wall columns: Fundamentals and recent advances. Chem. Eng. Process. Process Intensif. 2010, 49, 139–146. [Google Scholar] [CrossRef]
  6. LeViness, S.; Deshmukh, S.R.; Richard, L.A.; Robota, H.J. Velocys Fischer–Tropsch Synthesis Technology—New Advances on State-of-the-Art. Top. Catal. 2014, 57, 518–525. [Google Scholar] [CrossRef]
  7. Cao, M.; Zhao, L.; Xu, D.; Ciora, R.; Liu, P.K.; Manousiouthakis, V.I.; Tsotsis, T.T. A carbon molecular sieve membrane-based reactive separation process for pre-combustion CO2 capture. J. Membr. Sci. 2020, 605, 118028. [Google Scholar] [CrossRef]
  8. Cao, M.; Zhao, L.; Xu, D.; Parsley, D.; Ciora, R.; Liu, P.K.; Manousiouthakis, V.I.; Tsotsis, T.T. A reactive separation process for pre-combustion CO2 capture employing oxygen-blown coal gasifier off-gas. Chem. Eng. J. 2021, 420 Pt 2, 127694. [Google Scholar] [CrossRef]
  9. Ponce-Ortega, J.M.; Al-Thubaiti, M.M.; El-Halwagi, M.M. Process intensification: New understanding and systematic approach. Chem. Eng. Process. Process Intensif. 2012, 53, 63–75. [Google Scholar] [CrossRef]
  10. Sharma, S.; Rangaiah, G.P. An improved multi-objective differential evolution with a termination criterion for optimizing chemical processes. Comput. Chem. Eng. 2013, 56, 155–173. [Google Scholar] [CrossRef]
  11. Carvalho, A.; Matos, H.A.; Gani, R. SustainPro—A tool for systematic process analysis, generation and evaluation of sustainable design alternatives. Comput. Chem. Eng. 2013, 50, 8–27. [Google Scholar] [CrossRef]
  12. Li, M. Thermodynamic analysis of adsorption enhanced reforming of ethanol. Int. J. Hydrogen Energy 2009, 34, 9362–9372. [Google Scholar] [CrossRef]
  13. Karagöz, S.; Tsotsis, T.T.; Manousiouthakis, V.I. Multi-scale model based design of membrane reactor/separator processes for intensified hydrogen production through the water gas shift reaction. Int. J. Hydrogen Energy 2020, 45, 7339–7353. [Google Scholar] [CrossRef]
  14. Da Cruz, F.E.; Karagöz, S.; Manousiouthakis, V.I. Parametric Studies of Steam Methane Reforming Using a Multiscale Reactor Model. Ind. Eng. Chem. Res. 2017, 56, 14123–14139. [Google Scholar] [CrossRef]
  15. Da Cruz, F.E.; Manousiouthakis, V.I. Process Intensification of Multipressure Reactive Distillation Networks Using Infinite Dimensional State-Space (IDEAS). Ind. Eng. Chem. Res. 2019, 58, 5968–5983. [Google Scholar] [CrossRef]
  16. Pichardo, P.A.; Manousiouthakis, V.I. Intensified energetically enhanced steam methane reforming through the use of membrane reactors. AIChE J. 2020, 66, e16827. [Google Scholar] [CrossRef]
  17. Lowd, J.; Tsotsis, T.T.; Manousiouthakis, V.I. On process intensification through storage reactors: A case study on methane steam reforming. Comput. Chem. Eng. 2020, 133, 106601. [Google Scholar] [CrossRef]
  18. Dabir, S.; Deng, W.; Sahimi, M.; Tsotsis, T. Fabrication of silicon carbide membranes on highly permeable supports. J. Membr. Sci. 2017, 537, 239–247. [Google Scholar] [CrossRef]
  19. Huysmans, M.; Dassargues, A. Review of the use of Péclet numbers to determine the relative importance of advection and diffusion in low permeability environments. Hydrogeol. J. 2005, 13, 895–904. [Google Scholar] [CrossRef] [Green Version]
  20. Horseman, S.T.; Higgo, J.J.W.; Alexander, J.; Harrington, J.F. Water, Gas and Solute Movement through Argillaceous Media; Nuclear Energy Agency of the OECD (NEA), Organization for Economic Co-Operation and Development: Paris, France, 1996. [Google Scholar]
  21. Carapellucci, R.; Milazzo, A. Membrane systems for CO2 capture and their integration with gas turbine plants. Proc. Inst. Mech. Eng. Part A J. Power Energy 2003, 217, 505–517. [Google Scholar] [CrossRef]
  22. Caravella, A.; Hara, S.; Drioli, E.; Barbieri, G. Sieverts law pressure exponent for hydrogen permeation through Pd-based membranes: Coupled influence of non-ideal diffusion and multicomponent external mass transfer. Int. J. Hydrogen Energy 2013, 38, 16229–16244. [Google Scholar] [CrossRef]
  23. Elyassi, B.; Sahimi, M.; Tsotsis, T.T. A novel sacrificial interlayer-based method for the preparation of silicon carbide membranes. J. Membr. Sci. 2008, 316, 73–79. [Google Scholar] [CrossRef]
  24. Alavi, M.; Eslamloueyan, R.; Rahimpour, M.R. Multi Objective Optimization of a Methane Steam Reforming Reaction in a Membrane Reactor: Considering the Potential Catalyst Deactivation due to the Hydrogen Removal. Int. J. Chem. React. Eng. 2018, 16, 20170066. [Google Scholar] [CrossRef]
  25. Tsuru, T.; Yamaguchi, K.; Yoshioka, T.; Asaeda, M. Methane steam reforming by microporous catalytic membrane reactors. AIChE J. 2004, 50, 2794–2805. [Google Scholar] [CrossRef]
  26. Motamedhashemi, M.M.Y.; Egolfopoulos, F.; Tsotsis, T. Application of a flow-through catalytic membrane reactor (FTCMR) for the destruction of a chemical warfare simulant. J. Membr. Sci. 2011, 376, 119–131. [Google Scholar] [CrossRef]
  27. Israni, S.H.; Nair, B.K.R.; Harold, M.P. Hydrogen generation and purification in a composite Pd hollow fiber membrane reactor: Experiments and modeling. Catal. Today 2009, 139, 299–311. [Google Scholar] [CrossRef]
  28. Gokhale, Y.V.; Noble, R.D.; Falconer, J.L. Effects of reactant loss and membrane selectivity on a dehydrogenation reaction in a membrane-enclosed catalytic reactor. J. Membr. Sci. 1995, 103, 235–242. [Google Scholar] [CrossRef]
  29. Mohan, K.; Govind, R. Analysis of a cocurrent membrane reactor. AIChE J. 1986, 32, 2083–2086. [Google Scholar] [CrossRef]
  30. Wei, C.-L.; Chen, Y.-C.; Cheng, C.-C.; Kao, K.-S.; Cheng, D.-L.; Chung, C.-J. Highly Sensitive UV Sensors Based on SMR Oscillators. Procedia Eng. 2012, 36, 468–475. [Google Scholar] [CrossRef] [Green Version]
  31. Xu, J.; Froment, G.F. Methane steam reforming, methanation and water-gas shift: I. Intrinsic kinetics. AIChE J. 1989, 35, 88–96. [Google Scholar] [CrossRef]
  32. Sánchez Pérez, J.F.; Conesa, M.; Alhama, I.; Alhama, F.; Cánovas, M. Searching fundamental information in ordinary differential equations. Nondimensionalization technique. PLoS ONE 2017, 12, e0185477. [Google Scholar] [CrossRef] [Green Version]
  33. Abdollahi, M.; Yu, J.; Liu, P.K.T.; Ciora, R.; Sahimi, M.; Tsotsis, T.T. Ultra-pure hydrogen production from reformate mixtures using a palladium membrane reactor system. J. Membr. Sci. 2012, 390, 32–42. [Google Scholar] [CrossRef]
  34. Di Marcoberardino, G.; Sosio, F.; Manzolini, G.; Campanari, S. Fixed bed membrane reactor for hydrogen production from steam methane reforming: Experimental and modeling approach. Int. J. Chem. React. Eng. 2015, 40, 7559–7567. [Google Scholar] [CrossRef]
  35. Rostrup-Nielsen, J.R. Catalytic Steam Reforming. In Catalysis: Science and Technology; Anderson, J.R., Boudart, M., Eds.; Springer: Berlin/Heidelberg, Germany, 1984; Volume 5, pp. 1–117. [Google Scholar] [CrossRef]
  36. Said, S.A.M.; Simakov, D.S.A.; Waseeuddin, M.; Román-Leshkov, Y. Solar molten salt heated membrane reformer for natural gas upgrading and hydrogen generation: A CFD model. Solar Energy 2016, 124, 163–176. [Google Scholar] [CrossRef]
Figure 1. Proposed SMR-MSR process and its operating modes.
Separations 08 00195 g001
Figure 2. Methane dimensionless partial pressure at reactor inlet for τ ¯ 1 = τ ¯ 2 = τ ¯ 3 = 5 , a = 1 , c = 8.5 . The resulting time evolution of SMR-MSR state variables for the seventh trial ( D a = 2 ,   Θ = 10 ) is displayed in the figures below.
Separations 08 00195 g002
Figure 3. Dimensionless time evolution of species’ dimensionless partial pressure at reactor inlet over 3 cycles of operation for Da = 2, Θ = 10.
Separations 08 00195 g003
Figure 4. Dimensionless time evolution of species’ dimensionless partial pressure at reactor outlet over 3 cycles of operation for Da = 2, Θ = 10.
Separations 08 00195 g004
Figure 5. Dimensionless time evolution of H2 dimensionless partial pressure in void and storage domains at four reactor lengths for the last cycle of Da = 2, Θ = 10.
Separations 08 00195 g005
Figure 6. Dimensionless time evolution of CH4 and CO2 dimensionless partial pressures in void domain at four reactor lengths for the last cycle of Da = 2, Θ = 10.
Separations 08 00195 g006
Figure 7. Species’ dimensionless partial pressure axial length profile during cycle 3 at the end of OM 1 for Da = 2, Θ = 10.
Separations 08 00195 g007
Figure 8. Species’ dimensionless partial pressure axial length profile during cycle 3 at the end of OM 2 for Da = 2, Θ = 10.
Separations 08 00195 g008
Figure 9. Species’ dimensionless partial pressure axial length profile during cycle 3 at the end of OM 3 for Da = 2, Θ = 10.
Separations 08 00195 g009
Figure 10. Dimensionless time evolution of dimensionless species’ partial pressure at reactor outlet over 3 cycles of operation for Da = 4, Θ = 50.
Separations 08 00195 g010
Figure 11. Dimensionless time evolution of H2 dimensionless partial pressure in void and storage domains at four reactor lengths for the last cycle for Da = 4, Θ = 50.
Separations 08 00195 g011
Figure 12. Dimensionless time evolution of CH4 and CO2 dimensionless partial pressure in void domain at four reactor lengths for the last cycle for Da = 4, Θ = 50.
Separations 08 00195 g012
Figure 13. Species’ dimensionless partial pressure axial length profile during cycle 3 at the end of OM 1 for Da = 4, Θ = 50.
Separations 08 00195 g013
Table 1. Rate coefficients and adsorption constants for use in Arrhenius or Van’t Hoff Equations.
Rate Coefficient or Adsorption ConstantPre-Exponential FactorUnit Pre-Exponential FactorActivation Energy or Adsorption Enthalpy ( K J )
k 1 4.225 × 10 15 ( k m o l   b a r 0.5 ) / ( k g c a t   h r ) 240.1
k 2 1.955 × 10 6 ( k m o l   ) / ( k g c a t   h r   b a r ) 67.13
k 3 1.020 × 10 15 ( k m o l   b a r 0.5 ) / ( k g c a t   h r ) 243.9
K C O 8.23 × 10 5 b a r 1 70.65
K H 2 6.12 × 10 9 b a r 1 82.90
K C H 4 6.65 × 10 4 bar 1 38.28
K H 2 O 1.77 × 10 4 dimensionless 88.68
Table 2. SMR reaction equilibrium constants.
Equilibrium ConstantUnits
K 1 = exp ( 26 , 830 / T + 30.114 ) b a r 2
K 2 = exp ( 4400 / T 40.63 ) dimensionless
K 3 = K 1 K 2 b a r 2
Table 3. MSR design parameters and OM dimensionless duration times.
TrialDaΘ τ ¯ 1 τ ¯ 2 τ ¯ 3
1110.7175431.000.674081
21100.7553211.002.261037
31300.7529531.002.049624
41400.7624921.001.941365
51500.7426311.001.814203
6210.5451161.000.367633
72100.5659941.002.509012
82300.5877891.001.998005
92400.5883871.001.8797
102500.5974221.001.754175
11410.4058481.000.24924
124100.4286481.002.455872
134500.4665531.001.713176
14610.3632281.000.222919
156100.3890411.002.457342
166500.3883791.001.76623
Table 4. Performance metric comparison for SMR-MSR and SMR-SSR for the sixteen considered trials.
TrialDaΘ X C H 4   MSR X C H 4   SSR Y H 2   MSR Y H 2   SSR R H 2 , r e c
1110.2682970.22050.9252440.85050.133693
21100.4868040.22052.062180.85050.851397
31300.518770.22052.1721580.85050.874449
41400.5277660.22052.2119690.85050.883636
51500.5577380.22052.3176190.85050.895902
6210.3323340.25641.0275610.98580.114506
72100.5552910.25642.3110480.98580.828753
82300.6578830.25642.7109150.98580.90206
92400.6837930.25642.7973320.98580.917312
102500.6969670.25642.8561350.98580.923089
11410.4068780. 28661.1403351.1020.122357
124100.7194370. 28662.9186081.1020.868964
134500.9003930. 28663.6385641.1020.958944
14610.4308220.29131.1657531.1310.122353
156100.7951360.29133.2052931.1310.884476
166500.9744970.29133.9315811.1310.972301
Publisher’s Note: MDPI stays neutral with regard to jurisdictional claims in published maps and institutional affiliations.

