
Arginine, as a Key Indicator for Real-Time Stability Monitoring of Quality Control in the Newborn Screening Test Using Dried Blood Spot


Abstract
:1. Introduction
2. Materials and Methods
2.1. Specimens and Storage
2.2. Reagents
2.3. Sample Preparation for Extraction and Derivatization
2.4. LC-MS/MS Analysis
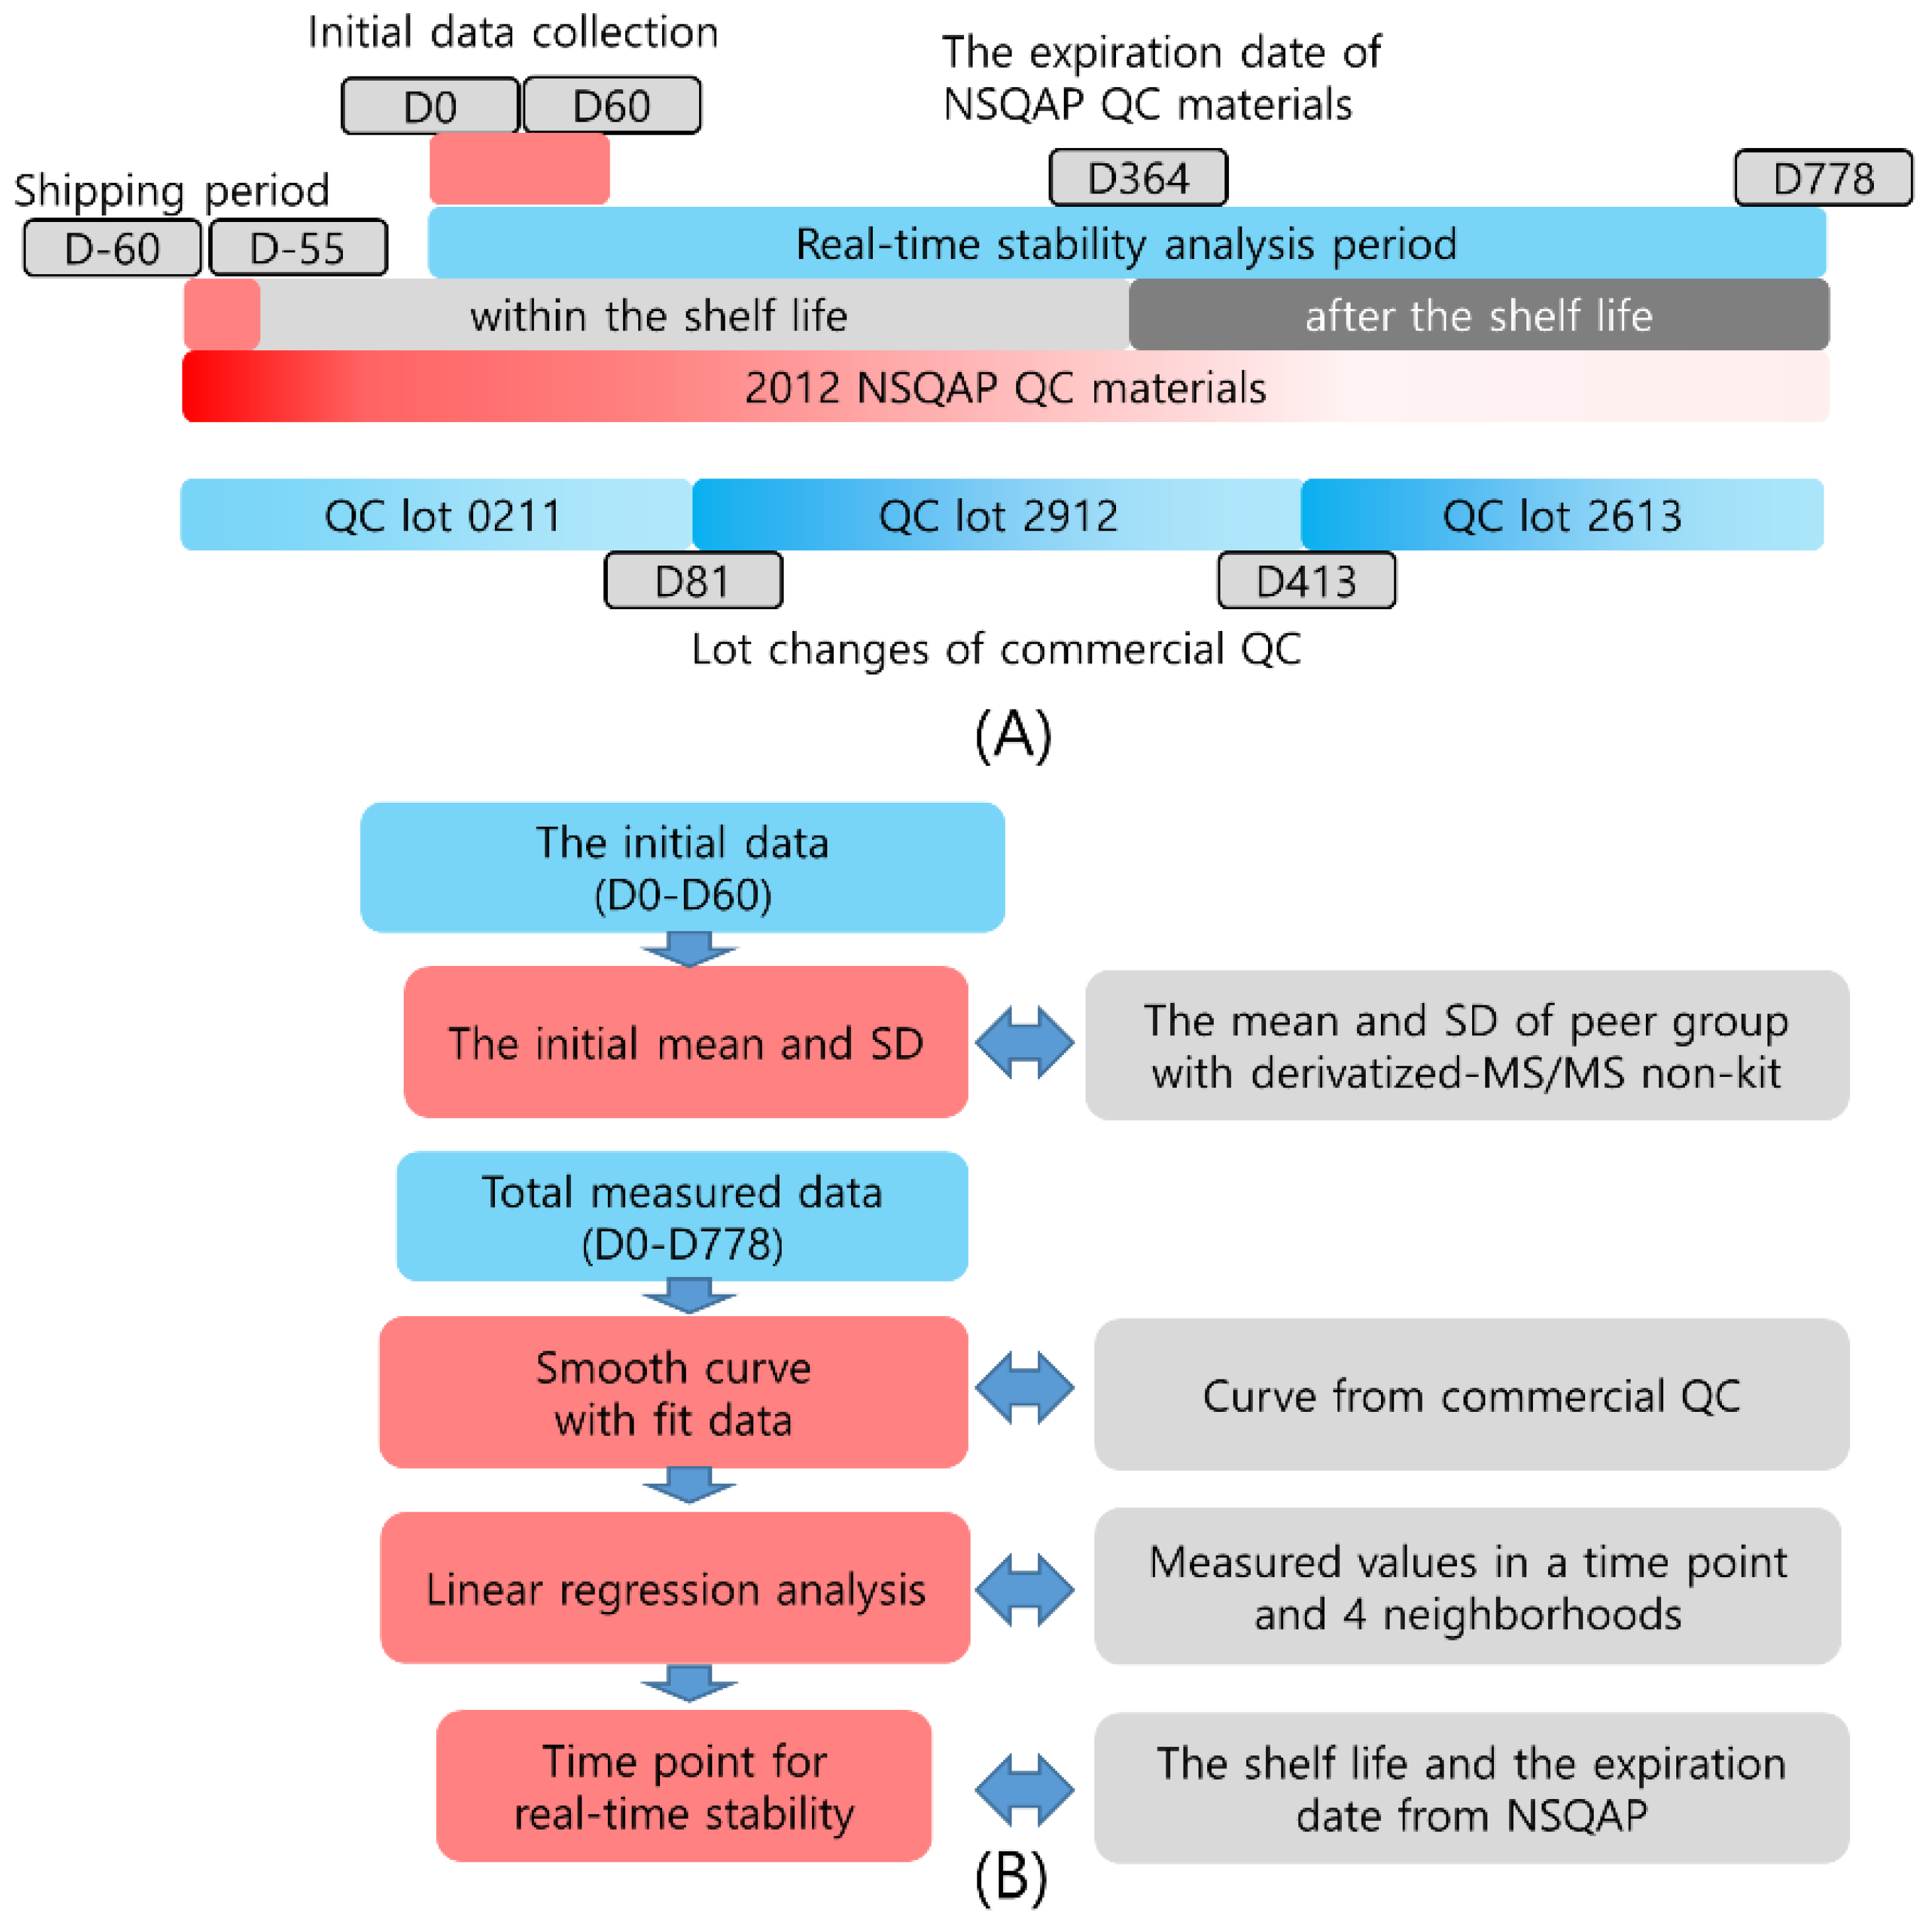
2.5. Real-Time Stability Monitoring
2.6. Statistical Analysis
3. Results
3.1. Characteristics of Routine Practice
3.2. Method Validation
3.3. Comparison between the Initial Data and Peer Group Data with Derivatized-MS/MS Non-Kit
3.4. Comparison of the Initial Data and Data within the Shelf Life or after the Shelf Life
3.5. Real-Time Stability Analysis
3.6. Correlation Analysis Aetween Aime and Analytes
4. Discussion
5. Conclusions
Supplementary Materials
Funding
Institutional Review Board Statement
Informed Consent Statement
Data Availability Statement
Acknowledgments
Conflicts of Interest
References
- Lund, A.M.; Christensen, E.; Skovby, F. Diagnosis and acute treatment of inborn metabolic diseases in infants. Ugeskr. Laeger. 2002, 164, 5613–5619. [Google Scholar]
- Raghuveer, T.S.; Garg, U.; Graf, W.D. Inborn errors of metabolism in infancy and early childhood: An update. Am. Fam. Physician 2006, 73, 1981–1990. [Google Scholar]
- Zand, D.J.; Brown, K.M.; Lichter-Konecki, U.; Campbell, J.K.; Salehi, V.; Chamberlain, J.M. Effectiveness of a clinical pathway for the emergency treatment of patients with inborn errors of metabolism. Pediatrics 2008, 122, 1191–1195. [Google Scholar] [CrossRef] [PubMed]
- Kamboj, M. Clinical approach to the diagnoses of inborn errors of metabolism. Pediatr. Clin. N. Am. 2008, 55, 1113–1127. [Google Scholar] [CrossRef]
- Pourfarzam, M.; Zadhoush, F. Newborn Screening for inherited metabolic disorders; news and views. J. Res. Med. Sci. Off. J. Isfahan Univ. Med. Sci. 2013, 18, 801–808. [Google Scholar]
- Chace, D.H.; Millington, D.S.; Terada, N.; Kahler, S.G.; Roe, C.R.; Hofman, L.F. Rapid diagnosis of phenylketonuria by quantitative analysis for phenylalanine and tyrosine in neonatal blood spots by tandem mass spectrometry. Clin. Chem. 1993, 39, 66–71. [Google Scholar] [CrossRef]
- Zytkovicz, T.H.; Fitzgerald, E.F.; Marsden, D.; Larson, C.A.; Shih, V.E.; Johnson, D.M.; Strauss, A.W.; Comeau, A.M.; Eaton, R.B.; Grady, G.F. Tandem mass spectrometric analysis for amino, organic, and fatty acid disorders in newborn dried blood spots: A two-year summary from the New England Newborn Screening Program. Clin. Chem. 2001, 47, 1945–1955. [Google Scholar] [CrossRef]
- Lehmann, S.; Delaby, C.; Vialaret, J.; Ducos, J.; Hirtz, C. Current and future use of “dried blood spot” analyses in clinical chemistry. Clin. Chem. Lab. Med. 2013, 51, 1897–1909. [Google Scholar] [CrossRef]
- George, R.S.; Moat, S.J. Effect of Dried Blood Spot Quality on Newborn Screening Analyte Concentrations and Recommendations for Minimum Acceptance Criteria for Sample Analysis. Clin. Chem. 2016, 62, 466–475. [Google Scholar] [CrossRef] [PubMed] [Green Version]
- Wagner, M.; Tonoli, D.; Varesio, E.; Hopfgartner, G. The use of mass spectrometry to analyze dried blood spots. Mass Spectrom. Rev. 2016, 35, 361–438. [Google Scholar] [CrossRef]
- Botkin, J.R.; Goldenberg, A.J.; Rothwell, E.; Anderson, R.A.; Lewis, M.H. Retention and research use of residual newborn screening bloodspots. Pediatrics 2013, 131, 120–127. [Google Scholar] [CrossRef] [Green Version]
- Seger, C.; Salzmann, L. After another decade: LC–MS/MS became routine in clinical diagnostics. Clin. Biochem. 2020, 82, 2–11. [Google Scholar] [CrossRef]
- Kaul, K.L.; Sabatini, L.M.; Tsongalis, G.J.; Caliendo, A.M.; Olsen, R.J.; Ashwood, E.R.; Bale, S.; Benirschke, R.; Carlow, D.; Funke, B.H.; et al. The Case for Laboratory Developed Procedures: Quality and Positive Impact on Patient Care. Acad. Pathol. 2017, 4. [Google Scholar] [CrossRef] [Green Version]
- Pickens, C.A.; Sternberg, M.; Seeterlin, M.; De Jesús, V.R.; Morrissey, M.; Manning, A.; Bhakta, S.; Held, P.K.; Mei, J.; Cuthbert, C.; et al. Harmonizing Newborn Screening Laboratory Proficiency Test Results Using the CDC NSQAP Reference Materials. Int. J. Neonatal Screen. 2020, 6, 75. [Google Scholar] [CrossRef]
- De Jesús, V.R.; Mei, J.V.; Bell, C.J.; Hannon, W.H. Improving and Assuring Newborn Screening Laboratory Quality Worldwide: 30-Year Experience at the Centers for Disease Control and Prevention. Semin. Perinatol. 2010, 34, 125–133. [Google Scholar] [CrossRef] [Green Version]
- Hoffman, G.L. CLSI NBS04-A Newborn Screening by Tandem Mass Spectrometry: Approved Guideline; Clinical and Laboratory Standards Institute: Wayne, NY, USA, 2010. [Google Scholar]
- Adam, B.W.; Hall, E.M.; Sternberg, M.; Lim, T.H.; Flores, S.R.; O’Brien, S.; Simms, D.; Li, L.X.; De Jesus, V.R.; Hannon, W.H. The stability of markers in dried-blood spots for recommended newborn screening disorders in the United States. Clin. Biochem. 2011, 44, 1445–1450. [Google Scholar] [CrossRef] [Green Version]
- Fingerhut, R.; Ensenauer, R.; Röschinger, W.; Arnecke, R.; Olgemöller, B.; Roscher, A.A. Stability of acylcarnitines and free carnitine in dried blood samples: Implications for retrospective diagnosis of inborn errors of metabolism and neonatal screening for carnitine transporter deficiency. Anal. Chem. 2009, 81, 3571–3575. [Google Scholar] [CrossRef]
- Freer, D.E. Observations on heat/humidity denaturation of enzymes in filter-paper blood spots from newborns. Clin. Chem. 2005, 51, 1060–1062. [Google Scholar] [CrossRef] [Green Version]
- Golbahar, J.; Altayab, D.D.; Carreon, E. Short-term stability of amino acids and acylcarnitines in the dried blood spots used to screen newborns for metabolic disorders. J. Med. Screen. 2014, 21, 5–9. [Google Scholar] [CrossRef] [Green Version]
- Ebrahim, A.; DeVore, K.; Fischer, T. Limitations of Accelerated Stability Model Based on the Arrhenius Equation for Shelf Life Estimation of In Vitro Diagnostic Products. Clin. Chem. 2021, 67, 684–688. [Google Scholar] [CrossRef]
- Theodorsson, E. Quality Assurance in Clinical Chemistry: A Touch of Statistics and a Lot of Common Sense. J. Med. Biochem. 2016, 35, 103–112. [Google Scholar] [CrossRef] [PubMed]
- CLSI EP25-A, Evaluation of Stability of In Vitro Diagnostic Reagents: Approved Guideline; Clinical and Laboratory Standards Institute: Wayne, NY, USA, 2009.
- Bell, C.J. Newborn Screening Quality Assurance Program: 2012 Annual Summary Report; CDC: Atlanta, GA, USA, 2013; Volume 30.
- CLSI NBS01 ED7—Dried Blood Spot Specimen Collection for Newborn Screening, 7th ed.; Clinical and Laboratory Standards Institute: Wayne, NY, USA, 2021.
- Adam, B.W.; Alexander, J.R.; Smith, S.J.; Chace, D.H.; Loeber, J.G.; Elvers, L.H.; Hannon, W.H. Recoveries of phenylalanine from two sets of dried-blood-spot reference materials: Prediction from hematocrit, spot volume, and paper matrix. Clin. Chem. 2000, 46, 126–128. [Google Scholar] [CrossRef] [PubMed] [Green Version]
- Majda, A.; Wietecha-Posłuszny, R.; Świądro, M.; Mrochem, K.; Kościelniak, P. Dried blood spots sampling in case samples deprived of hematocrit level information—Investigation and calculation strategy. J. Chromatogr. B 2019, 1124, 308–312. [Google Scholar] [CrossRef] [PubMed]
- Hall, E.M.; Flores, S.R.; De Jesús, V.R. Influence of Hematocrit and Total-Spot Volume on Performance Characteristics of Dried Blood Spots for Newborn Screening. Int. J. Neonatal Screen. 2015, 1, 69–78. [Google Scholar] [CrossRef]
- Chace, D.H.; Hannon, W.H. Filter Paper as a Blood Sample Collection Device for Newborn Screening. Clin. Chem. 2016, 62, 423–425. [Google Scholar] [CrossRef] [PubMed] [Green Version]
- Mei, J.V.; Alexander, J.R.; Adam, B.W.; Hannon, W.H. Use of Filter Paper for the Collection and Analysis of Human Whole Blood Specimens. J. Nutr. 2001, 131, 1631S–1636S. [Google Scholar] [CrossRef] [PubMed] [Green Version]
- Lando, V.S.; Batista, M.C.; Nakamura, I.T.; Mazi, C.R.; Mendonca, B.B.; Brito, V.N. Effects of long-term storage of filter paper blood samples on neonatal thyroid stimulating hormone, thyroxin and 17-alpha-hydroxyprogesterone measurements. J. Med. Screen. 2008, 15, 109–111. [Google Scholar] [CrossRef] [PubMed]
- Adam, B.W.; Flores, S.R.; Hou, Y.; Allen, T.W.; De Jesus, V.R. Galactose-1-phosphate uridyltransferase dried blood spot quality control materials for newborn screening tests. Clin. Biochem. 2015, 48, 437–442. [Google Scholar] [CrossRef] [PubMed] [Green Version]
- Prentice, P.; Turner, C.; Wong, M.C.; Dalton, R.N. Stability of metabolites in dried blood spots stored at different temperatures over a 2-year period. Bioanalysis 2013, 5, 1507–1514. [Google Scholar] [CrossRef]
- Chace, D.H.; Adam, B.W.; Smith, S.J.; Alexander, J.R.; Hillman, S.L.; Hannon, W.H. Validation of accuracy-based amino acid reference materials in dried-blood spots by tandem mass spectrometry for newborn screening assays. Clin. Chem. 1999, 45, 1269–1277. [Google Scholar] [CrossRef] [Green Version]
- Ikeda, K.; Ichihara, K.; Hashiguchi, T.; Hidaka, Y.; Kang, D.; Maekawa, M.; Matsumoto, H.; Matsushita, K.; Okubo, S.; Tsuchiya, T.; et al. Evaluation of the short-term stability of specimens for clinical laboratory testing. Biopreserv. Biobank 2015, 13, 135–143. [Google Scholar] [CrossRef] [PubMed]
- Li, K.; Naviaux, J.C.; Monk, J.M.; Wang, L.; Naviaux, R.K. Improved Dried Blood Spot-Based Metabolomics: A Targeted, Broad-Spectrum, Single-Injection Method. Metabolites 2020, 10, 82. [Google Scholar] [CrossRef] [PubMed] [Green Version]
- Clancy, D.; Hodnett, N.; Orr, R.; Owen, M.; Peterson, J. Kinetic Model Development for Accelerated Stability Studies. AAPS PharmSciTech 2017, 18, 1158–1176. [Google Scholar] [CrossRef] [PubMed]


| Analyte | Level | Initial | Within the Shelf Life | After the Shelf Life | Total | |||||||||||
|---|---|---|---|---|---|---|---|---|---|---|---|---|---|---|---|---|
| D0 to D60 (n = 25) | D0 to D364 (n = 151) | D365 to D788 (n = 179) | D0 to D788 (n = 330) | |||||||||||||
| (μmol/L) | Mean | SD | CV | Mean | SD | CV | p | Mean | SD | CV | p | Mean | SD | CV | Range | |
| Phe | low | 89.7 | 10.5 | 11.7% | 91.5 | 8.1 | 8.9% | N.S | 95.9 | 7.5 | 7.8% | <0.001 | 93.9 | 8.1 | 8.6% | 76.0 to 116.4 |
| medium | 256.9 | 35.3 | 13.7% | 256.7 | 24.4 | 9.5% | N.S | 269.5 | 22.7 | 8.4% | 0.017 | 263.7 | 24.3 | 9.2% | 205.0 to 336.8 | |
| high | 459.7 | 50.2 | 10.9% | 471.5 | 39.9 | 8.5% | N.S | 495.1 | 47.5 | 9.6% | <0.001 | 484.3 | 45.8 | 9.4% | 377.0 to 596.1 | |
| Leu | low | 153.2 | 15.1 | 9.9% | 161.8 | 13.1 | 8.1% | 0.003 | 169.1 | 13.9 | 8.2% | <0.001 | 165.8 | 14.0 | 8.5% | 135.0 to 212.4 |
| medium | 343.6 | 37.1 | 10.8% | 347.8 | 32.5 | 9.3% | N.S | 358.7 | 31.9 | 8.9% | 0.031 | 353.7 | 32.5 | 9.2% | 276.0 to 436.4 | |
| high | 560.6 | 48.6 | 8.7% | 584.7 | 51.3 | 8.8% | 0.030 | 599.1 | 57.0 | 9.5% | 0.002 | 592.5 | 54.7 | 9.2% | 472.0 to 727.1 | |
| Met | low | 23.6 | 2.4 | 10.3% | 23.1 | 2.3 | 9.9% | N.S | 23.6 | 2.1 | 9.1% | N.S | 23.4 | 2.2 | 9.5% | 19.0 to 27.9 |
| medium | 82.0 | 8.9 | 10.9% | 78.8 | 7.2 | 9.2% | 0.049 | 78.4 | 7.8 | 10.0% | 0.035 | 78.6 | 7.5 | 9.6% | 59.0 to 103.2 | |
| high | 191.2 | 18.7 | 9.8% | 189.4 | 17.9 | 9.5% | N.S | 184.2 | 17.6 | 9.5% | N.S | 186.6 | 17.9 | 9.6% | 151.0 to 225.1 | |
| Tyr | low | 66.6 | 6.7 | 10.0% | 65.7 | 5.9 | 9.0% | N.S | 66.7 | 6.4 | 9.5% | N.S | 66.2 | 6.2 | 9.3% | 51.0 to 84.5 |
| medium | 313.2 | 31.4 | 10.0% | 310.0 | 26.9 | 8.7% | N.S | 316.3 | 27.3 | 8.6% | N.S | 313.4 | 27.3 | 8.7% | 253.0 to 395.9 | |
| high | 502.5 | 46.4 | 9.2% | 500.2 | 42.3 | 8.5% | N.S | 507.8 | 48.0 | 9.4% | N.S | 504.3 | 45.6 | 9.0% | 391.0 to 624.8 | |
| Val | low | 173.3 | 16.8 | 9.7% | 179.0 | 16.4 | 9.2% | N.S | 182.7 | 15.2 | 8.3% | 0.005 | 181.0 | 15.9 | 8.8% | 149.0 to 235.0 |
| medium | 384.1 | 37.7 | 9.8% | 385.5 | 36.6 | 9.5% | N.S | 395.7 | 39.6 | 10.0% | N.S | 391.0 | 38.6 | 9.9% | 302.0 to 488.9 | |
| high | 644.2 | 56.7 | 8.8% | 663.0 | 57.4 | 8.7% | N.S | 669.7 | 62.7 | 9.4% | N.S | 666.6 | 60.3 | 9.0% | 537.0 to 831.6 | |
| Cit | low | 26.9 | 2.2 | 8.0% | 27.5 | 1.9 | 7.0% | N.S | 28.0 | 1.7 | 6.3% | 0.004 | 27.8 | 1.8 | 6.7% | 21.0 to 33.6 |
| medium | 78.7 | 6.7 | 8.5% | 78.7 | 5.9 | 7.5% | N.S | 78.7 | 4.9 | 6.2% | N.S | 78.7 | 5.4 | 6.9% | 58.0 to 97.3 | |
| high | 169.7 | 12.4 | 7.3% | 174.5 | 12.6 | 7.2% | N.S | 172.9 | 10.5 | 6.1% | N.S | 173.7 | 11.5 | 6.6% | 135.0 to 207.0 | |
| Arg | low | 9.0 | 0.9 | 9.7% | 9.9 | 0.9 | 9.4% | <0.001 | 10.6 | 1.0 | 9.1% | <0.001 | 10.3 | 1.0 | 9.8% | 7.3 to 12.5 |
| medium | 28.4 | 3.3 | 11.8% | 29.2 | 2.7 | 9.2% | N.S | 27.5 | 2.4 | 8.9% | N.S | 28.3 | 2.7 | 9.5% | 21.0 to 34.4 | |
| high | 40.0 | 3.7 | 9.2% | 39.6 | 4.2 | 10.5% | N.S | 30.8 | 2.8 | 9.2% | <0.001 | 34.8 | 5.6 | 16.2% | 23.0 to 49.1 | |
| C0 | low | 39.7 | 3.6 | 9.0% | 40.3 | 3.1 | 7.7% | N.S | 41.3 | 2.7 | 6.5% | 0.009 | 40.9 | 2.9 | 7.2% | 34.0 to 48.6 |
| medium | 56.8 | 5.0 | 8.8% | 57.5 | 5.0 | 8.7% | N.S | 57.7 | 4.6 | 7.9% | N.S | 57.6 | 4.8 | 8.3% | 45.0 to 72.1 | |
| high | 76.5 | 5.4 | 7.0% | 76.8 | 5.7 | 7.4% | N.S | 76.7 | 7.0 | 9.1% | N.S | 76.8 | 6.4 | 8.4% | 60.0 to 97.4 | |
| C2 | low | 25.2 | 1.9 | 7.6% | 25.2 | 1.9 | 7.7% | N.S | 25.1 | 1.8 | 7.2% | N.S | 25.1 | 1.9 | 7.4% | 20.0 to 30.0 |
| medium | 34.2 | 2.3 | 6.8% | 34.1 | 2.5 | 7.4% | N.S | 33.6 | 2.8 | 8.3% | N.S | 33.8 | 2.7 | 7.9% | 27.0 to 42.3 | |
| high | 44.0 | 2.9 | 6.5% | 43.2 | 2.6 | 5.9% | N.S | 41.5 | 3.6 | 8.7% | 0.002 | 42.3 | 3.3 | 7.8% | 34.0 to 51.6 | |
| C3 | low | 5.0 | 0.5 | 9.4% | 5.1 | 0.4 | 7.7% | N.S | 5.2 | 0.3 | 6.5% | 0.010 | 5.1 | 0.4 | 7.1% | 4.2 to 6.1 |
| medium | 10.3 | 0.8 | 7.5% | 10.4 | 0.8 | 7.8% | N.S | 10.2 | 0.8 | 7.5% | N.S | 10.3 | 0.8 | 7.7% | 8.4 to 13.0 | |
| high | 15.5 | 1.0 | 6.7% | 15.6 | 1.0 | 6.7% | N.S | 15.3 | 1.2 | 8.2% | N.S | 15.4 | 1.2 | 7.6% | 13.0 to 18.7 | |
| C4 | low | 0.9 | 0.1 | 9.2% | 0.9 | 0.1 | 10.5% | N.S | 0.9 | 0.1 | 11.4% | N.S | 0.9 | 0.1 | 11.0% | 0.7 to 1.1 |
| medium | 1.9 | 0.3 | 13.6% | 2.0 | 0.2 | 10.4% | N.S | 1.9 | 0.2 | 10.3% | N.S | 2.0 | 0.2 | 10.4% | 1.5 to 2.5 | |
| high | 3.9 | 0.5 | 11.8% | 3.8 | 0.4 | 10.9% | N.S | 3.7 | 0.4 | 10.5% | N.S | 3.7 | 0.4 | 10.8% | 2.8 to 4.6 | |
| C5 | low | 0.6 | 0.1 | 15.7% | 0.6 | 0.1 | 11.7% | N.S | 0.6 | 0.1 | 10.7% | N.S | 0.6 | 0.1 | 11.1% | 0.4 to 0.7 |
| medium | 1.5 | 0.2 | 14.5% | 1.5 | 0.2 | 10.7% | N.S | 1.5 | 0.2 | 10.4% | N.S | 1.5 | 0.2 | 10.5% | 1.2 to 1.8 | |
| high | 2.7 | 0.2 | 9.1% | 2.7 | 0.3 | 9.2% | N.S | 2.8 | 0.3 | 9.7% | N.S | 2.8 | 0.3 | 9.5% | 2.1 to 3.3 | |
| C5DC | low | 0.4 | 0.1 | 14.3% | 0.4 | 0.0 | 11.8% | N.S | 0.4 | 0.0 | 11.8% | N.S | 0.4 | 0.0 | 11.9% | 0.3 to 0.5 |
| medium | 0.7 | 0.1 | 11.0% | 0.7 | 0.1 | 10.3% | N.S | 0.7 | 0.1 | 12.1% | N.S | 0.7 | 0.1 | 11.3% | 0.5 to 0.9 | |
| high | 1.9 | 0.2 | 10.8% | 1.8 | 0.2 | 11.1% | N.S | 1.7 | 0.2 | 11.5% | <0.001 | 1.7 | 0.2 | 11.7% | 1.2 to 2.2 | |
| C5OH | low | 0.8 | 0.1 | 11.1% | 0.8 | 0.1 | 9.8% | N.S | 0.8 | 0.1 | 10.1% | N.S | 0.8 | 0.1 | 10.0% | 0.6 to 1.0 |
| medium | 1.2 | 0.2 | 14.7% | 1.2 | 0.2 | 12.4% | N.S | 1.2 | 0.1 | 10.1% | N.S | 1.2 | 0.1 | 11.2% | 0.9 to 1.5 | |
| high | 1.7 | 0.2 | 12.3% | 1.7 | 0.2 | 10.8% | N.S | 1.7 | 0.2 | 10.3% | N.S | 1.7 | 0.2 | 10.5% | 1.3 to 2.1 | |
| C6 | low | 0.5 | 0.1 | 12.7% | 0.5 | 0.1 | 12.1% | N.S | 0.5 | 0.1 | 11.6% | N.S | 0.5 | 0.1 | 11.8% | 0.4 to 0.6 |
| medium | 0.8 | 0.1 | 14.1% | 0.9 | 0.1 | 12.0% | N.S | 0.9 | 0.1 | 11.5% | N.S | 0.9 | 0.1 | 11.7% | 0.7 to 1.1 | |
| high | 2.0 | 0.2 | 10.2% | 2.1 | 0.2 | 10.5% | N.S | 2.0 | 0.2 | 10.1% | N.S | 2.0 | 0.2 | 10.3% | 1.6 to 2.5 | |
| C8 | low | 0.6 | 0.1 | 9.2% | 0.6 | 0.1 | 10.5% | N.S | 0.6 | 0.1 | 10.6% | N.S | 0.6 | 0.1 | 10.5% | 0.5 to 0.9 |
| medium | 1.1 | 0.1 | 12.4% | 1.1 | 0.1 | 10.8% | N.S | 1.1 | 0.1 | 10.0% | N.S | 1.1 | 0.1 | 10.4% | 0.9 to 1.4 | |
| high | 2.8 | 0.3 | 10.5% | 2.8 | 0.3 | 10.1% | N.S | 2.7 | 0.3 | 11.1% | N.S | 2.8 | 0.3 | 10.7% | 2.1 to 3.5 | |
| C10 | low | 0.4 | 0.0 | 13.4% | 0.4 | 0.0 | 11.1% | N.S | 0.4 | 0.0 | 11.5% | N.S | 0.4 | 0.0 | 11.3% | 0.3 to 0.5 |
| medium | 1.1 | 0.1 | 13.3% | 1.1 | 0.1 | 11.0% | N.S | 1.1 | 0.1 | 11.2% | N.S | 1.1 | 0.1 | 11.1% | 0.8 to 1.4 | |
| high | 2.2 | 0.3 | 13.4% | 2.2 | 0.2 | 11.1% | N.S | 2.2 | 0.2 | 11.1% | N.S | 2.2 | 0.2 | 11.1% | 1.6 to 2.8 | |
| C12 | low | 0.4 | 0.1 | 14.7% | 0.4 | 0.0 | 10.7% | N.S | 0.4 | 0.0 | 11.8% | N.S | 0.4 | 0.0 | 11.5% | 0.3 to 0.5 |
| medium | 0.7 | 0.1 | 11.8% | 0.7 | 0.1 | 11.1% | N.S | 0.7 | 0.1 | 10.3% | N.S | 0.7 | 0.1 | 10.9% | 0.5 to 0.9 | |
| high | 1.5 | 0.1 | 9.1% | 1.5 | 0.2 | 10.1% | N.S | 1.6 | 0.2 | 10.2% | 0.029 | 1.5 | 0.2 | 10.3% | 1.1 to 1.9 | |
| C14 | low | 0.6 | 0.1 | 10.7% | 0.6 | 0.1 | 9.4% | N.S | 0.6 | 0.1 | 11.3% | N.S | 0.6 | 0.1 | 10.4% | 0.5 to 0.8 |
| medium | 1.6 | 0.3 | 15.8% | 1.7 | 0.2 | 11.4% | N.S | 1.7 | 0.2 | 9.9% | N.S | 1.7 | 0.2 | 10.7% | 1.3 to 2.1 | |
| high | 3.3 | 0.4 | 10.5% | 3.3 | 0.3 | 8.9% | N.S | 3.4 | 0.4 | 10.4% | N.S | 3.4 | 0.3 | 9.8% | 2.7 to 4.2 | |
| C16 | low | 4.6 | 0.4 | 8.4% | 4.8 | 0.4 | 8.8% | N.S | 4.8 | 0.4 | 9.1% | N.S | 4.8 | 0.4 | 8.9% | 3.9 to 5.9 |
| medium | 8.2 | 0.8 | 9.2% | 8.5 | 0.8 | 9.1% | N.S | 8.5 | 0.8 | 9.9% | N.S | 8.5 | 0.8 | 9.5% | 6.6 to 10.5 | |
| high | 11.5 | 1.4 | 12.3% | 11.8 | 1.2 | 9.7% | N.S | 12.0 | 1.2 | 10.1% | N.S | 11.9 | 1.2 | 9.9% | 8.4 to 14.9 | |
| C18 | low | 1.9 | 0.2 | 11.3% | 1.9 | 0.2 | 9.8% | N.S | 1.9 | 0.2 | 10.0% | N.S | 1.9 | 0.2 | 9.9% | 1.5 to 2.4 |
| medium | 3.0 | 0.4 | 12.1% | 3.0 | 0.3 | 10.6% | N.S | 3.0 | 0.3 | 10.6% | N.S | 3.0 | 0.3 | 10.6% | 2.2 to 3.7 | |
| high | 6.1 | 0.7 | 11.0% | 6.2 | 0.6 | 9.7% | N.S | 6.3 | 0.6 | 9.4% | N.S | 6.2 | 0.6 | 9.5% | 5.0 to 7.7 | |
| Analyte (μmol/L) | Level | Slope | Intercept | SE Slope | F | p Value | eD542 (μmol/L) | %eD542 | %D542adj |
|---|---|---|---|---|---|---|---|---|---|
| Phe | low | 0.012 | 89.4 | 0.002 | 38.6 | <0.001 | 95.6 | 6.6% | 2.0% |
| medium | 0.029 | 252.3 | 0.006 | 25.7 | <0.001 | 267.9 | 4.3% | 1.4% | |
| high | 0.056 | 462.2 | 0.011 | 27.7 | <0.001 | 492.6 | 7.2% | 1.5% | |
| Leu | low | 0.022 | 157.2 | 0.003 | 46.8 | <0.001 | 169.0 | 10.3% | 0.1% |
| medium | 0.032 | 341.1 | 0.008 | 17.3 | <0.001 | 358.4 | 4.3% | −0.5% | |
| high | 0.048 | 573.4 | 0.013 | 13.9 | <0.001 | 599.7 | 7.0% | 0.3% | |
| Met | low | 0.001 | 23.2 | 0.001 | 1.0 | 0.329 | 23.4 | −0.9% | 0.3% |
| medium | −0.003 | 79.6 | 0.002 | 2.0 | 0.158 | 78.2 | −4.6% | −1.8% | |
| high | −0.010 | 190.3 | 0.004 | 4.9 | 0.027 | 185.1 | −3.2% | 0.5% | |
| Tyr | low | 0.004 | 64.8 | 0.001 | 5.8 | 0.016 | 66.7 | 0.2% | −7.2% |
| medium | 0.019 | 306.1 | 0.007 | 8.1 | 0.005 | 316.2 | 1.0% | −12.1% | |
| high | 0.025 | 494.3 | 0.011 | 5.3 | 0.022 | 508.0 | 1.1% | −5.8% | |
| Val | low | 0.014 | 175.4 | 0.004 | 14.3 | 0.000 | 183.1 | 5.6% | 13.4% |
| medium | 0.025 | 381.2 | 0.009 | 7.3 | 0.007 | 394.7 | 2.8% | 1.6% | |
| high | 0.041 | 650.2 | 0.014 | 8.3 | 0.004 | 672.7 | 4.4% | −4.8% | |
| Cit | low | 0.002 | 27.2 | 0.000 | 12.3 | 0.001 | 28.0 | 3.9% | 7.8% |
| medium | 0.002 | 78.0 | 0.001 | 1.6 | 0.203 | 78.9 | 0.3% | −1.8% | |
| high | 0.001 | 173.1 | 0.003 | 0.3 | 0.616 | 173.9 | 2.4% | −6.9% | |
| Arg | low | 0.001 | 9.8 | 0.000 | 23.6 | <0.001 | 10.5 | 15.9% | 30.2% |
| medium | −0.004 | 30.0 | 0.001 | 51.5 | <0.001 | 27.7 | −2.7% | 0.6% | |
| high | −0.019 | 42.5 | 0.001 | 507.3 | <0.001 | 32.0 | −20.1% | −24.5% | |
| C0 | low | 0.003 | 39.7 | 0.002 to 0.004 | 20.5 | <0.001 | 41.3 | 4.1% | 1.6% |
| medium | 0.001 | 57.2 | −0.001 to 0.003 | 1.0 | 0.314 | 57.8 | 1.7% | 0.1% | |
| high | 0.003 | 75.7 | −0.000 to 0.006 | 3.0 | 0.082 | 77.2 | 0.9% | −2.8% | |
| C2 | low | −0.001 | 25.5 | −0.002 to 0.000 | 4.2 | 0.041 | 25.0 | −1.0% | 2.0% |
| medium | −0.003 | 34.9 | −0.004 to −0.001 | 17.6 | <0.001 | 33.4 | −2.4% | 3.1% | |
| high | −0.004 | 43.9 | −0.006 to −0.003 | 29.6 | <0.001 | 41.7 | −5.2% | −3.4% | |
| C3 | low | 0.000 | 5.0 | 0.000 | 7.6 | 0.006 | 5.2 | 3.9% | 5.6% |
| medium | 0.000 | 10.4 | −0.001 | 3.8 | 0.051 | 10.2 | −1.0% | 2.0% | |
| high | 0.000 | 15.5 | −0.001 | 0.8 | 0.374 | 15.4 | −0.8% | −3.4% | |
| C4 | low | 0.000 | 0.9 | 0.000 | 0.7 | 0.397 | 0.9 | 3.0% | 8.9% |
| medium | 0.000 | 2.0 | 0.000 | 0.6 | 0.445 | 2.0 | 1.8% | 2.3% | |
| high | 0.000 | 3.8 | 0.000 | 7.6 | 0.006 | 3.7 | −5.0% | −10.6% | |
| C5 | low | 0.000 | 0.6 | 0.000 | 1.0 | 0.328 | 0.6 | −0.4% | −0.7% |
| medium | 0.000 | 1.5 | 0.000 | 0.1 | 0.717 | 1.5 | −1.0% | 3.8% | |
| high | 0.000 | 2.7 | 0.000 | 5.1 | 0.025 | 2.8 | 4.0% | 4.5% | |
| C5DC | low | 0.000 | 0.4 | 0.000 | 18.0 | <0.001 | 0.4 | −5.6% | −6.2% |
| medium | 0.000 | 0.7 | 0.000 | 15.2 | <0.001 | 0.7 | −4.2% | 0.9% | |
| high | 0.000 | 1.8 | 0.000 | 31.7 | <0.001 | 1.7 | −10.8% | −14.2% | |
| C5OH | low | 0.000 | 0.8 | 0.000 | 0.1 | 0.778 | 0.8 | 0.7% | 5.9% |
| medium | 0.000 | 1.2 | 0.000 | 0.1 | 0.706 | 1.2 | −0.5% | 6.9% | |
| high | 0.000 | 1.7 | 0.000 | 1.3 | 0.258 | 1.7 | 0.8% | 4.9% | |
| C6 | low | 0.000 | 0.5 | 0.000 | 3.5 | 0.064 | 0.5 | 3.9% | 5.4% |
| medium | 0.000 | 0.9 | 0.000 | 0.2 | 0.660 | 0.9 | 4.6% | 7.0% | |
| high | 0.000 | 2.1 | 0.000 | 1.5 | 0.215 | 2.0 | 0.5% | 6.3% | |
| C8 | low | 0.000 | 0.6 | 0.000 | 1.1 | 0.306 | 0.6 | −1.7% | −6.0% |
| medium | 0.000 | 1.1 | 0.000 | 0.4 | 0.506 | 1.1 | 4.4% | 5.3% | |
| high | 0.000 | 2.8 | 0.000 | 1.6 | 0.204 | 2.7 | −0.8% | −8.0% | |
| C10 | low | 0.000 | 0.4 | 0.000 | 0.1 | 0.729 | 0.4 | 5.7% | 6.3% |
| medium | 0.000 | 1.1 | 0.000 | 0.4 | 0.513 | 1.1 | 0.3% | 11.1% | |
| high | 0.000 | 2.2 | 0.000 | 1.3 | 0.250 | 2.2 | −2.8% | −0.9% | |
| C12 | low | 0.000 | 0.4 | 0.000 | 22.7 | <0.001 | 0.4 | 8.2% | 10.6% |
| medium | 0.000 | 0.7 | 0.000 | 25.0 | <0.001 | 0.7 | 9.6% | 14.9% | |
| high | 0.000 | 1.5 | 0.000 | 21.2 | <0.001 | 1.6 | 4.7% | 5.5% | |
| C14 | low | 0.000 | 0.6 | 0.000 | 0.0 | 0.975 | 0.6 | −0.4% | −0.7% |
| medium | 0.000 | 1.7 | 0.000 | 4.7 | 0.032 | 1.7 | 4.9% | 6.6% | |
| high | 0.000 | 3.3 | 0.000 | 6.2 | 0.013 | 3.4 | 1.4% | −1.6% | |
| C16 | low | 0.000 | 4.7 | 0.000 | 3.1 | 0.077 | 4.8 | 3.1% | 9.4% |
| medium | 0.000 | 8.5 | 0.000 | 0.0 | 0.962 | 8.5 | 3.0% | 8.3% | |
| high | 0.001 | 11.7 | 0.000 to 0.001 | 4.4 | 0.036 | 12.0 | 4.4% | 3.2% | |
| C18 | low | 0.000 | 1.9 | 0.000 | 2.9 | 0.090 | 1.9 | 0.6% | −0.8% |
| medium | 0.000 | 3.0 | 0.000 | 0.0 | 0.878 | 3.0 | −0.9% | 3.5% | |
| high | 0.000 | 6.1 | 0.000 to 0.001 | 6.9 | 0.009 | 6.3 | 3.4% | 1.4% |
| Analyte | Level | ρ | 95% Confidence Interval | p |
|---|---|---|---|---|
| Phe | low | 0.32 | 0.22 to 0.42 | <0.001 |
| medium | 0.27 | 0.17 to 0.37 | <0.001 | |
| high | 0.28 | 0.18 to 0.38 | <0.001 | |
| Leu | low | 0.35 | 0.26 to 0.44 | <0.001 |
| medium | 0.22 | 0.12 to 0.32 | <0.001 | |
| high | 0.20 | 0.10 to 0.30 | <0.001 | |
| Met | low | 0.05 | −0.05 to 0.16 | N.S |
| medium | −0.08 | −0.18 to 0.03 | N.S | |
| high | −0.12 | −0.23 to -0.01 | 0.027 | |
| Tyr | low | 0.13 | 0.02 to 0.24 | 0.016 |
| medium | 0.16 | 0.05 to 0.26 | 0.005 | |
| high | 0.13 | 0.02 to 0.23 | 0.022 | |
| Val | low | 0.20 | 0.10 to 0.31 | <0.001 |
| medium | 0.15 | 0.04 to 0.25 | 0.007 | |
| high | 0.16 | 0.05 to 0.26 | 0.004 | |
| Cit | low | 0.19 | 0.08 to 0.29 | <0.001 |
| medium | 0.07 | −0.04 to 0.18 | N.S | |
| Arg | low | 0.26 | 0.16 to 0.36 | <0.001 |
| high | −0.78 | −0.82 to -0.73 | <0.001 | |
| C0 | low | 0.24 | 0.14 to 0.34 | <0.001 |
| medium | 0.06 | −0.05 to 0.16 | N.S | |
| high | 0.10 | −0.01 to 0.20 | N.S | |
| C2 | low | −0.11 | −0.22 to 0.00 | 0.041 |
| medium | −0.23 | −0.33 to -0.12 | <0.001 | |
| high | −0.29 | −0.38 to -0.19 | <0.001 | |
| C3 | low | 0.15 | 0.04 to 0.25 | 0.006 |
| medium | −0.11 | −0.21 to 0.00 | 0.051 | |
| high | −0.05 | −0.16 to 0.06 | 0.374 | |
| C4 | low | −0.05 | −0.15 to 0.06 | 0.397 |
| medium | −0.04 | −0.15 to 0.07 | 0.445 | |
| high | −0.15 | −0.25 to -0.04 | 0.006 | |
| C5 | low | 0.05 | −0.05 to 0.16 | N.S |
| medium | −0.02 | −0.13 to 0.09 | N.S | |
| high | 0.12 | 0.02 to 0.23 | 0.025 | |
| C5DC | low | −0.23 | −0.33 to -0.12 | <0.001 |
| medium | −0.21 | −0.31 to -0.11 | <0.001 | |
| high | −0.30 | −0.39 to -0.20 | <0.001 | |
| C5OH | low | 0.02 | −0.09 to 0.12 | N.S |
| medium | −0.02 | −0.13 to 0.09 | N.S | |
| high | 0.06 | −0.05 to 0.17 | N.S | |
| C6 | low | −0.10 | −0.21 to 0.01 | N.S |
| medium | −0.02 | −0.13 to 0.08 | N.S | |
| high | −0.07 | −0.18 to 0.04 | N.S | |
| C8 | low | −0.06 | −0.16 to 0.05 | N.S |
| medium | 0.04 | −0.07 to 0.14 | N.S | |
| high | −0.07 | −0.18 to 0.04 | N.S | |
| C10 | low | 0.02 | −0.09 to 0.13 | N.S |
| medium | −0.04 | −0.14 to 0.07 | N.S | |
| high | −0.06 | −0.17 to 0.04 | N.S | |
| C12 | low | 0.25 | 0.15 to 0.35 | < 0.001 |
| medium | 0.27 | 0.16 to 0.36 | < 0.001 | |
| high | 0.25 | 0.14 to 0.35 | < 0.001 | |
| C14 | low | 0.00 | −0.11 to 0.11 | N.S |
| medium | 0.12 | 0.01 to 0.22 | 0.032 | |
| high | 0.14 | 0.03 to 0.24 | 0.013 | |
| C16 | low | 0.10 | −0.01 to 0.20 | N.S |
| medium | 0.00 | −0.11 to 0.11 | N.S | |
| high | 0.12 | 0.01 to 0.22 | 0.036 | |
| C18 | low | 0.09 | −0.01 to 0.20 | N.S |
| medium | 0.01 | −0.10 to 0.12 | N.S | |
| high | 0.14 | 0.04 to 0.25 | 0.009 |
| Study | This Study | Adam et al. | Golbahar et al. |
|---|---|---|---|
| Publication year | 2021 | 2011 | 2014 |
| Method | real-time monitoring | accelerated degradation study | accelerated degradation study |
| Analytes | 7 AAs, 14 ACs | 7 AAs, 18 ACs, 8 hormones and metabolites | 7AAs, 10 ACs |
| Study length | 778 days | 35 days | 8 days |
| Compared temperature | −20 °C | 37 °C | 37 °C |
| Compared humidity | <30% | >50% | >70% |
| Compared analytes | 7 AAs, 9 ACs | ||
| most sensitive analytes | Arg, Phe, Leu | Arg, C2, C3 | Met, Tyr, Arg |
| least sensitive analytes | C5OH, C6, C8, C10 | Val, C5, C16, C18 | C0, C5, Phe |
| Reference | [17] | [20] | |
Publisher’s Note: MDPI stays neutral with regard to jurisdictional claims in published maps and institutional affiliations. |
© 2021 by the author. Licensee MDPI, Basel, Switzerland. This article is an open access article distributed under the terms and conditions of the Creative Commons Attribution (CC BY) license (https://creativecommons.org/licenses/by/4.0/).
Share and Cite
Lee, H.-S. Arginine, as a Key Indicator for Real-Time Stability Monitoring of Quality Control in the Newborn Screening Test Using Dried Blood Spot. Separations 2021, 8, 201. https://doi.org/10.3390/separations8110201
Lee H-S. Arginine, as a Key Indicator for Real-Time Stability Monitoring of Quality Control in the Newborn Screening Test Using Dried Blood Spot. Separations. 2021; 8(11):201. https://doi.org/10.3390/separations8110201
Chicago/Turabian StyleLee, Hyun-Seung. 2021. "Arginine, as a Key Indicator for Real-Time Stability Monitoring of Quality Control in the Newborn Screening Test Using Dried Blood Spot" Separations 8, no. 11: 201. https://doi.org/10.3390/separations8110201