Article

Hemp Chemotype Definition by Cannabinoids Characterization Using LC-ESI(+)-LTQ-FTICR MS and Infrared Multiphoton Dissociation

1
Department of Sciences, University of Basilicata, Via dell’Ateneo Lucano 10, 85100 Potenza, Italy
2
Gnosis Bioresearch by Lesaffre, Pisticci, 75015 Matera, Italy
3
Department of European Cultures (DICEM), University of Basilicata, 75100 Matera, Italy
4
Department of Geography, Environmental Management and Energy Studies, University of Johannesburg, Johannesburg 2092, South Africa
*
Author to whom correspondence should be addressed.
Separations 2021, 8(12), 245; https://doi.org/10.3390/separations8120245
Submission received: 15 November 2021 / Revised: 7 December 2021 / Accepted: 10 December 2021 / Published: 13 December 2021
(This article belongs to the Section Analysis of Natural Products and Pharmaceuticals)

Abstract

:
The development and application of advanced analytical methods for a comprehensive analysis of Cannabis sativa L. extracts plays a pivotal role in order to have a reliable evaluation of their chemotype definition to guarantee the efficacy and safety in pharmaceutical use. This paper deals with the qualitative and quantitative determination of cannabidiol (CBD), tetrahydrocannabinol (THC), cannabinol (CBN), tetrahydrocannabivarin (THCV), cannabidivarin (CBDV), and cannabigerol (CBG) based on a liquid chromategraphy-mass spectrometry (LC-MS) method using electrospray ionization in positive mode (ESI+), coupled with a hybrid quadrupole linear ion trap (LTQ) and Fourier transform ion cyclotron resonance mass spectrometer (FTICR-MS). For the first time, structural information of phytocannabinoids is available upon precursor ions’ isolation within the FTICR trapping cell and subsequent fragmentation induced by infrared multiphoton dissociation (IRMPD). Such fragmentation and accurate mass measurement of product ions, alongside collision-induced dissociation (CID) within LTQ, was advantageous to propose a reliable fragmentation pattern for each compound. Then, the proposed LC-ESI(+)-LTQ-FTICR MS method was successfully applied to the hemp chemotype definition of three registered Italian accessions of hemp C. sativa plants (Carmagnola C.S., Carmagnola, and Eletta Campana), thus resulting in the Eletta Campana accession being the best one for cannabis product manufacturing.

1. Introduction

Cannabis contains a unique class of compounds known as phytocannabinoids. They are meroterpenoid compounds whose structure has a resorcynil core typically decorated with a para-oriented isoprenyl, alkyl, or aralkyl side chain [1]. In the past decade, the interest in these molecules has exponentially increased thanks to discovering the human endocannabinoid system, whose receptors (CBx) could be activated by both endogenous cannabinoids and phytocannabinoids [2,3]. To date, almost 150 different phytocannabinoids have been identified in hemp (Cannabis sativa L.) [4,5,6]. The most detected ones are Δ9-tetrahydrocannabinol (THC), a psychoactive compound able to act as a partial agonist of human CBx; cannabidiol (CBD), an anti-psychoactive compound, able to inhibit the effect of THC; cannabinol (CBN), the primary degradation product of THC, which bioavailability decreases [7]. In addition to THC, CBD, and CBN, pharmacological interest has also been attributed to cannabigerol (CBG), the molecular precursor of THC and CBD, and ∆9-tetrahydrocannabivarin (THCV) and cannabidivarin (CBDV), their propyl analogs [8,9,10]. Recently, reports have speculated over the change in the quality of cannabis products, from nearly a decade, specifically concerning the increase in cannabinoid content [11]. The amount of THC, in conjunction with CBD and CBN, determines the strength or potency of the cannabis product. CBDV, THCV, and CBG profiles also affect the hemp chemotype definition; however, their contributions have not been studied widely to date, and likely for this reason, their content cannot be used to predict accurate chemotype, as well as CBD, THC, and CBN amounts, can be [12]. Chemically, based on CBD/THC ratio, hemp exists in two different principal types. The first one is defined as drug-type (or marijuana) due to its low CBD/THC ratio (<3), and it is used for medical or recreational purposes. The second one is called fiber-type, which has a high CBD/THC ratio (>10) due to the low level of THC, and it is used for its culinary value or in industrial applications [11,13]. As only fiber-type hemp can be legally sold, bought, consumed, and shipped, it is essential to determine the abundance of different cannabinoids to identify the chemotype in each plant destined for industrial production and human consumption [14]. Unfortunately, drug-type plants are not morphologically distinguishable from fiber-type [15]. For these reasons, the accurate method to identify the hemp chemotypes at the molecular level is essential. The recommended methods for the identification and analysis of Cannabis components are listed in the UNODC guidelines [16,17]: gas chromatography coupled with mass spectrometry (GC-MS) or with flame ionization detector (GC-FID) usually require cannabinoids derivatization (i.e., silylation); ion mobility spectrometry (IMS) is not the method of choice because problems with the separation from heroin signals and humidity have been noted; high-performance liquid chromatography with diode array detection (HPLC-DAD) suffers from low sensitivity and specificity; stable isotope ratio-mass spectrometry (IRMS) gives meaningful results only when authentic cannabis reference material (of known origin) is available. Therefore, the development and application of more advanced analytical methods compared to UNODC ones represent a pivotal role in order to have a reliable evaluation of C. sativa L. plants chemotyping to guarantee their efficacy and safety in pharmaceutical use. In this regard, several works in the literature report the successful application of specific and sensitive high-resolution MS (HRMS) to study, in higher plants, the profile, and distribution of pharmacologically interesting components [18,19,20,21,22,23,24,25,26,27,28], including cannabinoid compounds [10,29,30]. Structural information may be gathered by tandem mass spectrometry (MS/MS), which is conventionally performed through collision-induced dissociation (CID) [29] but, to the best of our knowledge, there is no study regarding the use of infrared multiphoton dissociation (IRMPD) as fragmentation mass spectrometry technique for Cannabis components.
Here, for the identification and quantification of CBD, THC, CBN, CBDV, THCV, and CBG, we developed a sensitive and specific method, as a promising alternative to UNODC ones, based on liquid chromatography-electrospray ionization-hybrid linear ion trap with Fourier transformation cyclotron resonance mass spectrometry (LC-ESI-LTQ-FTICR MS), and tandem MS, performed by infrared multiphoton dissociation (IRMPD) and collision-induced dissociation (CID) within ICR trapping cell and LTQ, respectively. In addition, quantification of these compounds and their relative balance, in terms of THC/CBD, CBN/THC, and (THC+CBN)/CBD ratios, in the flowers of three registered Italian accession of hemp plants (Carmagnola C.S., Carmagnola, and Eletta Campana), were also carried out to define plant chemotype for industrial-scale production of derived products (e.g., food supplements and herbal extracts).

2. Materials and Methods

2.1. Chemicals and Reagents

Methanolic solutions of cannabidiol (CBD, 1.0 mg mL−1), cannabinol (CBN, 1.0 mg mL−1), and Δ9-tetrahydrocannabinol (THC, 1.0 mg mL−1), cannabidivarin (CBDV, 1.0 mg mL−1), Δ9-tetrahydrocannabivarin (THCV, 1.0 mg mL−1), and cannabigerol (CBG, 1.0 mg mL−1) were purchased from HPC Standard GmbH (Cunnersdorf, Deutschland) and stored at −20 °C. Methanol, acetonitrile, and formic acid (99%) used for chromatographic separation had LC-MS grade and were obtained from Sigma-Aldrich (Steinheim, Germany). Ethanol (96.0%) was purchased from Sigma-Aldrich (Steinheim, Germany). Ultrapure water was produced using a Milli-Q RG system from Millipore (Bedford, MA, USA). Pure nitrogen (99.996%) was delivered to the LC-MS system as sheath gas. The ion-trap pressure was maintained with helium 99.999%, which was used for trapping and collisional activation of the trapped ions.

2.2. Preparation of Standard Solutions

Stock solutions of CBD, THC, CBN, CBDV, THCV, and CBG were prepared by diluting standard methanolic solutions with methanol/acetonitrile 50:50 (v/v) and were analyzed in triplicate using the HPLC conditions described above. Calibration curves were obtained in the concentration ranges of 0.001–50 mg/L for each compound. Quantification of cannabinoids, and thus chemovar definition, was performed by the external-standard method. According to official methods, the peak area ratio of each standard cannabinoid was plotted versus the analyte concentration [16,17,31,32]. Values are expressed in percentage of analyte per 100 g of dry weight (%), with standard deviation (SD) calculated for n = 3 replicates.

2.3. Phytocannabinoids Extraction and Sample Preparation

Samples of various registered Cannabis chemotypes were kindly supplied by Italian farmers: Carmagnola C.S., Carmagnola, and Eletta Campana. Airdried in the darkness, flowers of fiber-type cultivar C. sativa (40 mg) were extracted by maceration with 4 mL of ethanol and 15 min of sonication at 65 °C. The obtained extract was then transferred into sterile Eppendorf vials and centrifuged for 10 min at 6000× g (Hettich Zentrifuge, MIKRO220R, Tuttlingen, Germany) to clarify the liquid phase. According to official extraction methods, a volume of 1 mL of the supernatant was diluted at 1:20 (v/v) and analyzed in triplicate [16,17,31,32].

2.4. LC-ESI-LTQ-FTICR MS Analyses

All experiments were performed using a Surveyor LC system coupled to a hybrid LTQ-FTICR (7-Tesla) mass spectrometer (Thermo Fisher Scientific, Bremen, Germany), equipped with a 20-W CO2-laser (Synrad, Mukilteo, WA, USA; 10.6 mm). LC separation was performed on a Discovery C18 column, 250 × 4.6 mm i. d., 5 µm particle size, equipped with a Discovery C18 20 × 4 mm i. d. security guard cartridge (Supelco Inc., Bellefonte, PA, USA) using a mobile phase consisting of 0.1% formic acid in water (solvent A) and 0.1% formic acid in ACN (solvent B). A 25 µL sample loop was employed for injection. The following elution program was used: 0–17 min from 35%:65% (A:B, v/v) to 5%:95%, 17–22 min from 5%:95% to 5%:95%, 22–24 min from 5%:95% to 35%:65% [33]. Analyses were performed at 45 °C at a flow rate of 1.0 mL/min, split 4:1 after the analytical column to allow 200 mL/min to enter the ESI source. Positive electrospray ionization (ESI+) was chosen for the detection of cannabinoids. The LTQ and FTICR mass spectrometers were calibrated according to the manufacturer’s instructions using a solution of sodium dodecyl sulfate (m/z 265) and sodium taurocholate (m/z 514).
Mass spectrometric conditions were optimized by direct infusion of cannabinoid standard solutions. The instrument was tuned to facilitate the ionization process and to achieve the highest sensitivity: the spray voltage was set at 4.60 kV; the temperature of the ion transfer tube was set at 350 °C, and the applied voltage was set at −28 V. The sheath gas (N2) flow rate used was 80 arbitrary units (a.u.). The auxiliary gas was set to zero. Full-scan experiments were performed in the ICR trapping cell in the range m/z 50–1000, and mass spectra were acquired as profile data at a resolving power of 100,000 full widths at half maximum (FWHM) at m/z 400. The automatic gain control ion population target in full-scan MS was 5,000,000 for FTICR MS. The maximum ion injection time was 200 ms for FTICR.
The isolation window of the ICR cell that filters the precursor ions was set at ±0.0010 units around each targeted molecule. IRMPD fragmentation of precursors was optimized by varying the irradiation time (millisecond, ms) at 100% of laser power. Instead, CID fragmentation was performed at normalized collision energy (NCE) ranging from 20 to 50 eV. Detection was based on calculated [M+H]+ molecular ions with accurate mass measurements, retention time comparison, and fragments match (m/z and intensity). Quantification and semi-quantification were performed by the external-standard method. Data were collected in full MS scan mode and processed post-acquisition to reconstruct the elution profile for the ions of interest, with a given m/z value and tolerance. Data acquisition was accomplished by using the Xcalibur software package (version 2.0.7 Thermo Electron). The raw chromatographic data were imported, elaborated, and plotted by SigmaPlot 12.5 (Systat Software, Inc., London, UK).

3. Results

3.1. Cannabinoids Profile by LC-ESI(+)-LTQ-FTICR MS Analysis and IRMPD/CID Mass Fragmentation Characterization

A FTICR trapping cell provides a very selective eXtracted Ion Chromatogram (XICs) with a tight mass-to-charge ratio window of ±0.0010 units around each targeted molecule (i.e., [M–H]+ ± 1.0 mDa). The benefit of using XICs by FTICR MS concerns reducing the signal complexity of the total ion current (TIC) trace, allowing us to distinguish cannabinoid compounds. Figure 1 shows XICs of three known cannabinoids, occurring in the registered accession Eletta Campana of Cannabis sativa L. sp.: CBDV (C19H27O2+, m/z 287.20080); THCV (C19H27O2+, m/z 287.20027); CBG (C21H33O2+, m/z 317.24764); CBD (C21H31O2+, m/z 315.23190); THC (C21H31O2+, m/z 315.23184); CBN (C21H27O2+, m/z 311.20071). The identification of precursor ions was accomplished from accurate mass measurements with a mass error of 0.84, 1.01, 0.42, 0.95, 0.063, and 0.48 ppm for CBDV, THCV, CBG, CBD, THC, and CBN, respectively (Table 1).
Since isobaric compounds are prevalent in the cannabinoids class, occurring in complex matrices, to confirm their identification, tandem MS experiments were performed. To gain structural information of naturally occurring cannabinoids, in addition to CID within LTQ, IRMPD fragmentation mass spectrum in the FTICR cell was acquired. The analytical utility of performing IRMPD on a given precursor ion population is demonstrated by structural characterization of pharmacologically interesting components in higher plants [18,21,22,23,24]. To a great extent, the photo-fragmentation behavior of IRMPD is almost similar to the CID of selected ions, where dissociation occurs with low-energy pathways. Yet IRMPD is preferred over CID because no collision gas needs to be introduced into the ICR cell, thus facilitating accurate mass identification and streamlining product ion assignment with the high-resolution FTICR MS.
Moreover, the main advantage of using IRMPD is that as a non-resonant method, all trapped ions and all ensuing product ions are excited using IR irradiation. As a result, the formation of secondary and higher-order fragments, which can provide further structural information to that obtained in the single resonant collisional activation experiment of the CID method, can be observed [23,34]. In addition, since CID and IRMPD can be performed with the same instrument, the analysis of cannabinoids can be streamlined and performed without extensive sample handling and dispersal. In this work, IRMPD fragmentation of precursor ions [M+H]+, alongside CID product ions, generated several common species that are diagnostically useful for establishing their identity as Cannabis components.
CBD at m/z 315.23190 (peak 4 in Figure 1) presented an IRMPD fragment-rich spectrum (Figure 2). The most relevant product ions derived from the bond breakage on the terpene moiety rather than on side alkyl chain, according to literature data on cannabinoid deuterated standards [29]: m/z 259.16926 was originated from the loss of four carbon units from the terpene moiety; m/z 235.16906 corresponded to the breakage of the terpene with only four carbon units of this moiety left; m/z 193.12227, which is the base peak, corresponding to olivetol with the carbon unit attached to C2 of the benzene ring; and m/z 181.1223 was assigned to the resorcinol moiety (olivetol in this specific case). The complementary ion of the fragment at m/z 181.1223 was the signal at m/z 135.11679, obtained after the cleavage of the bond between the aromatic and the cyclohexenyl moiety, combined with a hydrogen shift [35]. According to this fragmentation mechanism, the signals at accurate m/z 273.18463, 245.15364, 233.15.364, 231.137784, and 207.13784 were tentatively attributable to the olivetol derivative ions, with ppm error of 1.03, 0.13, 0.14, 0.50, and 0.60, respectively (Table 1). The ion at m/z 227.14276 (1.23 ppm) was present in both IRMPD MS/MS and CID MS3 mass spectra (Figure S1), thus suggesting the loss of alkyl chain from dehydrated ion at m/z 297, and this hypothesis was also confirmed by the presence of a signal at m/z 171 (MS4) and 143 (MS5), thus suggesting the following fragmentation path: 297 > 227 > 171 > 143 (Figure S1). Finally, the product ions at accurate m/z 175.07533 (0.20 ppm), 123.04402 (0.37 ppm), and 111.04400 (0.54 ppm) were assigned to structures containing the more stable aromatic group of CBD, containing both oxygen atoms. The confirmation of m/z 175.07533 ion structure was based on CID MS3 and MS4 mass spectra, which showed the following path: 259 > 231 > 175 (Figure S1). The possible fragmentation patterns of CBD can be proposed, as shown in Figure 3.
THC at m/z 315.23184 (peak 5 in Figure 1) elutes after CBD and CBN due to the loss of a free hydroxyl group and the formation of the dihydropyran ring, which confers higher lipophilicity. THC spectrum in positive mode (Figure 2B) is very similar to CBD, thus confirming the most recent literature data [29,36]. In this case, only the retention time can indicate the identity of the molecule through the comparison with the retention time of corresponding standard compounds. All product ions were identified with an error less than 0.40 ppm (Table 1), and their structures were reported in Figure 3.
CBN at m/z 311.20056 (peak 6 in Figure 1) elutes after CBD due to the presence of an additional pyran ring, which confers higher lipophilicity, but before THC for the presence of aromaticity responsible for a higher polarity compared to the simple cyclohexane. IRMPD ESI(+) fragmentation spectrum in Figure 4 is elementary. Because of the stability of the aromatic ring, this molecule fragments much differently than the other cannabinoids. The C-C bond between two benzene rings is stronger (more difficult to break) than the C-C bond between a benzene ring and a terpene moiety [29,37]. The base peak at nominal m/z 293 (accurate m/z 293.19000; 0.034 ppm), due to water loss, was observed as the most prominent product ion, in both the CBN CID (MS2) spectra (Figure S2) and IRMPD-MS/MS spectra (Figure 4). The presence of signals at m/z 223 and 195 in the CID MS3 and CID MS4 spectra (Figure S2), respectively, suggested that these product ions derived from the sequential losses of pentyl lateral chain and two methyl groups of dehydrated CBN (Figure 5). In detail, the structures were assigned with mass errors of 0.76 ppm and 0.31 ppm for ions at m/z 223.11191 and 195.08050, respectively. IRMPD also promoted the benzopyran ring-opening of CBN, resulting in the diagnostic product ions at m/z 265.21632 (0.41 ppm), already reported in the literature [29]. A higher intensity fragment at m/z 241.1206 (0.87 ppm) is formed by cleavage of the aliphatic 5-carbon chain from the precursor ion [37]. Finally, the ions at m/z 283.16900 (0.92 ppm) and 269.15382 (0.80 ppm) were tentatively attributed to central ring rearrangements through accurate mass measurements (Table 1). Comparing the ESI-MSn data with that from IRMPD-MS/MS experiments, the possible fragmentation patterns of CBN can be proposed, as shown in Figure 5.
IRMPD FTICR analysis was also very useful for identifying CBDV (peak 1 in Figure 1) and THCV (peak 2 in Figure 1). The elution order of CBDV (7.4 min) and THCV (10.3 min) compared to CBD (9.6 min) and THC (13.6 min), respectively, agreed with the length of their side chains: the retention times increased from the propyl to the pentyl homologs, most likely due to the increasing lipophilicity of the molecule. As shown in Figure 6, the compounds at nominal m/z 287 differ exactly by a –CH2-CH3 unit (28.03130 amu) from the corresponding pentyl homologs (CBD and THC), not only for the molecular ion [M+H]+ but also for all fragment ions, except for signals at nominal m/z 111, 123, 135, 175 and 227, corresponding to constant terpenic portion. The identification of all product ions was reached with mass errors less than 1.15 and 1.22 ppm for CBDV and THCV, respectively (Table 1).
Finally, CBG (peak 3 in Figure 1) elutes very close to CBD because of the open isoprenoid chain’s slightly higher lipophilicity than the closed limonene moiety. It has an elementary fragmentation positive ESI IRMPD spectrum (Figure 7, Table 1). The molecular ion [M+H]+ at m/z 317.24764 (0.42 ppm) breaks to give three product ions, already found in the IRMPD mass spectra of its two derivatives CBD and THC (Figure 2): the base peak at m/z 193.12207 (1.18 ppm), corresponding to the olivetol moiety with the ortho-methyl group (Figure 7), the ions at m/z 207.13784 (0.60 pm) and 123.04392 (1.11 ppm).

3.2. Quantitative Analysis of CBD, THC and CBD and Chemotype Definition

The proposed LC-ESI(+)-LTQ-FTICR MS method was successfully applied for the quantitative analysis of three major cannabinoids (THC, CBD, CBN), occurring in Carmagnola C.S., Carmagnola and Eletta Campana extracts, to have a good understanding of their chemical profile, which might affect the overall biological activity of the hemp [35,38]. As reported in Table 2, CBD % was the most abundant cannabinoid: 1.991 ± 0.002 g/100 g dw, 1.387 ± 0.003 g/100 g dw, and 0.897 ± 0.002 g/100 g dw, for Eletta Campana, Carmagnola, and Carmagnola C.S., respectively. To follow, THC % ranged between 0.053 ± 0.001 and 0.111 ± 0.003 g/100 g dw and CBN % between 0.007 ± 0.002 and 0.011 ± 0.001 g/100 g dw. Hemp’s legal cultivation is allowed only for fiber varieties (fiber-type) with THC content below psychoactive level. Thus, the cultivation of industrial hemp requires tight control of high THC-containing plants (drug-type) [15]. The differentiation between drug-type and fiber-type plants does not rely on the chemical characterization but on context-related elements. The total THC content is used to define fiber-type cannabis (the current upper legal limit for industrial hemp of 0.2 percent THC and 0.3 percent THC, respectively, in Europe and Canada). Table 2 reported the obtained results. All three accessions did not exceed the European Union regulations regarding the THC limit of 0.2%: the values of 0.053 ± 0.001 g/100 g dw, 0.105 ± 0.002 g/100 g dw, and 0.111 ± 0.003 g/100 g dw were found for Carmagnola C.S., Carmagnola, and Eletta Campana, respectively. Another simple way of distinguishing between drug-type and fiber-type cannabis is by using the ratio of the main cannabinoids THC, CBN, and CBD. If (THC + CBN)/(CBD) < 1, then the cannabis plant is considered to be fibre-type. If the ratio is >1, it is viewed as a drug type. Because THC is oxidized partly to CBN after cutting and drying the plant material, the sum of the peak area of THC and CBN is used and divided by the area of CBD. Therefore, the CBD/THC and (THC + CBN)/CBD ratios have been calculated on the herbal cannabis data to identify chemotypes tentatively [16]. The ratios (THC + CBN)/CBD were less than 0.084 ± 0.002, and chemotype indexes CBD/THC were larger than 17.937 ± 0.485 (upper limit is 10), thus resulting fiber-type.
In parallel, the freshness of hemp samples was evaluated by measuring the relative concentration of CBN to THC. It can be considered that a “fresh”, i.e., less than six months, hemp sample has a CBN/THC ratio below 0.013. This situation is typical of drug-type plants produced illegally by consumers who grow their cannabis in small apartments or sizeable indoor cannabis farms [11]. In Table 2, the ratios CBN/THC were larger than 0.063 ± 0.018, thus suggesting our hemp samples’ low drug-potency and suitability for human consumption and market.
Although the three accessions showed comparable cannabinoid content, Eletta campana accession showed a sensible higher content in CBD, leading to a higher value of the chemotype index, and it has been chosen for further investigations because it seems to be the most promising one for industrial-scale production of derived products (e.g., food supplements and herbal extracts).
Literature data showed that healthy proprieties of Cannabis extracts depend mainly on CBD, THC, and CBN levels, but also on non-classical phytocannabinoid content, thus stressing the need to quantify all other factors phytocannabinoids in our extracts [9]. Therefore, in addition to THC, CBD, and CBN content, the concentration levels of CBDV, THCV, and CBG, previously identified by using IRMPD FTICR, was quantified in selected Eletta campana accession: they were found at trace levels, ranging from 0.051 ± 0.001 to 0.153 ± 0.003 g/100 g dw. Future work is needed to elucidate the roles and mechanisms of these differing Cannabis components concerning potential anticonvulsant properties.

4. Conclusions

In this study, a LC-ESI-LTQ-FTICR MS method was developed for the unambiguous identification of CBD, THC, CBN, CBDV, THCV, and CBG, occurring in several registered accessions of Italian hemp plants, i.e., Carmagnola C.S., Carmagnola, and Eletta Campana, all belonging to C. sativa. In detail, the characterization of cannabinoids was performed by using the CID-MSn (n = 2–5) and IRMPD-MS/MS. Both fragmentation techniques CID and IRMPD provide complementary information for the identification of all Cannabis components belonging to the cannabinoid class. Thanks to multistage CID, it was possible to understand in deep fragmentation pathway. Thanks to accurate mass measurements obtained by use of the IRMPD-FTICR mass spectrometer, it was possible to elucidate the structures of product ions. All of the precursor and product ions were determined with errors of less than two ppm. However, isobaric ions with the same IRMPD fragmentation behavior, i.e., CBD/CBDV and THC/THCV, were distinguished based on comparison with retention times of standard compounds. Finally, the quantitative determinations have revealed that the chemical phenotype of Eletta campana is the most interesting for industrial-scale productions because of the higher content in CBD and higher chemotypic index (CBD/THC). The proposed LC-ESI(+)-LTQ-FTICR MS method was successfully applied for the hemp chemotype definition of hemp plants.
Since cannabinoids classes cover a broad range of compounds, future works are needed for the comprehensive characterization of the chemical profile of cannabis varieties. However, the high sensitivity of the FTICR IRMPD MS can enable the identification of a reasonable number of molecules, even when present in very small traces.

Supplementary Materials

The following are available online at https://www.mdpi.com/article/10.3390/separations8120245/s1, Figure S1: CID-MSn spectra of ion at m/z 315. Relative collision energies ranging from 25% to 35% were applied, Figure S2: CID-MSn spectra of ion at m/z 311. Relative collision energies ranging from 25% to 35% were applied.

Author Contributions

Conceptualization, S.A.B., L.S. and F.L.; Biological data curation, L.S.; Chemical data curation F.L., R.P. and G.B.; Formal data reviewing, F.L. and R.P.; Methodology, F.L. and S.A.B.; Resources, S.A.B.; Writing—original draft, F.L.; Writing—review and editing, S.A.B. and R.P. All authors have read and agreed to the published version of the manuscript.

Funding

This research received no external funding.

Institutional Review Board Statement

Not applicable.

Informed Consent Statement

Not applicable.

Data Availability Statement

Not applicable.

Acknowledgments

We are grateful to the BIOMON internal fund for its economic support.

Conflicts of Interest

The authors declare no conflict of interest.

References

  1. Hanuš, L.; Meyer, S.; Muñoz, E.; Taglialatela-Scafati, O.; Appendino, G. Phytocannabinoids: A unified critical inventory. Nat. Prod. Rep. 2016, 33, 1357–1392. [Google Scholar] [CrossRef] [PubMed] [Green Version]
  2. Crocq, M. History of cannabis and the endocannabinoid system. Dialogues Clin. Neurosci. 2020, 22, 223–228. [Google Scholar] [CrossRef] [PubMed]
  3. Marco, E.; Laviola, G. The endocannabinoid system in the regulation of emotions throughout lifespan: A discussion on therapeutic perspectives. J. Psychopharmacol. 2012, 26, 150–163. [Google Scholar] [CrossRef]
  4. Citti, C.; Linciano, P.; Russo, F.; Luongo, L.; Iannotta, M.; Maione, S.; Laganà, A.; Capriotti, A.; Forni, F.; Vandelli, M.; et al. A novel phytocannabinoid isolated from Cannabis sativa L. with an in vivo cannabimimetic activity higher than Δ9-tetrahydrocannabinol: Δ9-Tetrahydrocannabiphorol. Sci. Rep. 2019, 9, 20335. [Google Scholar] [CrossRef] [PubMed] [Green Version]
  5. Gülck, T.; Møller, B. Phytocannabinoids: Origins and Biosynthesis. Trends Plant Sci. 2020, 25, 985–1004. [Google Scholar] [CrossRef] [PubMed]
  6. Montone, C.M.; Cerrato, A.; Botta, B.; Cannazza, G.; Capriotti, A.L.; Cavaliere, C.; Citti, C.; Ghirga, F.; Piovesana, S.; Laganà, A. Improved identification of phytocannabinoids using a dedicated structure-based workflow. Talanta 2020, 219, 121310. [Google Scholar] [CrossRef]
  7. Grotenhermen, F. Pharmacology of Cannabinoids. Neuroendocrinol. Lett. Nos. 2004, 25, 14–23. [Google Scholar]
  8. Moreno-Sanz, G.; Vera, C.F.; Sánchez-Carnerero, C.; Roura, X.N.; Baena, V.S.D.M. Biological Activity of Cannabis sativa L. Extracts Critically Depends on Solvent Polarity and Decarboxylation. Separations 2020, 7, 56. [Google Scholar] [CrossRef]
  9. ElSohly, M.; Radwan, M.; Gul, W.; Chandra, S.; Galal, A. Phytochemistry of Cannabis sativa L. In Progress in the Chemistry of Organic Natural Products; Springer: Berlin/Heidelberg, Germany, 2017; pp. 1–36. [Google Scholar]
  10. Linciano, P.; Citti, C.; Russo, F.; Tolomeo, F.; Lagann, A.; Capriotti, A.L.; Luongo, L.; Iannotta, M.; Belardo, C.; Maione, S.; et al. Identification of a new cannabidiol n-hexyl homolog in a medicinal cannabis variety with an antinociceptive activity in mice: Cannabidihexol. Sci. Rep. 2020, 10, 22019. [Google Scholar] [CrossRef]
  11. Dujourdy, L.; Besacier, F. A study of cannabis potency in France over a 25 years period (1992–2016). Forensic Sci. Int. 2017, 272, 72–80. [Google Scholar] [CrossRef]
  12. Vergara, D.; Gaudino, R.; Blank, T.; Keegan, B. Modeling cannabinoids from a large-scale sample of Cannabis sativa chemotypes. PLoS ONE 2020, 15, e0236878. [Google Scholar] [CrossRef] [PubMed]
  13. Maccarrone, M. Phytocannabinoids and endocannabinoids: Different in nature. Rend. Lincei. Sci. Fis. Nat. 2020, 31, 931–938. [Google Scholar] [CrossRef]
  14. Giupponi, L.; Leoni, V.; Carrer, M.; Ceciliani, G.; Sala, S.; Panseri, S.; Pavlovic, R.; Giorgi, A. Overview on italian hemp production chain, related productive and commercial activities and legislative framework. Ital. J. Agron. 2020, 15, 194–205. [Google Scholar] [CrossRef]
  15. Thichak, S.; Natakankitkul, S.; Chansakaow, S.; Chutipongvivate, S. Identification of Drug-Type and Fiber-Type of Hemp (Cannabis sativa L.) by Multiplex PCR. Chiang Mai J. Sci. 2011, 38, 608–618. [Google Scholar]
  16. United Nations Office on Drugs and Crime. ST/NAR/40: Recommended Methods for the Identification and Analysis of Cannabis and Cannabis Products; UNODC: New York, NY, USA, 2009; ISBN 978-92-1-148242-3. [Google Scholar]
  17. United Nations Office on Drugs and Crime. ST/NAR/48: Recommended Methods for the Identification and Analysis of Synthetic Cannabinoid Receptor Agonists in Seized Materials; Rev. 1.; UNODC: New York, NY, USA, 2013. [Google Scholar]
  18. Bianco, G.; Pascale, R.; Lelario, F.; Bufo, S.A.; Cataldi, T.R.I. Investigation of Glucosinolates by Mass Spectrometry. In Glucosinolates. Reference Series in Phytochemistry; Mérillon, J.M., Ramawat, K., Eds.; Springer: Cham, Switzerland, 2017; pp. 431–461. [Google Scholar] [CrossRef]
  19. Bianco, G.; Pascale, R.; Carbone, C.; Acquavia, M.; Cataldi, T.; Schmitt-Kopplin, P.; Buchicchio, A.; Russo, D.; Milella, L. Determination of soyasaponins in Fagioli di Sarconi beans (Phaseolus vulgaris L.) by LC-ESI-FTICR-MS and evaluation of their hypoglycemic activity. Anal. Bioanal. Chem. 2018, 410, 1561–1569. [Google Scholar] [CrossRef]
  20. Onzo, A.; Pascale, R.; Acquavia, M.; Cosma, P.; Gubitosa, J.; Gaeta, C.; Iannece, P.; Tsybin, Y.; Rizzi, V.; Guerrieri, A.; et al. Untargeted analysis of pure snail slime and snail slime-induced Au nanoparticles metabolome with MALDI FT-ICR MS. J. Mass Spectrom. 2021, 56, e4722. [Google Scholar] [CrossRef] [PubMed]
  21. Lelario, F.; Maria, S.D.; Rivelli, A.R.; Russo, D.; Milella, L.; Bufo, S.A.; Scrano, L. A Complete Survey of Glycoalkaloids Using LC-FTICR-MS and IRMPD in a Commercial Variety and a Local Landrace of Eggplant (Solanum melongena L.) and their Anticholinesterase and Antioxidant Activities. Toxins 2019, 11, 230. [Google Scholar] [CrossRef] [Green Version]
  22. Bianco, G.; Lelario, F.; Battista, F.G.; Bufo, S.A.; Cataldi, T.R.I. Identification of glucosinolates in capers by LC-ESI-hybrid linear ion trap with Fourier transform ion cyclotron resonance mass spectrometry (LC-ESI-LTQ-FTICR MS) and infrared multiphoton dissociation. J. Mass Spectrom. 2012, 47, 1160–1169. [Google Scholar] [CrossRef]
  23. Lelario, F.; Bianco, G.; Bufo, S.A.; Cataldi, T.R.I. Establishing the occurrence of major and minor glucosinolates in Brassicaceae by LC–ESI-hybrid linear ion-trap and Fourier-transform ion cyclotron resonance mass spectrometry. Phytochemistry 2012, 73, 74–83. [Google Scholar] [CrossRef]
  24. Agneta, R.; Rivelli, A.R.; Ventrella, E.; Lelario, F.; Sarli, G.; Bufo, S.A. Investigation of Glucosinolate Profile and Qualitative Aspects in Sprouts and Roots of Horseradish (Armoracia rusticana) Using LC-ESI–Hybrid Linear Ion Trap with Fourier Transform Ion Cyclotron Resonance Mass Spectrometry and Infrared Multiphoton Dissocia. J. Agric. Food Chem. 2012, 60, 7474–7482. [Google Scholar] [CrossRef]
  25. Onzo, A.; Acquavia, M.A.; Pascale, R.; Iannece, P.; Gaeta, C.; Nagornov, K.O.; Tsybin, Y.O.; Bianco, G. Metabolic profiling of Peperoni di Senise PGI bell peppers with ultra-high resolution absorption mode Fourier transform ion cyclotron resonance mass spectrometry. Int. J. Mass Spectrom. 2021, 470, 116722. [Google Scholar] [CrossRef]
  26. Acquavia, M.A.; Pascale, R.; Martelli, G.; Bondoni, M.; Bianco, G. Natural Polymeric Materials: A Solution to Plastic Pollution from the Agro-Food Sector. Polymers 2021, 13, 158. [Google Scholar] [CrossRef]
  27. Santarsiero, A.; Onzo, A.; Pascale, R.; Acquavia, M.A.; Coviello, M.; Convertini, P.; Todisco, S.; Marsico, M.; Pifano, C.; Iannece, P.; et al. Pistacia lentiscus Hydrosol: Untargeted Metabolomic Analysis and Anti-Inflammatory Activity Mediated by NF-κ B and the Citrate Pathway. Oxid. Med. Cell. Longev. 2020, 2020, 4264815. [Google Scholar] [CrossRef] [PubMed]
  28. Caivano, M.; Pascale, R.; Mazzone, G.; Buchicchio, A.; Masi, S.; Bianco, G.; Caniani, D. N2O and CO2 Emissions from Secondary Settlers in WWTPs: Experimental Results on Full and Pilot Scale Plants. In Lecture Notes in Civil Engineering; Mannina, G., Ed.; Springer: Cham, Switzerland, 2017; Volume 4, pp. 412–418. [Google Scholar]
  29. Citti, C.; Linciano, P.; Panseri, S.; Vezzalini, F.; Forni, F.; Vandelli, M.; Cannazza, G. Cannabinoid Profiling of Hemp Seed Oil by Liquid Chromatography Coupled to High-Resolution Mass Spectrometry. Front. Plant Sci. 2019, 10, 120. [Google Scholar] [CrossRef]
  30. Delgado-Povedano, M.M.; Sánchez-Carnerero Callado, C.; Priego-Capote, F.; Ferreiro-Vera, C. Untargeted characterization of extracts from Cannabis sativa L. cultivars by gas and liquid chromatography coupled to mass spectrometry in high resolution mode. Talanta 2020, 208, 120384. [Google Scholar] [CrossRef] [PubMed]
  31. CE n. 796/2004 Regolamento CE n. 796/2004 Recante Modalità di Applicazione Della Condizionalità, Della Modulazione e del Sistema Integrato di Gestione e di Controllo di cui al Reg. (CE) n. 1782/2003. Available online: https://www.politicheagricole.it/flex/cm/pages/ServeBLOB.php/L/IT/IDPagina/2942 (accessed on 19 October 2021).
  32. CE n. 1164/89 Regolamento CE n. 1164/89 della Commissione del 28 Aprile 1989 Relativo Alle Modalità D’applicazione Concernenti L’aiuto per il Lino Tessile e la Canapa—Publications Office of the EU. Available online: https://op.europa.eu/en/publication-detail/-/publication/fb3afa66-f593-4145-8a14-77aba838eb8c/language-it/format-PDFA1B (accessed on 19 October 2021).
  33. Lelario, F.; Scrano, L.; De Franchi, S.; Bonomo, M.G.; Salzano, G.; Milan, S.; Milella, L.; Bufo, S.A. Identification and antimicrobial activity of most representative secondary metabolites from different plant species. Chem. Biol. Technol. Agric. 2018, 5, 13. [Google Scholar] [CrossRef]
  34. Lelario, F.; Labella, C.; Napolitano, G.; Scrano, L.; Bufo, S.A. Fragmentation study of major spirosolane-type glycoalkaloids by collision-induced dissociation linear ion trap and infrared multiphoton dissociation Fourier transform ion cyclotron resonance mass spectrometry. Rapid Commun. Mass Spectrom. 2016, 30, 2395–2406. [Google Scholar] [CrossRef] [PubMed]
  35. Hillig, K.; Mahlberg, P. A chemotaxonomic analysis of cannabinoid variation in Cannabis (Cannabaceae). Am. J. Bot. 2004, 91, 966–975. [Google Scholar] [CrossRef] [Green Version]
  36. Santos, N.A.D.; Tose, L.V.; Silva, S.R.C.D.; Murgu, M.; Kuster, R.M.; Ortiz, R.S.; Camargo, F.A.O.; Vaz, B.G.; Lacerda, V.; Romão, W. Analysis of Isomeric Cannabinoid Standards and Cannabis Products by UPLC-ESI-TWIM-MS: A Comparison with GC-MS and GC × GC-QMS. J. Braz. Chem. Soc. 2019, 30, 60–70. [Google Scholar] [CrossRef]
  37. Ferrer, I. Analyses of cannabinoids in hemp oils by LC/Q-TOF-MS. Compr. Anal. Chem. 2020, 90, 415–452. [Google Scholar] [CrossRef]
  38. Meijer, E.P.M.D.; Bagatta, M.; Carboni, A.; Crucitti, P.; Moliterni, V.M.C.; Ranalli, P.; Mandolino, G. The inheritance of chemical phenotype in Cannabis sativa L. Genetics 2003, 163, 335. [Google Scholar] [CrossRef] [PubMed]
Figure 1. Extracted ion chromatograms using LC/ESI-FTICRMS acquired in positive ion mode of a C. sativa extract (Eletta Campana). The monitored ions are displayed in each trace (plots (AD)) and correspond to the protonated molecules, [M+H]+, using a restricted window of 0.0010 m/z unit, centered around each selected ion. Peak numbers correspond to (1) CBDV, (2) THCV, (3) CBG, (4) CBD, (5) THC and (6) CBN. For each cannabinoid, molecular structure, weight, and formula of corresponding neutral forms are reported.
Separations 08 00245 g001
Figure 2. (A) FTICR IRMPD MS spectrum of the protonated cannabinoid CBD at m/z 315 (peak four in the chromatograms of Figure 1); the [M+H]+ precursor ion was photon-irradiated for 300 ms at 100% laser power and (B) FTICR IRMPD MS spectrum of the protonated cannabinoid THC at m/z 315 (peak four in the chromatograms of Figure 1); the [M+H]+ precursor ion was photon-irradiated for 300 ms at 100% laser power.
Separations 08 00245 g002
Figure 3. Proposed fragmentation structures for product ions of CBD and THC, based on IRMPD-MS/MS spectra and CID-MSn.
Separations 08 00245 g003
Figure 4. FTICR IRMPD MS spectrum of the protonated cannabinoid CBN at m/z 311.20056 (peak six in the chromatograms of Figure 1); the [M+H]+ precursor ion was photon-irradiated for 300 ms at 100% laser power.
Separations 08 00245 g004
Figure 5. Proposed fragmentation structures for product ions of CBN, based on IRMPD-MS/MS spectra and CID-MSn.
Separations 08 00245 g005
Figure 6. (A) FTICR IRMPD MS spectrum of the protonated cannabinoid CBDV at m/z 287 (peak one in the chromatograms of Figure 1); the [M+H]+ precursor ion was photon-irradiated for 290 ms at 100% laser power and (B) FTICR IRMPD MS spectrum of the protonated cannabinoid THCV at m/z 287 (peak two in the chromatograms of Figure 1); the [M+H]+ precursor ion was photon-irradiated for 290 ms at 100% laser power. The structures of product ions for CBDV and THCV, based on IRMPD-MS/MS data, are reported on the bottom side of the mass tandem spectra: the m/z values of all fragments are shifted of an ethylene portion (CH2-CH3, 28 amu) moving from CBDV and THCV to CBD and THC, except for fragments of the constant terpenic portion.
Separations 08 00245 g006
Figure 7. FTICR IRMPD MS spectrum, of the protonated cannabinoid CBG at m/z 317.24764 (peak three in the chromatograms of Figure 1); the [M+H]+ precursor ion was photon-irradiated for 290 ms at 100% laser power to obtain the product ions at m/z 207.13784, 193.12207 and 123.04392, which structures are reported on the right side of the mass tandem spectrum.
Separations 08 00245 g007
Table 1. Cannabinoids occurring in a sample of C. sativa extract (Eletta Campana), identified as intact protonated molecules, [M+H]+, using high-resolution LC-ESI (+)-FTICR MS and IRMPD product ions obtained from the protonated ions of the identified compounds.
N aCannabinoidtr (min) bMolecular Formula as [M+H]+ cMonoisotopic Accurate Value [M+H]+ (m/z) dMass Error (ppm) eMain IRMPD MS/MS Productions (Accurate m/z) d and Mass Error (ppm) e
1CBDV7.4C19H27O2+287.200800.84111.04398 (0.72); 123.04412 (0.49); 135.11669 (1.04); 153.09109 (0.52); 165.09099 (0.12); 175.07540 (0.23); 179.10678 (0.68); 203.10656 (0.52); 205.12223 (0.38); 207.13801 (0.24); 217.12225 (0.28); 227.14330 (1.15); 231.13785 (0.48); 245.15366 (0.20); 269.19027 (1.04)
2THCV10.3C19H27O2+287.200271.01111.04393 (1.22); 123.04392 (1.11); 135.11677 (0.44); 153.09087 (0.91); 165.09084 (1.02); 175.07533 (0.20); 179.10658 (0.44); 203.10666 (0.02); 205.12232 (0.03); 207.13784 (0.60); 217.12226 (0.23); 227.14307 (0.13); 231.13784 (0.50); 245.15364 (0.13); 269.19015 (0.61)
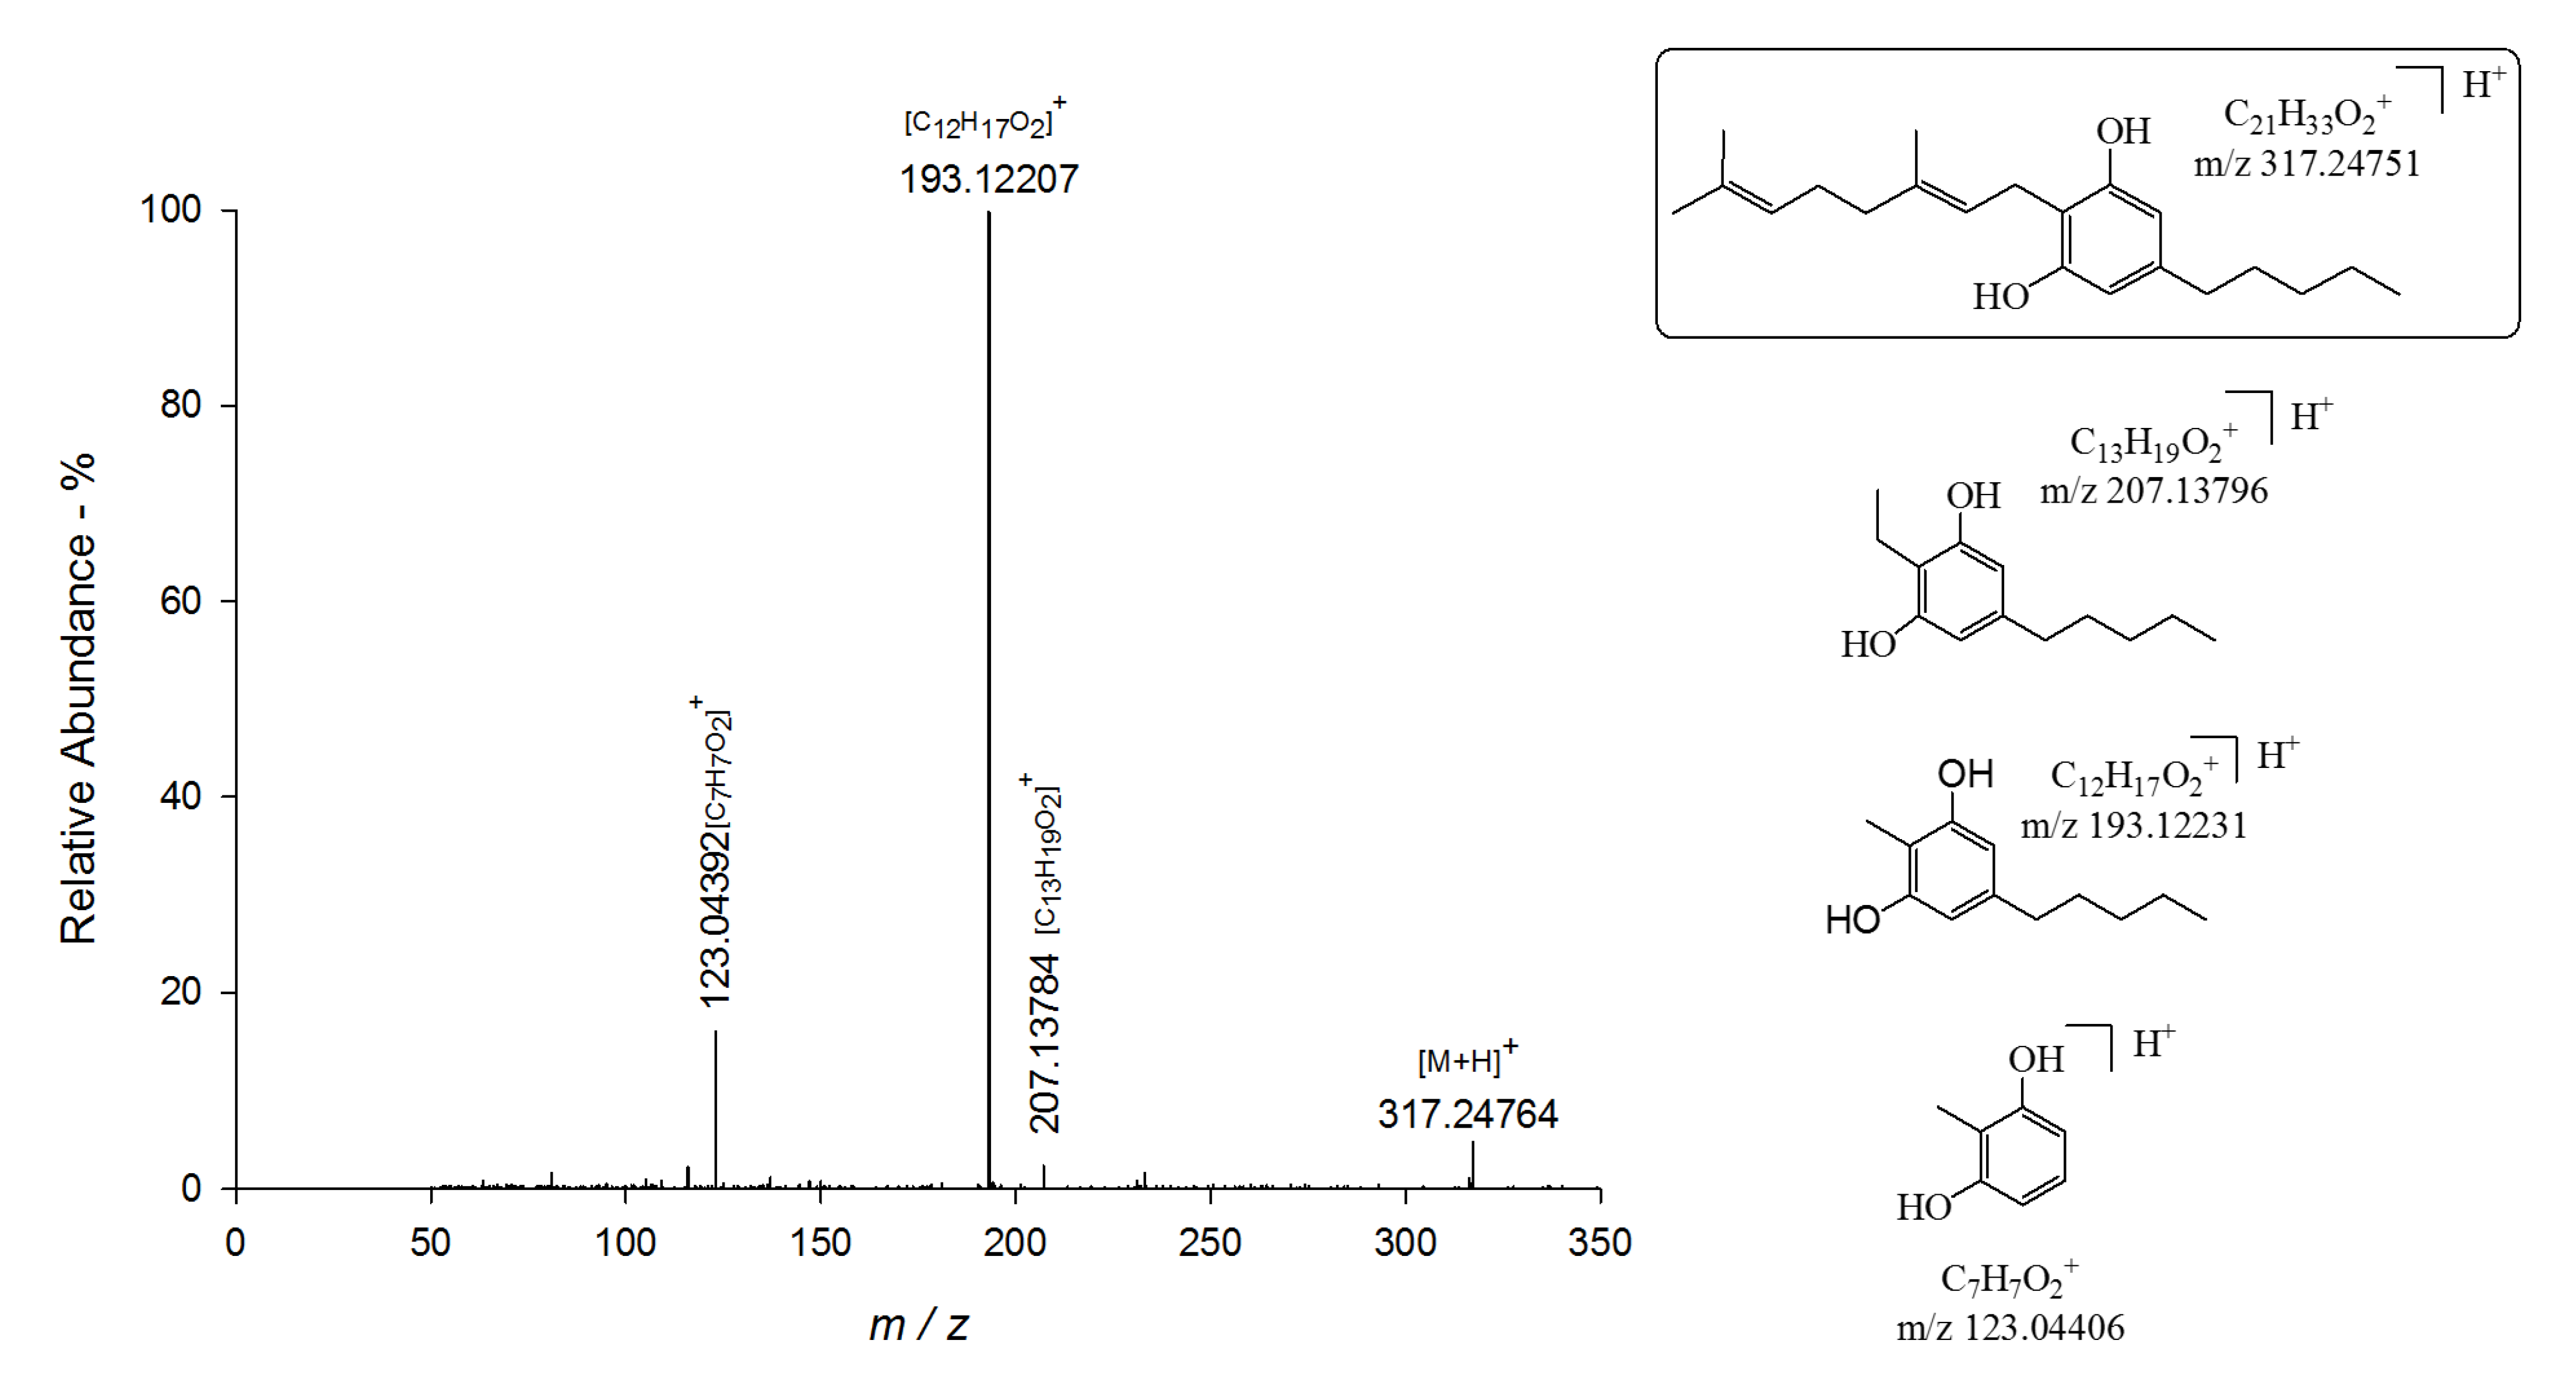
3CBG8.9C21H33O2+317.247640.42123.04392 (1.11); 193.12207 (1.18); 207.13784 (0.60)
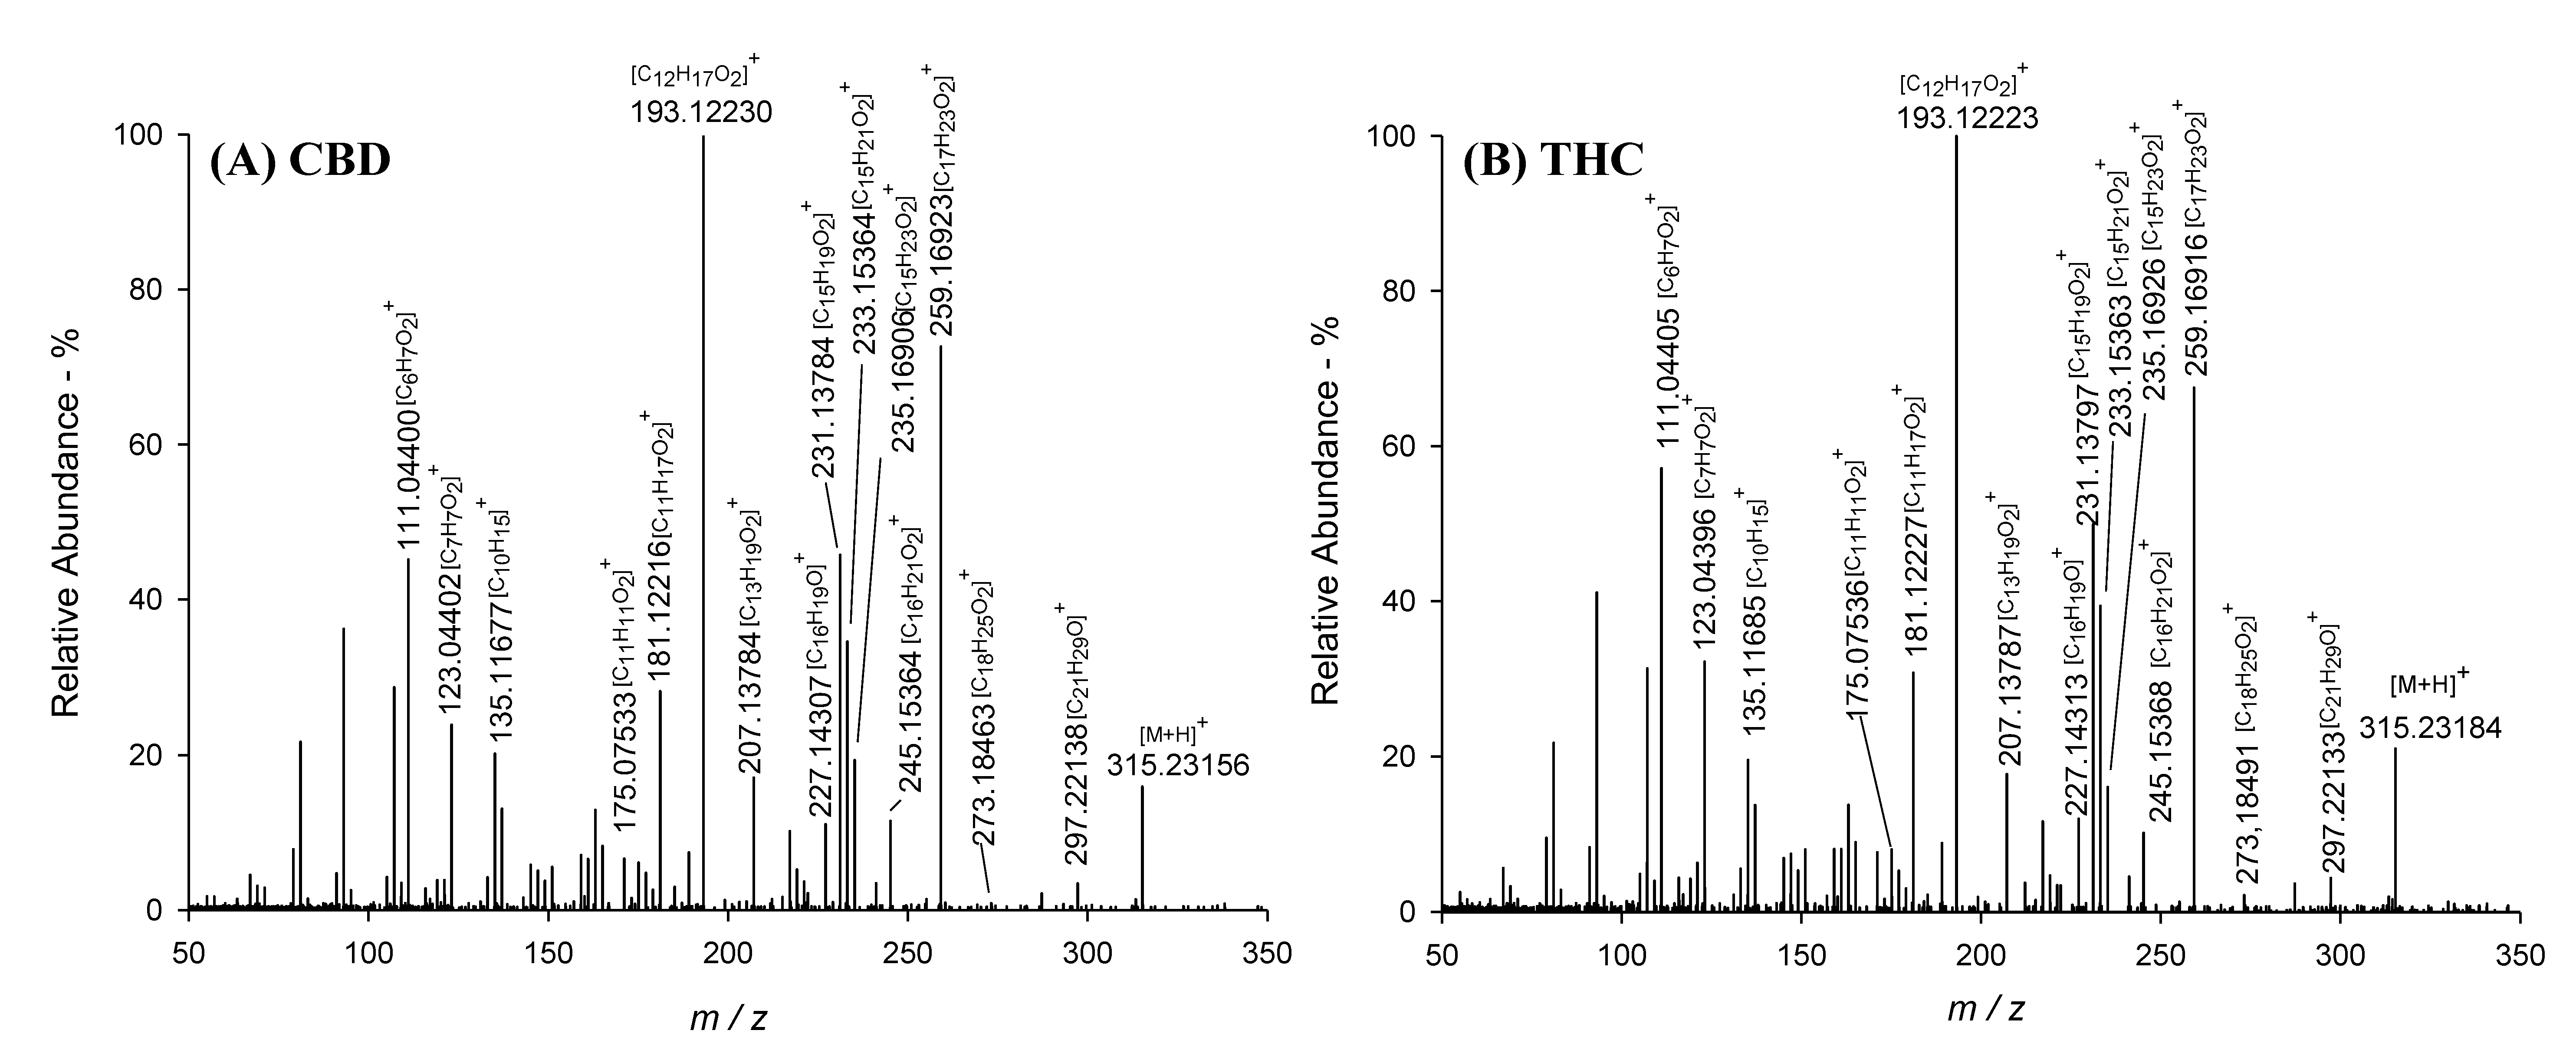
4CBD9.6C21H31O2+315.231560.95111.04400 (0.54); 123.04402 (0.37); 135.11677 (0.44); 175.07533 (0.20); 181.12216 (0.81); 193.12230 (0.016); 207.13784 (0.60); 227.14307 (0.14); 231.13784 (0.50); 233.15364 (0.14); 235.16906 (0.85); 245.15364 (0.13); 259.16923 (0.14); 273.18463 (1.03); 297.22138 (0.31)
5THC13.6C21H31O2+315.231840.063111.04405 (0.09); 123.04396 (0.49); 135.11685 (0.15); 175.07533 (0.20); 181.12227 (0.22); 193.12223 (0.36); 207.13787 (0.43); 227.14313 (0.40); 231.13797 (0.043); 233.15363 (0.085); 235.16914 (0.51); 245.15368 (0.29); 259.16916 (0.39); 273.18491 (0.00); 297.22133 (0.13)
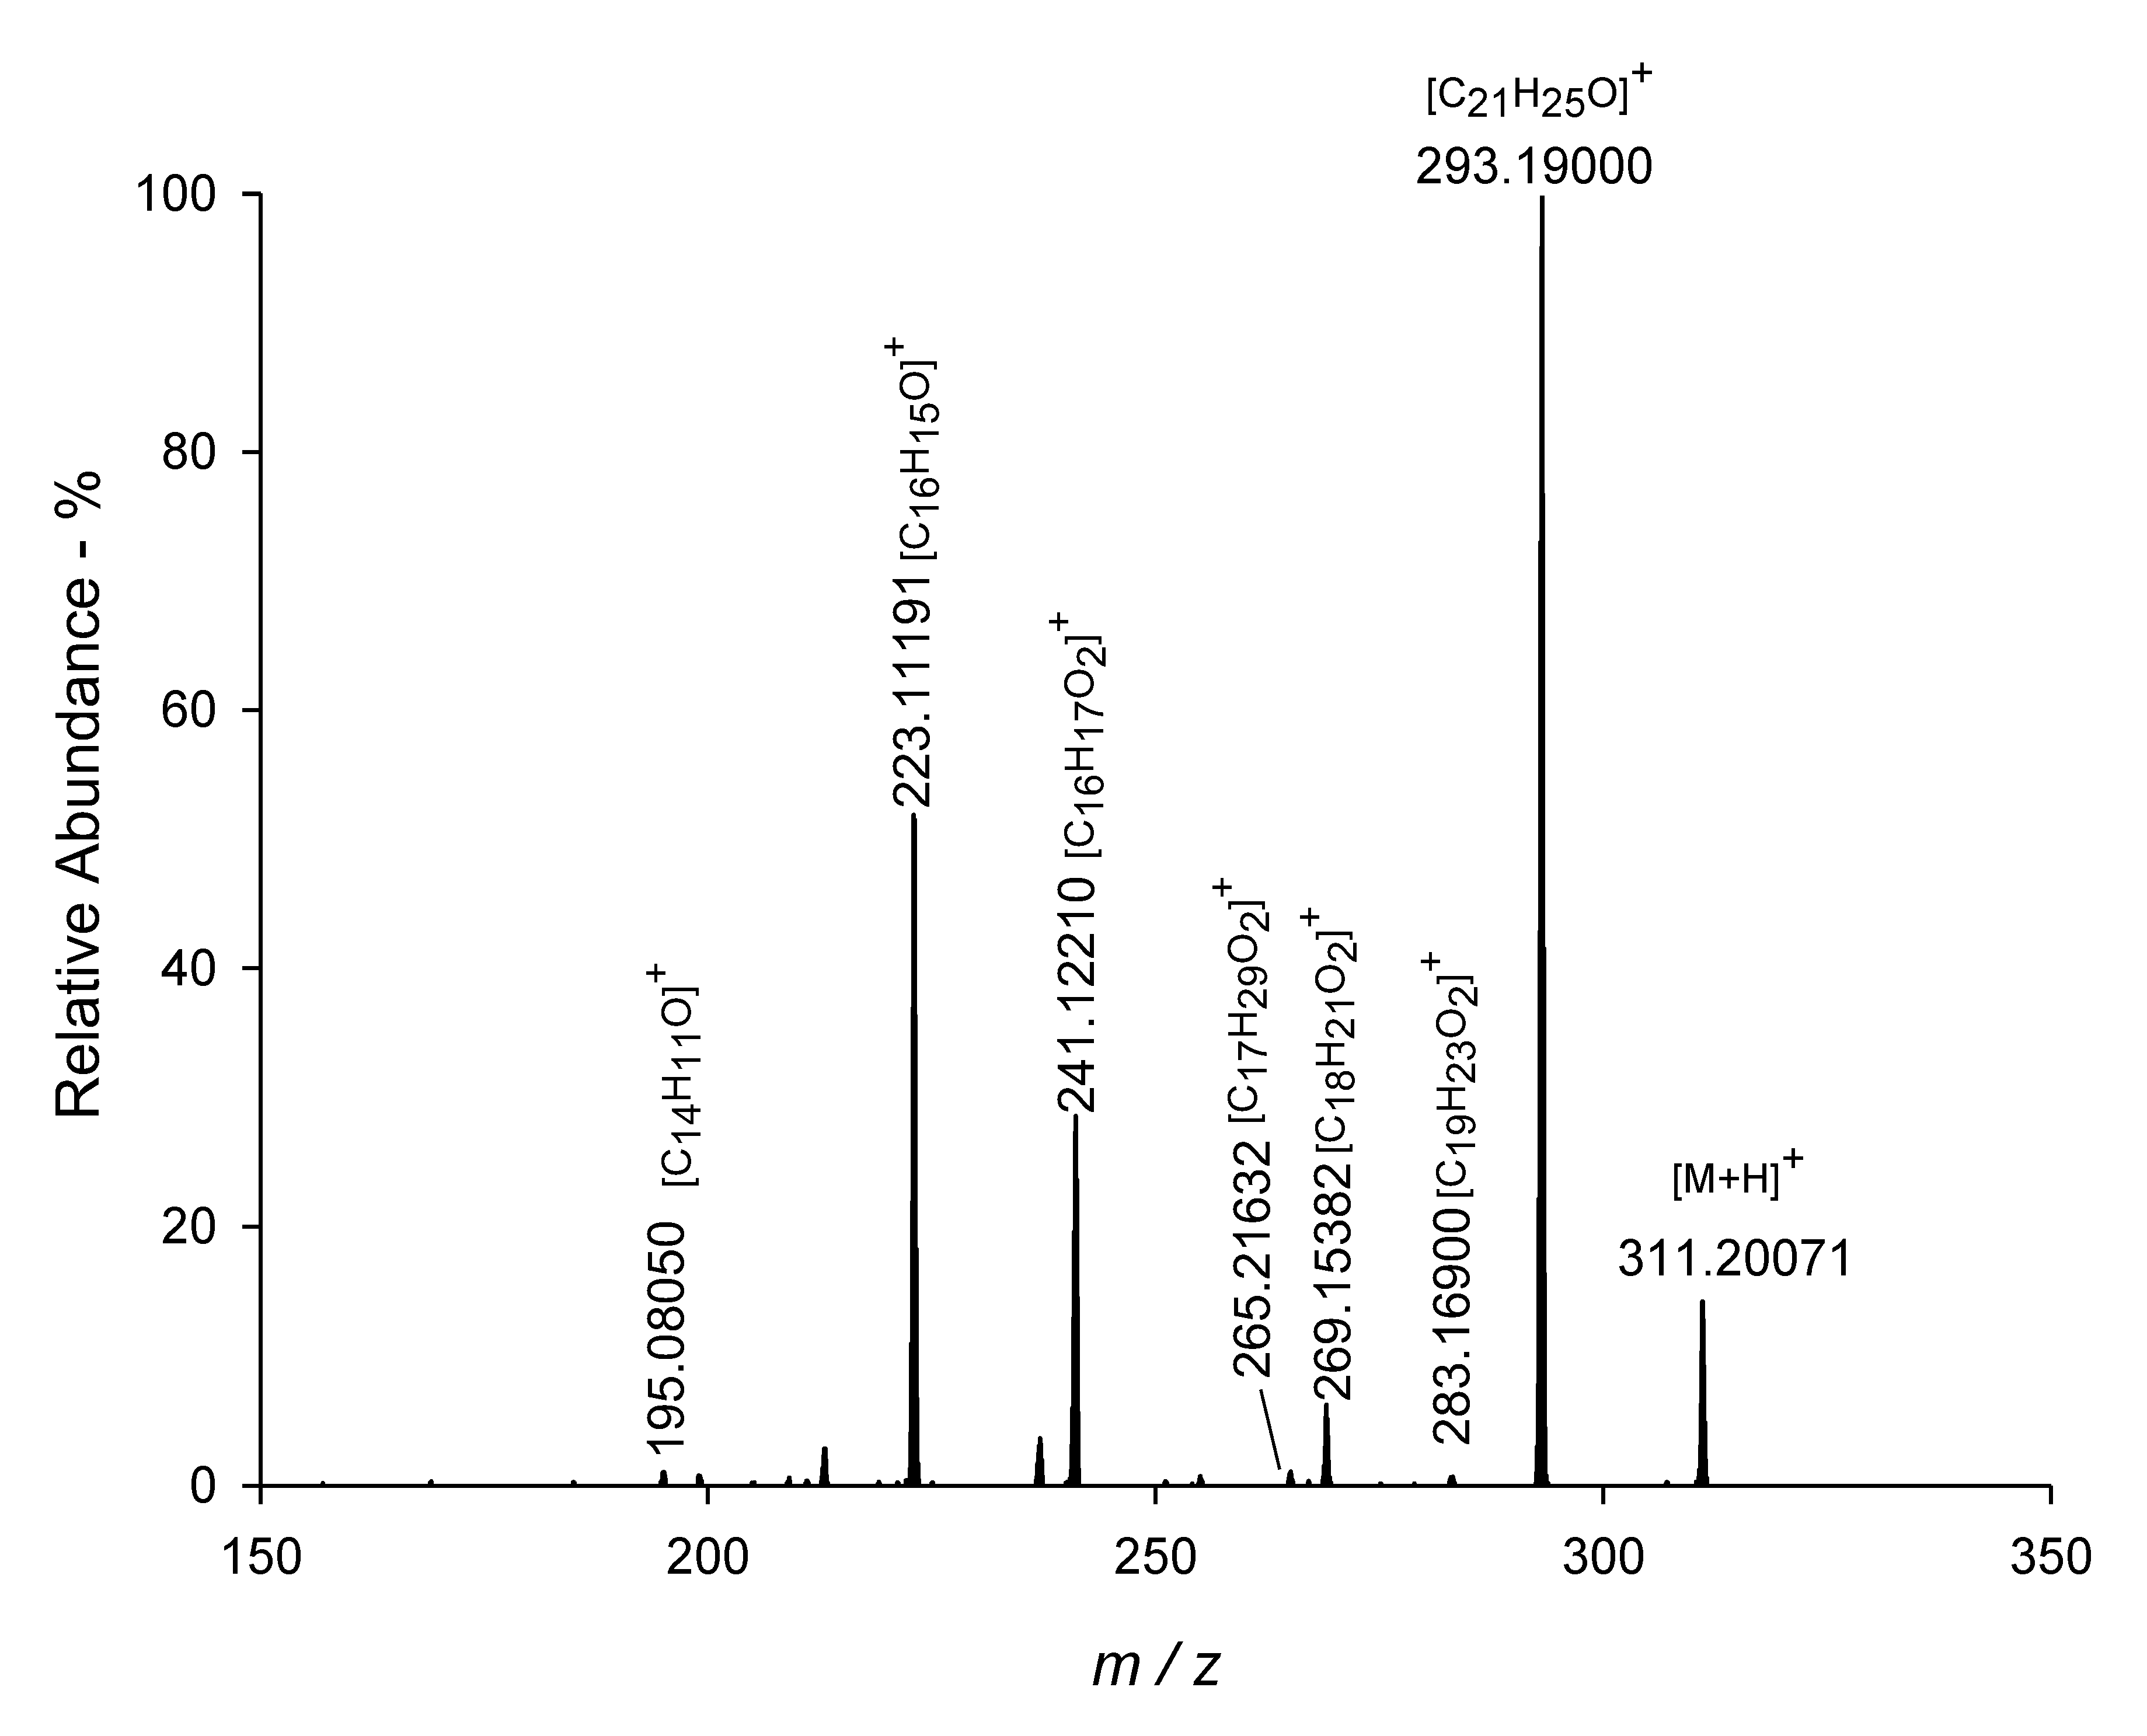
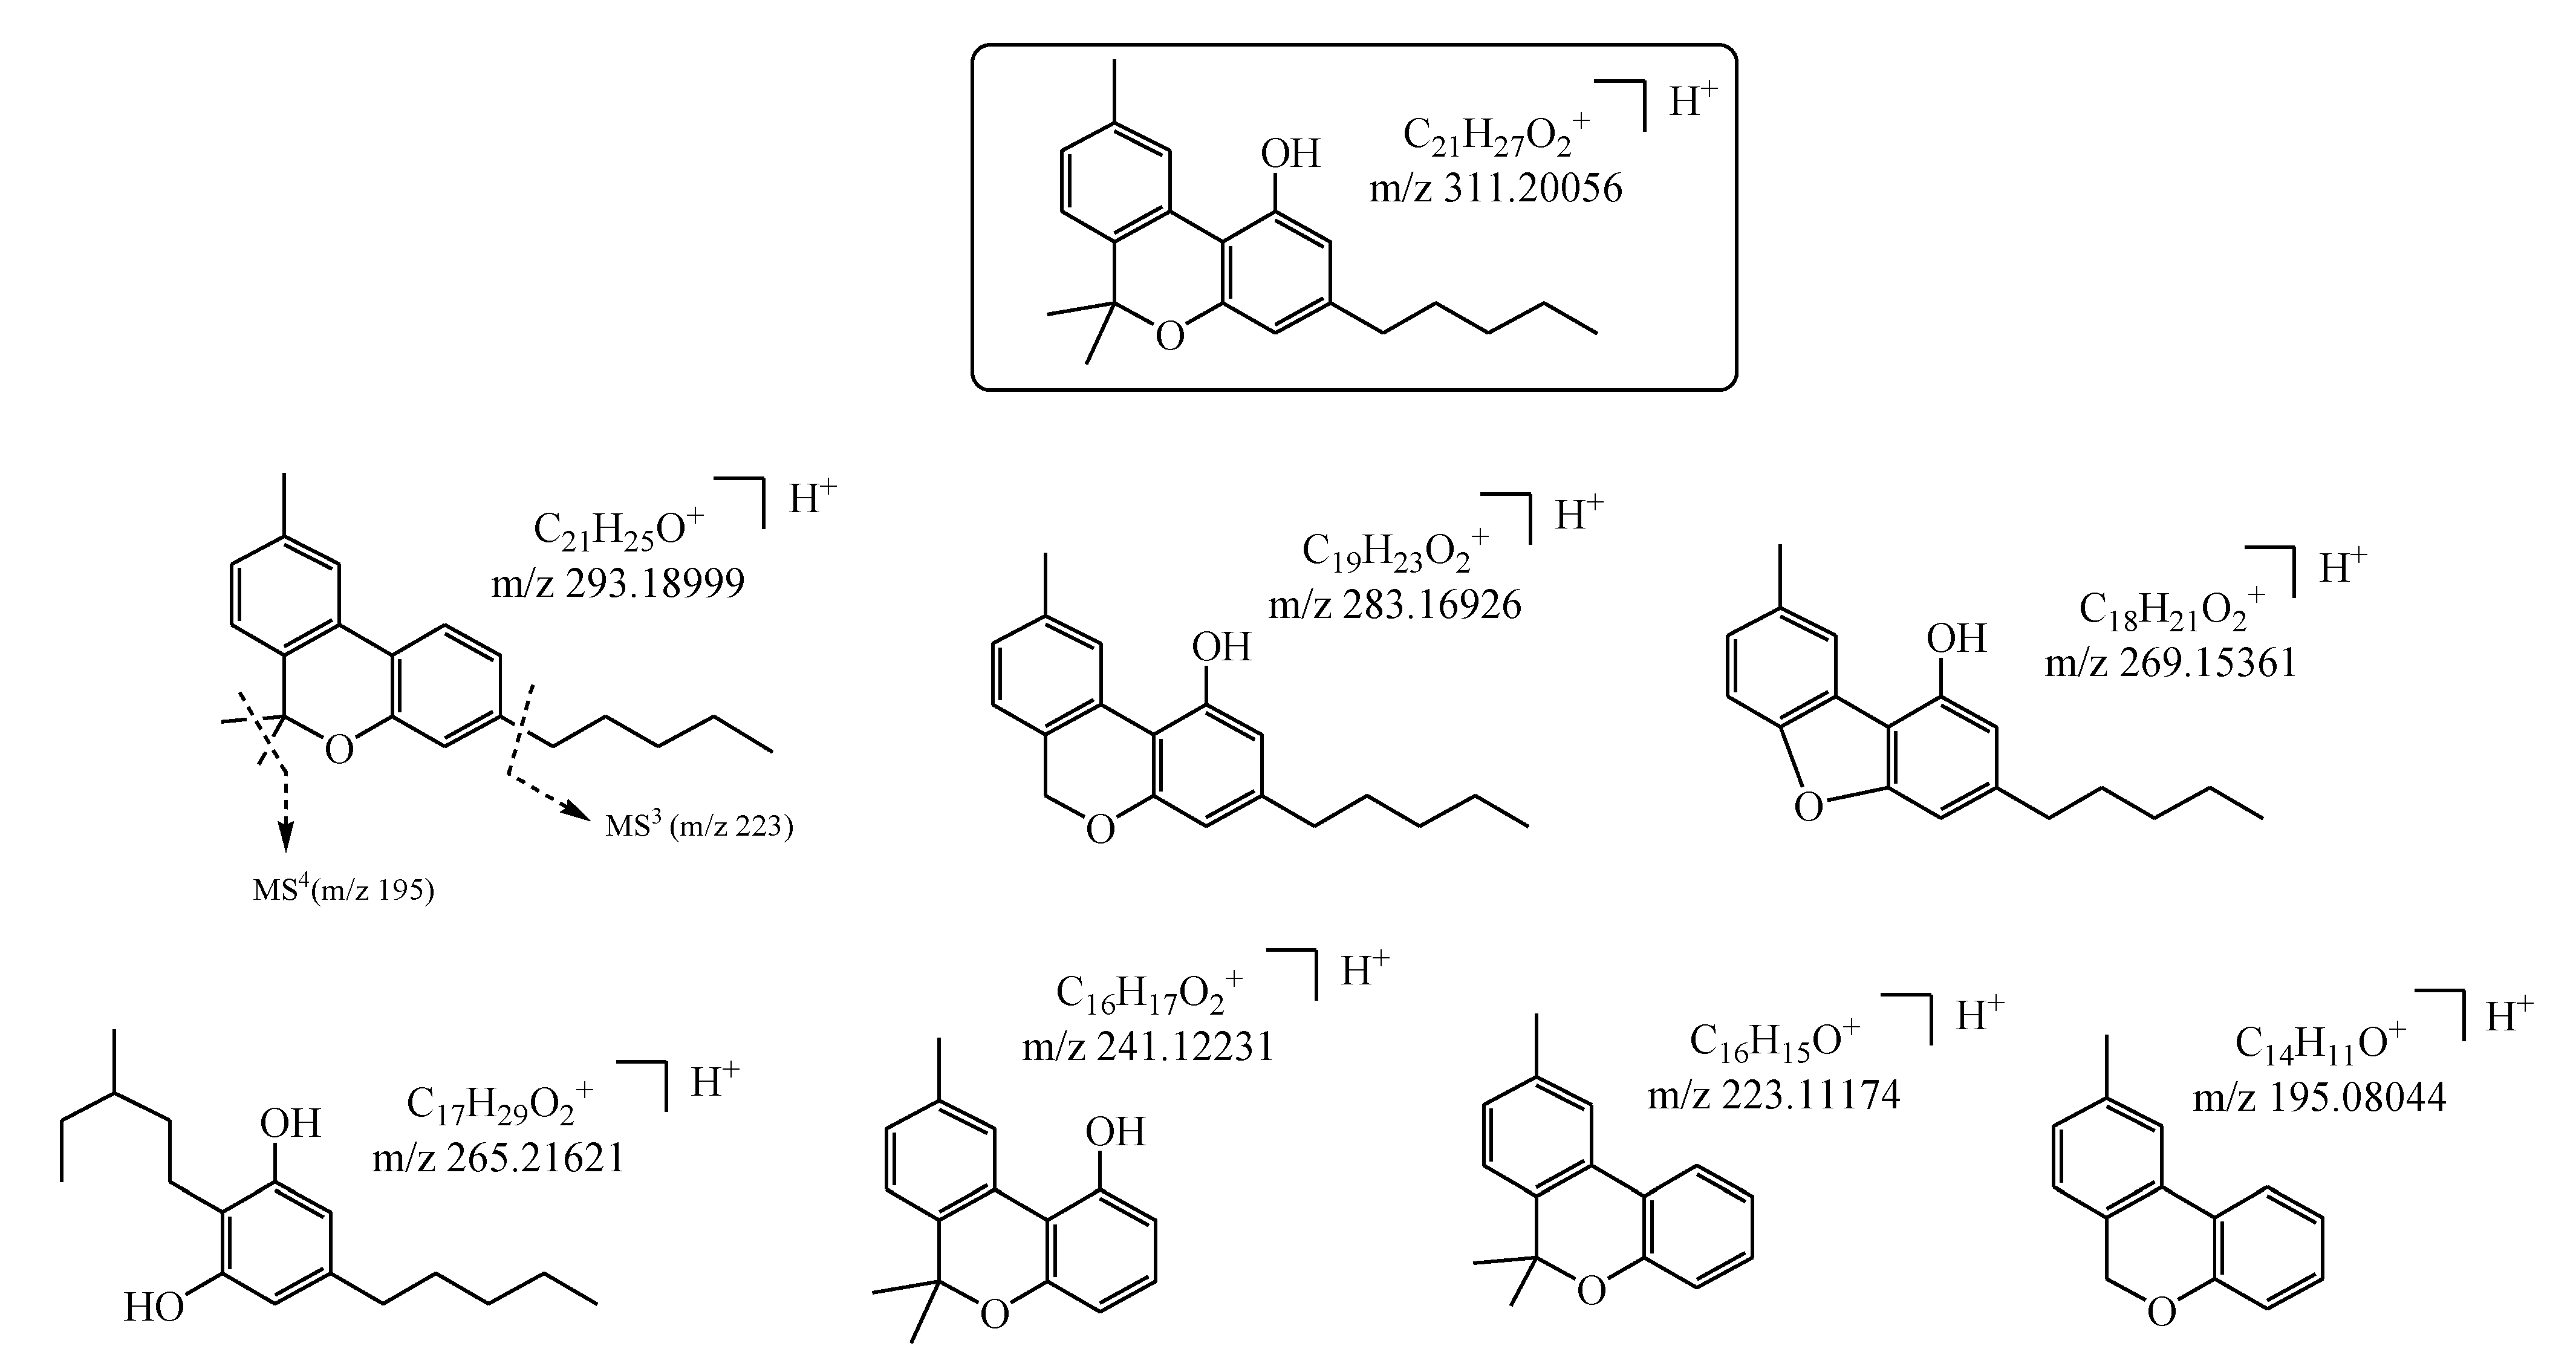
6CBN12.3C21H27O2+311.200710.48195.08050 (0.31); 223.11191 (0.76); 241.1206 (0.87); 265.21632 (0.41); 269.15382 (0.80); 283.16900 (0.92); 293.19000 (0.034)
a Is the number used to identify each cannabinoid in the chromatograms of Figure 1. b Retention time of cannabinoid eluted under the experimental conditions described in the LC-MS section. c Molecular formula of protonated cannabinoid. d Average experimental value of five m/z measurements. e Mass accuracy expressed as the root mean square (RMS) in parts per million (ppm = 106 × [accurate mass-exact mass]/exact mass) of five m/z measurements.
Table 2. CBD, THC, and CBN quantification and their ratios in three samples of Cannabis sativa L. Average analyte values are expressed as % (g/100 g dw) ± SD (n = 3). The uncertainties of the ratios were calculated by applying the random errors propagation.
ParameterSample
Carmagnola C.S.CarmagnolaEletta Campana
THC %0.053 ± 0.0010.105 ± 0.0020.111 ± 0.003
CBD %0.897 ± 0.0021.387 ± 0.0031.991 ± 0.002
CBN %0.009 ± 0.0010.011 ± 0.0010.007 ± 0.002
CBD/THC16.925 ± 0.32213.210 ± 0.25317.937 ± 0.485
CBN/THC0.170 ± 0.0190.105 ± 0.0100.063 ± 0.018
(THC + CBN)/CBD0.069 ± 0.0020.084 ± 0.0020.059 ± 0.002
Publisher’s Note: MDPI stays neutral with regard to jurisdictional claims in published maps and institutional affiliations.

