Abstract
Polycyclic aromatic hydrocarbon (PAH) derivatives are mutagenic, carcinogenic, teratogenic and bioaccumulative pollutants. Investigations on hydroxylated PAHs (OH–PAHs) and Nitrated PAHs (NPAHs) in surface water are not enough. In this study, optimization and validation of an analytical method targeting nine kinds of OH–PAHs and one kind of nitrated PAH in environmental water samples are presented. The method was validated for linearity, limits of detection and quantification and recovery using spiked matrix. The linear range of most target compounds was 0.1–200 ng∙mL−1. However, the linear range of 1–hydroxy pyrene and 3–hydroxy benzo[a]pyrene started at 1 ng∙mL−1 and the linear range of 1–hydroxy phenanthrene and 9–hydroxy benzo[a]pyrene could not reach 200 ng∙mL−1. All the correlation coefficients (r2) were over 0.997. The instrumental limits of detection (LOD) and method detection limits (MDL) ranged from 0.01 to 0.67 ng∙mL−1 and 1.11 to 2.26 ng∙L−1, respectively. With this method, a lake in Hebei province, China, were screened. Three kinds of target compounds were detected. The average concentration was around 2.5 ng∙L−1, while the highest concentration reached 286.54 ng∙L−1.
1. Introduction
Polycyclic aromatic hydrocarbons (PAHs) are mutagenic, carcinogenic, teratogenic and bioaccumulative, and some PAH derivatives are even more toxic [1,2,3,4,5,6,7]. Therefore, they are listed as hazardous substances, toxic chemicals and priority pollutants by the United States Environmental Protection Agency (EPA) [8,9]. PAHs and their oxygenated and nitrated derivatives (OPAHs and NPAHs) have been extensively studied, while the hydroxylated derivatives (OH–PAH) have not been sufficiently studied [10]. The major source of OH–PAHs in the air is the incomplete combustion of coal and biomass [11,12]. Another essential source is the microbiological and photochemical degradation of PAHs [13]. OH–PAHs are polar compounds, indicating that their solubility in water is higher than their parent PAHs. Due to its high sensitivity, high resolving power and accurate mass measurements, the Orbitrap high–resolution Mass Spectrometry (Orbitrap–HRMS) combined with high performance liquid chromatogram (HPLC) has been successfully used in screening PAHs and its derivatives. For example, Avagyan and Westerholm reported a screening method of OH–PAHs in air particulates using LC–Orbitrap–HRMS [14]. Although OH–PAHs have been detected in various aqueous matrixes [15,16,17], investigations on these compounds in surface water are not enough. Especially in lakes and small rivers in the rural area of China.
In this work, we present the optimization of a screening method targeting nine representative kinds of OH–PAHs including two pairs of isomers and one NPAH in surface water using HPLC combined with Orbitrap–HRMS. Then, this method was validated in linearity, limits of detection, quantification and matrix effects. With full validation, this method was used in the screening of a shallow lake named Baiyangdian in Hebei province, China. This provided an example for further and wider investigation on PAH derivatives in surface water.
2. Materials and Methods
2.1. Chemicals
Analytical grade standards including 2–Phenyl phenol, 1–naphthol, 2–naphthol, 1–hydroxy pyrene, 7,8–benzoquinoline and 6–hydroxy chrysene were purchased from AccuStandard (New Haven, CT, USA). 1–hydroxy phenanthrene, 3–hydroxy fluorene, 3–hydroxy benzo[a]pyrene and 9–hydroxy benzo[a]pyrene were purchased from Toronto Research Chemicals Incorporation (Toronto, Ontrario, Canada). Detailed information on these reference standards are shown in Table 1. Acetonitrile and methanol, both HPLC grade, were purchased from Merck (Darmstadt, Hessen, Germany). Ultrapure water was produced by a Milli–Q system (Millipore, Billerica, MA, USA).

Table 1.
Detailed information on target compounds.
All standards were purchased as solutions of 100 mg∙L−1 in methanol. 100 μL of each standard solution was mixed as stock solution and kept in a freezer under −18~−20 °C. 100 μL of stock was diluted with methanol to 1 mL as mixed standard for later use.
2.2. Study Area and Sampling
The study area was the biggest shallow lake in Hebei province, China, known as Baiyangdian. It is the main water source of residents in the area, as well as a representative of surface water environment in the rural area of north China. During June and July of 2018, forty samples were obtained from the lake and from upstream. Each sample were directly collected with a 1 L dark glass bottle along with two duplicates. All samples and duplicates were then stored at 0~4 °C using ice bags and transported back to our laboratory for extraction within 7 days.
2.3. Extraction
C18 solid phase extraction (SPE) (6 cc, 500 mg, Agela Technologies, Shanghai, China) was used to extract all environmental samples and spiked blank samples. SPE cartridges were conditioned with 5 mL methanol and then 5 mL water. After being conditioned, SPE cartridges were placed on a glass tank, where negative pressure was applied. Then, 1 L of each sample were added. All samples were not filtered and it took 20 to 25 min to load each cartridge. However, some samples did not go as fast as others. The slowest sample took about 45 min to load. The cartridges were then washed with 5 mL water, and the analytes were eluted with 4 mL methanol. The eluted fractions were evaporated to 500 µL and filtered by 0.22 µm Nylon filters.
2.4. LC and MS Conditions
The analyses were performed on an Ultimate 3000 Rapid Separation Liquid Chromatography (RSLC) system (Thermo Scientific Dionex, Germering, Bayern, Germany) coupled to a Q Exactive Plus Hybrid Quadrupole–Orbitrap High Resolution Mass Spectrometer (HR–Orbitrap–MS) with heated electrospray ionization (HESI) ion source (Thermo Scientific, Bremen, Germany).
A Kinetex F5 column (2.1% 100 mm length and diameter, 2.6 μm particle size, Phenomenex, Torrance, CA, USA) was used for the separation. The column temperature was kept at 30 °C, and the injection volume was 20 μL. Mobile phase A was ultrapure water, and mobile phase B was methanol, and the flow rate was set to 0.25 mL∙min−1, for a total of 20 min. The percentage of mobile phase B was 50% for the first 2 min, then ramped to 80% in the next 13 min, and stayed 80% for 3 min, then ramped back down to 50% in 0.1 min and held for 1.9 min.
Most OH–PAHs rapidly lose H+ in the HESI ion source and become negatively charged ions. However, NPAH such as 7,8–BQu attracts H+ and gains positive charge in the HESI ion source. To analyze all compounds of both polarities without affecting efficiency, the MS acquisition was performed in negative ionization mode and positive ionization mode simultaneously.
A T–SIM scan with two scan groups was established. The m/z and polarity of each target compounds were shown in Table 1. the spray voltage was set to −3.2 kV and +3.5 kV. Sheath gas flow rate was 55 arbitrary units (a.u.), sweep gas flow rate was 0 a.u. S–lens radio frequency level was 50 a.u., the capillary temperature was 360 °C, and auxiliary (AUX) gas heater temperature was 400 °C. The mass resolution was 70,000 (m/z 200), automatic gain control (AGC) target was set to 1e6, maximum injection time was 100 ms and isolation window was 2.0 m/z.
3. Results and Discussion
3.1. Extraction Optimization
3.1.1. Choosing SPE Columns
To compare the efficiency of extraction on three kinds of commonly used SPE sorbent, HLB, PEP and C18, seven blank matrix samples spiked with mix standard were extracted using each SPE column and then analyzed. The analytical concentration compared to the spiked concentration was calculated as recovery for each analyte. The recoveries on C18 SPE columns were between 60–100%, except for 3–OH–BaP (54.9%). However, only six analytes on HLB SPE columns had recoveries that reached 60%, while recoveries of five analytes on PEP SPE columns achieved the same level. Therefore, C18 SPE column was the final choice.
3.1.2. Choosing Elute Solvent
In order to determine which and how much Elute solvent to use, eight sets of analyses were performed using different amounts of methanol or acetonitrile as eluting solvent. The recoveries of each group were calculated and shown in Figure 1. Most compounds reached the highest recovery eluted at 4 mL methanol.
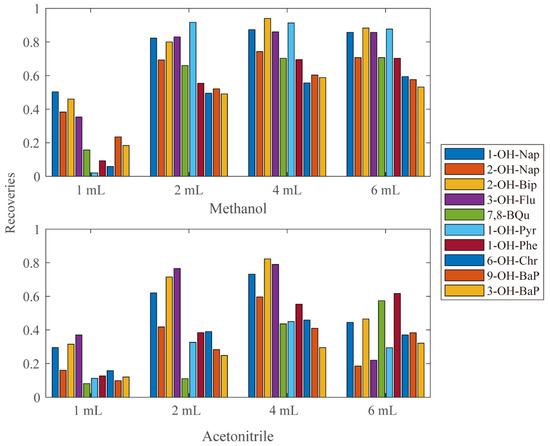
Figure 1.
The recoveries using different kinds and amount of elute solvents.
3.2. LC Optimizing
Isomers such as 1–OH–Nap/2–OH–Nap and 9–OH–BaP/3–OH–BaP are unable to be identified by the target m/z. Therefore, LC optimizing is critical for isolating and quantifying those isomers.
3.2.1. Choosing of Columns
At first, a waters ACQUITY UPLC BEH C18 (2.1 × 100 mm, 1.7 µm) column was used for separation. The gradient profile was 50% of phase B in the first 2.5 min, then gradually increased and reached 80% at the 18.75 min. Then, kept for 3.75 min, then ramped back to 50% in 0.1 min and stayed 50% in the last 2.4 min. Other conditions were the same as Section 2, Materials and Methods (line 83–89). However, the resolution of 1–OH–Nap (retention times (RT) = 5.95) and 2–OH–Nap (RT = 6.32) was 0.617 which was unacceptable. Then, a Phenomenex Kinetex F5 (2.1 × 100 mm, 2.6 µm) column were tested for isolating target compounds. The extracted ion chromatograms (EIC) were shown in Figure 2. The resolution of 1–OH–Nap (RT = 4.20) and 2–OH–Nap (RT = 4.86) was over 1.5 and the resolution of 9–OH–BaP (RT = 17.04) and 3–OH–BaP (RT = 17.42) was 1.438. Both isomer pairs were well separated.
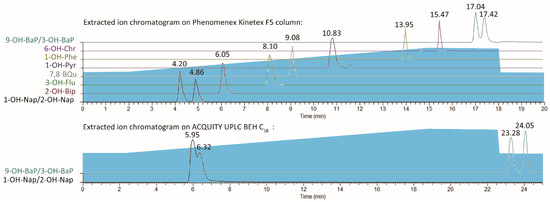
Figure 2.
Extracted ion chromatograms on two columns.
3.2.2. Column Temperature and Mobile Phase Optimizing
Methanol and acetonitrile are both commonly used mobile phase B in reverse phase chromatography. Both mobile phases were tested under common condition. While using acetonitrile as mobile phase B, the resolution and peak tailing was not as good as using Methanol.
Then, four different gradient profiles as in Table 2. were tested; 9–OH–BaP/3–OH–BaP were not welly separated using gradient profiles 1 and 2. When using gradient profile 3, the RT of 9–OH–BaP and 3–OH–BaP were over 20 min. Therefore, the efficiency and resolution of profile 4 were the best.
Table 2.
Gradient profiles of mobile phase B.
The column temperature and the flow rate of mobile phase are two major factors that determine the resolution, other than the columns. Four chromatographs were obtained with the column temperature at 25 °C, 30 °C, 35 °C and 40 °C, respectively, and three more were obtained under mobile phase flow rate at 0.25 mL∙min−1, 0.30 mL∙min−1 and 0.35 mL∙min−1. Figure 3 showed the calculated resolution of each isomer pairs. However, since the retention time increases along with the increase in resolution, the efficiency, along with other factors such as the service life period of columns, were taken into consideration in the final choice of temperature and flow rate.
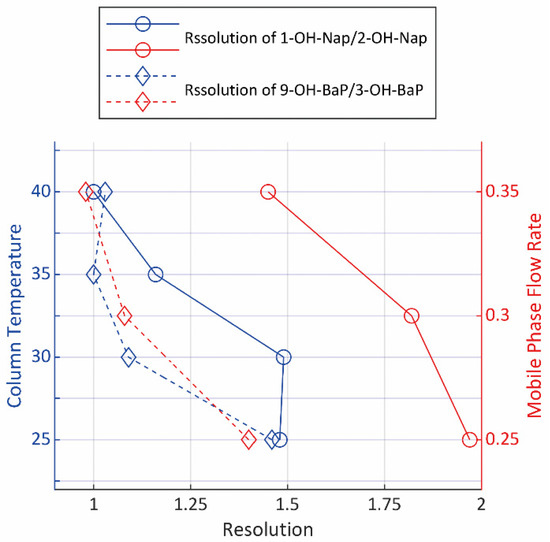
Figure 3.
The resolution of isomers under different LC parameters.
3.3. HESI Source Tuning
To maximize the efficiency of the HESI source, a targeted tuning was performed. The relative response under different capillary temperature, AUX gas heater temperature, spray voltage and sheath gas flow rate are shown in Figure 4. However, for different compounds, the ionic efficiency reached its peak under different parameters. Thus, the final choice of parameters was a compromise to ensure the response of most analytes were as strong as possible.
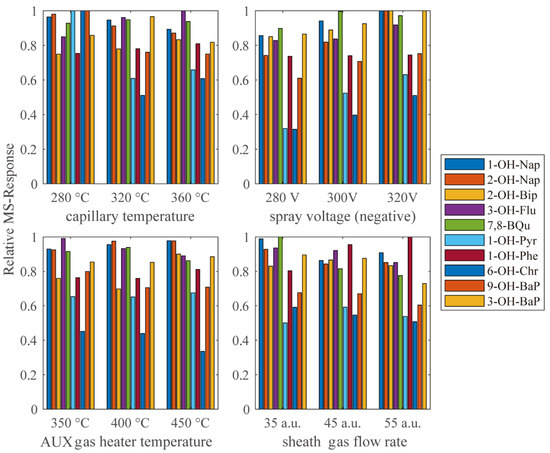
Figure 4.
The MS–response relative to the highest response in each group under different HESI parameters.
3.4. Calibration and Validation
The calibration curve ranged from 0.1 ng∙mL−1 to 200 ng∙mL−1 and at included at least seven calibration points. The instrumental limits of detection (LOD) were calculated from signal to noise ratios (S/N) of standard solutions using the definition S/N > 3. Instrumental relative standard deviation (RSD n = 7) was calculated by repeatedly analyzing mix standard solution at 5 ng∙mL−1 for seven times. Additionally, the method detection limits (MDL) was calculated according to the EPA definition of MDL, which is t(n−1, 0.99) × Standard Deviation. In order to determine the reproducibility of extraction, 1 L of pure water was spiked with 5 μL, 30 μL and 100 μL mixed standard solution, respectively and repeated 7 times each. Then, the spiked water was extracted and analyzed. The recovery and RSD of extraction at three concentrations (5 ng∙mL−1, 30 ng∙mL−1 and 100 ng∙mL−1) were then calculated. The matrix effects were determined according to the procedure by Avagyan and Westerholm in 2017 [14], which included spiking the matrix extract with mix standard solutions and comparing the response factors to those obtained from pure mixed standard solutions. All detailed information on method calibration and validation is shown in Table 3 and Table 4.
Table 3.
RT, linear range, correlation coefficients (r2), LOD, LOQ and instrument RSD (n = 7) of each compound.
Table 4.
RSD (n = 7) and recovery (R) of extraction at different concentrations and matrix effects.
3.5. Screening Results
Seven of 10 target compounds did not reach the concentration of MDL in all 40 samples. The concentration of 1–OH–Nap, 2–OH–Nap and 2–OH–Bip were over MDL in 6, 1 and 22 samples, respectively. The maximum concentrations of 1–OH–Nap, 2–OH–Nap and 2–OH–Bip were 286.54 ng∙L−1, 2.55 ng∙L−1 and 73.97 ng∙L−1. Since the maximum concentration of 1–OH–Nap was over the linear range, the concentration of this sample was calibrated by a mixed standard solution at the concentration of 300 ng∙L−1, additionally, double checked with the duplicate of this sample. The EIC chromatogram of this sample is shown in Figure 5.
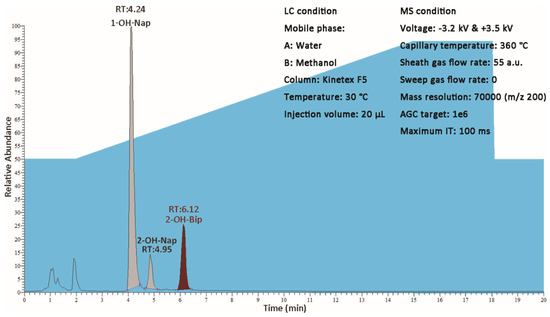
Figure 5.
The EIC chromatogram which had the maximum concentration of 1–OH–Nap.
Statistics of compounds with a concentration above MDL are listed in Table 5. The result shows that in nearly half of the samples the concentration of all targets was below MDL. Additionally, the median concentration was around 2.5 ng∙L−1, which suggests that the concentration in most of the lake is around 2.5 ng∙L−1 or even lower. However, the maximum concentration was much higher, which suggests that the concentration was highly unevenly distributed.
Table 5.
Maximum and median concentrations, number, and rate of concentrations above MDL and the sample number with the maximum concentrations.
To understand the distribution of OH–PAHs in the lake, the concentration heat map of 2–OH–Bip, 1–OH–Nap and 2–OH–Nap was shown in Figure 6b–d. Additionally, the relative position of sampling points is shown in Figure 6a. The red square represents the mapping area of the heat maps. Due to the anomalous distribution, the colour scale is exponential. For Figure 6b,c, the concentration of most of the yellow area is around 2 ng∙L−1 and that of the blue area is below MDL. The red areas suggest the high concentration of OH–PAHs only appears in a small area of the lake. The red zone of Figure 6c,d is at the same spot, but very different form Figure 6b, which shows the concentrations of 1–OH–Nap and 2–OH–Bip reach their peak at sampling point 30 (S30), while the concentration of 2–OH–Bip reaches the peak at sampling point 35 (S35), and a second peak at sampling point 39 (S39).
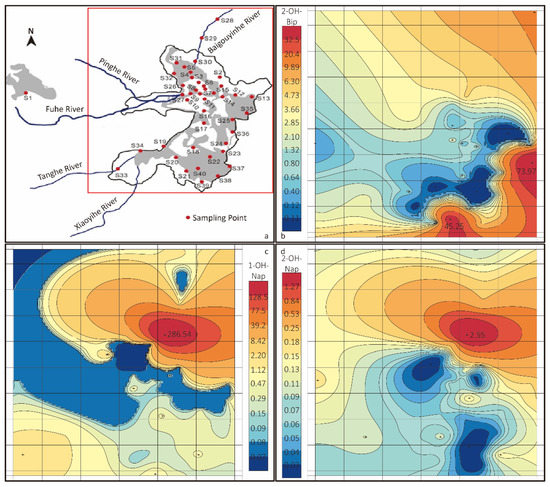
Figure 6.
(a) The relative position of sampling points. (b–d) Concentration heat map of 2–OH–Bip, 1–OH–Nap and 2–OH–Nap, respectively.
The high concentration of OH–PAHs appears only in a small area, suggesting that OH–PAHs in that area accumulate much faster than it disperses and degrades, which indicates a strong source of OH–PAHs in the high concentration area. To identify the source, a further investigation is needed concentrated on those red zones. One assumption is the fuel combustion of a yacht dock at the entrance of Baigouyinhe River near S30.
4. Conclusions
The optimization and validation of a target screening method using HPLC–Orbitrap HRMS were presented in this work. The linear range, correlation coefficients, RSD and MLD was sufficiently well for the investigation of environmental samples. The matrix effect was not severe (93–113%). Although ten targeted compounds were listed, we hope to expand this method to nontarget screening. Internal standard was not used in order to simulate screening unknown compounds.
With this method, a screening of nine OH–PAHs and one NPAH in the lake, Baiyangdian Hebei, China was successfully conducted. The concentration of seven target compounds did not reach MLD in all samples, while the concentrations of other three compounds were around 2.5 ng∙L−1 in most of the lake, demonstrating that the overall pollution of OH–PAHs in this area was not severe. However, an overwhelming high concentration area of 1–OH–Nap at sampling point 30 and two peak concentration areas of 2–OH–Bip were detected. These three areas need to be further investigated to understand the reason of this irregularity.
The screening results testify to the ubiquitous existence of OH–PAHs in water. Additionally, they suggest the importance of establishing a standard procedure for a nation–wide investigation on surface water.
Author Contributions
Z.S.: formal analysis, validation, visualization, and writing. Z.R.: conceptualization, funding acquisition and supervision. J.Z.: visualization. M.L.: formal analysis, resources. T.Z.: formal analysis and resources. Y.W.: editing. H.A.: editing. All authors have read and agreed to the published version of the manuscript.
Funding
This research was funded by China Geological Survey (DD20190323, DD20189627).
Institutional Review Board Statement
Not applicable.
Informed Consent Statement
Not applicable.
Data Availability Statement
Not applicable.
Conflicts of Interest
The authors declare no conflict of interest. The funders had no role in the design of the study; in the collection, analyses, or interpretation of data; in the writing of the manuscript, or in the decision to publish the results.
References
- International Agency for Research on Cancer. Overall evaluations of carcinogenicity: An updating of IARC Monographs volumes 1 to 42. IARC Monogr. Eval. Carcinog. Risks Hum. Suppl. 1987, 7, 1–440. [Google Scholar]
- Vandergrift, G.W.; Monaghan, J.; Krogh, E.T.; Gill, C.G. Direct Analysis of Polyaromatic Hydrocarbons in Soil and Aqueous Samples Using Condensed Phase Membrane Introduction Tandem Mass Spectrometry with Low-Energy Liquid Electron Ionization. Anal. Chem. 2019, 91, 1587–1594. [Google Scholar] [CrossRef]
- Durant, J.L.; Lafleur, A.L.; Plummer, E.F.; Taghizadeh, K.; Busby, W.F.; Thilly, W.G. Human Lymphoblast Mutagens in Urban Airborne Particles. Environ. Sci. Technol. 1998, 32, 1894–1906. [Google Scholar] [CrossRef]
- Hannigan, M.P.; Cass, G.R.; Penman, B.W.; Crespi, C.L.; Lafleur, A.L.; Busby, W.F.; Thilly, W.G.; Simoneit, B.R.T. Bioassay-Directed Chemical Analysis of Los Angeles Airborne Particulate Matter Using a Human Cell Mutagenicity Assay. Environ. Sci. Technol. 1998, 32, 3502–3514. [Google Scholar] [CrossRef]
- Schuetzle, D. Sampling of vehicle emissions for chemical analysis and biological testing. Environ. Health Perspect. 1983, 47, 65–80. [Google Scholar] [CrossRef] [PubMed]
- Pedersen, D.U.; Durant, J.L.; Penman, B.W.; Crespi, C.L.; Hemond, H.F.; Lafleur, A.L.; Cass, G.R. Human-cell mutagens in respirable airborne particles in the northeastern United States. 1. Mutagenicity of fractionated samples. Environ. Sci. Technol. 2004, 38, 682–689. [Google Scholar] [CrossRef] [PubMed]
- Pedersen, D.U.; Durant, J.L.; Taghizadeh, K.; Hemond, H.F.; Lafleur, A.L.; Cass, G.R. Human cell mutagens in respirable airborne particles from the northeastern United States. 2. Quantification of mutagens and other organic compounds. Environ. Sci. Technol. 2005, 39, 9547–9560. [Google Scholar] [CrossRef] [PubMed]
- Priority Pollutant List. Available online: https://www.epa.gov/sites/production/files/2015-09/documents/priority-pollutant-list-epa.pdf (accessed on 30 August 2021).
- List of Lists. Available online: https://www.epa.gov/sites/production/files/2015-03/documents/list_of_lists.pdf (accessed on 30 August 2021).
- Zhang, H.-Q.; Rao, Z.; Wang, X.-C.; Xu, D.-D.; Gu, Z.-X.; Qin, K.; Guo, F.; Zhan, N. Determination of Low-ring PAHs and Their Derivatives in Groundwater by GC × GC-TOF MS. J. Instrum. Anal. 2017, 36, 1197–1202. [Google Scholar]
- Simoneit, B.R.; Bi, X.; Oros, D.R.; Medeiros, P.M.; Sheng, G.; Fu, J. Phenols and hydroxy-PAHs (arylphenols) as tracers for coal smoke particulate matter: Source tests and ambient aerosol assessments. Environ. Sci. Technol. 2007, 41, 7294–7302. [Google Scholar] [CrossRef] [PubMed]
- Avagyan, R.; Nyström, R.; Lindgren, R.; Boman, C.; Westerholm, R. Particulate hydroxy-PAH emissions from a residential wood log stove using different fuels and burning conditions. Atmos. Environ. 2016, 140, 1–9. [Google Scholar] [CrossRef]
- Pozzoli, L.; Gilardoni, S.; Perrone, M.G.; de Gennaro, G.; de Rienzo, M.; Vione, D. Polycyclic Aromatic Hydrocarbons in the Atmosphere: Monitoring, Sources, Sinks And Fate. I: Monitoring And Sources. Ann. Di Chim. 2004, 94, 17–33. [Google Scholar] [CrossRef] [PubMed]
- Avagyan, R.; Westerholm, R. Target and suspect screening of OH-PAHs in air particulates using liquid chromatography-orbitrap high resolution mass spectrometry. Talanta 2017, 165, 702–708. [Google Scholar] [CrossRef] [PubMed]
- Hemat, H.; Wittsiepe, J.; Wilhelm, M.; Muller, J.; Goen, T. High levels of 1-hydroxypyrene and hydroxyphenanthrenes in urine of children and adults from Afghanistan. J. Expo. Sci. Environ. Epidemiol. 2012, 22, 46–51. [Google Scholar] [CrossRef] [PubMed][Green Version]
- Guo, Y.; Senthilkumar, K.; Alomirah, H.; Moon, H.B.; Minh, T.B.; Mohd, M.A.; Nakata, H.; Kannan, K. Concentrations and profiles of urinary polycyclic aromatic hydrocarbon metabolites (OH-PAHs) in several Asian countries. Environ. Sci. Technol. 2013, 47, 2932–2938. [Google Scholar] [CrossRef] [PubMed]
- Dan, L.; Chun-xiang, H.; Guang-shui, N.; Rui-jing, L.; Yu-hang, G.; Sheng-kai, C. Determination of hydroxylated polycyclic aromatic hydrocarbons in seawater by ultra performance liquid chromatography and mass spectrometry-C18 membrane disk extraction. Chin. J. Anal. Lab. 2018, 37, 884–888. [Google Scholar]


Publisher’s Note: MDPI stays neutral with regard to jurisdictional claims in published maps and institutional affiliations. |
© 2021 by the authors. Licensee MDPI, Basel, Switzerland. This article is an open access article distributed under the terms and conditions of the Creative Commons Attribution (CC BY) license (https://creativecommons.org/licenses/by/4.0/).