Article

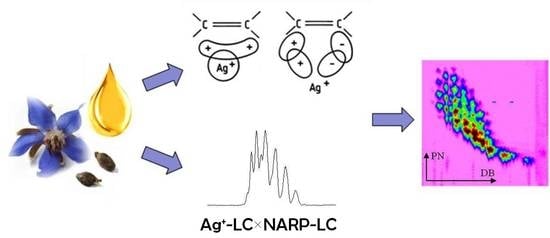
Pattern-Type Separation of Triacylglycerols by Silver Thiolate×Non-Aqueous Reversed Phase Comprehensive Liquid Chromatography

1
Department of Chemical, Biological, Pharmaceutical and Environmental Sciences, University of Messina, 98168 Messina, Italy
2
Department of Biomedical, Dental, Morphological and Functional Imaging Sciences, University of Messina, 98125 Messina, Italy
*
Author to whom correspondence should be addressed.
Separations 2021, 8(6), 88; https://doi.org/10.3390/separations8060088
Submission received: 5 May 2021 / Revised: 13 June 2021 / Accepted: 15 June 2021 / Published: 21 June 2021
(This article belongs to the Special Issue Multidimensional Chromatography)

Abstract

:
Triacylglycerols (TAGs), as the main components of edible oils and animal fats, are responsible for the nutritional value, organoleptic features and technological properties of foods; each lipid matrix shows a unique TAG profile which can serve as fingerprint to ensure the quality and authenticity of food products. The high complexity of many foodstuffs often makes untargeted elucidation of TAG components a challenging task; thus, more efficient separation techniques may be mandatory. In this research, the TAG profile of a borage (Borago officinalis) seed oil was obtained by two-dimensional comprehensive liquid chromatography (LC×LC), by the coupling of silver thiolate and octadecylsilica monodisperse materials. A total 94 TAG compounds were identified by ion trap-time of flight detection, using atmospheric pressure ionization, with the degree of unsaturation varying from 0 to 9, and partition values ranging from 36 to 56. The group-type separation afforded by this analytical approach may be useful to quickly fingerprint TAG components of oil samples.

Graphical Abstract

1. Introduction

Nowadays, lipid analysis represents one of the most promising research fields, given the extensive involvement of these molecules in several biological processes, as well as in determining the nutritional and sensory value of different foods. Consequently, analytical techniques allowing for the comprehensive elucidation of lipid species in different matrices, such as biological samples (tissues, body fluids), foodstuffs and natural products, appear to be mandatory [1]. Among lipid species, triacylglycerols (TAGs) represent the major lipids in oils and fats, both of animal and plant origin. TAG components, which consist of three fatty acids (FAs) esterified to a glycerol (positions sn-1, 2 and 3), can be viewed as concentrated stores of metabolic energy. The high number of possible FA combinations, differing for the total carbon number (CN), degree of unsaturation, position and configuration of double bonds (DB), results in a specific TAG profile, which is unique for each lipid matrix [2].
Lipids have been extensively investigated by means of liquid chromatography (LC), which also represents the technique of choice for TAG analysis, as well as thin-layer chromatography (TLC), and super critical fluid chromatography (SFC), to a lesser extent [3,4]. Particularly, hydrophilic interaction liquid chromatography (HILIC) and normal-phase (NP) LC modes have been widely used to achieve lipid class separation, still affording a limited discrimination of lipid species inside each class [5]. However, silver ion (Ag+)- and non-aqueous reversed phase-LC (NARP-LC) have been by far the most widespread approaches to TAG analysis [6]. Separations by Ag+-LC are ruled by TAG unsaturation degree and position of DBs. The retention mechanism is based on the ability of unsaturated organic compounds to complex with transition metals bonded to the stationary phase. The organometallic complexes are of the charge-transfer type, i.e., the unsaturated compound acts as an electron donor and the silver ion as an electron acceptor [7]; the differences in the strength of the weak reversible complexes formed during the elution process have allowed for the successful separation of TAGs differing in the number and position of double bonds. In general, the retention increases with increasing DBs and distance among them; moreover, the complexes’ stability decreases with the increasing chain-length and with an increasing number of substituents at the DB. The mobile phase may interact both with the solute and the support material; thus, the proper choice of solvents will affect the selectivity of the separation and the migration of the different species, to an appreciable extent. As for the stationary phase, two techniques have been traditionally employed for embedding Ag+ ions in the LC system: by impregnating a support with a silver salt (usually silica gel and silver nitrate, respectively) or by binding the silver ions to an ion-exchange medium, in which Ag+ ion replaces the protons of the functional groups (such as -SO3H) and forms a stable ionic interaction, or finally, by adding a silver salt to the mobile phase during a conventional RPLC separation (the latter being incompatible with mass spectrometry (MS) detection [7,8]. Besides the cumbersome preparation steps, requiring practice and skill, the major problem related to silver ion LC performed on such columns has consisted in the development of a stable and reproducible system, with a controlled silver content and reasonable operational life. The obvious limitations have been the reduced commercial availability of these type of stationary phases, a short column life (due to loss of Ag+ ions), and poor reproducibility (due to the variable Ag+ content). These drawbacks have in turn posed significant issues in performing experiments in different laboratories, by keeping the same analytical conditions. In more recent times, Ag+-LC columns of silica gel functionalized with thiol groups have been introduced to achieve the separation of lipids, especially TAGs [9,10]. Thiol groups are capable of forming stable covalent complexes with Ag(I), and the derived silver thiolate chromatographic material (AgTCM) offers many advantages, consisting of higher stability, longer operational life, controlled silver content, reproducibility across extended use, a lack of silver leaking from the stationary phases, and thus, MS compatibility. The effectiveness of AgTCM for the separation of unsaturated organic compounds was successfully demonstrated by Aponte et al., who reported the comparison between silver thiolate chromatographic material and other stationary phases impregnated with Ag+ to test olefinic interactions [11]. AgTCM columns interact less strongly with unsaturated compounds if compared to the conventional silver ion columns and, thus, are in general less retentive. The quality of column packing, especially in terms of the density, stability and accessibility of Ag+ ions, also plays an important role in the retention process.
For the analysis of complex food samples, often consisting of different lipid species, a combination of two or more separation modes may be recommendable, aiming at enhancing the resolving power of the chromatographic system [12]. For this, a NARP-LC separation mechanism based on the analyte hydrophobicity may effectively complement Ag+-LC. In NARP-LC, TAGs elute according to the increasing partition number (PN), defined as the total carbon number (CN) minus twice the number of DBs (PN = CN-2DBs) [13]. This separation mode, employing non-aqueous solvents, may fit the analytical purpose of non-polar compounds separation and is much more suitable to linkage to MS detection; for such reasons, NARP-LC-MS has been extensively employed for TAG analysis [3,14]. The coupling between Ag+- and NARP-LC can be conveniently employed in multidimensional separation approaches, aiming to increase the number of resolved compounds, as demonstrated by Holčapek et al., for the analysis of TAGs in plant oils and animal fats, with atmospheric pressure chemical ionization (APCI) MS detection [15]. The orthogonality of the two separation modes was successfully exploited in an off-line setup using NARP-LC in the first dimension (1D), followed by Ag+-LC analysis of the collected fractions in the second dimension (2D). The work resulted in the highest number of identified TAGs ever reported for the studied samples. Despite the high potential of the comprehensive LC approach (2D-LC, LC×LC), inherent drawbacks of the off-line technique are related to a longer analysis time and the risks associated with sample manipulation. Likewise, online LC×LC techniques, using a modulator (switching valve) for transferring the 1D eluate, minimize sample losses and contamination with the likelihood for system automation [16]. On-line Ag+-LC×NARP-LC was employed by Mondello et al., for the analysis of Borago officinalis oil with evaporative light scattering detection (ELSD) [17]. A total of 78 TAG compounds were tentatively identified on the basis of their chromatographic behavior; however, ELSD response, being dependent upon the size and the shape of the analyte particles, did not provide any information related to the molar masses. On the other hand, MS detection is regarded as the most useful approach to attain informative data for TAG identification, and APCI is the most convenient technique for the high ionization efficiency of non-polar analytes and the easier coupling to NARP-LC [18].
In this research, an LC×LC system composed of silver thiolate (1D) and C18 (2D) columns coupled to ion trap-time of flight (IT-ToF) MS was investigated for the elucidation of TAGs in a borage oil sample. The coupling of orthogonal separation techniques and MS detection turned out to be a useful strategy when dealing with such a complex food sample. The use of MS represents an added dimension to the LC separation system, unravelling post-column co-eluting components and enabling the identification of 94 TAGs in the sample in a reliable and repeatable way.

2. Materials and Methods

2.1. Reagents and Sample Preparation

LC-MS grade acetonitrile (AcN), butyronitrile (BN), n-hexane and 2-propanol were obtained from Merck Life Science (Darmstadt, Germany). The following standard TAGs: POP, OOP, OOO, LLP, LLO, and LLL (P: palmitic acid, O: oleic acid, L: linoleic acid) were from Merck Life Science; LLγLn, γLnLγLn (Ln: linolenic acid) were from Cayman Chemical (Ann Harbour, MI). Standard TAG solutions were 100 ppm each in n-hexane. Borage oil was purchased at a local market, diluted in n-hexane (1000 ppm) and filtered through a 0.45 μm Whatman nylon membrane (Merck Life Science).

2.2. Instruments and Analytical Conditions

LC×LC analyses were carried out on a Nexera LC-30A system consisting of a CBM-20A controller, four LC-30AD parallel-flow pumps, a DGU-20A5R degassing unit, a CTO-20A column oven, and a SIL-30AC autosampler; the system was coupled to an LCMS-IT-ToF mass spectrometer by an APCI source (Shimadzu Europa, Duisburg, Germany). The two LC dimensions were connected using two electronically controlled two-position, six-port high-pressure FCV-32AH switching valves, placed inside the column oven and equipped with two 11 μL empty loops. The entire system, including the switching valves, was controlled by the LCMSsolution software ver. 3.50.346 (Shimadzu Europa, Duisburg, Germany). The LC×LC data were visualized and elaborated into two and three dimensions using Chromsquare ver. 1.3 software (Shimadzu Europa, Duisburg, Germany).
Separations in 1D were performed on a lab-made silver thiolate column, 150 × 1.0 mm I.D., 5 μm d.p. (oven at 30 °C) with a mobile phase consisting of 1% BN in n-hexane (solvent A) and 10% BN in n-hexane (solvent B), at a flow rate of 7 μL/min, under the following linear gradient: 0 min, 10% B; 76 min, 25% B; 120 min, 35% B; 160 min, 85%B. Two μL of the n-hexane sample solution were injected. The switching valve time (modulation time) was 1.5 min, corresponding to the 2D gradient duration. Separations in 2D were achieved on a Titan C18 column, 50 × 4.6 mm I.D., 1.9 μm d.p. (Merck Life Science, Darmstadt, Germany) with a mobile phase consisting of AcN (solvent A) and 2-propanol (solvent B), at a flow rate of 4 mL/min, under the following repetitive gradient: 0 to 0.12 min, 30% B; 0.16 min, 50% B; 1.20 min, 70% B; 1.21 min, 30% B (hold for 0.29 min). For MS detection, 1 mL of the 2D flow was directed to an APCI source operated in positive ionization mode. The following parameters were applied: detector voltage, 1.60 kV; interface temperature, 350 °C; CDL temperature, 250 °C; block heater temperature, 200 °C; nebulizing gas flow (N2), 2.5 L/min; ion accumulation time, 30 msec; full scan range, 500 to 1100 m/z; event time, 300 ms (repeat, 3; ASC, 70%).
Repeatability studies of the monodimensional Ag+-LC separation were performed on a mixture of eight TAGs differing in unsaturation degree: POP (DB = 1), OOP (DB = 2), OOO (DB = 3), LLP (DB = 4), LLO (DB = 5), LLL (DB = 6), LLγLn (DB = 7), and γLnLγLn (DB = 8). The following gradient program of (A) n-hexane and (B) BN was employed for the separation: 0 to 36 min, 1 to 6% B; 36.01 min, 20% B (hold for 20 min); 40.01 min, 1% B. For estimation of the precision, five consecutive 5-µL injections were performed intra- day. For estimation of the intermediate precision, 15 replicate 5-µL injections were performed over three consecutive days. Repeatability studies of the two-dimensional comprehensive Ag+-LC×NARP-UHPLC separation were performed by three replicate 5 µL injections of the borage seed oil sample, over three consecutive days.

3. Results and Discussion

Vegetable oils derived from plant sources are complex mixtures mostly constituted from TAGs, which may contain saturated and unsaturated FAs, oleic, linoleic, linolenic, palmitic and stearic being the most common; extensive work in this field has been carried out by the research group of Holčapek [19]. Specifically, Borago officinalis L. (borage) seed oil is considered one of the most complex vegetable oils and further represents a valuable source of γ-linolenic acid; thus, this sample has considerable commercial value [20,21]. Given the high complexity of borage oil, efficient analytical tools are mandatory for the full elucidation of borage TAG constituents: to this aim, additional separation power was attained by the serial coupling of octadecylsilica (ODS) columns in NARP-LC; the resulting increase in identification capability obviously came at the expense of longer analysis times, e.g., approximately two hours were needed for the separation of 88 TAG constituents on a total column length of 45 cm [14,22,23]. A different analytical strategy consisting of LC×LC was employed for borage oil analysis [17], using micro-Ag+ and partially porous ODS columns in 1D and 2D, respectively. The complementary separation selectivity provided by the two columns allowed to locate a total of 78 TAGs in the 2D-LC retention plane, making the approach useful for identification purposes. However, such an approach did not provide any structural information, since ELSD was employed for detection.
In this research, an LC×LC approach based on the coupling of Ag+-LC to NARP-LC separation performed under ultra-high-pressure conditions (NARP-UHPLC) was developed to achieve pattern-type separation of borage seed oil TAGs, accounting for around 96% of the sample constituents. As far as the first separation dimension is concerned, a prototype silver thiolate chromatographic material was investigated, in which Ag+ ions are covalently anchored to a mercaptopropyl stationary phase. Such AgTCM material is claimed to offer a number of benefits over conventional silver ion columns, among which the reproducibility of separations afforded by a controlled silver content is of the utmost importance. The latter was investigated by performing intra-day and inter-day replicate injections of a standard TAG mixture available in the laboratory, with the unsaturation degree in the 1 to 8 range, as representative of the sample composition. Precision was evaluated in terms of the intra-day repeatability of five consecutive analyses, while intermediate precision or within-lab reproducibility was evaluated in terms of the inter-day variation of the retention times of 15 analyses performed over three days. Since the intra-day and inter-day %RSD values were lower than 1%, it was possible to conclude that the within- and between-days chromatographic injection variability was globally satisfactory, as can be appreciated from the results reported in Table 1, and fairly superior to those usually obtained with in-lab argentated columns [17].
For the analysis of a borage seed oil sample, separations in the two chromatographic dimensions were optimized separately, and afterwards, combined in a 2D approach; for this purpose, a number of stringent requirements must be satisfied. Ag+-LC×NARP-UHPLC represents one of the most orthogonal approaches in LC×LC, due to independent separation mechanisms operating on the two stationary phases; however, such a coupling is not straightforward due to the incompatibility of the solvents that are used in the two dimensions, and the possible lack of peak focusing at the head of the 2D. In the setup developed here, the possible mismatch between the immiscible solvents employed in the two dimensions and the possible lack of peak focusing at the head of the 2D were partially circumvented by the employment of a microbore 1D column. The latter could be operated at low flow rates (7 μL/min), and this in turn allowed for the transfer of a very small eluent fraction in each modulation. Finally, only 11 μL of the 1D eluent were transferred for the 2D separation, in each modulation.
A 150 × 1.0 mm I.D., 5 μm d.p. silver thiolate column was operated as 1D under a step gradient starting from 10% of solvent B (BN:n-hexane, 10:90, v/v) into solvent A (BN:n-hexane, 1:99, v/v) and reaching 85% B after 160 min. The LC×LC setup was configured around two electronically activated two-position, six-ports switching valves for within-loop automated fraction collection/re-injection, equipped with two storage loops of identical volume, viz. 11 μL.; a schematic of the system is depicted in Figure 1.
The whole 1D effluent was fractionated every 1.5 min, and transferred to the 2D column, consisting of a 50 mm length, 4.6 mm I.D. of a C18 column (1.9 μm d.p.), the modulation time (cycle time) of the switching valves being equal to the 2D analysis time. Such a choice was dictated by the need for the separation occurring in the 2D to be completed before the injection of another fraction eluting from the 1D column. Moreover, the transfer of a large number of cuts is also highly recommendable, since undersampling of the first-dimension peaks would determine a serious loss of information in the 2D separation. As a practical hindrance, 2D analysis should be fast enough to permit at least three to four transfers of the same 1D peak. These requirements were met by the employment of a high mobile phase flow rate in 2D (4 mL/min), under a gradient starting with a high amount of the weaker solvent (AcN) to ensure better on-column focusing. A fast ramp up to 70% of the stronger solvent (2-propanol) ensured the complete compound elution from the 2D column at the end of each gradient. Repetitive gradients were in fact necessary due to the large differences of the sample components in terms of polarity and hydrophobicity, making it impossible to find suitable isocratic conditions for their separation in a very short timeframe. Within each gradient cycle, proper time for the column reconditioning was also allotted (17 s). The requirements for very fast and efficient 2D separations were satisfied by the employment of a monodisperse silica column, consiting of spherical, sub-2 µm fully porous particles. The reduced particle size and the ultra-narrow particle size distribution enable an increase of efficiency and allow for faster separation and short reconditioning times, as demonstrated in a number of recent studies [24,25,26,27].
The Ag+-LC×NARP-UHPLC separation of a borage seed oil sample is shown in Figure 2 (relevant part of the TAGs elution region); the contour plot was obtained by IT-ToF detection through an APCI interface operated in the positive ionization mode. As can be easily appreciated, the TAGs are located characteristically in the 2D space according to their DB and PN values, as a result of the separation occurring in the 1D and 2D, respectively. The TAG sample components cover an extensive range of DB (between 0 and 9) and PN values (from 36 to 56), and were resolved by Ag+-LC×NARP-UHPLC through the complementary separation mechanisms of the two columns.
For the evaluation of the system performance, the system peak capacity, n C , was calculated using the method defined by Neue [28]:
n C = 1 + t g ( 1 n )   1 n ω
in which t g is the gradient run time, n is the number of peaks selected for the calculation, and ω is the average peak width. For the calculation of the peak capacity in 1D and 2D, the peak widths in the raw chromatograms were employed, i.e., before interpolation by the 2D software. The overall peak capacity of the Ag+-LC×NARP-UHPLC separation, obtained with a modulation time of 1.5 min, was calculated as equal to 925 (theoretical n C , 2 D ), being multiplicative of the individual values obtained for the two dimensions ( n C 1 × n C 2 ). However, such values are overestimated, since they do not take into account two phenomena that practically lower the final peak capacity, with respect to the “product rule”, viz. the degree of correlation between 1D and 2D separations, and the undersampling of the 1D peaks. The first factor may have a significant effect in 2D LC systems based on RP×RP, since the retention mechanisms would be identical; likewise, in the system employed here, the two separation dimensions (Ag+ and RP) are, at least in principle, truly orthogonal. On the other hand, the actual peak capacity achieved in 1D was severely affected by the undersampling effect; this contribution was quantitatively estimated according to the approach originally proposed by Guiochon [29], and further developed by Carr [30,31]. The loss of 1D peak capacity due to undersampling was estimated by γ , according to the number of fractions effectively transferred for each peak, based on the following equation:
γ = r 2 + 3.424 r
where r is the fraction collection ratio, derived by the relationship between the average peak widths ( ω 1 ) and the sampling time (i.e., the total analysis time in 2D, 2 t c y c ):
2 t c y c = ω 1 r
For the Ag+-LC×NARP-UHPLC separation, the number of colleted fractions per average peak width was calculated as equal to 2.59, the 2D cycle time being 1.5 min (equal to the 2D gradient time plus the 2D reconditioning time), and the average first dimension peak width being 3.89 min. Thus, the peak capacity in 1D was reduced by a factor ( γ ) of 1.23, to a “practical” value of approx 31. Finally, Equation (4) could be applied for the calculation of the peak capacity achieved in the LC×LC separation:
n C , 2 D = t 1 G   λ w 2   1 r 2 + 3.424
where t 1 G is the 1D gradient time, λ is the 2D gradient time (fraction of the 2D cycle time devoted to the separation), and w 2 is the average peak width in 2D (in this system, equal to 0.12 min). The practical peak capacity value was estimated as equal to 507.
The stability of the developed LC×LC system was assessed in terms of intermediate precision or within-lab reproducibility, by performing three Ag+-LC×NARP-UHPLC analyses over three days. The variability of retention times and peak areas of five different peaks are shown in Table 2, relative to TAG compounds eluted within the 160 min 1D gradient and covering the whole 2D gradient duration. The values were taken from the raw (non-interpolated) 2D chromatogram.
Individual TAGs were identified on the basis of their APCI-MS spectra, by evaluating [M+H]+ ions for the molecular weight determination and [M+H-RCOOH]+ fragment ions for the identification of the individual fatty acids. Non-polar TAGs were easily ionized by APCI-MS, and abundant in-source fragmentation was obtained under positive ionization mode, useful for the structure elucidation through the evaluation of the DG+ (diacylglycerol-like fragment) ions, resulting from the loss of a single FA group from the glycerol backbone, inferring TAGs composition in terms of FAs. The cleavage of fatty acids from the sn-1/3 positions on the glycerol skeleton is preferred compared to the sn-2 position, and this is reflected in a higher abundance of the corresponding [M+H-R1COOH]+ and [M+H-R3COOH]+ fragment ions. Thus, the lower [M+H-R2COOH]+ ion is generally used to determine the prevailing FA in the sn-2 position [23]. Following this criterion, a total of 94 TAG compounds could be indentified in the sample investigated and are reported in Table 3.
According to a widely accepted criterion, the investigated compounds were annotated employing initials of FA trivial names; sn-1 and sn-3 positions were not assigned and considered as equivalent, thus named according to the decreasing molecular masses of the FAs. Moreover, a preference of unsaturated fatty acids (mainly linoleic acid) in the sn-2 position is reported in the literature for plant oils [32]. For TAGs resulting from the combination of different FAs, three DG+ ions were observed, while for TAGs consisting of two or three moieties of the same FA, only two or one DG+ ions could be observed. As an example, the TAG showing a [M+H]+ ion of m/z 857.7504, could be assigned as the combination of oleic (O), palmitic (P) and linoleic acid (L), due to the presence of DG+ ions at m/z 575.5003, 577.5140 and 601.5109 (PL+, PO+ and LO+, respectively), i.e., the OLP molecule (#32 in Table 3). Likewise, two DG+ ions at m/z 603.5799 and 601.5135 (OO+ and OL+, respectively) appeared from the parent OLO molecule (#52 in Table 3), and only one DG+ ion at m/z 603.5292 (OO+) appeared from the parent OOO molecule (#34 in Table 3). The TAG composition of the sample investigated was in agreement with previously published data, in that a common characteristic of borage oil is the high levels of ω-6 polyunsaturated FAs (PUFAs), including linoleic acid (18:2) and γ-linolenic acid (18:3) [20,23].
Detection by APCI-MS ensured full compatibility with 2D NARP-UHPLC conditions, and with this, the better front-end separation afforded by LC×LC was highly beneficial prior to MS analysis, since clearer spectra were obtained. The TAG compounds reported in Table 3 as #50 (LLP), #52 (OLO), #56 (GLO), #61 (GLG), #64 (C24:1LO), and #68 (C24:1LG) are in fact characterized by the same unsaturation degree (DB = 4) and would coelute under Ag+-LC conditions. In the 2D approach employed here, they were separated according to the different PN values (i.e., 44, 46, 48, 50, 52 and 54), under 2D NARP-UHPLC conditions. Noticeably, TAG species showing the same DB and PN values could be partially separated, since the retention mechanism in Ag+-LC also enables separation according to the distribution of unsaturations within the FA chains in the TAG molecule [33]. In silver ion, the retention pattern of TAGs generally follows the same rules as for FAs, and TAG species are separated based on the overall number of DBs in the molecule. However, among two species having the same unsaturation degree, the TAG in which the double bonds are concentrated in one acyl moiety is retained more strongly, though unpredictable variations may occur, depending on the experimental conditions, and most of all, on the mobile phase composition [34,35]. Noteworthy examples are the species OLP and SγLnP (#32 and #33 in Table 3, respectively). These two TAG molecules have the same DB (3) and PN value (46), but a different distribution of the DBs in the FA moieties. In SγLnP, a single FA contributes to the overall unsaturation degree, while in OLP, the three DBs are located in two FA chains. As a result, these two species were partially separated by Ag+-LC×NARP-UHPLC (data not shown), and identified by the APCI-MS spectra reported in Figure 3 and Figure 4. The two isobaric molecules generated identical [M+H]+ ions; nonetheless, they could be easily differentiated on the basis of the characteristic [M+H-RCOOH]+ fragment ions, i.e., m/z 577.5140, 575.5003 and 601.5109 corresponding to PO+, PL+ and LO+ ions, respectively, originated from OLP, and m/z 601.5109, 573.4830 and 579.5282, corresponding to SγLn+, PγLn+ and SP+ ions, respectively, originated from SγLnP.

4. Conclusions

In this research, the separation of a complex vegetable sample, represented by borage seed oil, was achieved by Ag+-LC×NARP-UHPLC. The highest orthogonal selectivity of the two separation dimensions afforded a useful fingerprint-type distribution of the lipid components, characteristically located in the 2D space according to their DB values (in the 0 to 9 range) and PN values (in the 36 to 56 range). The enhanced separation power afforded by the LC×LC approach improved the quality of the APCI-MS spectra obtained after 2D NARP-UHPLC of the separated compounds, leading to the identification of 94 TAG compounds. The group-type separation afforded by this analytical approach may be useful to quickly fingerprint TAG components of oil samples.

Author Contributions

Conceptualization, P.D. (Paola Donato); methodology, P.D. (Paola Donato); validation, D.S.; formal analysis, P.A. and D.S.; investigation, P.D. (Paola Donato); resources, L.M.; data curation, P.A. and P.D. (Paola Donato); writing—original draft preparation, P.A.; writing—review and editing, P.D. (Paola Donato); visualization, P.A. and D.S.; supervision, L.M. and P.D. (Paola Dugo); project administration, L.M. and P.D. (Paola Dugo); funding acquisition, L.M. and P.D. (Paola Dugo). All authors have read and agreed to the published version of the manuscript.

Funding

This research received funding from Merck Life Science (Darmstadt, Germany) and Shimadzu Europa (Duisburg, Germany).

Data Availability Statement

Data will be made available upon request.

Acknowledgments

The authors are grateful to Francesco Gasparrini, Emeritus Professor at the Sapienza University of Rome (Rome, Italy) for kindly providing the lab-made silver thiolate column used in this research.

Conflicts of Interest

Paola Dugo and Luigi Mondello are scientific members of the Board of Directors of Chromaleont s.r.l.; Luigi Mondello is a member of the Scientific Committee of BeSep s.r.l.

References

  1. Donato, P.; Cacciola, F.; Beccaria, M.; Dugo, P.; Mondello, L. Lipidomics. In Comprehensive Analytical Chemistry, Advanced Mass Spectrometry for Food Safety and Quality; Picó, Y., Ed.; Elsevier: Amsterdam, The Netherlands, 2015; Volume 68, pp. 395–439. [Google Scholar]
  2. Buchgraber, M.; Franz, U.; Hendrik, E.; Elke, A. Triacylglycerol profiling by using chromatographic techniques. Eur. J. Lipid Sci. Technol. 2004, 106, 621–648. [Google Scholar] [CrossRef]
  3. Donato, P.; Dugo, P.; Mondello, L. Separation of Lipids. In Liquid Chromatography; Fanali, S., Haddad, P.R., Poole, C.F., Schoenmakers, P., Lloyd, D., Eds.; Elsevier: Amsterdam, The Netherlands, 2013; pp. 203–248. [Google Scholar]
  4. Donato, P.; Inferrera, V.; Sciarrone, D.; Mondello, L. Supercritical fluid chromatography for lipid analysis in foodstuffs. J. Sep. Sci. 2017, 40, 361–382. [Google Scholar] [CrossRef]
  5. Donato, P.; Micalizzi, G.; Oteri, M.; Rigano, F.; Sciarrone, D.; Dugo, P.; Mondello, L. Comprehensive lipid profiling in the mediterranean mussel (Mytilus galloprovincialis) using hyphenated and multidimensional chromatography techniques coupled to mass spectrometry detection. Anal. Bioanal. Chem. 2018, 410, 3297–3313. [Google Scholar] [CrossRef]
  6. Holčapek, M.; Liebisch, G.; Ekroos, K. Lipidomic Analysis. Anal. Chem. 2018, 90, 4249–4257. [Google Scholar] [CrossRef] [Green Version]
  7. Holčapek, M.; Lísa, M. Silver-ion liquid chromatography–mass spectrometry. In Handbook of Advanced Chromatography/Mass Spectrometry Techniques; Holčapek, M., Byrdwell, W.C., Eds.; Elsevier: London, UK, 2017; Volume 3, pp. 115–140. [Google Scholar]
  8. Dobson, G.; Christie, W.W.; Nikolova-Damyanova, B. Silver ion chromatography of lipids and fatty acids. J. Chromatogr. B Biomed. Appl. 1995, 671, 197–222. [Google Scholar] [CrossRef]
  9. Momchilova, S.M.; Nikolova-Damyanova, B.M. Advances in silver ion chromatography for the analysis of fatty acids and triacylglycerols-2001 to 2011. Anal. Sci. 2012, 28, 837–844. [Google Scholar] [CrossRef] [PubMed] [Green Version]
  10. Dillon, J.T.; Aponte, J.C.; Tarozo, R.; Huang, Y. Efficient liquid chromatographic analysis of mono-, di-, and triglycerols using silver thiolate stationary phase. J. Chromatogr. A 2012, 1240, 90–95. [Google Scholar] [CrossRef]
  11. Aponte, J.C.; Dillon, J.T.; Tarozo, R.; Huang, Y. Separation of unsaturated organic compounds using silver–thiolate chromatographic material. J. Chromatogr. A 2012, 1240, 83–89. [Google Scholar] [CrossRef]
  12. Cacciola, F.; Donato, P.; Sciarrone, D.; Dugo, P.; Mondello, L. Comprehensive liquid chromatography and other liquid-based comprehensive techniques coupled to mass spectrometry in food analysis. Anal. Chem. 2017, 89, 414–429. [Google Scholar] [CrossRef]
  13. Dugo, P.; Beccaria, M.; Fawzy, N.; Donato, P.; Cacciola, F.; Mondello, L. Mass spectrometric elucidation of triacylglycerol content of Brevoortia tyrannus (menhaden) oil using non-aqueous reversed-phase liquid chromatography under ultra high pressure conditions. J. Chromatogr. A 2012, 1259, 227–236. [Google Scholar] [CrossRef]
  14. Lísa, M.; Holčapek, M. Triacylglycerols in nut and seed oils: Detailed characterization using high-performance liquid chromatography/mass spectrometry. In Nuts and Seeds in Health and Disease Prevention; Preedy, V.R., Watson, R.R., Patel, V.B., Eds.; Academic Press: London, UK, 2011; pp. 43–54. [Google Scholar]
  15. Holčapek, M.; Velínská, H.; Lísa, M.; Cesla, P. Orthogonality of silver-ion and non-aqueous reversed-phase HPLC/MS in the analysis of complex natural mixtures of triacylglycerols. J. Sep. Sci. 2009, 32, 3672–3680. [Google Scholar] [CrossRef] [PubMed]
  16. Stoll, D.R.; Carr, P.W. Two-Dimensional liquid chromatography: A state of the art tutorial. Anal. Chem. 2017, 89, 519–531. [Google Scholar] [CrossRef]
  17. Mondello, L.; Beccaria, M.; Donato, P.; Cacciola, F.; Dugo, G.; Dugo, P. Comprehensive two-dimensional liquid chromatography with evaporative light scattering detection for the analysis of triacylglycerols in Borago officinalis. J. Sep. Sci. 2011, 34, 688–692. [Google Scholar] [CrossRef]
  18. Holčapek, M.; Lísa, M.; Jandera, P.; Kabátová, N. Quantitation of triacylglycerols in plant oils using HPLC with APCI-MS, evaporative light-scattering, and UV detection. J. Sep. Sci. 2005, 28, 1315–1333. [Google Scholar] [CrossRef]
  19. Holčapek, M.; Jandera, P.; Zderadička, P.; Hrubá, L. Characterization of triacylglycerol and diacylglycerol composition of plant oils using high-performance liquid chromatography-atmospheric pressure chemical ionization mass spectrometry. J. Chromatogr. A 2003, 1010, 195–215. [Google Scholar] [CrossRef]
  20. Eskin, N.A.M. Borage and evening primrose oil. Eur. J. Lipid Sci. Technol. 2008, 110, 651–654. [Google Scholar] [CrossRef]
  21. Asadi-Samani, M.; Bahmani, M.; Rafieian-Kopaei, M. The chemical composition, botanical characteristic and biological activities of Borago officinalis: A review. Asian Pac. J. Trop. Med. 2014, 7, S22–S28. [Google Scholar] [CrossRef] [Green Version]
  22. Lísa, M.; Holčapek, M.; Boháč, M. Statistical Evaluation of Triacylglycerol Composition in Plant Oils Based on High-Performance Liquid Chromatography Atmospheric Pressure Chemical Ionization Mass Spectrometry Data. J. Agric. Food Chem. 2009, 57, 6888–6898. [Google Scholar] [CrossRef]
  23. Lísa, M.; Holčapek, M. Triacylglycerols profiling in plant oils important in food industry, dietetics and cosmetics using high-performance liquid chromatography–atmospheric pressure chemical ionization mass spectrometry. J. Chromatogr. A 2008, 1198–1199, 115–130. [Google Scholar] [CrossRef]
  24. Ismail, O.H.; Catani, M.; Pasti, L.; Cavazzini, A.; Ciogli, A.; Villani, C.; Kotoni, D.; Gasparrini, F.; Bell, D.S. Experimental evidence of the kinetic performance achievable with columns packed with the new 1.9 μm fully porous particles Titan C18. J. Chromatogr. A 2016, 1454, 86–92. [Google Scholar] [CrossRef]
  25. Sommella, E.; Pepe, G.; Ventre, G.; Pagano, F.; Manfra, M.; Pierri, G.; Ismail, O.; Ciogli, A.; Campiglia, P. Evaluation of two sub-2 μm stationary phases, core-shell and totally porous monodisperse, in the second dimension of on-line comprehensive two dimensional liquid chromatography, a case study: Separation of milk peptides after expiration date. J. Chromatogr. A 2015, 1375, 54–61. [Google Scholar] [CrossRef]
  26. Broeckhoven, K.; Desmet, G. Advances and Innovations in Liquid Chromatography Stationary Phase Supports. Anal. Chem. 2021, 93, 257–272. [Google Scholar] [CrossRef]
  27. Catani, M.; Ismail, O.H.; Cavazzini, A.; Ciogli, A.; Villani, C.; Pasti, L.; Bergantin, C.; Cabooter, D.; Desmet, G.; Gasparrini, F.; et al. Rationale behind the optimum efficiency of columns packed with new 1.9 µm fully porous particles of narrow particle size distribution. J. Chromatogr. A 2016, 1454, 78–85. [Google Scholar] [CrossRef]
  28. Neue, U.D. Theory of peak capacity in gradient elution. J. Chromatogr. A 2005, 1079, 153–161. [Google Scholar] [CrossRef] [PubMed]
  29. Horváth, K.; Fairchild, J.N.; Guiochon, G. Generation and Limitations of Peak Capacity in Online Two-Dimensional Liquid Chromatography. Anal. Chem. 2009, 81, 3879–3888. [Google Scholar] [CrossRef]
  30. Gu, H.; Huang, Y.; Carr, P.W. Peak capacity optimization in comprehensive two dimensional liquid chromatography: A practical approach. J. Chromatogr. A 2011, 1218, 64–73. [Google Scholar] [CrossRef] [PubMed] [Green Version]
  31. Davis, J.M.; Stoll, D.R.; Carr, P.W. Effect of First-Dimension Undersampling on Effective Peak Capacity in Comprehensive Two-Dimensional Separations. Anal. Chem. 2008, 80, 461–473. [Google Scholar] [CrossRef] [PubMed]
  32. Lísa, M.; Netušilová, K.; Franěk, L.; Dvořáková, H.; Vrkoslav, V.; Holčapek, M. Characterization of fatty acid and triacylglycerol composition in animal fats using silver-ion and non-aqueous reversed-phase high-performance liquid chromatography/mass spectrometry and gas chromatography/flame ionization detection. J. Chromatogr. A 2011, 1218, 7499–7510. [Google Scholar] [CrossRef]
  33. Nikolova-Damyanova, B. Retention of lipids in silver ion high-performance liquid chromatography: Facts and assumptions. J. Chromatogr. A 2009, 1216, 1815–1824. [Google Scholar] [CrossRef]
  34. Christie, W.W. Separation of molecular species of triacylglycerols by high-performance liquid chromatography with a silver ion column. J. Chromatogr. A 1988, 454, 273–284. [Google Scholar] [CrossRef]
  35. Neff, W.E.; Adlof, R.O.; List, G.R.; El-Agaimy, M. Analyses of Vegetable Oil Triacylglycerols by Silver Ion High Performance Liquid Chromatography with Flame Ionization Detection. J. Liq. Chromatogr. 1994, 17, 3951–3968. [Google Scholar] [CrossRef]
Figure 1. Schematic of the LC×LC system, showing the routes for each 2D separation, corresponding to different positions of the two six-port, two-position switching valves. (a) Loop 1 becomes filled with the 1D eluent, while the 2D pumps flush the content of loop 2 towards the 2D column. (b) Loop 2 becomes filled with the 1D eluent, while the 2D pumps flush the content of loop 1 towards the 2D column.
Separations 08 00088 g001
Figure 2. Ag+-LC×NARP-UHPLC separation of a borage seed oil (total ion chromatogram obtained by APCI-MS in positive ion mode).
Separations 08 00088 g002
Figure 3. APCI-MS spectrum obtained for the peak of OLP.
Separations 08 00088 g003
Figure 4. APCI-MS spectrum obtained for the peak of SγLnP.
Separations 08 00088 g004
Table 1. Intra- and inter-day variabilities for TAGs retention times (15 injections).
PeakRetention Time (Minutes)
Intra-Day AssaysInter-Day Assays
t ¯ R ± s % R S D t ¯ R ± s % R S D
116.19 ± 0.050.3016.29 ± 0.090.55
217.65 ± 0.030.1717.72 ± 0.090.51
319.12 ± 0.050.2619.19 ± 0.080.42
420.59 ± 0.060.2920.72 ± 0.200.97
522.47 ± 0.060.2722.52 ± 0.080.36
624.49 ± 0.060.2424.53 ± 0.080.33
726.53 ± 0.050.1926.57 ± 0.070.26
828.50 ± 0.040.1428.51 ± 0.070.25
t ¯ R ± s , average retention time ± standard deviation; % R S D , relative standard deviation percentage. Peak compounds: POP (1), OOP (2), OOO (3), LLP (4), LLO (5), LLL (6), LLγLn (7), γLnLγLn (8).
Table 2. Inter-day variabilities for TAGs retention times * and peak areas (three injections).
PeakRetention Time (Minutes)Peak Area
t ¯ R ± s % R S D A v e r a g e ± s % R S D
1141.005 ± 1.230.9237,513,401 ± 2,479,635.816.61
2111.005 ± 2.011.81712,277,629 ± 40,314,913.85.66
397.505 ± 0.840.86677,656,664 ± 45,470,762.26.71
473.505 ± 0.751.02483,139,425 ± 29,906,330.46.19
561.505 ± 0.200.339,674,556 ± 248,636.0892.57
t ¯ R ± s , average retention time ± standard deviation; % R S D , relative standard deviation percentage. * Total retention times are given by the sum of 1D retention time + 2D retention time.
Table 3. Triacylglycerols identified in the borage seed oil, their DB and PN. For each molecule, m/z values of the theoretical protonated molecular ion ([M+H]+ theor) and the observed protonated molecular ion ([M+H]+ exp), the experimental mass accuracy (error, ppm), and the observed diglyceride ions (DG+ exp) are reported.
#TAGDBPN[M+H]+
Theor
[M+H]+
Exp
DG+
Exp
DG+
Exp
DG+
Exp
Error
(ppm)
1PPP048807.7436ndPP, 551.4641 -
2SPP050835.7749ndSP, 579.5520PP, 551.4970 -
3POP148833.7593ndPP, 551.4877PO, 577.5152 -
4SOP150861.7906ndOP, 577.5122SP, 579.5578SO, 605.5433-
5SOS152889.8219ndSO, 605.5468SS, 607.5575 -
6AOP152889.8219ndAO, 633.5779OP, 577.5107AP, 607.5575-
7BOP154917.8532ndBO, 661.5996OP, 577.5149BP, 635.5797-
8AOS154917.8532ndAO, 633.5785OS, 605.5499AS, 635.5797-
9LgOP156945.8845ndLgO, 689.6104OP, 577.5140LgP, 663.6274-
10BOS156945.8845ndBO, 661.6147SO, 605.5388BS, 663.62840-
11PLP246831.7436831.7494PP, 551.5020PL, 575.4978 6.9
12OOP248859.7749859.7733PO, 577.5152OO, 603.5265 1.9
13SLP248859.7749859.7733SL, 603.5265LP, 575.4973SL, 603.52651.9
14GOP250887.8062887.8080GO, 631.5566OP, 577.5161GP, 605.54202.0
15ALP250887.8062887.8080AL, 631.5565LP, 575.505AP, 607.54472.0
16SLS250887.8062887.8080SL, 603.5271SS, 607.5447 2.0
17SOO250887.8062887.8080OO, 603.5271SO, 605.5420 2.0
18C22:1OP252915.8375915.8354C22:1O, 659.5895OP, 577.5151C22:1P, 633.57152.3
19AOO252915.8375915.8354AO, 633.5715OO, 603.5296 2.3
20GOS252915.8375915.8354GO, 631.5572SO, 605.5437GS, 633.57152.3
21BLP252915.8375915.8354BL, 659.5895LP, 575.4986BP, 635.60662.3
22ALS252915.8375915.8354AL, 631.5572LO, 601.5243AO, 633.57152.3
23C24:1OP254943.8688943.8705C24:1O, 687.6199OP, 577.5144C24:1P, 661.60411.8
24C22:1OS254943.8688943.8705C22:1O, 659.5888OS, 605.5433C22:1S, 661.60411.8
25BOO254943.8688943.8705BO, 661.6041OO, 603.5324 1.8
26LgLP254943.8688943.8705LgL, 687.6196LP, 575.4772LgP, 663.64321.8
27BLS254943.8688943.8705BL, 659.5888LS, 603.5324BS, 663.64321.8
28C24:1OS256971.9001ndC24:1O, 687.5943OS, 605.5515C24:1S, 689.6465-
29LgOO256971.9001ndLgO, 689.6465OO, 603.4264 -
30LgLS256971.9001ndLgL, 687.5943LS, 603.4264LgS, 691.6627-
31PγLnP344829.7280829.7257PP, 551.5008PγLn, 573.4831 2.8
32OLP346857.7593857.7545PL, 575.5003PO, 577.5140LO, 601.51095.6
33SγLnP346857.7593857.7545SγLn, 601.5109PγLn, 573.4830SP, 579.52825.6
34OOO348885.7906885.7939OO, 603.5292 3.7
35GLP348885.7906885.7939GL, 629.5392LP, 575.5004GP, 605.53753.7
36SLO348885.7906885.7939LO, 601.5169SL, 603.5292SO, 605.53753.7
37SγLnS348885.7906885.7939SS, 607.5575SγLn, 601.5169 3.7
38ALO350913.8219913.8202AL, 631.5587LO, 601.5143AO, 633.57291.9
39BγLnP350913.8219913.8202BγLn, 657.5726PγLn, 573.4856BP, 635.59011.9
40GLS350913.8219913.8202GL, 629.5421LS, 603.5285GS, 633.57291.9
41GOO350913.8219913.8202GO, 631.5587OO, 603.5285 1.9
42C22:1OO352941.8532941.8515C22:1O, 659.5901OO, 603.5278 1.8
43C24:1LP352941.8532941.8515C24:1L, 685.6038LP, 575.4989C24:1P, 661.60401.8
44C22:1OG354969.8845969.8789C22:1O, 659.5889OG, 631.5591C22:1G, 687.61635.8
45C24:1OO354969.8845969.8789C24:1O, 687.6163OO, 603.5286 5.8
46C24:1LS354969.8845969.8789C24:1L, 685.6038LS, 603.5286C24:1S, 689.63395.8
47LgLO354969.8845969.8789LgL, 687.6163OL, 601.5146LgO, 689.63395.8
48C22:1OC22:1356997.9158ndC22:1O, 659.5894C22:1C22:1, 715.6480 -
49C24:1OG356997.9158ndC24:1O, 687.6221OG, 631.5586C24:1G, 715.6480-
50LLP444855.7436855.7401LP, 575.5005LL, 599.4967 4.1
51γLnOP444855.7436855.7401OγLn, 599.4967PγLn, 573.4853PO, 577.51464.1
52OLO446883.7749883.7694OO, 603.5799OL, 601.5135 6.2
53SLL446883.7749883.7694LL, 599.4969SL, 603.5799 6.2
54GγLnP446883.7749883.7694GγLn, 627.5231PγLn, 573.4848GP, 605.53866.2
55SOγLn446883.7749883.7694OγLn, 599.4969SγLn, 601.5135SO, 605.53866.2
56GLO448911.8062911.7993GO, 631.5567OL, 601.5146GL, 629.54497.6
57C22:1γLnP448911.8062911.7993C22:1γLn, 655.5573γLnP, 573.4834C22:1P, 633.57357.6
58ALL448911.8062911.7993LL, 599.5042AL, 631.5567 7.6
59GγLnS448911.8062911.7993GγLn, 627,5336SγLn, 601.5146GS, 633.57357.6
60C22:1LO450939.8375939.8345C22:1L, 657.5740LO, 601.5142C22:1O, 659.58863.2
61GLG450939.8375939.8345GL, 629.5450GG, 659.5886 3.2
62BLL450939.8375939.8345BL, 659.5886LL, 599.5040 3.2
63C24:1γLnP450939.8375939.8345C24:1γLn, 683.5854PγLn, 573.4833C24:1P, 661.60293.2
64C24:1LO452967.8688967.8639C24:1L, 685.6038LO, 601.5137C24:1O, 687.61775.1
65LgLL452967.8688967.8639LgL, 687.6177LL, 599.4961 5.1
66C24:1γLnS452967.8688967.8639C24:1γLn, 683.5891SγLn, 601.5137C24:1S, 689.63385.1
67C22:1LC22:1454995.9001995.8919C22:1L, 657.5935C22:1C22:1, 715.6518 8.2
68C24:1LG454995.9001995.8919C24:1G, 715,6449GL, 629.5437C24:1L, 685.60418.2
69C24:1LC22:14561023.9314ndC24:1C22:1, 743.7023C22:1L, 657.5960C24:1L, 685.6038-
70γLnLP542853.7280853.7251PγLn, 573.4852LP, 575.4991LγLn, 597.47863.4
71OLL544881.7593881.7557LL, 599.4979LO, 601.5102 4.1
72OOγLn544881.7593881.7557OO, 603.5791OγLn, 599.4979 4.1
73SLγLn544881.7593881.7557SL, 603.5791LγLn, 597.4829SγLn, 601.51024.1
74GLL546909.7906909.7893LL, 599.4985GL, 629.5434 1.4
75GOγLn546909.7906909.7893GO, 631.5538OγLn, 599.4985GγLn, 627.56171.4
76ALγLn546909.7906909.7893AL, 631.5538LγLn, 597.4820ALn, 629.54341.4
77C22:1LL548937.8219937.8167LL, 599.4983C22:1L, 657.5733 5.5
78BLγLn548937.8219937.8167BL, 659.5866LγLn, 597.4889BLn, 657.57335.5
79C24:1LL550965.8532965.8522C24:1L, 685.6172LL, 599.4981 1.0
80C24:1OγLn550965.8532965.8522C24:1O, 687.6172OγLn, 599.4981C24:1γLn, 683.59021.0
81C22:1γLnC22:1552993.8845993.8809C22:1γLn, 655.5937C22:1C22:1, 715,6605 3.6
82γLnγLnP640851.7123851.7112γLnγLn, 595.4679PγLn, 573.4847 1.3
83LLL642879.7436879.7394LL, 599.4968 4.8
84OLγLn642879.7436879.7394OL, 601.5088LγLn, 597.4845OγLn, 599.49684.8
85SγLnγLn642879.7436879.7394γLnγLn, 595.4684SγLn, 601.5088 4.8
86GLγLn644907.7749907.7733GL, 629.5408LγLn, 597.4845GγLn, 627.52831.8
87C22:1LγLn646935.8062935.8065C22:1L, 657.5728LγLn, 597.4825C22:1γLn, 655.56120.3
88C24:1LγLn648963.8375963.8337C24:1L, 685.6049LγLn, 597.4802C24:1γLn, 683.59073.9
89γLnγLnPo738849.6967849.6957γLnγLn, 595.4453PoγLn, 571.4680 1.2
90LLγLn740877.7280877.7222γLnL, 597.4834LL, 599.4971 6.6
91γLnOγLn740877.7280877.7222OγLn, 599.4971γLnγLn, 595.4707 6.6
92GγLnγLn742905.7593905.7592GγLn, 627.5271γLnγLn, 595.4721 0.1
93γLnLγLn838875.7123875.7076LγLn, 597.4819γLnγLn, 595.4669 5.4
94γLnγLnγLn936873.6967873.6966γLnγLn, 595.4670 0.1
Abbreviations of FAs: P, palmitic (C16:0); Po, palmitoleic (C16:1); S, stearic (C18:0); O, oleic (C18:1); L, linoleic (C18:2); Ln, linolenic (C18:3); A, arachidic (C20:1); G, gadoleic (C20:1); B, behenic (C22:0); Lg, lignoceric (C24:0).
Publisher’s Note: MDPI stays neutral with regard to jurisdictional claims in published maps and institutional affiliations.

