Article

Detailed Group-Type Characterization of Plastic-Waste Pyrolysis Oils: By Comprehensive Two-Dimensional Gas Chromatography Including Linear, Branched, and Di-Olefins

Laboratory for Chemical Technology, Ghent University, Technologiepark 121, 9052 Ghent, Belgium
*
Author to whom correspondence should be addressed.
Separations 2021, 8(7), 103; https://doi.org/10.3390/separations8070103
Submission received: 31 May 2021 / Revised: 13 July 2021 / Accepted: 13 July 2021 / Published: 16 July 2021

Abstract

:
Plastic-waste pyrolysis oils contain large amounts of linear, branched, and di-olefinic compounds. This makes it not obvious to determine the detailed group-type composition in particular to the presence of substantial amounts of N-, S-, and O-containing heteroatomic compounds. The thorough evaluation of different column combinations for two-dimensional gas chromatography (GC × GC), i.e., non-polar × polar and polar × non-polar, revealed that the second combination had the best performance, as indicated by the bi-dimensional resolution of the selected key compounds. By coupling the GC × GC to multiple detectors, such as the flame ionization detector (FID), a sulfur chemiluminescence detector (SCD), a nitrogen chemiluminescence detector (NCD), and a mass spectrometer (MS), the identification and quantification were possible of hydrocarbon, oxygen-, sulfur-, and nitrogen-containing compounds in both naphtha (C5–C11) and diesel fractions (C7–C23) originating from plastic-waste pyrolysis oils. Group-type quantification showed that large amounts of α-olefins (36.39 wt%, 35.08 wt%), iso-olefins (8.77 wt%, 9.06 wt%), and diolefins (4.21 wt%, 4.20 wt%) were present. Furthermore, oxygen-containing compounds (alcohols, ketones, and ethers) could be distinguished from abundant hydrocarbon matrix, by employing Stabilwax as the first column and Rxi-5ms as the second column. Ppm levels of sulfides, thiophenes, and pyridines could also be quantified by the use of selective SCD and NCD detectors.

Graphical Abstract

1. Introduction

Disposal and upgrading of plastic waste is one of the main challenges of the 21st century [1,2]. Chemical recycling as an alternative to landfill through (catalytic) pyrolysis [3,4,5] is a very promising conversion technology to produce liquid energy carriers, waxes, and chemicals while minimizing negative impacts on the environment [6,7,8].
Catalytic and non-catalytic pyrolysis are processes in which organic material (i.e., plastic waste) is heated at high temperatures (300–900 °C), in the absence of oxygen, to break down its macromolecular constituents into smaller molecules with or without the aid of a catalyst. The product consists of non-condensables, a liquid fraction (aka the plastic-waste pyrolysis oil), and char [9,10,11,12]. For example, it has been shown that pyrolysis oil obtained by pyrolysis of post-consumer High-Density Polyethylene (HDPE) bears fuel properties similar to crude oil [13,14]. In general, these pyrolysis oils are complex mixtures of n-paraffins, iso-paraffins, olefins, diolefins, iso-olefins, naphthenes, and aromatics with a wide carbon number distribution (C9–C25). It also contains a relatively low abundance of heteroatom compounds such as oxygen-, nitrogen-, and sulfur-containing compounds, as well as halogens and metals [14,15,16,17,18]. However, the compositions thereof vary widely depending on the plastic source used and the operating conditions applied (e.g., temperature, pressure, and residence time) [19,20,21].
To employ plastic-waste pyrolysis oils as liquid fuels or petrochemical feedstocks, a comprehensive identification and quantification of the chemical components is of utmost importance and indispensable. For example, the presence of nitrogen- and sulfur-containing compounds in petrochemical feedstocks should not exceed certain thresholds to guarantee the stable operation in the steam cracking units, as well as to avoid off-spec products [22,23,24,25,26]. Moreover, combustion of the nitrogen- and sulfur-containing compounds leads to air pollution due to the emission of NOx and Sox [14,27,28,29,30]. Consequently, the presence of nitrogen and sulfur compounds in the resulting pyrolysis oils might necessitate further refining treatment depending on the final purpose. Furthermore, plastic-waste pyrolysis oils usually contain high olefin concentrations compared to feedstocks from fossil origin [16]. These olefinic components, especially diolefins, are associated with gum formation when the oil is used as a fuel [31,32,33]. In addition, the high-temperature steam cracking of the pyrolysis oils with a high content of olefins is often subject to secondary chemical reactions in the presence of oxygenated compounds as impurities. This may lead to blockages and reduced heat transfer between the reactor walls or heat exchangers, as well as an increased tendency of coke formation [34,35].
Today, typically GC–MS/FID [36,37,38,39,40,41,42,43,44,45,46,47,48,49,50,51,52] is applied for the characterization of plastic-waste pyrolysis oils. However, this technique has some clear limitations in the elucidation of individual olefinic components due to the complex nature of the sample [16,31]. From an analytical point of view, one of the main difficulties is the separation and quantification of the different types of olefins. Firstly, the boiling points and polarities of diolefins are very similar to those of olefins, which results in the co-elution when one-dimensional GC would be used. Secondly, the fact that diolefins are often present in small amounts in comparison with linear olefins and n-paraffins in plastic-waste pyrolysis oils further hinder quantification [53]. Another obstacle is that the mass spectra, as well as mass fragmentation patterns of diolefins, are similar to those of the corresponding unsaturated mononaphthenes. Exploiting the ability of comprehensive GC × GC to provide a higher chromatographic resolution in comparison with one-dimensional GC, Sandra et al. used GC × GC-TOFMS in a reversed-phase mode in order to distinguish diolefins and olefins in the high-temperature Fischer–Tropsch-based fuels. In this work, the focus was on the identification of compound groups and not on the quantification of the identified components [31]. The use of GC × GC coupled to different detectors has also been applied by Toraman et al. to provide a comprehensive chemical characterization of plastic-waste pyrolysis oil. Nonetheless, the result mentioned only the PIONA (n-paraffins, iso-paraffins, olefins, naphthenes, and aromatics) classes without detailed information of α-olefins, iso-olefins, and diolefins [54]. Recently, the Heshka group devised a separation and quantification of olefins and diolefins in the naphtha and gasoline samples, using silver-ion High-Performance Liquid Chromatography (HPLC) [32]. However, in this study, only olefins and diolefins were separated and quantified, while aromatic components could not be separated and were omitted.
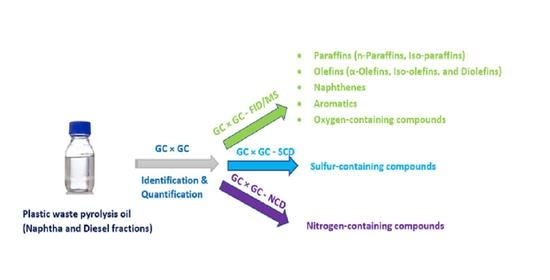
In this work, a new method for the characterization of plastic-waste pyrolysis oils and to accurately quantify the different classes of olefins and diolefins was developed by using comprehensive two-dimensional gas chromatography, GC × GC. Therefore, different GC × GC column configurations, i.e., non-polar × polar and polar × non-polar, were tested, evaluated, and optimized. The method is demonstrated on two fractions obtained from a chemical recycling plant, a lighter sample in the naphtha boiling range, and a heavier sample more in the diesel range. The compositions have been characterized in detail and show the power of coupling GC × GC to both non-selective and selective detectors (FID, MS and SCD, and NCD) for the identification and quantification of compounds in terms of carbon number and chemical class even at ppm-level.

2. Materials and Methods

2.1. Chemicals and Standards

Analytical gasses (helium, oxygen, nitrogen, hydrogen, and air) were provided by Air Liquide (Belgium) with a minimum purity of 99.99%. The internal standards, 3-chlorothiophene (98%) and 2-chloropyridine (99.9%), were purchased from Sigma-Aldrich (Overijse, Belgium). The diluents carbon disulfide and hexane were supplied with a minimum purity of 99.9% (Sigma-Aldrich, Belgium).

2.2. Sample Preparation

Two fractions of plastic-waste pyrolysis oils were produced by using a pilot plant unit for chemical recycling in the Laboratory of Chemical Technology at Ghent University. The first one is a light fraction with a boiling range similar to naphtha and is called “plastic waste naphtha”. The second one is a heavier product with a wider boiling-point range and is referred to as “plastic waste diesel”. Four different samples of each fraction were prepared for the separate analysis on GC × GC-FID, GC × GC-SCD, GC × GC-NCD, and GC × GC-MS. An internal standard was added to the sample for the GC × GC-FID/SCD/NCD analysis. The selected internal standard should be easily detectable on the selective detector, inert, and well-separated from the hydrocarbon matrix. Therefore, 3-chlorothiophene was chosen as an internal standard for the FID and SCD analyses, and 2-chloropyridine was chosen for the NCD analysis in line with previous work [16]. Furthermore, the amount of internal standard added to the sample should result in a similar peak height as the main compounds that need to be quantified. This results in 2.12 wt% and 2.14 wt% of 3-chlorothiophene added to the plastic-waste naphtha and diesel fraction for the FID analysis. For the SCD analysis, 90 ppm of 3-chlorothiophene was added, while for the NCD analysis, 8 ppm 2-chloropyridine was added.

2.3. Elemental Analyzer Setup

The elemental composition of the diesel and naphtha fraction was determined by using a Thermo Scientific™ FLASH 2000 Series Elemental Analyzer (EA) (Interscience, Louvain-la-Neuve, Belgium) equipped with both a Thermal Conductivity Detector (TCD) and a Flame Photometric Detector (FPD). The EA instrument consists of two different configurations, namely combustion and pyrolysis modes. The first one is used to determine the content of carbon, hydrogen, nitrogen, and sulfur (CHNS), while the latter is used to calculate elemental oxygen content (O). The information of the elemental content (CHNSO) could be obtained by the same setup in two separate operation modes. Because the samples are quite volatile, a liquid injection technique was applied to avoid interference of oxygen and nitrogen from the air.

2.4. GC × GC-FID/SCD/NCD/MS Setup

Two fractions were analyzed by using Thermo Scientific TRACE GC × GC setups (Interscience, Louvain-la-Neuve, Belgium). The setups are composed of a dual-state cryogenic modulator (liquid CO2) and a detector FID/SCD/NCD or MS. The different column sets and modulator were placed in the same oven. Various GC × GC column configurations, i.e., non-polar × polar (NP), polar × non-polar (PN), and mid-polar × non-polar (MPN), were tested in this study. An overview of the tested column combinations is given in Table 1.
The first GC × GC device was equipped with an FID and an SCD detector (Thermo Scientific, Interscience Belgium), and the second device was equipped with an NCD and an MS detector (Thermo Scientific, Interscience Belgium). For the FID, flow rates of H2, air, and N2 (make-up gas) were set at 35, 350, and 35 mL min−1, respectively. The FID temperature was set at 300 °C, and the data-acquisition rate was 100 Hz. For the SCD, flow rates of H2 and air were set at 45 and 5 mL min−1, respectively, while the burner temperature was set at 800 °C. For the NCD, the H2 and O2 flow rates were set at 5 and 10 mL min−1, respectively, while the burner temperature was set at 920 °C. The data-acquisition rate of the SCD and NCD was set at 100 Hz. For the MS, the data-acquisition rate was set at 30 spectra s−1, with the scanning range set from 30 to 400 amu. The GC–MS interface (transfer line) temperature was set at 280 °C, and the ion source temperature was set at 300 °C. The MS detector used electron ionization (70 eV). Helium was used as a carrier gas at a constant flow rate. The flow rates of carrier gas depended on the column combination and detector used. The modulation period was optimized to obtain a maximal resolution in the first dimension without causing a wrap-around. Therefore, different modulation regimes were applied depending on the column combination used, as well as the type of fraction. The GC system was operated in programmed temperature conditions and the applied programs for each column combination and sample type. A summary of GC × GC parameters applied in this work is given in Table 2.

2.5. Data Acquisition and Quantification

Thermo Scientific’s Chrom-Card data system was used for data acquisition and processing of the FID, SCD, and NCD, while Thermo Scientific’s XCalibur software was applied for data acquired with MS. The raw data of GC × GC-FID/SCD/NCD were exported to a cdf file, subsequently processed by GC Image (Zoex Corporation, Houston, TX, USA) for quantification. The tentative identification of the peaks is based on the combined information from the literature, Kovats retention indices, and the group-tile chromatogram obtained by the orthogonal separation of GC × GC. The identification of hydrocarbon compounds was performed by the use of GC × GC-MS, which could not be applied for sulfur- and nitrogen-containing compounds because of the interference of the hydrocarbon matrix. To assist in the identification of the sulfur-containing compounds, a standard mixture consisting of carbon disulfide, thiophene, dimethyl disulfide, 2-methyl thiophene, and 3-propyl thiophene was analyzed by the GC × GC-SCD setup to determine retention times thereof in both dimensions of GC × GC-SCD chromatogram (see Figure S1, Supporting Materials). Furthermore, a standard mixture consisting of pyridine, 2-methylpyridine, 2-ethylpyridine, and 5-ethyl-2-methylpyridine (Figure S2, Supporting Materials) was analyzed to support the identification of the nitrogen-containing compounds in the respective GC × GC-NCD chromatogram.
The peak names and peak volumes were exported as a csv file which was subsequently processed by using an in-house macro file. Thanks to the stability of the FID response, the quantification of the present compound groups was conducted from the FID chromatogram [55], based on the internal standard calibration method and the effective carbon number developed by Djokic et al. [56] and Dijkmans et al. [23,57]. In particular, a weight fraction of each compound is calculated based on the known amount of internal standard, using the following equation:
w t % i = f i × A i f I S × A I S w t % I S
where wt%i is the weight fraction of compound I; wt%IS is the weight fraction of internal standard; fi is the relative response factor of compound i, which is calculated based on effective carbon number approach [58]; fIS is the relative response factor of the internal standard (3-chlorothiophene), which is determined as 1.94 based on the calibration; Ai is the peak area of compound i; and AIS is peak area of the internal standard.
Furthermore, the quantification of sulfur- and nitrogen-containing compounds was based on SCD and NCD chromatograms applying the same methodology for FID. However, the response of the SCD and the NCD detectors is linear and equimolar to the amount of sulfur and nitrogen present in the sample. As a result, the following equation was applied, which was reported elsewhere [16].
w t % i = A i   A I S w t % I S   M i   .   N i M I S
where Ni is the number of sulfur or nitrogen atoms in compound i, and MIS is the molecular mass of the sulfur or nitrogen standard (3-chlorothiophene and 2-chloropyridine, respectively).
The mass fractions of all the quantified compounds in both samples are in a range of 95 and 105 wt%. Subsequently, all of these mass fractions are normalized to 100 wt%.

3. Results and Discussion

3.1. Column Combination Selection and Evaluation

The performance and suitability of different column combinations were evaluated by comparing the chromatographic resolution obtained for each analysis by calculating the bi-dimensional resolution of the internal standard, each detected compound, and the intraclass bi-dimensional resolution [27,54]. The bi-dimensional resolution was introduced by Giddings [59] and used by Dutriez [60], according to the following formula:
R 2 D = R 1 2 + R 2 2 = 2 ( Δ t r 1 ) 2 ( ω A 1 + ω B 1 ) 2 + ( Δ t r 2 ) 2 ( ω A 2 + ω B 2 ) 2  
While R1 is the first-dimension resolution, R2 is the second-dimension resolution; Δtr1 is the difference of retention time between compounds A and B in the first dimension; Δtr2 is the difference of retention time between compounds A and B in the second dimension; ωA1 is the peak width of compound A in the first dimension; ωB1 is the peak width of compound B in the first dimension; ωA2 is the peak width of compound A in the second dimension; and ωB2 is the peak width of compound B in the second dimension. The average bi-dimensional resolutions in the FID chromatograms of the most abundant chemical groups have been compared with different column combinations. The separation between the peaks is acceptable if the value of resolution R2D ≥ 1, and the separation between the peaks is good if the value of resolution R2D ≥ 1.5.

3.1.1. Plastic-Waste Diesel Pyrolysis Oil

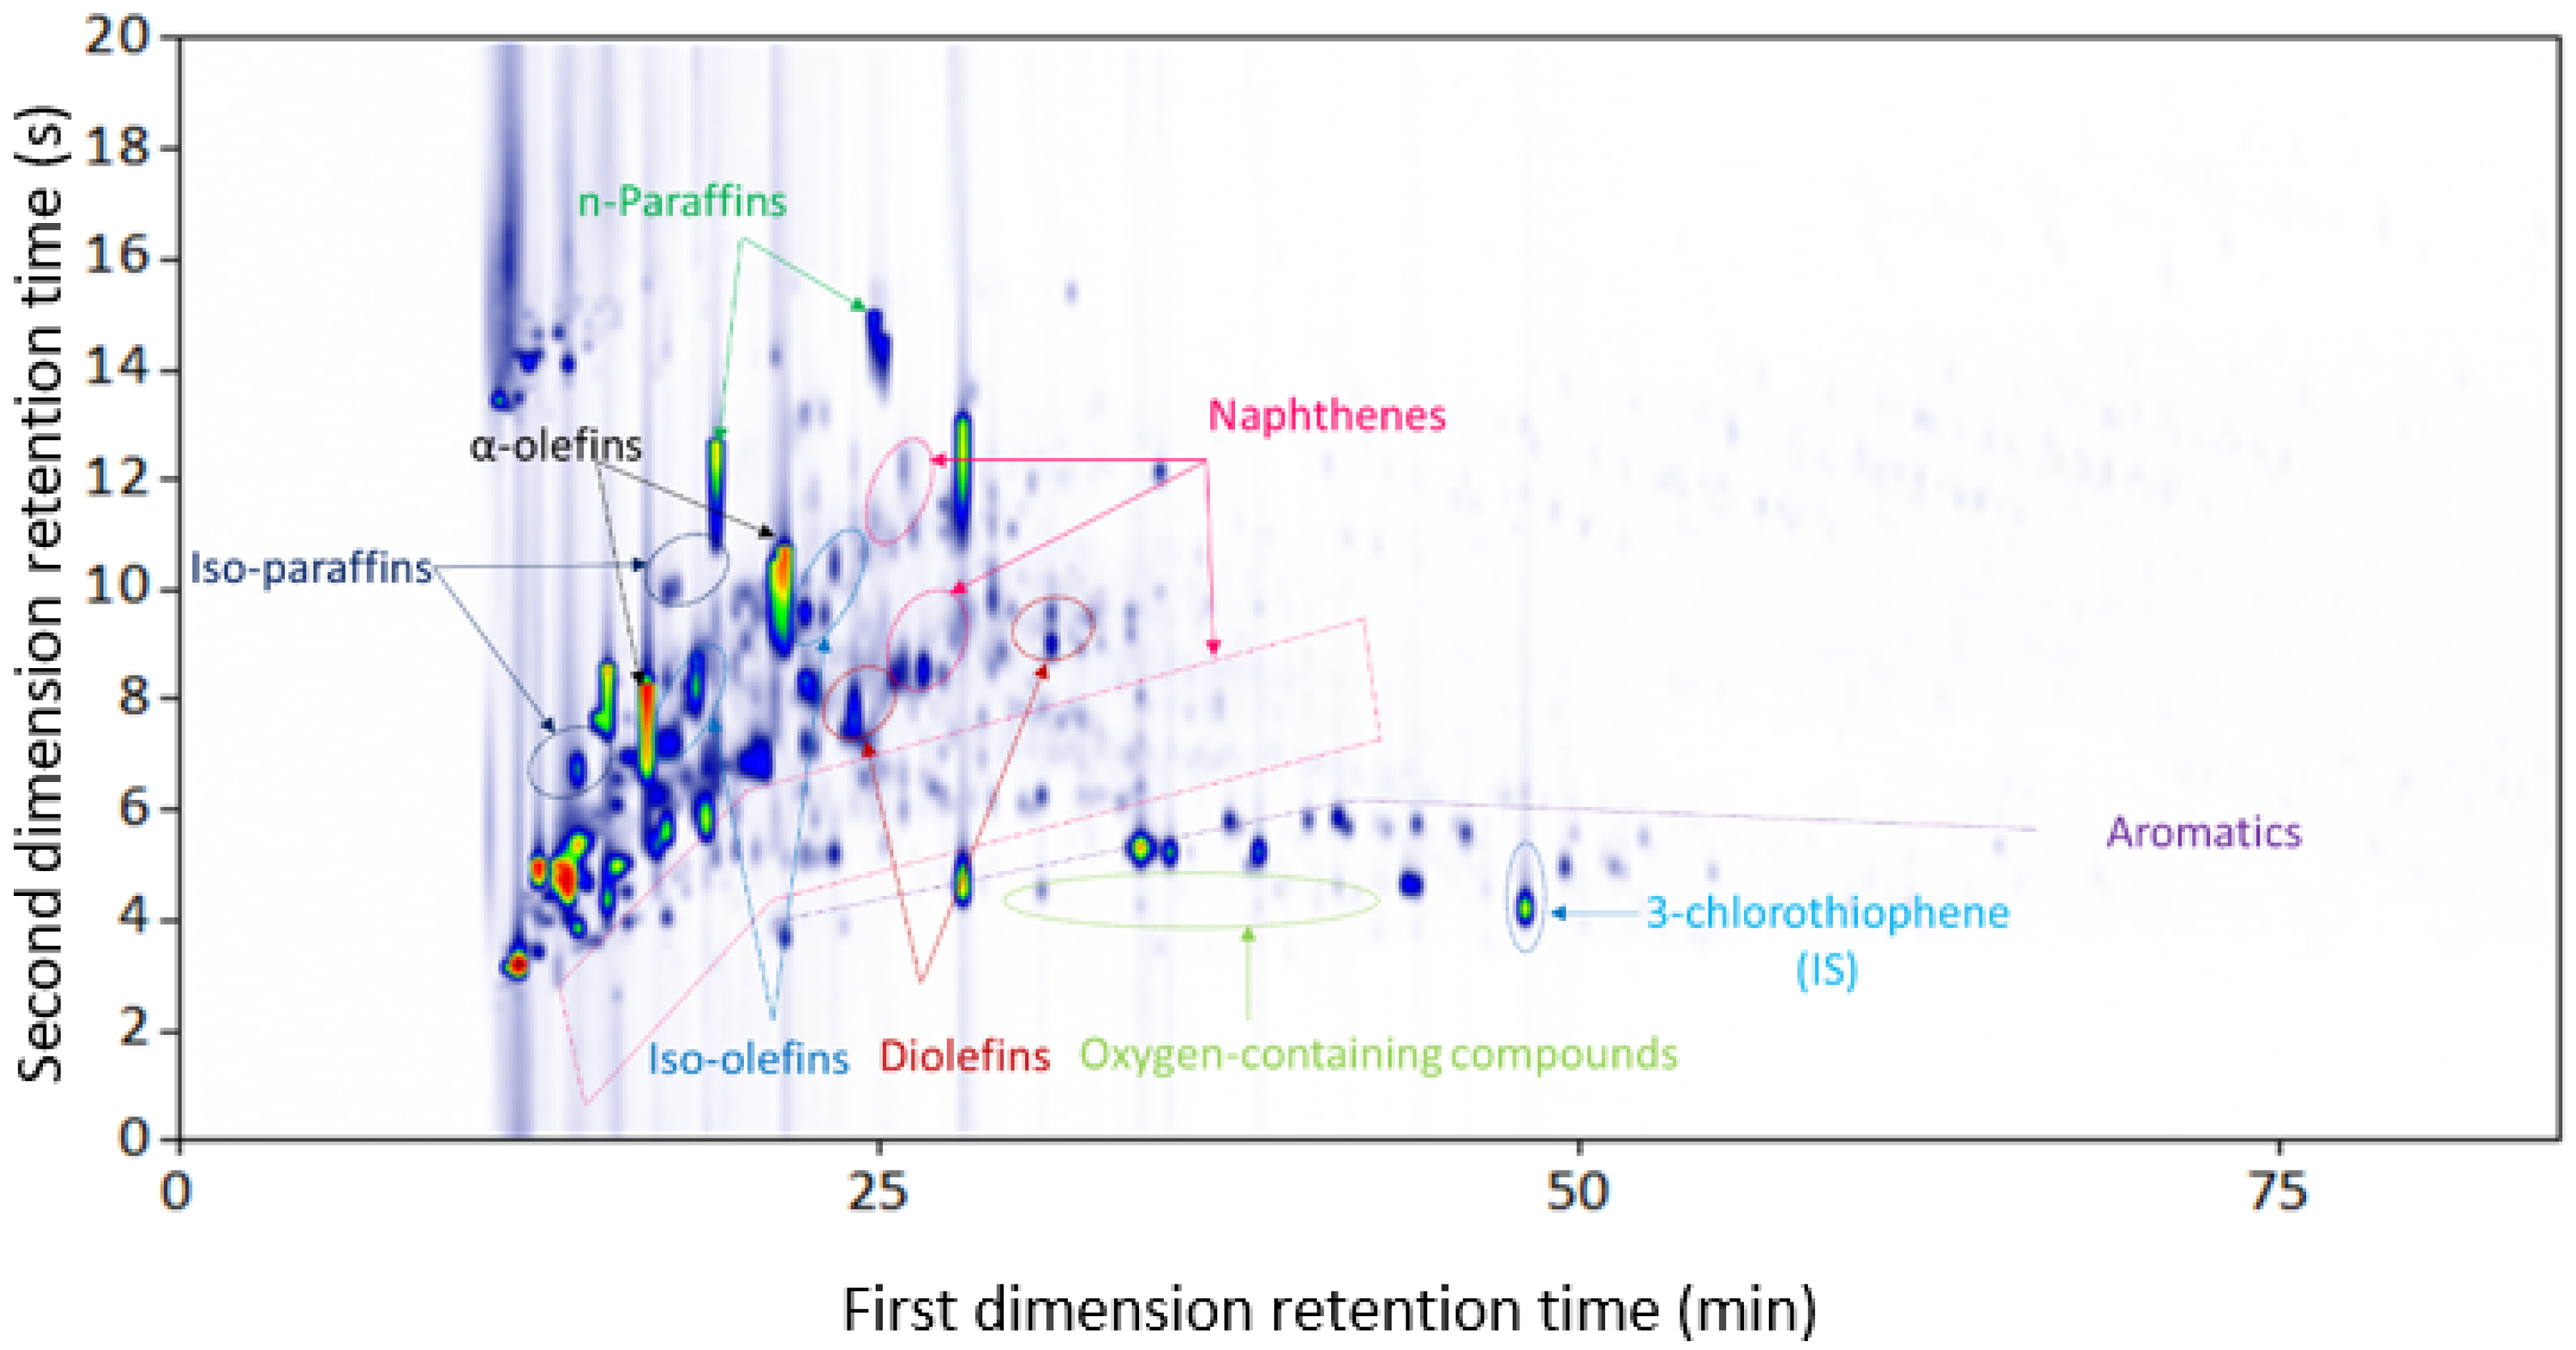
Initially, the diesel fraction was analyzed by using a normal-phase GC × GC column combination. In particular, a non-polar RTX-1 PONA column (50 m × 0.25 mm × 0.25 μm) in the first dimension was configured with a mid-polar BPX-50 column (2 m × 0.18 mm × 0.18 μm) in the second dimension. This combination gives the most abundant chemical groups present in the diesel sample as illustrated on the GC × GC-FID color plot in Figure 1. It should be noted that the ramp temperature plays an important role in the separation of iso-paraffins and iso-olefins. Namely, the ramp temperature at a rate of 2 °C/min instead of 3 °C/min considerably improved the separation between these adjacent groups. Furthermore, the chosen internal standard 3-chlorothiophene is nicely separated from the chemical components of the sample, with a calculated bi-dimensional resolution of 11.93.
The tentative identification of resulting peaks from GC × GC-FID was achieved by a reproducible analysis using GC × GC-MS with the identical column combination and an optimized carrier gas flow [61,62]. The result showed that the abundant chemical groups found in the diesel fraction are n-paraffins, α-olefins, iso-paraffins, iso-olefins, diolefins, naphthenes, and aromatics, which eluted and separated in the group-tile structure on the chromatogram. However, the preliminary result of the elemental analysis revealed that a small amount of oxygen-containing compounds is present in the sample, which could not be detected by using the normal-phase GC × GC combination. This could be explained by the co-elution of oxygenates and the abundant hydrocarbon matrix [27]. The biggest hurdle is the identification of diolefins due to the presence of unsaturated naphthenes, which have the same molecular mass and very similar mass fragmentation patterns on GC × GC-MS chromatogram with diolefins. Nevertheless, these diolefins are not completely separated from iso-olefins, and also neighboring peaks of the high amounts of both paraffins and olefins, which could cause an error in terms of the quantification. As aforementioned, the content of olefins and diolefins results in negative effects on quality control, as well as the technical process of fuels and feedstocks due to the gum-formation property through chemical secondary reaction (e.g., Diels–Alder reaction) [32,63]. Moreover, the heat value of plastic pyrolysis oils is reduced due to the presence of this unsaturated groups [64].
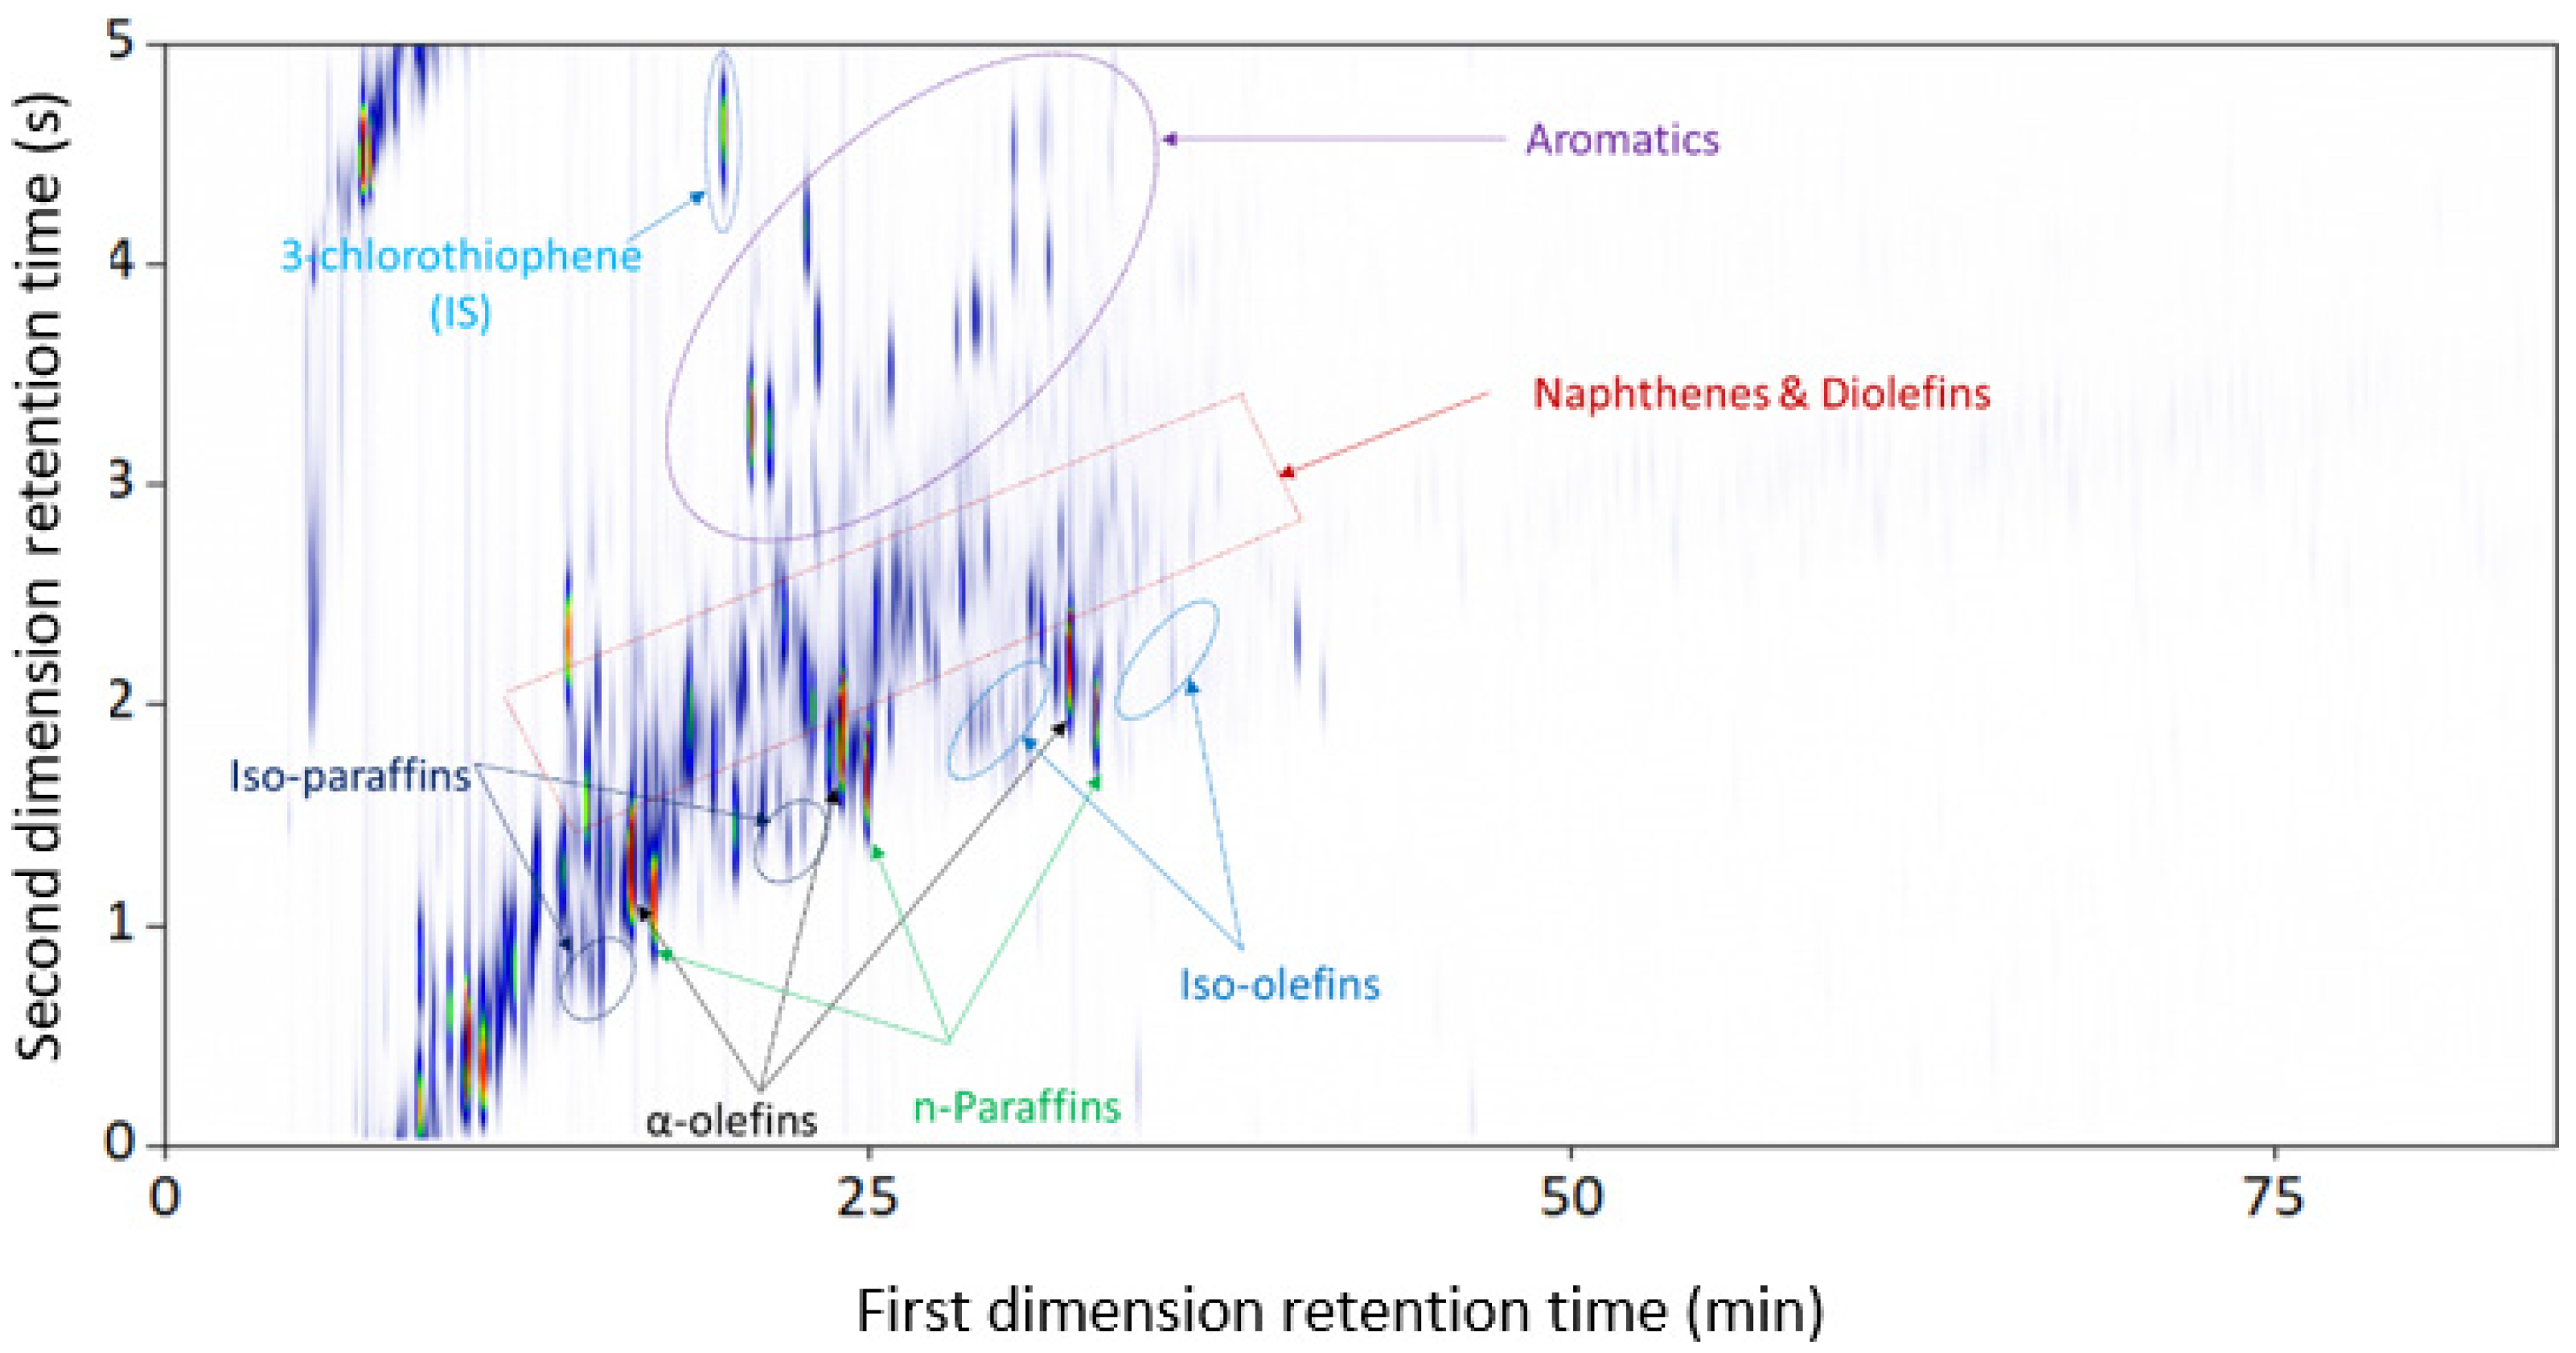
Taking advantages of reversed-phase column configuration, a Stabilwax (60 m × 0.25 mm × 0.25 μm) column in the first dimension coupled to a Rxi-5 ms (2 m × 0.1 mm × 0.1 μm) column in the second dimension was investigated [27,30,31,65]. The result is shown in Figure 2. It should be noted that modulation of 18 s is the best choice to avoid wrap-around phenomena and to obtain a satisfactory chromatogram.
As shown in Figure 2, the chosen internal standard 3-chlorothiophene does not overlap with any components present in the sample, which is confirmed by a high bi-dimensional resolution of 11.26. As such, the quantitative and qualitative performances on FID and MS of the sample are more accurate. A comparison of average bi-dimensional resolutions of the abundant components in the diesel fraction is given in Table 3. The results reveal that the group-type separation is improved remarkably not only for diolefins, iso-olefins, and α-olefins but also for n-paraffins, iso-paraffins, and monoaromatics, whereas the separation of naphthenes is deteriorated but still acceptable compared to the normal-phase combination. This finding is consistent with the result reported by Ristic et al. in an effort to improve the separation of unsaturated hydrocarbons and oxygen-containing compounds in a pyrolysis shale oil sample in which a polar × non-polar column set was applied [27]. Although both normal-phase and reversed-phase combinations resulted in high intraclass resolutions, while the latter combination could separate the oxygen-containing compounds from the hydrocarbon matrix, which were confirmed by the elemental analysis. The oxygenates did not arise in groups (or isomers), but rather sporadically, e.g., 2-ethyl-1-hexanol, 2-butyltetrahydrofuran, pentanal, and hexanal with a weight percent of 0.03 wt% corresponding to 0.01 wt% of elemental oxygen. These compounds were co-eluted with the high hydrocarbon content, using the normal-phase mode. The identification of these individual compounds is based on GC × GC-MS analysis combined with the NIST library.
It can be concluded that the reversed-phase set (Stabilwax and Rxi-5 ms) considerably improved the separation of the hydrocarbons (n-paraffins, α-olefins, diolefins, iso-olefins, iso-paraffins, and monoaromatics), as illustrated by an improvement in average bi-dimensional resolutions, and the set could identify oxygen-containing compounds compared to the normal-phase configuration (RTX-1 PONA and BPX-50). Therefore, the quantification of chemical components in the diesel fraction described in Figure 3 was obtained by using the GC × GC separation employing polar × non-polar column set. The diesel fraction consists of n-paraffins (28.36 wt%), α-olefins (36.39 wt%), and mononaphthenes + unsaturated mononaphthenes (14.62 wt%) as the most prominent chemical groups. Furthermore, it is composed of significant amounts of iso-paraffins (4.05 wt%), iso-olefins (8.77 wt%), diolefins (4.21 wt%), and dinaphthenes (2.30 wt%). In addition, small amounts of monoaromatics (0.72 wt%) and naphthenoaromatics (0.53 wt%) were detected in this fraction. Compared to hydrocarbons, only a small content of oxygenates was spotted with 0.03 wt%, corresponding to 0.01 wt% of total elemental oxygen in the EA result. The composition of the diesel sample is shown in Figure 3. The detailed chemical groups in the diesel fraction can be found in Supplementary Materials Table S1.

3.1.2. Plastic-Waste Naphtha Pyrolysis Oil

Analogously, the methodology applied for the diesel fraction was also exploited on the naphtha fraction. More specifically, a combination of a Stabilwax (60 m × 0.25 mm × 0.25 μm) column in the first dimension coupled to a Rxi-5 ms (2 m × 0.1 mm × 0.1 μm) column in the second dimension was examined on the naphtha fraction. The obtained result is shown in Figure 4.
This combination revealed an acceptable separation for diolefins from iso-olefins and unsaturated mononaphthenes with the same carbon number, which was confirmed by the bi-dimensional value of 1.87 (Table 4). Furthermore, the analysis could also detect the oxygenates existing in the naphtha fraction from the hydrocarbon matrix, which was disclosed from the elemental analysis result. Besides, the chosen internal standard (3-chlorothiophene) did not overlap with any components in the sample, whose bi-dimensional resolution is equal to 16.48. However, the presence of light hydrocarbons with carbon number distribution from C5 to C11 in the fraction, which eluted quite fast on the reversed-phase combination, gave a less effective separation of hydrocarbon classes, such as n-paraffins and α-olefins. As a result, the peak identification in the early elution region of the resulting chromatogram corresponding to the major distribution of n-paraffins, α-olefins, iso-olefins, and iso-paraffins groups could be wrongly assigned. To cope with this chromatographic obstacle, many operating conditions were adjusted, such as performing the analysis with a lower ramp temperature or setting the carrier gas (He) at a slower rate. Although many efforts were paid, the resulting chromatograms have not been improved.
The outcome above has shown that the use of a non-polar RTX-1 PONA column (50 m × 0.25 mm × 0.25 μm) in the first dimension with a mid-polar BPX-50 column (2 m × 0.18 mm × 0.18 μm) in the second dimension could provide a reasonable separation of the abundant hydrocarbon groups in the diesel fraction; this column set was, thus, tested on this naphtha fraction [27]. The result is presented in Figure 5.
The result showed a considerable improvement in the separation of chemical groups. The separability of two-column combinations for the naphtha fraction was evaluated for the most abundant chemical groups given in Table 4. In addition, a high value of bi-dimensional resolution of 10.39 was found for the internal standard (3-chlorothiophene).
The use of a normal-phase column set reveals a considerable separation improvement on n-paraffins, α-olefins, and monoaromatics. Furthermore, the reversed-phase column could separate oxygen-containing compounds from the abundant hydrocarbon matrix, while only benzofuran and butoxylbenzene were detected by using the normal-phase column set. It should be underlined that many other column combinations, as well as different analysis operations, were tested to obtain a satisfactory separation of all chemical groups present in the light naphtha fraction. For example, the use of mid-polar combinations of IL-59 × Rxi-5ms or BPX-50 × Rxi-5ms, or the use of longer BPX-50 column (4 m in length instead of 2 m) in the second dimension in normal-phase mode (RTX-1 PONA × BPX-50) was performed at various analytical conditions. However, these attempts could not give better results.
In a conclusion, the use of the reversed-phase column combination provides a significant separation capacity for diolefins and oxygenates in both diesel and naphtha fractions. However, this combination bears some limitations for the lighter naphtha fraction. Therefore, the quantification of the naphtha fraction is more accurate when using GC × GC-FID in the normal-phase combination (RTX-1 PONA × BPX-50). The naphtha fraction contains n-paraffins (15.22 wt%), α-olefins (35.08 wt%), and mononaphthenes (19.87 wt%) as the abundant chemical classes. The following contributions are of monoaromatics (9.10 wt%), iso-olefins (9.06 wt%), dinaphthenes (5.52 wt%), diolefins (4.20 wt%), and iso-paraffins (1.80 wt%). Moreover, a small number of naphthenoaromatics and oxygen-containing compounds (benzofuran and butoxylbenzene) were detected with values of 0.08 wt% and 0.06 wt%, respectively. The chemical groups in the naphtha fraction are demonstrated in Figure 6 with the carbon region between C5 and C11. The detailed chemical groups in the naphtha fraction can be found in Supplementary Materials Table S2.
As aforementioned, the implementation of the reversed-phase column combination could distinguish the oxygenates from the abundant hydrocarbon groups. As a result, the content determination thereof in the reversed-phase column combination is better compared to the normal-phase column set. The naphtha fraction contains an amount of alcohol, ketone, and ether chemical classes, which occupy 0.84 wt%, corresponding to 0.14 wt% of elemental oxygen. Because of the limitations of both the column combinations in the comprehensive quantification of chemical classes in the naphtha fraction, two-column sets could be thus employed to complement each other depending on the analytical purpose.

3.2. GC × GC-SCD

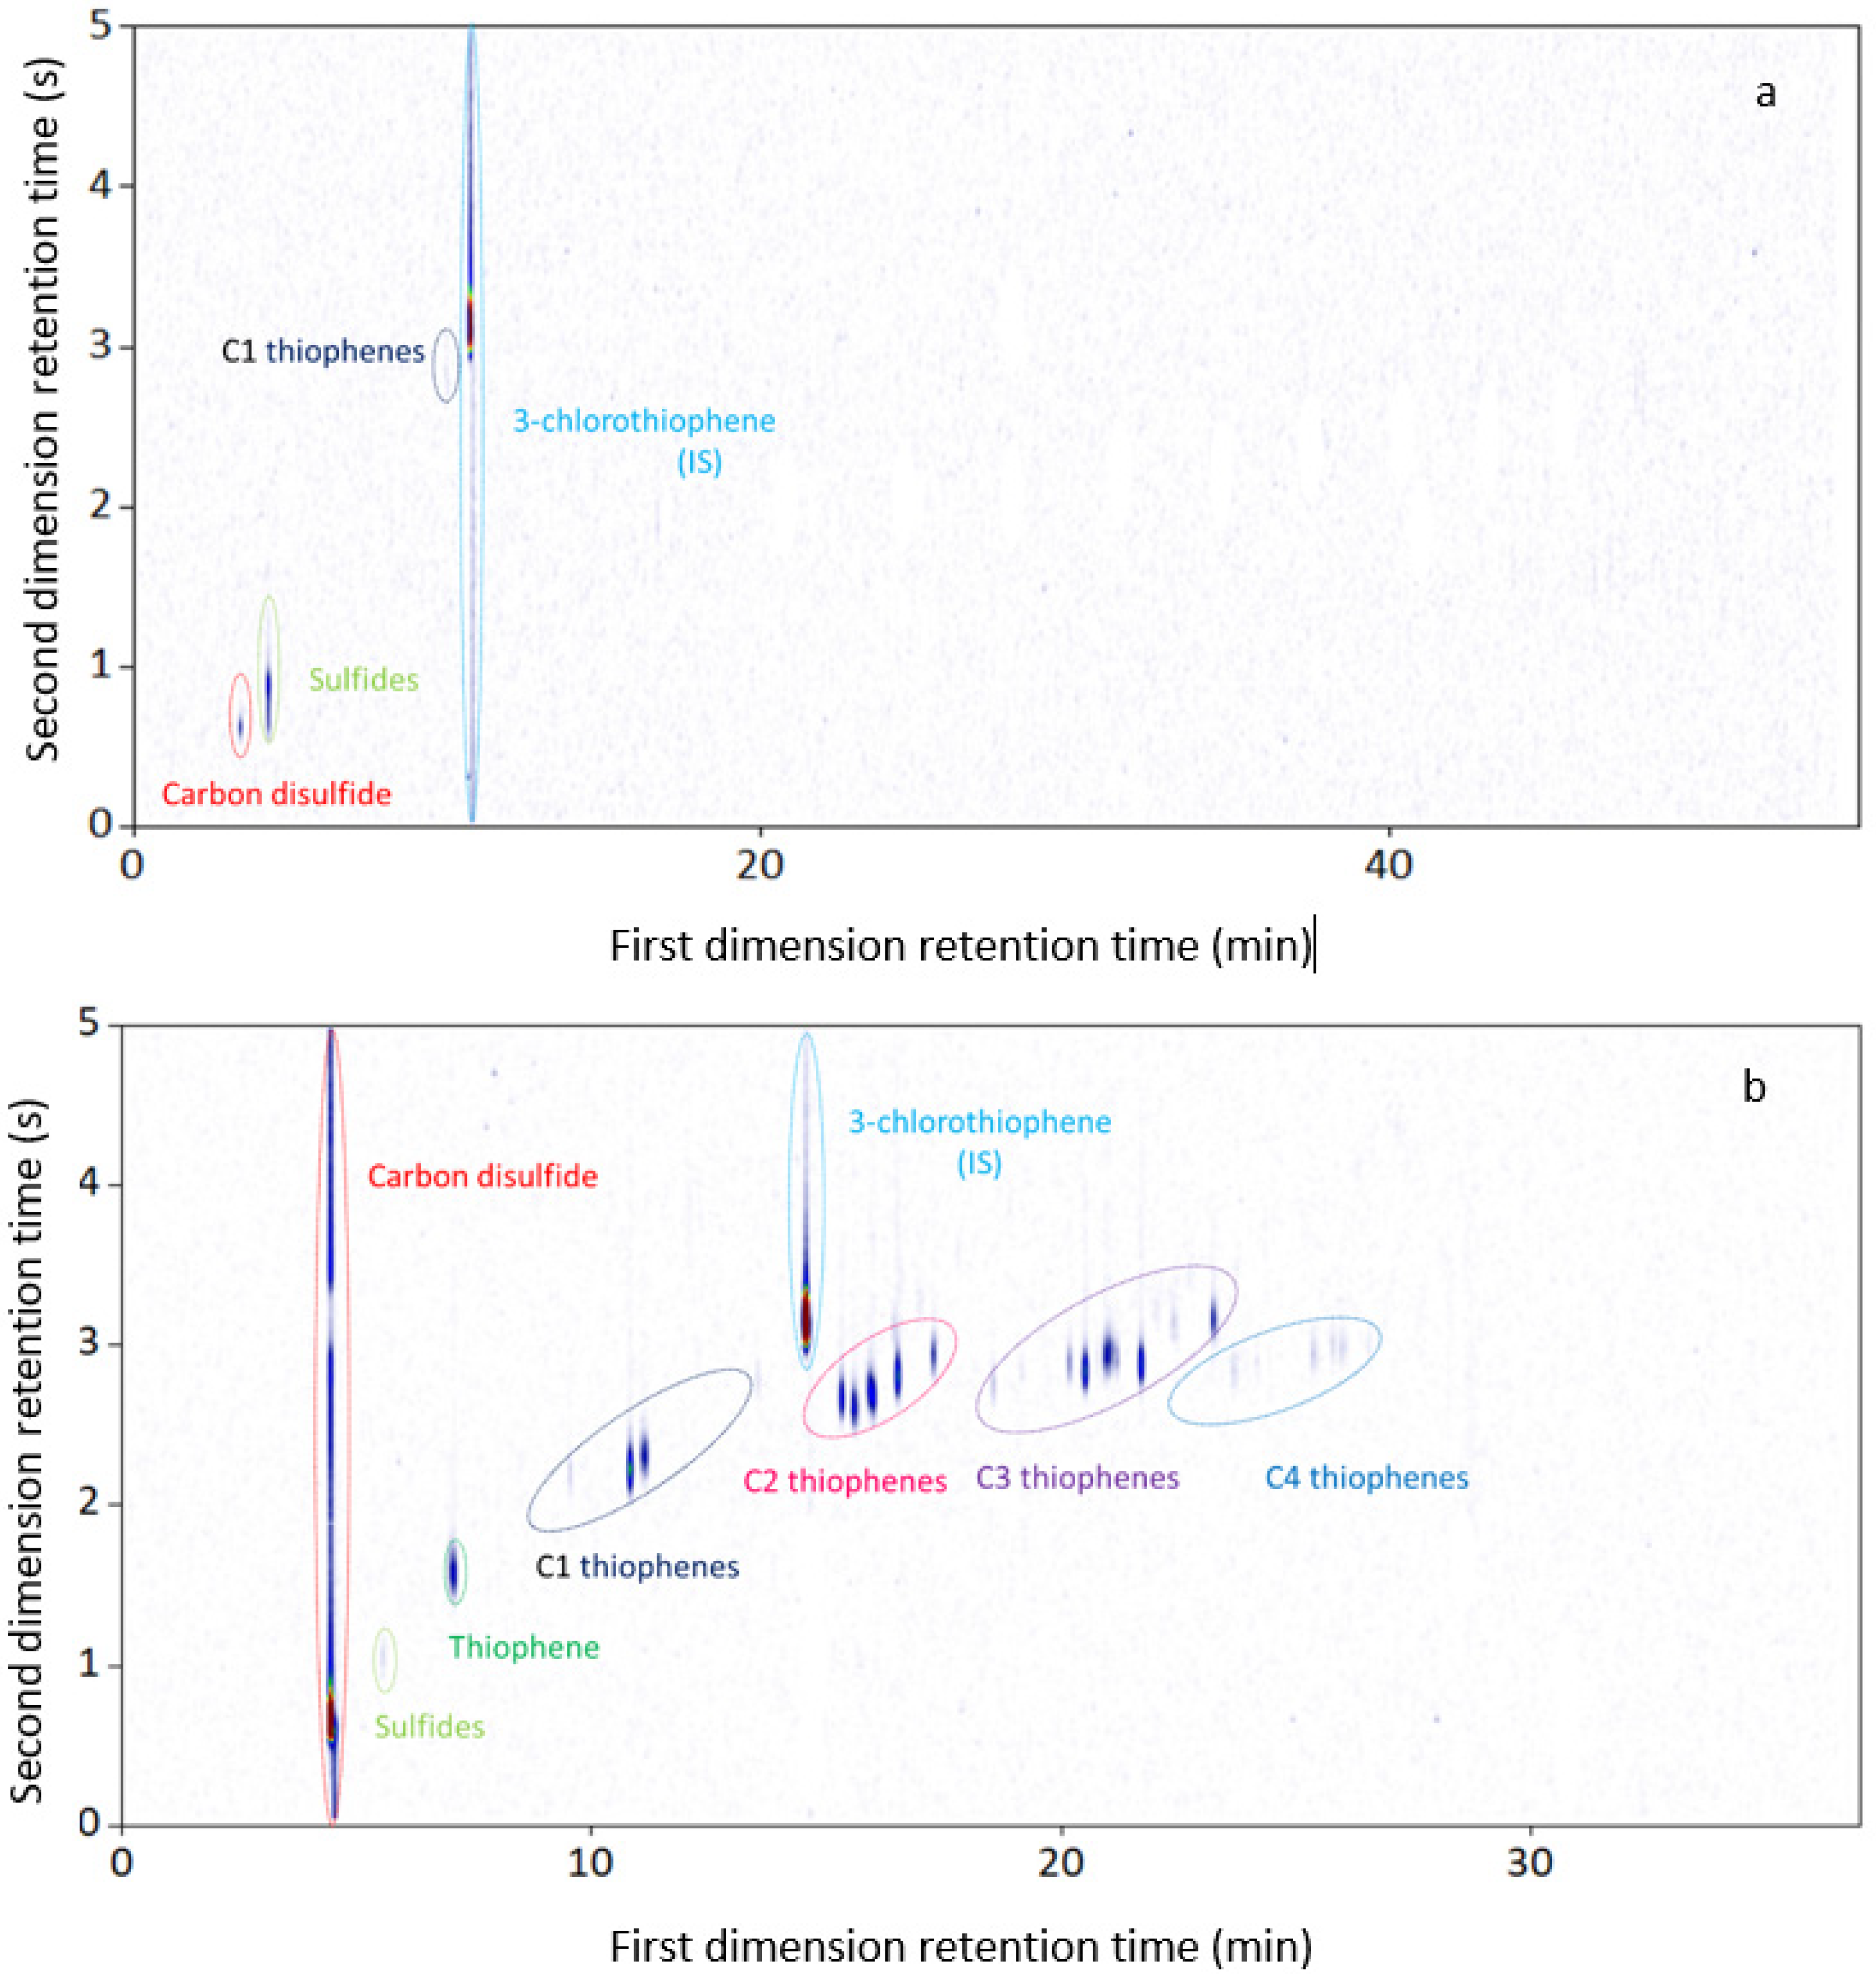
GC × GC-SCD was used to quantify sulfur-containing compounds. Figure 7 shows the GC × GC-SCD color plot of the diesel and naphtha fractions by the use of RTX-1 PONA column (50 m × 0.25 mm × 0.25 μm) in the first dimension, combined with BPX-50 column (2 m × 0.18 mm × 0.18 μm) in the second dimension. The GC × GC parameters are given in Table 2.
Figure 7a indicates a small amount of carbon disulfide, sulfides, and C1 thiophenes found in the diesel fraction with the sulfur content of 6.83 ppm, corresponding to 0.002 wt%. On the other hand, the carbon disulfide, sulfides, C1 thiophenes, C2 thiophenes, C3 thiophenes, and C4 thiophenes were detected in the naphtha fraction with the higher sulfur content of 210.74 ppm corresponding to 0.04 wt% in Figure 7b. In Figure 7b, carbon disulfide lost the modulation on the second dimension; it could be explained by its low boiling point and its presence in a higher concentration compared to other sulfur-containing compounds. However, the quantification thereof would not be an error, because it is well-separated from others. It should be noted that the use of GC × GC-SCD could reveal the presence of a small amount of sulfur-containing compounds, which overlap with the abundant hydrocarbon matrix, using GC × GC-FID, and also could not be detected by the elemental analysis. The detailed information on sulfur-containing compounds in the two diesel and naphtha fractions is given in Table 5.

3.3. GC × GC-NCD

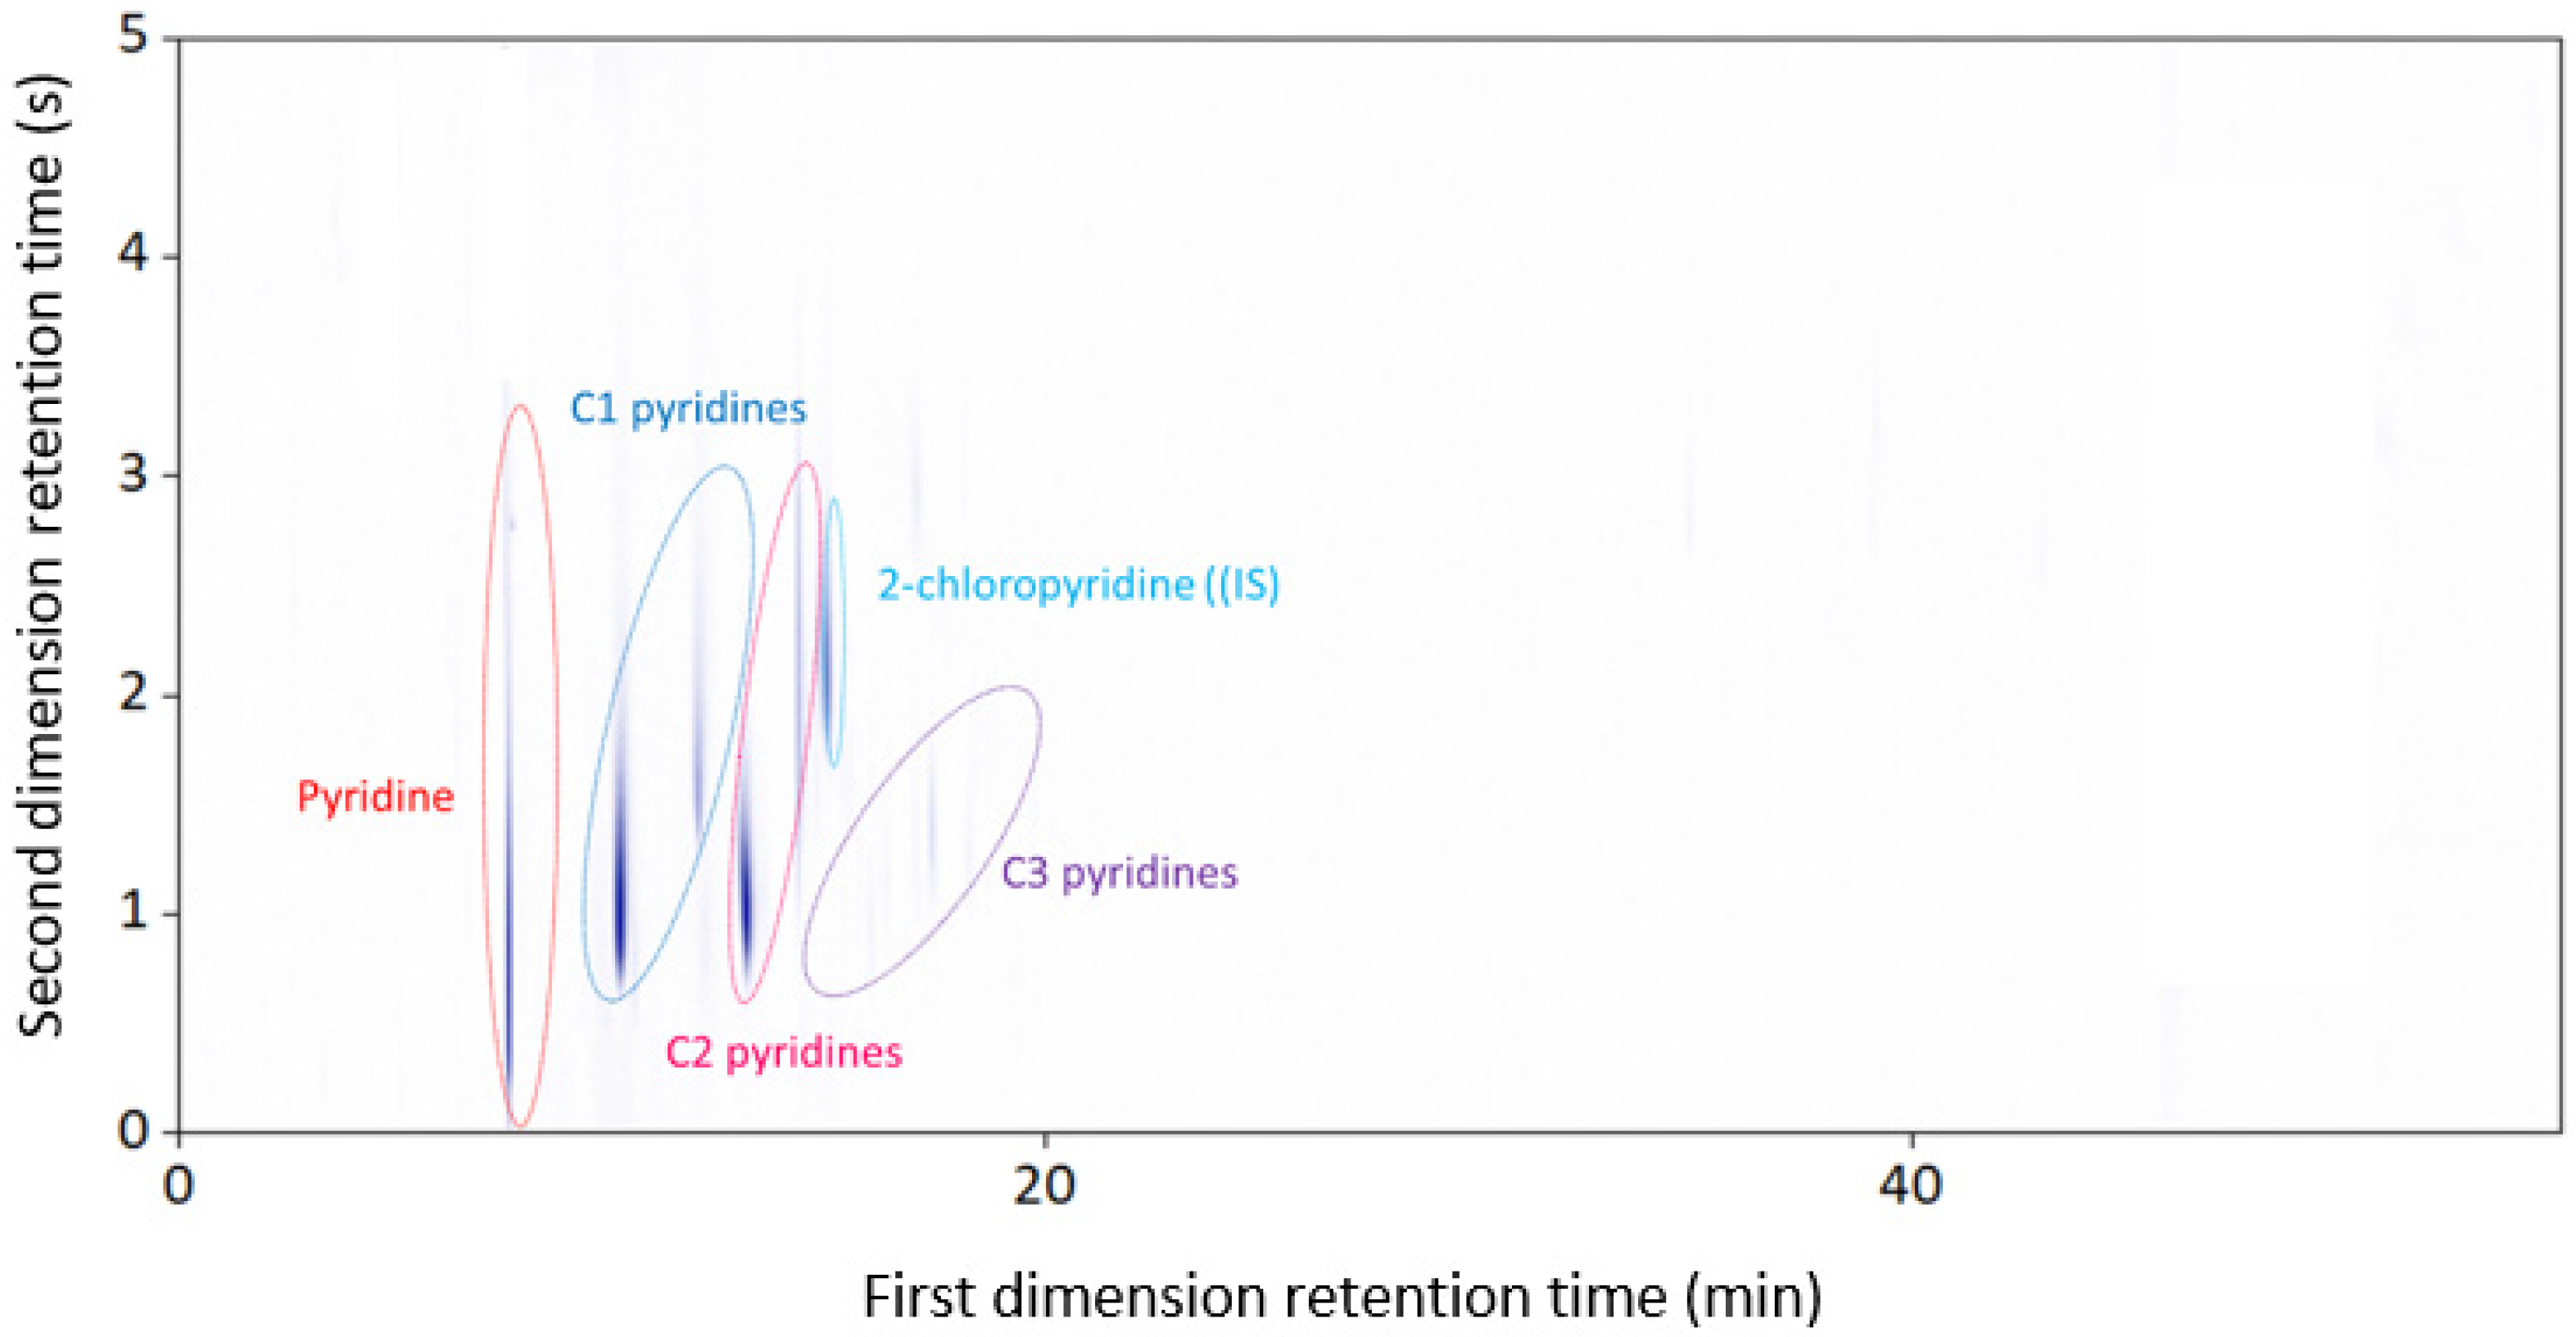
In addition to oxygen- and sulfur-containing compounds, nitrogen compounds are also commonly found in plastic-waste pyrolysis oils [16,24]. Analogous to sulfur-containing compounds, the nitrogen-containing compounds often overlap with the abundant hydrocarbon matrix when applying GC × GC-FID due to their low concentration. Therefore, an elemental NCD detector coupled with GC × GC was implemented for the detection of nitrogen-containing compounds in both diesel and naphtha fractions. A summary of GC × GC parameters and column combinations are presented in Table 2. For the diesel fraction, no nitrogen-containing compound was detected in GC × GC-NCD chromatogram. Figure 8 shows the GC × GC-NCD color plot of the naphtha fraction by the use of RTX-1 PONA column (50 m × 0.25 mm × 0.25 μm) in the first dimension, combined with BPX-50 column (2 m × 0.18 mm × 0.18 μm) in the second dimension.
It can be added that the confirmation of retention time of nitrogen compounds in the naphtha fraction was performed through the injection of a standard mixture containing pyridine, 2-methylpyridine, 2-ethylpyridine, and 5-ethyl-2-methylpyridine. The contribution of nitrogen-containing compounds to the naphtha fraction caused by pyridine, C1 pyridines, C2 pyridines, and C3 pyridines with a total amount of 30.46 ppm, corresponding to 0.05 wt%, is seen in Table 6.

3.4. Elemental Analysis

The CHNSO contents from EA analysis are compared with results obtained from the GC × GC-FID/SCD/NCD analysis in Table 7. It was shown that the hydrogen-to-carbon ratio (H/C) of the EA analysis is consistent with the result obtained from using GC × GC-FID. In particular, the H/C ratio of the diesel fraction is 2.02 for GC × GC and 2.03 for EA. The corresponding H/C values of the naphtha fraction are identical (1.93) in both analytical methods. Although the fact that the naphtha fraction of a fossil origin has the H/C value higher than a diesel fraction of the same origin, that is not in the case when these fractions come from plastic pyrolysis oils [66,67].
Furthermore, the oxygen elemental composition determined by EA is higher in comparison with the obtained results of GC × GC-FID in both studied samples. The smaller amount of oxygen components in the GC × GC results could be explained by the interference of the prominent hydrocarbon matrix in both naphtha and diesel fractions. Moreover, the presence of sulfur and nitrogen compounds in both samples could not be detected by EA, because their concentrations are below the instrumental detection limit. However, the use of GC × GC coupled to the SCD and NCD elemental detectors could allow for the determination of sulfur and nitrogen components at ppm levels.
The results have shown that the saturated property of hydrocarbons, as well as the concentration of heteroatom-containing compounds, is significantly improved in these diesel and naphtha fractions in comparison with plastic-waste pyrolysis oil without further upgrading the process [16].

4. Conclusions

A new method for the quantification of plastic-waste pyrolysis oils was developed using a two-dimensional gas chromatography GC × GC coupled to four different detectors (FID, SCD, NCD, and MS). With the StabilWax × Rxi-5ms/RTX-1 PONA × BPX-50 column combination, it was possible to accurately characterize the chemical compositions of two plastic-waste pyrolysis oils with different boiling points. One of the strengths of the developed method is the separation of different types of olefins by optimizing the column configuration and operating conditions. A combination of a polar × non-polar column configuration (StabilWax × Rxi-5ms) was shown as the best choice for the diesel fraction in terms of separability of diolefins from iso-olefins and mononaphthenes and oxygen-containing compounds from a complicated hydrocarbon matrix. This did not affect the separation of the other abundantly present classes of compounds, e.g., n-paraffins, iso-paraffins, and monoaromatics. Therefore, this column combination can be used for quantitation, even for samples containing small amounts of oxygenates.
Alternatively, using the non-polar × polar (RTX-1 PONA × BPX-50) combination was superior for the group-type separation of the naphtha fraction. With the selective SCD and NCS detectors, it was possible to detect trace amounts of sulfur and nitrogen compounds.

Supplementary Materials

The following are available online at https://www.mdpi.com/article/10.3390/separations8070103/s1, Figure S1. GC × GC-SCD chromatogram of the reference mixture obtained using an RTX-1 PONA column in the first dimension combined with BPX-50 column in the second dimension. Figure S2. GC × GC-NCD chromatogram of the reference mixture obtained using an RTX-1 PONA column in the first dimension combined with BPX-50 column in the second dimension. Table S1: Composition (wt%) of the diesel fraction in terms of all detected pure hydrocarbons and oxygenates by group types and carbon number (P = n-paraffins, I = iso-paraffins, O = α-olefins, IO = iso-olefins, DO = diolefins, MN = mononaphthenes + unsaturated mononaphthenes), DN = dinaphthenes, MA = monoaromatics, NA = naphthenoaromatics, Ot = oxygen-containing compounds). Table S2: Composition (wt%) of plastic waste pyrolysis oil derived naphtha fraction in terms of all detected pure hydrocarbons and oxygenates by group types and carbon number (P = n-paraffins, I = iso-paraffins, O = α-olefins, IO = iso-olefins, DO = diolefins, MN = mononaphthenes + unsaturated mononaphthenes), DN = dinaphthenes, MA = monoaromatics, NA = naphthenoaromatics, Ot = oxygen-containing compounds).

Author Contributions

Conceptualization, K.M.V.G.; methodology, K.M.V.G., M.R.D. and H.D.T.; software, H.D.T.; validation, H.D.T., M.R.D. and K.M.V.G.; formal analysis, H.D.T.; investigation, H.D.T.; data curation, H.D.T.; writing—original draft preparation, H.D.T.; writing—review and editing, H.D.T., M.R.D. and K.M.V.G.; supervision, K.M.V.G. and M.R.D.; project administration, K.M.V.G.; funding acquisition, K.M.V.G. All authors have read and agreed to the published version of the manuscript.

Funding

This research was funded by the European Research Council under the European Union’s Horizon 2020 research and innovation program/ERC grant agreement n° 818607, and the Catalisti cluster SBO project WATCH (“Plastic waste to chemicals”), with the financial support of VLAIO (Flemish Agency for Innovation and Entrepreneurship).

Acknowledgments

The authors acknowledge funding from the European Research Council under the European Union’s Horizon 2020 research and innovation program/ERC grant agreement n° 818607, and the Catalisti cluster SBO project WATCH (“Plastic waste to chemicals”), with the financial support of VLAIO (Flemish Agency for Innovation and Entrepreneurship).

Conflicts of Interest

There are no conflicts to declare.

Nomenclature

GC × GC:comprehensive two-Dimensional gas chromatography
HPLC:High-Performance Liquid Chromatography
FID:flame ionization detector
MS:mass spectrometer
TCD:Thermal Conductivity Detector
ESI:electrospray ionization
FPD:flame photometric detection
NP:non-polar × polar column combination
PN:polar × non-polar column combination
PM:polar × mid-polar column combination
SCD:sulfur chemiluminescence detector
NCD:nitrogen chemiluminescence detector
EA:elemental analyzer
CHNSO:carbon, hydrogen, nitrogen, sulfur, and oxygen
PTV:programmable temperature vaporization
SSL:split/splitless

References

  1. Ganesh, A.K.; Anjana, K.; Hinduja, M.; Sujitha, K.; Dharani, G. Review on plastic wastes in marine environment—Biodegradation and biotechnological solutions. Mar. Pollut. Bull. 2020, 150, 110733. [Google Scholar]
  2. Ilyas, M.; Ahmad, W.; Khan, H.; Yousaf, S.; Khan, K.; Nazir, S. Plastic waste as a significant threat to environment—A systematic literature review. Rev. Environ. Health 2018, 33, 383. [Google Scholar] [CrossRef]
  3. Kalargaris, I.; Tian, G.; Gu, S. Investigation on the long-term effects of plastic pyrolysis oil usage in a diesel engine. Energy Procedia 2017, 142, 49–54. [Google Scholar] [CrossRef]
  4. Tulashie, S.K.; Boadu, E.K.; Dapaah, S. Plastic waste to fuel via pyrolysis: A key way to solving the severe plastic waste problem in Ghana. Therm. Sci. Eng. Prog. 2019, 11, 417–424. [Google Scholar] [CrossRef]
  5. Quesada, L.; Calero, M.; Martín-Lara, M.Á.; Pérez, A.; Blázquez, G. Production of an Alternative Fuel by Pyrolysis of Plastic Wastes Mixtures. Energy Fuels 2020, 34, 1781–1790. [Google Scholar] [CrossRef]
  6. De Smet, M.; Linder, M.; Koopmans, R.; Doorsselaer, K.V.; Velis, C.; De Wilde, B.; Ritschkoff, A.-C.; Crippa, M.; Leyssens, J.; Wagner, M.; et al. A Circular Economy for Plastic—Insights from Research and Innovation to Inform Policy and Funding Decisions; European Commission: Brussels, Belgium, 2019. [Google Scholar]
  7. Lahtela, V.; Hyvärinen, M.; Kärki, T. Composition of Plastic Fractions in Waste Streams: Toward More Efficient Recycling and Utilization. Polymers 2019, 11, 69. [Google Scholar] [CrossRef] [PubMed] [Green Version]
  8. Bagheri, M.; Esfilar, R.; Sina Golchi, M.; Kennedy, C.A. Towards a circular economy: A comprehensive study of higher heat values and emission potential of various municipal solid wastes. Waste Manag. 2020, 101, 210–221. [Google Scholar] [CrossRef]
  9. Miandad, R.; Rehan, M.; Barakat, M.A.; Aburiazaiza, A.S.; Khan, H.; Ismail, I.M.I.; Dhavamani, J.; Gardy, J.; Hassanpour, A.; Nizami, A.-S. Catalytic Pyrolysis of Plastic Waste: Moving Toward Pyrolysis Based Biorefineries. Front. Energy Res. 2019, 7. [Google Scholar] [CrossRef] [Green Version]
  10. Pradeep, P.A.; Gowthaman, S. Combustion and emission characteristics of diesel engine fuelled with waste plastic oil—A review. Int. J. Ambient. Energy 2019, 1–19. [Google Scholar] [CrossRef]
  11. Thahir, R.; Altway, A.; Juliastuti, S.R.; Susianto. Production of liquid fuel from plastic waste using integrated pyrolysis method with refinery distillation bubble cap plate column. Energy Rep. 2019, 5, 70–77. [Google Scholar] [CrossRef]
  12. Gracida-Alvarez, U.R.; Mitchell, M.K.; Sacramento-Rivero, J.C.; Shonnard, D.R. Effect of Temperature and Vapor Residence Time on the Micropyrolysis Products of Waste High Density Polyethylene. Ind. Eng. Chem. Res. 2018, 57, 1912–1923. [Google Scholar] [CrossRef]
  13. Sharma, B.K.; Moser, B.R.; Vermillion, K.E.; Doll, K.M.; Rajagopalan, N. Production, characterization and fuel properties of alternative diesel fuel from pyrolysis of waste plastic grocery bags. Fuel Process. Technol. 2014, 122, 79–90. [Google Scholar] [CrossRef]
  14. Singh, M.V.; Kumar, S.; Sarker, M. Waste HD-PE plastic, deformation into liquid hydrocarbon fuel using pyrolysis-catalytic cracking with a CuCO3 catalyst. Sustain. Energy Fuels 2018, 2, 1057–1068. [Google Scholar] [CrossRef]
  15. Mangesh, V.L.; Padmanabhan, S.; Ganesan, S.; PrabhudevRahul, D.; Kumar Reddy, T.D. Prospects of pyrolysis oil from plastic waste as fuel for diesel engines: A review. IOP Conf. Ser. Mater. Sci. Eng. 2017, 197, 012027. [Google Scholar] [CrossRef] [Green Version]
  16. Toraman, H.E.; Dijkmans, T.; Djokic, M.R.; Van Geem, K.M.; Marin, G.B. Detailed compositional characterization of plastic waste pyrolysis oil by comprehensive two-dimensional gas-chromatography coupled to multiple detectors. J. Chromatogr. A 2014, 1359, 237–246. [Google Scholar] [CrossRef] [PubMed]
  17. Mastral, J.F.; Berrueco, C.; Ceamanos, J. Theoretical prediction of product distribution of the pyrolysis of high density polyethylene. J. Anal. Appl. Pyrolysis 2007, 80, 427–438. [Google Scholar] [CrossRef]
  18. Kusch, P. Application of Pyrolysis-Gas Chromatography/Mass Spectrometry (Py-GC/MS). In Comprehensive Analytical Chemistry; Rocha-Santos, T.A.P., Duarte, A.C., Eds.; Elsevier: Amsterdam, The Netherlands, 2017; Chapter 7; pp. 169–207. [Google Scholar]
  19. Punkkinen, H.; Oasmaa, A.; Luntama, J.L.; Nieminen, M.; Laine-Ylijoki, J. Thermal conversion of plasticcontaining waste: A review. Res. Rep. 2017, D4, 1–22. [Google Scholar]
  20. Damodharan, D.; Kumar, B.R.; Gopal, K.; De Poures, M.V.; Sethuramasamyraja, B. Utilization of waste plastic oil in diesel engines: A review. Rev. Environ. Sci. Bio Technol. 2019, 18, 681–697. [Google Scholar] [CrossRef]
  21. Singh, R.K.; Ruj, B.; Sadhukhan, A.K.; Gupta, P. Impact of fast and slow pyrolysis on the degradation of mixed plastic waste: Product yield analysis and their characterization. J. Energy Inst. 2019, 92, 1647–1657. [Google Scholar] [CrossRef]
  22. Baumgartner, A.J.; Blaschke, M.W.; Coleman, S.T.; Kohler, R.; Paxson, T.E. Feedstock Contaminants in Ethylene Plants—An Update. In Proceedings of the 2004 Spring AIChE National Meeting, New Orleans, LA, USA, 25–29 April 2004. [Google Scholar]
  23. Dijkmans, T.; Djokic, M.R.; Van Geem, K.M.; Marin, G.B. Comprehensive compositional analysis of sulfur and nitrogen containing compounds in shale oil using GC × GC-FID/SCD/NCD/TOF-MS. Fuel 2015, 140, 398–406. [Google Scholar] [CrossRef]
  24. Al-Hajji, A.A.; Muller, H.; Koseoglu, O.R. Characterization of Nitrogen and Sulfur Compounds in Hydrocracking Feedstocks by Fourier Transform Ion Cyclotron Mass Spectrometry. Oil Gas Sci. Technol. 2008, 63, 115–128. [Google Scholar] [CrossRef]
  25. Cullis, C.F.; Hirschler, M.M.; Wall, S.W. The combined effect of sulphur and nitrogen compounds on alkane combustion. Symp. Combust. Proc. 1988, 21, 1223–1230. [Google Scholar] [CrossRef]
  26. Lebedeva, O.; Root, N.; Kultin, D.; Moiseeva, A.; Kustov, L. Focus on Fuel Quality: Removal of Sulfur-, Nitrogen-, and Oxygen-Containing Aromatic Compounds by Extraction from Hydrocarbons into the Regenerable Ionic Liquid. Energy Fuels 2015, 29, 5253–5258. [Google Scholar] [CrossRef]
  27. Ristic, N.D.; Djokic, M.R.; Konist, A.; Van Geem, K.M.; Marin, G.B. Quantitative compositional analysis of Estonian shale oil using comprehensive two dimensional gas chromatography. Fuel Process. Technol. 2017, 167, 241–249. [Google Scholar] [CrossRef]
  28. Song, H.; Quinton, K.S.; Peng, Z.; Zhao, H.; Ladommatos, N. Effects of Oxygen Content of Fuels on Combustion and Emissions of Diesel Engines. Energies 2016, 9, 28. [Google Scholar] [CrossRef] [Green Version]
  29. Bezergianni, S.; Dimitriadis, A.; Faussone, G.-C.; Karonis, D. Alternative Diesel from Waste Plastics. Energies 2017, 10, 1750. [Google Scholar] [CrossRef] [Green Version]
  30. Käfer, U.; Gröger, T.; Rohbogner, C.J.; Struckmeier, D.; Saraji-Bozorgzad, M.R.; Wilharm, T.; Zimmermann, R. Detailed Chemical Characterization of Bunker Fuels by High-Resolution Time-of-Flight Mass Spectrometry Hyphenated to GC × GC and Thermal Analysis. Energy Fuels 2019, 33, 10745–10755. [Google Scholar] [CrossRef]
  31. Van der Westhuizen, R.; Crouch, A.; Sandra, P. The use of GC × GC with time-of-flight mass spectrometry to investigate dienes and Diels–Alder polymerisation products in high-temperature Fischer-Tropsch-based fuels. J. Sep. Sci. 2008, 31, 3423–3428. [Google Scholar] [CrossRef]
  32. Heshka, N.E.; Baltazar, M.; Chen, J. Separation and quantification of olefins and diolefins in cracked petroleum fractions using silver-ion high performance liquid chromatography. Pet. Sci. Technol. 2019, 37, 1808–1816. [Google Scholar] [CrossRef]
  33. Pereira, R.C.C.; Pasa, V.M.D. Effect of mono-olefins and diolefins on the stability of automotive gasoline. Fuel 2006, 85, 1860–1865. [Google Scholar] [CrossRef]
  34. Asomaning, S. The Role of Olefins in Fouling of Heat Exchangers. Master’s Thesis, The University of British Columbia, Vancouver, BC, Canada, May 1990. [Google Scholar]
  35. Kulkarni, S.R.; Verhees, P.; Akhras, A.R.; Van Geem, K.M.; Heynderickx, G.J. Fouling in a Steam Cracker Convection Section Part 2: Coupled Tube Bank Simulation using an Improved Hybrid CFD-1D Model. Heat Transf. Eng. 2019, 41, 1–21. [Google Scholar] [CrossRef]
  36. Sharuddin, S.D.A.; Abnisa, F.; Wan Daud, W.M.A.; Aroua, M.K. Energy recovery from pyrolysis of plastic waste: Study on non-recycled plastics (NRP) data as the real measure of plastic waste. Energy Convers. Manag. 2017, 148, 925–934. [Google Scholar] [CrossRef]
  37. Lee, K.-H. Pyrolysis of municipal plastic wastes separated by difference of specific gravity. J. Anal. Appl. Pyrolysis 2007, 79, 362–367. [Google Scholar] [CrossRef]
  38. Seo, Y.-H.; Lee, K.-H.; Shin, D.-H. Investigation of catalytic degradation of high-density polyethylene by hydrocarbon group type analysis. J. Anal. Appl. Pyrolysis 2003, 70, 383–398. [Google Scholar] [CrossRef]
  39. Lee, K.-H.; Jeon, S.-G.; Kim, K.-H.; Noh, N.-S.; Shin, D.-H.; Park, J.; Seo, Y.; Yee, J.-J.; Kim, G.-T. Thermal and catalytic degradation of waste high-density polyethylene (HDPE) using spent FCC catalyst. Korean J. Chem. Eng. 2003, 20, 693–697. [Google Scholar] [CrossRef]
  40. Miranda, R.; Pakdel, H.; Roy, C.; Vasile, C. Vacuum pyrolysis of commingled plastics containing PVC II. Product analysis. Polym. Degrad. Stab. 2001, 73, 47–67. [Google Scholar] [CrossRef]
  41. Miskolczi, N.; Ateş, F. Thermo-catalytic co-pyrolysis of recovered heavy oil and municipal plastic wastes. J. Anal. Appl. Pyrolysis 2016, 117, 273–281. [Google Scholar] [CrossRef]
  42. Park, J.J.; Park, K.; Kim, J.-S.; Maken, S.; Song, H.; Shin, H.; Park, J.-W.; Choi, M.-J. Characterization of Styrene Recovery from the Pyrolysis of Waste Expandable Polystyrene. Energy Fuels 2003, 17, 1576–1582. [Google Scholar] [CrossRef]
  43. Kim, Y.S.; Hwang, G.C.; Bae, S.Y.; Yi, S.C.; Moon, S.K.; Kumazawa, H. Pyrolysis of polystyrene in a batch-type stirred vessel. Korean J. Chem. Eng. 1999, 16, 161–165. [Google Scholar] [CrossRef]
  44. Williams, P.T.; Williams, E.A. Product Composition from the Fast Pyrolysis of Polystyrene. Environ. Technol. 1999, 20, 1109–1118. [Google Scholar] [CrossRef]
  45. Ogino, H.; Nagy, B. Pyrolysis of Transvaal kerogens. II. An evaluation of vacuum pyrolysis with polyethylene, polystyrene and their mixtures with minerals. Precambrian Res. 1981, 15, 113–130. [Google Scholar] [CrossRef]
  46. Park, K.-B.; Jeong, Y.-S.; Guzelciftci, B.; Kim, J.-S. Two-stage pyrolysis of polystyrene: Pyrolysis oil as a source of fuels or benzene, toluene, ethylbenzene, and xylenes. Appl. Energy 2020, 259, 114240. [Google Scholar] [CrossRef]
  47. Kaminsky, W.; Franck, J. Monomer recovery by pyrolysis of poly(methyl methacrylate) (PMMA). J. Anal. Appl. Pyrolysis 1991, 19, 311–318. [Google Scholar] [CrossRef]
  48. Shin, T.; Hajime, O.; Chuichi, W. Pyrolysis-Gc/Ms Data Book of Synthetic Polymers Pyrograms, Thermograms and Ms of Pyrolyzates; Elsevier: Amsterdam, The Netherlands, 2011. [Google Scholar]
  49. Uzumkesici, E.S.; Casal-Banciella, M.D.; McRae, C.; Snape, C.E.; Taylor, D. Co-processing of single plastic waste streams in low temperature carbonisation. Fuel 1999, 78, 1697–1702. [Google Scholar] [CrossRef]
  50. Ladislav, S.; Kubinec, R.; Jurdáková, H.; Hájeková, E.; Martin, B. GC-MS of polyethylene and polypropylene thermal cracking products. Pet. Coal 2006, 48, 1–14. [Google Scholar]
  51. Kiran, N.; Ekinci, E.; Snape, C.E. Recyling of plastic wastes via pyrolysis. Resour. Conserv. Recycl. 2000, 29, 273–283. [Google Scholar] [CrossRef]
  52. Demirbas, A. Pyrolysis of municipal plastic wastes for recovery of gasoline-range hydrocarbons. J. Anal. Appl. Pyrolysis 2004, 72, 97–102. [Google Scholar] [CrossRef]
  53. Almeida, D.; Marques, M.D.F. Thermal and catalytic pyrolysis of plastic waste. Polímeros 2016, 26, 44–51. [Google Scholar] [CrossRef]
  54. Toraman, H.E.; Franz, K.; Ronsse, F.; Van Geem, K.M.; Marin, G.B. Quantitative analysis of nitrogen containing compounds in microalgae based bio-oils using comprehensive two-dimensional gas-chromatography coupled to nitrogen chemiluminescence detector and time of flight mass spectrometer. J. Chromatogr. A 2016, 1460, 135–146. [Google Scholar] [CrossRef] [PubMed]
  55. Luong, J.; Hua, Y.; Gras, R.; Shellie, R.A. Uniformity and Sensitivity Improvements in Comprehensive Two-Dimensional Gas Chromatography Using Flame Ionization Detection with Post-Column Reaction. Anal. Chem. 2019, 91, 11223–11230. [Google Scholar] [CrossRef]
  56. Djokic, M.R.; Dijkmans, T.; Yildiz, G.; Prins, W.; Van Geem, K.M. Quantitative analysis of crude and stabilized bio-oils by comprehensive two-dimensional gas-chromatography. J. Chromatogr. A 2012, 1257, 131–140. [Google Scholar] [CrossRef]
  57. Dijkmans, T.; Van Geem, K.M.; Djokic, M.R.; Marin, G.B. Combined Comprehensive Two-Dimensional Gas Chromatography Analysis of Polyaromatic Hydrocarbons/Polyaromatic Sulfur-Containing Hydrocarbons (PAH/PASH) in Complex Matrices. Ind. Eng. Chem. Res. 2014, 53, 15436–15446. [Google Scholar] [CrossRef]
  58. Schofield, K. The enigmatic mechanism of the flame ionization detector: Its overlooked implications for fossil fuel combustion modeling. Prog. Energy Combust. Sci. 2008, 34, 330–350. [Google Scholar] [CrossRef]
  59. Giddings, J.C. Concepts and comparisons in multidimensional separation. J. High Resolut. Chromatogr. 1987, 10, 319–323. [Google Scholar] [CrossRef]
  60. Dutriez, T.; Borras, J.; Courtiade, M.; Thiébaut, D.; Dulot, H.; Bertoncini, F.; Hennion, M.-C. Challenge in the speciation of nitrogen-containing compounds in heavy petroleum fractions by high temperature comprehensive two-dimensional gas chromatography. J. Chromatogr. A 2011, 1218, 3190–3199. [Google Scholar] [CrossRef] [PubMed]
  61. Van Geem, K.M.; Pyl, S.P.; Reyniers, M.-F.; Vercammen, J.; Beens, J.; Marin, G.B. On-line analysis of complex hydrocarbon mixtures using comprehensive two-dimensional gas chromatography. J. Chromatogr. A 2010, 1217, 6623–6633. [Google Scholar] [CrossRef] [PubMed]
  62. Beens, J.; Janssen, H.-G.; Adahchour, M.; Brinkman, U.A.T. Flow regime at ambient outlet pressure and its influence in comprehensive two-dimensional gas chromatography. J. Chromatogr. A 2005, 1086, 141–150. [Google Scholar] [CrossRef]
  63. Gray, M.R.; McCaffrey, W.C. Role of Chain Reactions and Olefin Formation in Cracking, Hydroconversion, and Coking of Petroleum and Bitumen Fractions. Energy Fuels 2002, 16, 756–766. [Google Scholar] [CrossRef]
  64. Karisathan Sundararajan, N.; Ramachandran Bhagavathi, A. Experimental Investigation on Thermocatalytic Pyrolysis of HDPE Plastic Waste and the Effects of Its Liquid Yield over the Performance, Emission, and Combustion Characteristics of CI Engine. Energy Fuels 2016, 30, 5379–5390. [Google Scholar] [CrossRef]
  65. Hu, S.Z.; Li, S.F.; Cao, J.; Zhang, D.M.; Ma, J.; He, S.; Wang, X.L.; Wu, M. A Comparison of Normal and Reversed Phase Columns in Oil Analysis by Comprehensive Two-dimensional Gas Chromatography With Time-of-flight Mass Spectrometry. Pet. Sci. Technol. 2014, 32, 565–574. [Google Scholar] [CrossRef]
  66. Burnes, D.; Camou, A. Impact of Fuel Composition on Gas Turbine Engine Performance. J. Eng. Gas. Turb. Power 2019, 141, 101006. [Google Scholar] [CrossRef] [Green Version]
  67. Fang, X.; Huang, X.; Chen, W.; Qiao, X.; Ju, D. Development of a skeletal surrogate mechanism for emulating combustion characteristics of diesel from direct coal liquefaction. Combust. Flame 2020, 218, 84–97. [Google Scholar] [CrossRef]
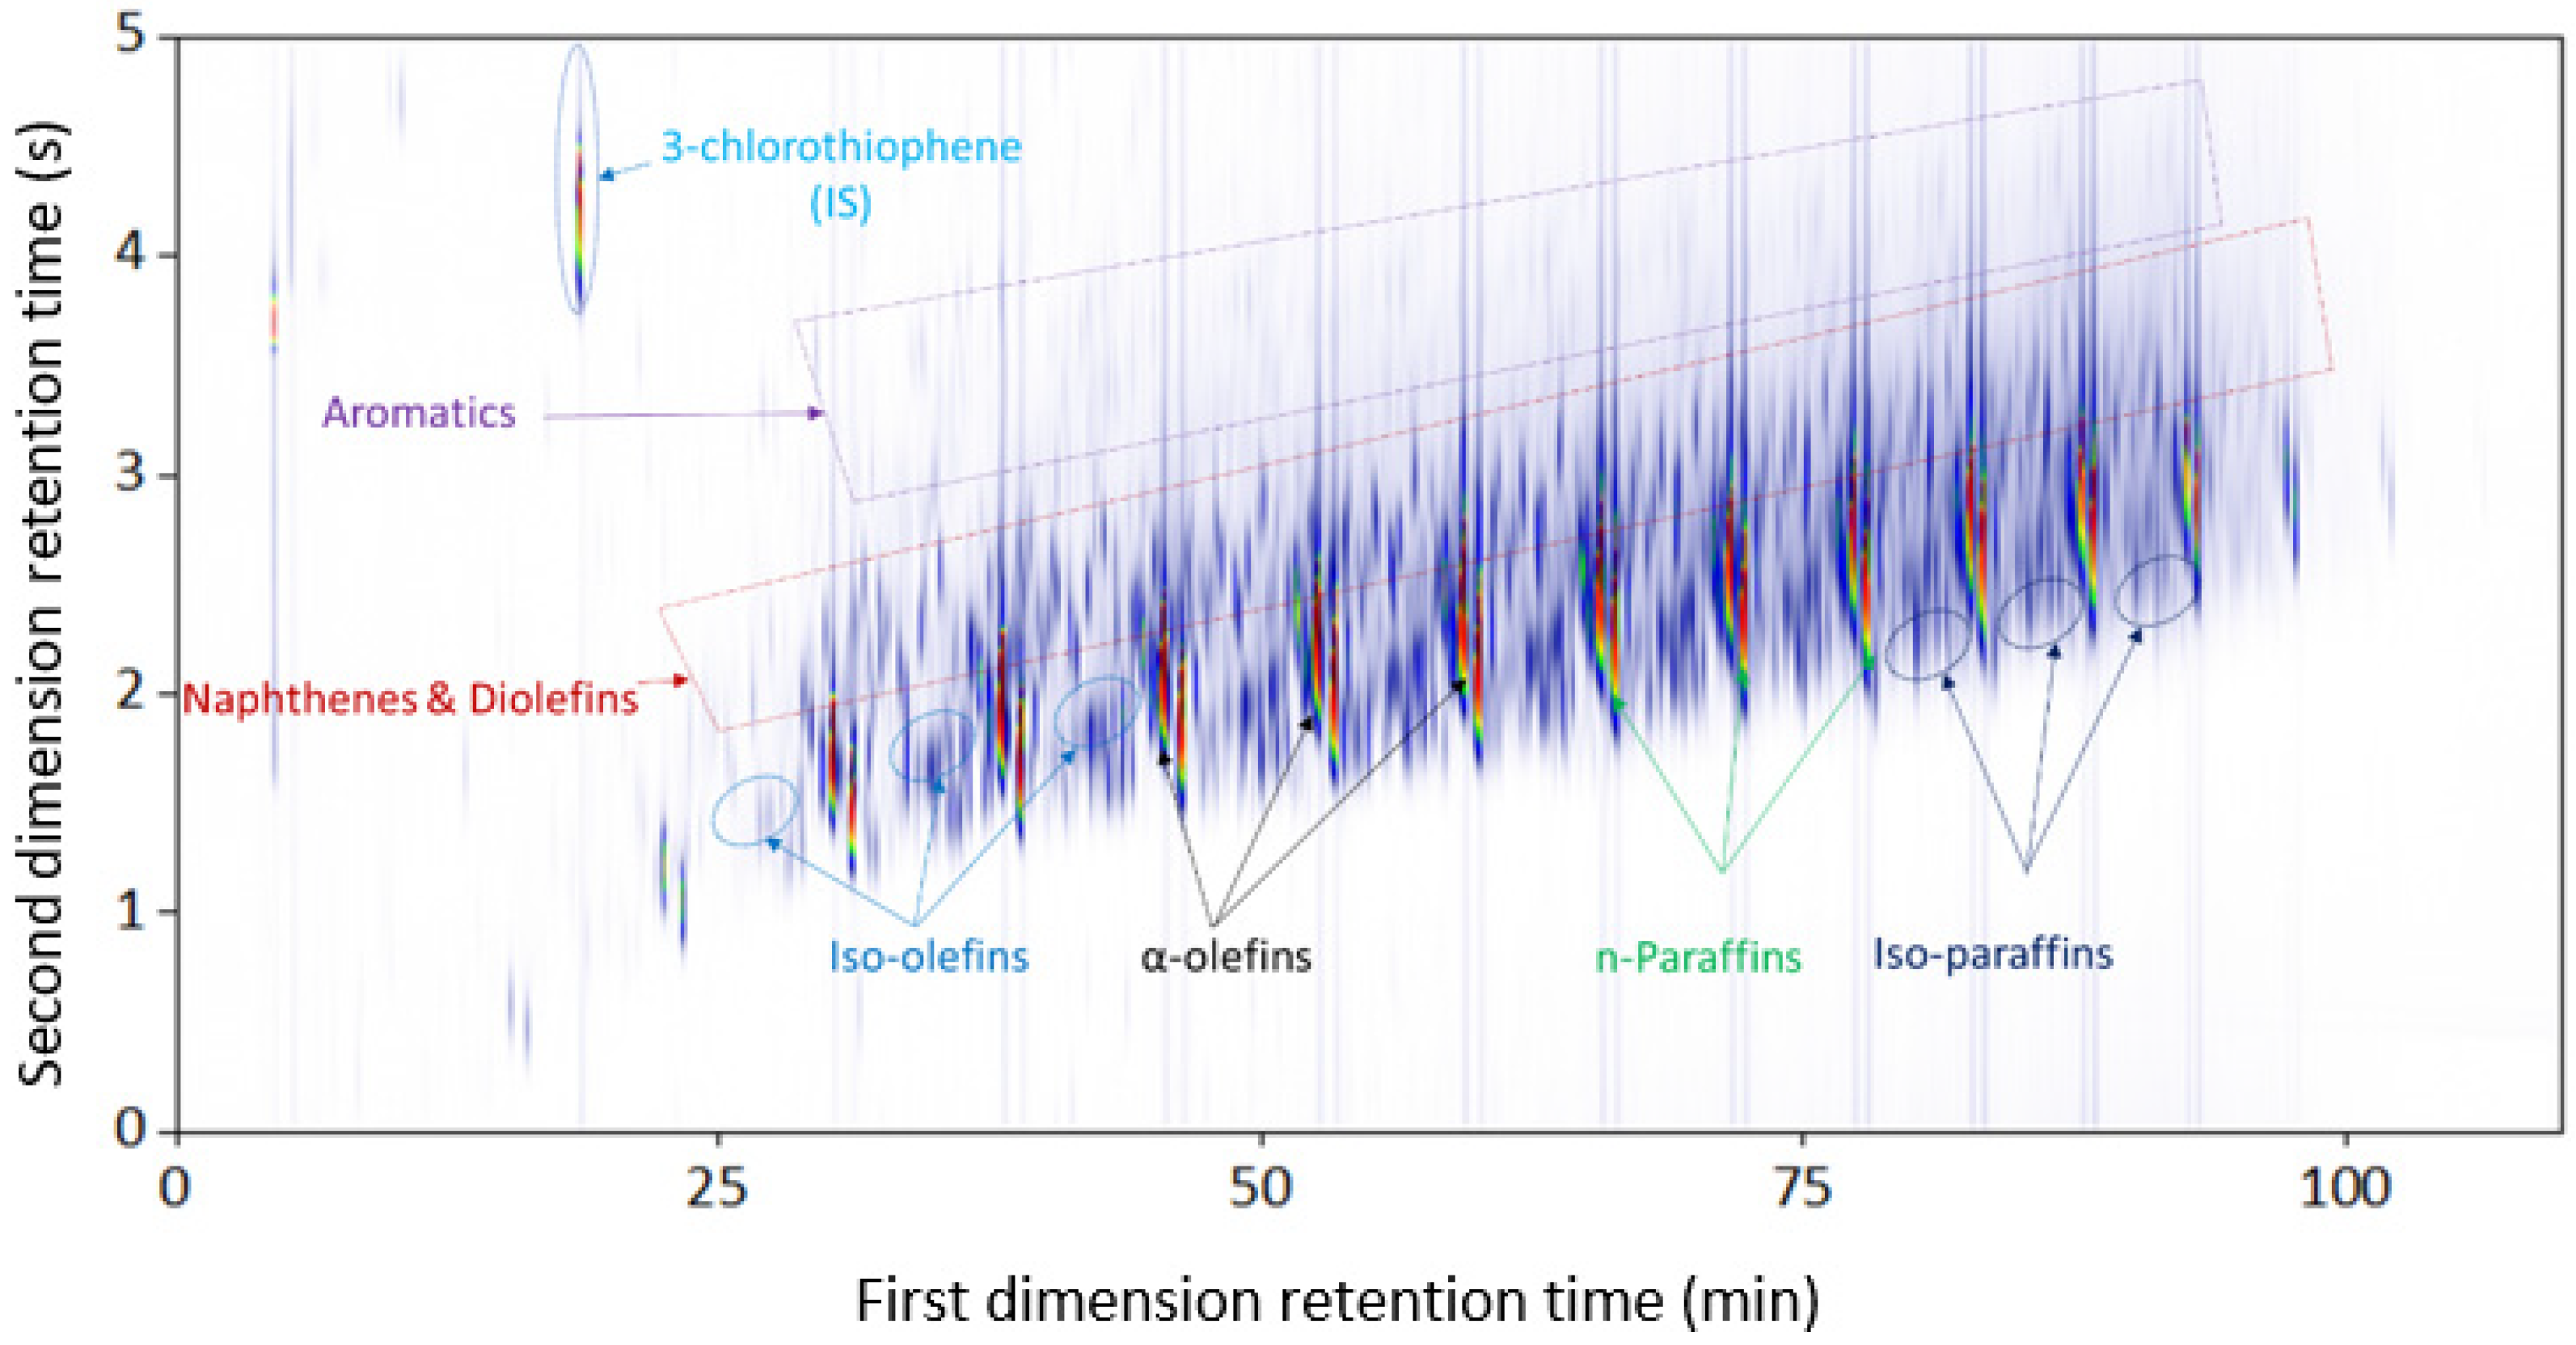
Figure 1. Separation of the diesel fraction using a normal-phase GC × GC column combination (RTX-1 PONA × BPX-50).
Separations 08 00103 g001
Figure 2. Separation of the diesel fraction using a reversed-phase GC × GC column combination (Stabilwax × Rxi-5 ms).
Separations 08 00103 g002
Figure 3. Detailed PIONA composition of diesel fraction.
Separations 08 00103 g003
Figure 4. Separation of the naphtha fraction using a reversed-phase GC × GC column combination (Stabilwax × Rxi-5 ms).
Separations 08 00103 g004
Figure 5. Separation of the naphtha fraction using a normal-phase GC × GC column combination (RTX-1 PONA × BPX-50).
Separations 08 00103 g005
Figure 6. Detailed PIONA composition of naphtha fraction.
Separations 08 00103 g006
Figure 7. GC × GC-SCD color plot of the diesel fraction (a) and the naphtha fraction (b).
Separations 08 00103 g007
Figure 8. The detailed information of nitrogen compositions in the naphtha fraction.
Separations 08 00103 g008
Table 1. Overview of the evaluated column combinations for plastic-waste pyrolysis oils.
CombinationConfigurationFirst Dimension ColumnSecond Dimension Column
1NPRTX-1 PONA a
(50 m × 0.25 mm × 0.25 μm)
BPX-50 b
(2 m × 0.18 mm × 0.18 μm)
2PNStabilwax c
(60 m × 0.25 mm × 0.25 μm)
Rxi-5ms d
(2 m × 0.1 mm × 0.1 μm)
3MDPIL-59 e
(30 m × 0.25 mm × 0.25 μm)
Rxi-5ms d
(2 m × 0.1 mm × 0.1 μm)
4MDPBPX-50 b
(60 m × 0.25 mm × 0.25 μm)
Rxi-5ms d
(2 m × 0.1 mm × 0.1 μm)
a Dimethyl polysiloxane (Restek), b 50% phenyl polysilphenylene-siloxane (SGE), c polyethylene glycol (Restek), d 5% diphenyl 95% dimethyl polysiloxane (Restek), and e 1,12-Di(tripropylphosphonium)dodecane bis(trifluoromethylsulfonyl)imide (Supelco).
Table 2. Overview of GC × GC settings for FID\SCD\NCD\MS analysis (column combination 1 = RTX-1 PONA × BPX-50, column combination 2 = Stabilwax × Rxi-5ms).
Sample Plastic Waste Diesel Plastic Waste Naphtha
Detector FID NCD SCD MS FID NCD SCD MS
Column combination 1 2 1 1 1 2 1 2 1 1 1 2
Injector
Temperature (°C)
Split flow (ml.min−1)
PTV *
370
60
SSL
300
10
PTV
370
10
SSL
300
60
PTV
300
101
SSL
300
10
PTV
300
10
SSL
300
101
Carrier gas (ml.min−1) 2.1 1.4 2.1 2.1 2.3 2.1 2.1 1.4 2.1 2.1 2.3 2.1
Oven start (°C)
Oven end (°C)
Ramp (°C)
40 33
260
2
40
200
3
40
200
3
40 33
260
2
30 30
200
2
40
200
3
40
150
3
30 30
200
2
Modulation time (s) 5 18 5 5 5 18 5 20 5 5 5 20
Detector temperature (°C)
Detector range (-)
Detector acquisition rate (Hz)
300
10
100
920
1
100
800
1
100
300
-
30
300
10
100
920
1
100
800
1
100
300
-
30
* Temperature corresponds to the final temperature of the temperature program.
Table 3. Comparison of parameters of two chosen column configurations—normal phase (RTX-1 PONA × BPX-50) and reversed phase (Stabilwax × Rxi-5-ms).
Chemical ClassRTX-1 PONA × BPX-50 (NP)Stabilwax × Rxi-5-ms (RP)
Average R2DAverage Intraclass R2DAverage R2DAverage Intraclass R2D
n-Paraffins1.25 ± 0.108.24 ± 0.245.54 ± 0.1012.77 ± 0.13
α-Olefins1.34 ± 0.128.22 ± 0.012.09 ± 0.278.20 ± 0.61
Iso-olefins0.64 ± 0.013.04 ± 0.461.24 ± 0.044.66 ± 0.16
Iso-paraffins0.79 ± 0.042.81 ± 0.251.22 ± 0.264.36 ± 0.29
Naphthenes0.72 ± 0.056.73 ± 0.250.70 ± 0.033.17 ± 0.16
Diolefins1.20 ± 0.057.13 ± 0.151.61 ± 0.255.54 ± 0.12
Monoaromatics0.57 ± 0.055.06 ± 0.131.54 ± 0.266.56 ± 0.99
Table 4. Comparison of parameters of two chosen column configurations—normal phase (RTX-1 PONA × BPX-50) and reversed phase (Stabilwax × Rxi-5-ms).
Chemical ClassRTX-1 PONA × BPX-50Stabilwax × Rxi-5-ms
Average R2DAverage Intraclass R2DAverage R2DAverage Intraclass R2D
n-Paraffins2.74 ± 0.258.16 ± 0.761.87 ± 0.175.92 ± 0.15
α-Olefins2.51 ± 0.077.04 ± 0.471.35 ± 0.183.76 ± 0.01
Iso-olefins1.12 ± 0.073.57 ± 0.301.36 ± 0.086.52 ± 0.45
Iso-paraffins5.41 ± 0.3112.70 ± 0.471.92 ± 0.1111.77 ± 0.25
Naphthenes0.97 ± 0.115.40 ± 0.491.14 ± 0.172.52 ± 0.49
Dioleffins1.62 ± 0.038.21 ± 0.571.87 ± 0.174.78 ± 0.05
Monoaromatics3.00 ± 0.1311.03 ± 0.331.62 ± 0.066.82 ± 0.50
Table 5. The detailed information of sulfur compositions in the diesel and naphtha fractions.
Diesel Fraction Naphtha Fraction
Compound Namewt% SulfurCompound Namewt% Sulfur
Carbon disulfide1.15 ± 0.003Carbon disulfide142.45 ± 1.337
C3H8S sulfides4.66 ± 0.014C3H8S sulfides1.06 ± 0.010
C1 thiophenes1.02 ± 0.003Thiophene4.96 ± 0.047
Total6.83 ± 0.021C1 thiophenes11.49 ± 0.108
C2 thiophenes25.48 ± 0.239
C3 thiophenes22.65 ± 0.213
C4 thiophenes2.65 ± 0.025
Total210.74 ± 1.978
Table 6. The detailed information of nitrogen compositions in the naphtha fraction.
Naphtha FractionNitrogen Content
Compound Namewt% Nitrogen
Pyridine8.10 ± 0.001
Methylpyridine11.53 ± 0.001
Ethylpyridine9.28 ± 0.001
C3 pyridine1.56 ± 0.0001
Total30.46 ± 0.002
Table 7. The elemental composition of the naphtha and diesel fractions determined by elemental analysis (EA) and the GC analysis, and elemental composition of a plastic-waste pyrolysis oil sample.
Elemental CompositionDiesel FractionNaphtha FractionPlastic-Waste Pyrolysis Oil [16]
EAGC × GCEAGC × GCEAGC × GC
C (wt%)85.19 ± 0.3985.5185.52 ± 0.1485.9388.488
H (wt%)14.26 ± 0.3914.4913.84 ± 0.1713.939.610.9
S (wt%)<MDL0.001<MDL0.0210.170.17
N (wt%)<MDL<MDL<MDL0.0031.081.06
O (wt%)0.55 ± 0.040.01 a0.64 ± 0.010.14 b0.990.35
MDL: Minimum Detection Limit (MDL = 1000 ppmw). a Of which 0.03 wt% identified. b Of which 0.84 wt% identified.
Publisher’s Note: MDPI stays neutral with regard to jurisdictional claims in published maps and institutional affiliations.