Abstract
The former St. Antony’s Lead Works site, now the central part of an urban recreational park (Walker Riverside Park) in the east end of Newcastle upon Tyne (England, UK), has been assessed based on the Pb concentration in topsoil according to recently derived Category 4 Screening Level (C4SL) for public open space–park (POSpark, 1300 mg/kg). The site was divided into eight sampling areas following its physical layout. In total 79 soil samples were collected, characterised for acidity and organic matter content, and analysed by energy dispersive X-ray fluorescence (ED-XRF). The Pb levels in most of the samples, particularly those from the fringes of the site, are below the generic guideline value (down to 70 mg/kg). More than 16% of the samples from nearly all sampling areas, especially those sampling points around the former horizontal condenser flue and main chimney, contain levels of Pb significantly exceeding the limit (up to 206,000 mg/kg). No correlation is found between the Pb concentration in soil samples and their acidity (mostly neutral, pH 7.0 ± 0.5) or organic matter content (15.5 ± 4.1%). Using the Contaminated Land Exposure Assessment (CLEA) model (version 1.071), the site-specific risk assessment criteria (SSAC) for Lead (C4SL child), 2862 mg/kg, is obtained based on adjusted exposure frequency and occupancy period. Nearly 9% of the individual sample Pb concentrations (n = 79) across sample locations B, C, D and H are still above the specific value. Further statistical evaluation based on 95% upper confidence limit confirms that the site still represents a potential human health risk. This is because Pb concentrations, from two areas in the centre of the site (sample locations B and C), are greatly over the SSAC specific threshold (sample mean at location B is 12,350 mg/kg and at location C is 11,745 mg/kg).
1. Introduction
Many former industrial lands are re-developed or re-designated for commercial and domestic uses. Assessment of potential health risk to people working or living on or around the land sites is regulated by national governments. For instance, in the United States, the current metal Risk Assessment Guidelines were issued in 2007 [1] and Regional Screening Levels (RSLs) are repeatedly updated [2] by the Environmental Protection Agency (US EPA). In China, a framework for screening soil contamination has been implemented since 2016 by the Ministry of Environmental Protection [3,4]. In the United Kingdom, the Department for Environment, Food and Rural Affairs (DEFRA) via the Environment Agency (EA) provides the statutory guidance criteria for soil assessment. The Soil Guideline Values (SGVs) introduced in 2002 for residential, allotments and commercial land uses [5] have been recently replaced by the Category 4 Screening Levels (C4SLs) for soil assessment [6]. In the case of Pb, while the threshold values for residential uses and allotments are significantly lowered, it is set much higher for commercial use. Two new specified types of land use have been added for public open space–residential (POSresi) and park (POSpark). The Contaminated Land Exposure Assessment (CLEA) model was subsequently updated in 2015 (version 1.071). The new guidelines have been very recently applied to assess the exposure of As in residential soil and household dust in Cornwall (South West England) [7] and Pb in garden soils in Newcastle upon Tyne (North East England) [8].
As metal smelting is one of the major sources of land contamination, there have been various studies on its impact on the smelter sites and their surrounding areas during their operation and after their closure. A review of studies published between 2000–2015 on soil Pb contamination in the vicinity of 58 lead/zinc smelting sites in China showed that Pb levels in the surface soils (n = 1011) ranged from 7 to 312,452 mg/kg with an arithmetic average, geometric average, and median of 1982, 404, and 428 mg/kg, respectively. The surface soil Pb concentrations decreased with increasing distance from the smelters, from an average of 2466 mg/kg (within 1 km) to 659 mg/kg (between 1–2 km), then to 463 mg/kg (more than 2 km). The average soil Pb levels also decreased with the sampling depth, from 986 mg/kg (0–20 cm) to 144 mg/kg (80–100 cm). Approximately 78% of the soil samples were classified as having high Pb pollution levels, while 34.2 and 7.7% of the soil samples might pose adverse health effects and high chronic risks to children, respectively [9]. Another more recent review of data from peer-reviewed papers published between 2000 and 2019 covered key non-ferrous smelters in 19 major provinces in China. The arithmetic average and median of Pb concentration in the soil samples (n = 1384, mostly top layer 0–20 cm) around 43 sites were 1536 and 257 mg/kg respectively, while the Pb levels varied from 33.1 to 20,185 mg/kg. The Pb concentrations decreased with the increase of sampling radius from 0.2, 2 to >2 km [10]. The legacy Pb contamination in surface soils from the urban area surrounding Pasminco Cockle Creek Smelter in Boolaroo (New South Wales, Australia) was examined. Although the lead smelting operations were closed in 2003, elevated soil Pb concentrations were found across public lands (n = 32) including sports fields (mean, 5130 mg/kg; median, 1275 mg/kg), playgrounds and schools (mean, 812 mg/kg; median, 920 mg/kg) and open space (mean, 778 mg/kg; median, 620 mg/kg). After the soil Pb abatement programme by capping and covering contaminated soils for more than 2000 homes in the township of Boolaroo, soil Pb concentrations above the Australian residential soil health investigation level value for residential soils (300 mg/kg) were found at all but one of the studied residential properties (n = 19). Comparison between post-abatement with pre-abatement soil Pb levels available at a small number of properties (n = 8) showed no statistical difference, suggesting the dominantly “cap and cover” approach was ineffective. Additional vacuum dust samples (n = 17) from the same homes had a mean Pb concentration of 495 mg/kg (median, 380 mg/kg) while Pb in household vacuum dust was found highly bio-accessible (mean, 92%; median, 90%), indicating that the risk of exposure via dust inhalation remains [11]. Concentration data of potentially toxic elements including Pb from three previous studies were used to evaluate health risk of a former primary lead smelter (Santo Amaro, operated from 1960 to 1993) in Bahia, Brazil. The high concentrations around the chimney of the old smelter exceeded the regulatory limits for industrial soil. The health risk due to soil contamination by Pb was shown to be very high for children and moderately high for adults around the old factory [12].
The City of Newcastle upon Tyne is the regional capital of Northeast England and had a long and extensive history of industrial activity from the mid-18th century until the end of the Second World War. The city was a centre for the coal industry and lead manufacture with at least five lead works located within the city’s boundaries. The heavy industrial economy predominantly developed on riverbank sites. Walker Riverside Park, an area of public open space in the east end of Newcastle along the northern bank of the River Tyne, occupies primarily the site of the former St Anthony’s Lead Works. The factory operated from 1840s until its closure in 1930s, smelting lead ore and producing white and red lead and lead sheet and pipe. The site was demolished in 1932 and landscaped in the mid-1960s involving surface dressing of topsoil, grassing of open flat areas and tree planting [13]. In 2011, some areas of the site were fenced off for safety reasons and the grassed areas had an extra layer of soil added using the funding from DEFRA [14]. The site now comprises grassed level open areas, providing space for recreational activities, surrounded or divided by grassed wasteland or fenced steep inclines with scrub. The general physical layout of the site appears to follow the apparent landforms of both the original factory footprint and the cleared land. The park is situated just south of a highly populated residential area, its northern edge about 150 m away from the nearest houses. Uses of the park include pedestrian accessing, dog walking, playing ball games, bike riding and fishing on the riverside walkway. Site derived dusts or vapours are thus potential pollutant linkages causing human health risk through ingestion, inhalation and dermal contact. In an early report before any published assessment criteria in the UK applicable to public amenity land, topsoil samples from the Lead Works site were analysed after optimised microwave digestion with aqua regia. The pseudo-total Pb concentration within 17 out of 19 sampling points, some in the grassed level areas, exceeded the previous SGV for commercial land use (750 mg/kg) by up to 80 times [15]. In the following study on the site, the samples were also subjected to in vitro gastrointestinal extraction to assess the oral bioaccessibility. The percentage bioaccessibility factor for Pb ranged between 25–58%. A generic quantitative risk assessment (GQRA) was undertaken by comparing the pseudo-total concentrations (ranging between 174–33,306 mg/kg) with previous SGV for residential land use (450 mg/kg) and site-specific assessment criteria (SSAC, 1316 mg/kg). The outcome of statistical testing suggested that Pb concentrations in the topsoil at the site posed a “significant possibility of significant harm” (SPOSH). The Pb concentrations exceeded the SGV even in the in vitro extracts, thus the bioaccessibility data did not significantly influence the original site designation as contaminated based on the pseudo-total concentrations [16].
In this study, the former St. Anthony’s Lead Works Site is re-assessed based on total Pb concentrations determined by energy dispersive X-ray fluorescence (ED-XRF) in a large number of topsoil samples according to recently derived C4SL-POSpark. The SSAC for Pb is calculated using the CLEA model (version 1.071), and the soil Pb contamination is then statistically evaluated based on 95% upper confidence limit to see whether the site is suitable for the designated use in its present condition.
2. Materials and Methods
2.1. Certified Reference Materials (CRMs)
Eight soil and sewage sludge CRMs (GBW 07401/7402/7406/7407, BCR 144R/146R and SRM 2710/2711) were obtained from LGC-Promochem Ltd., London, UK.
2.2. Soil Sample Collection and Pre-Treatment
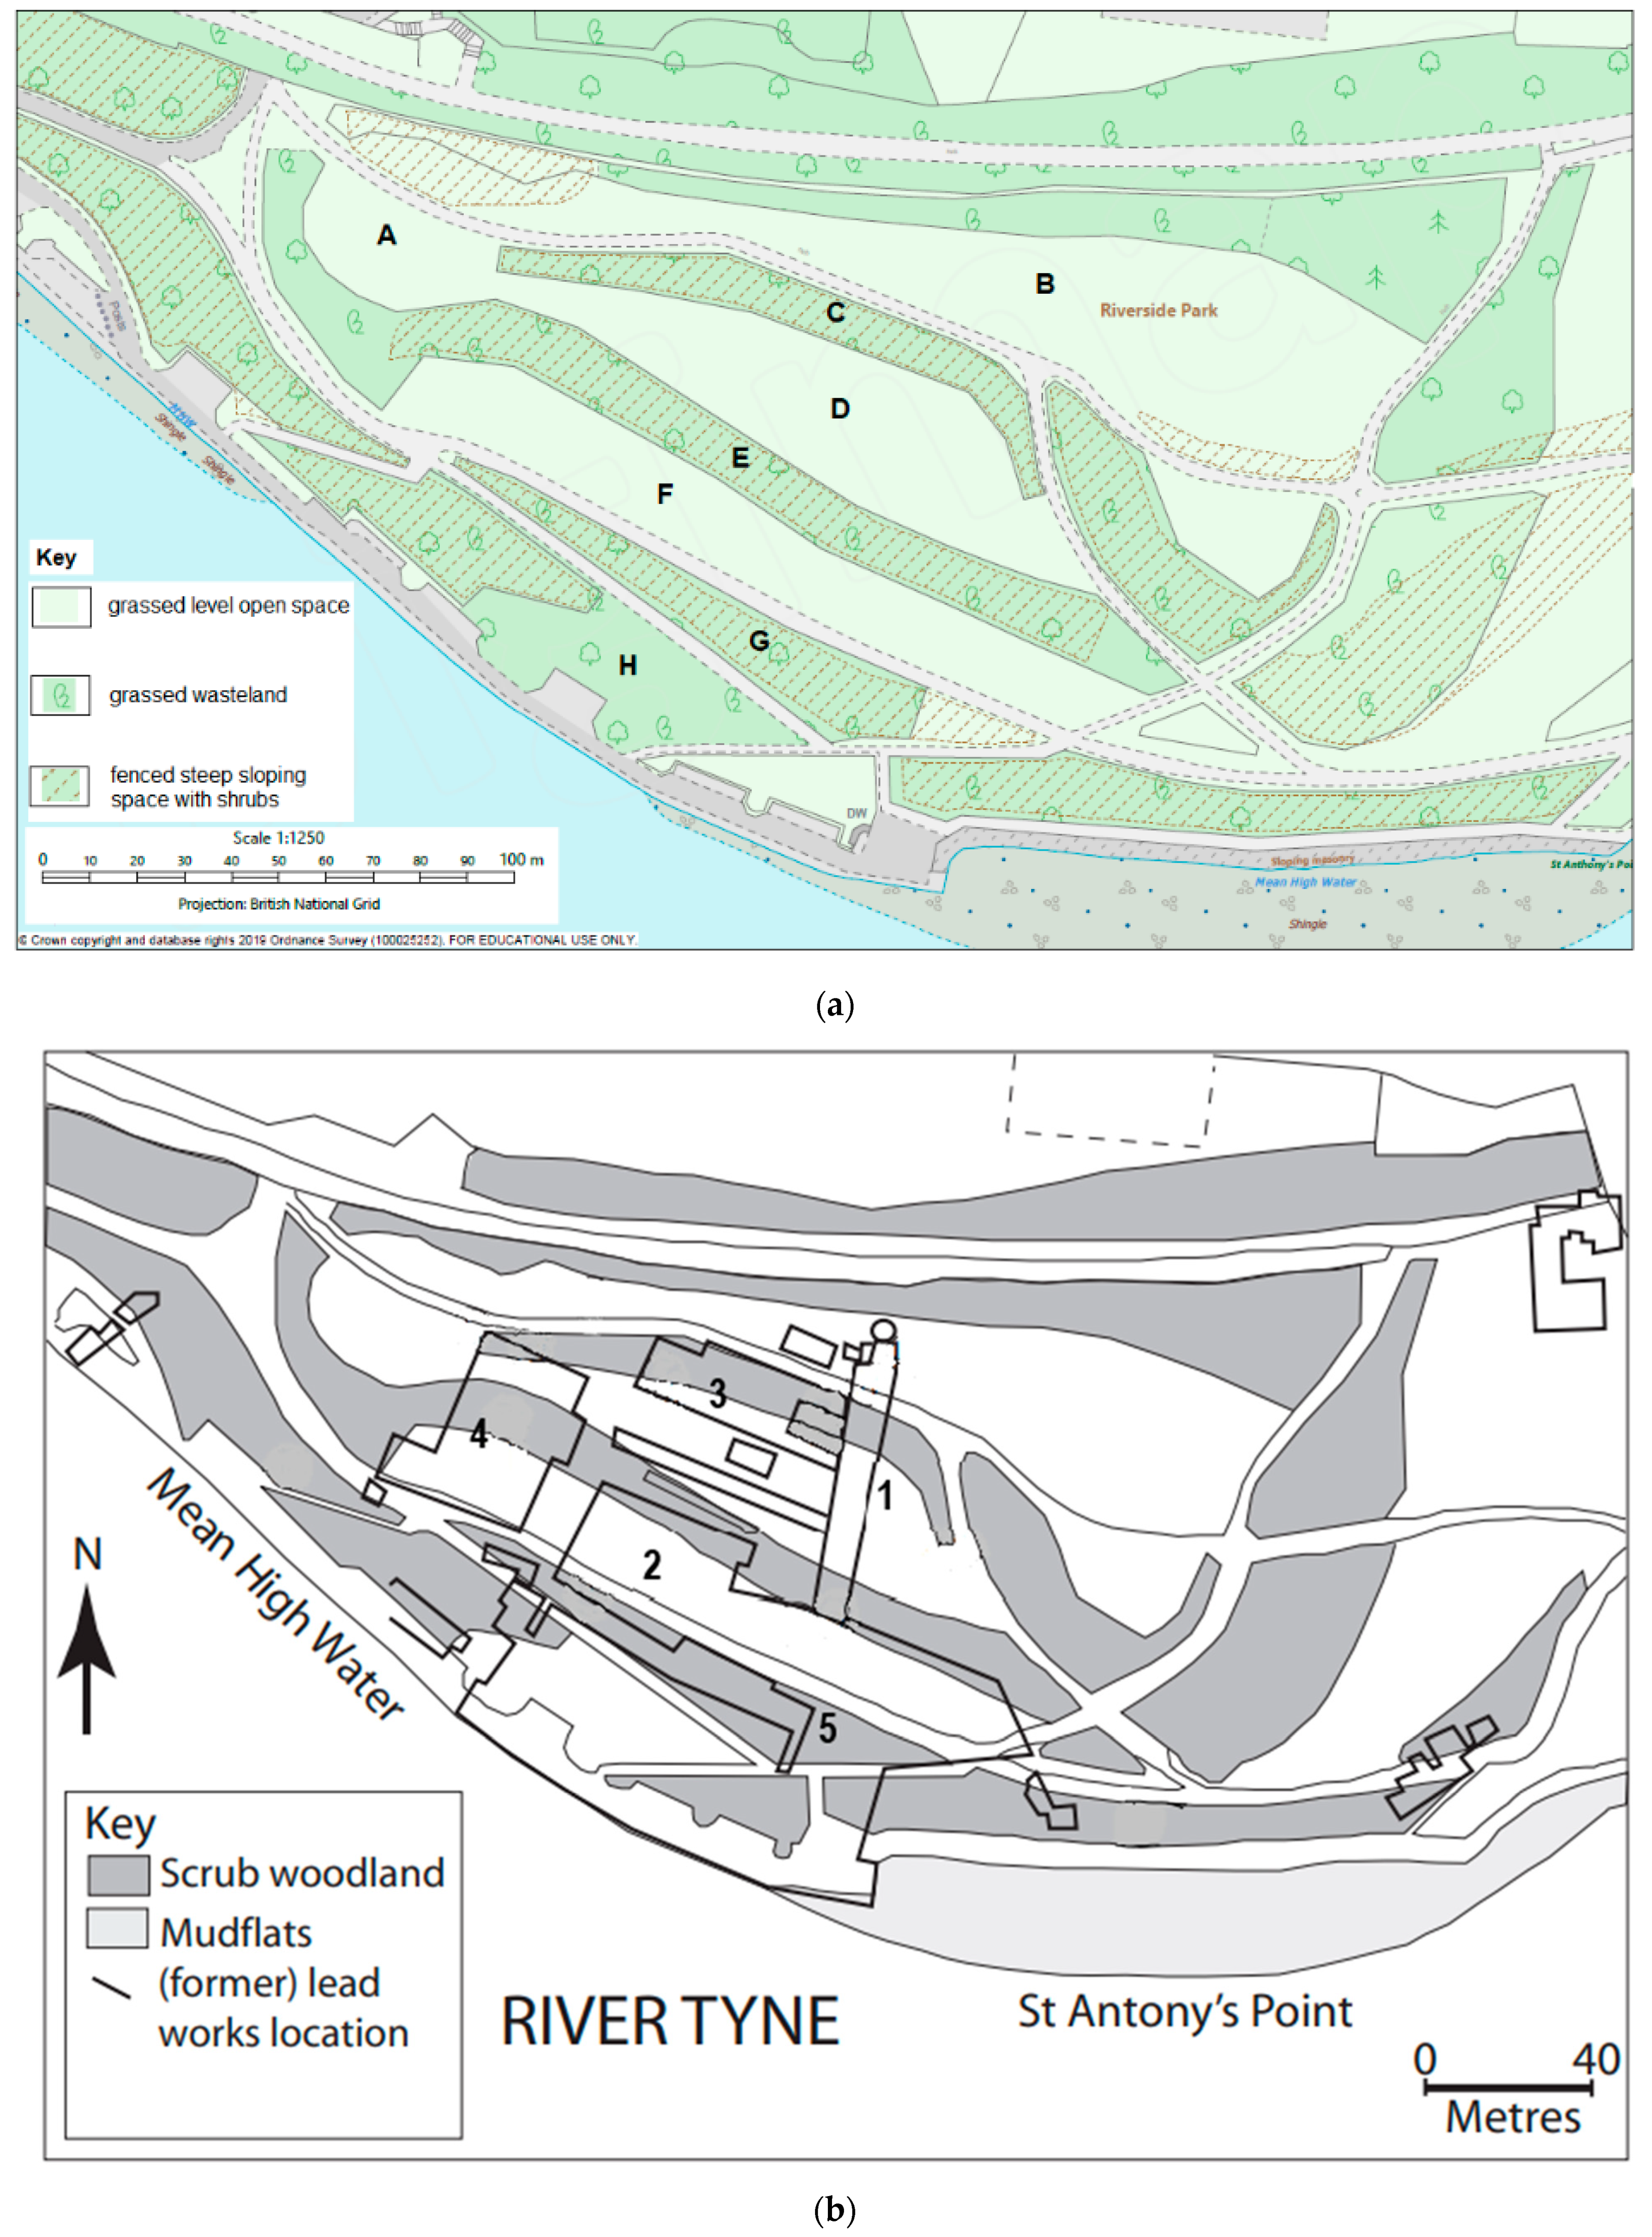
Samples of topsoil (2–10 cm), 79 in total, were collected from eight sampling areas (A–H) across the site (Figure 1a) in spring 2018 and 2019. The sampling areas were naturally defined by the geographical features and existing shrubs and fences. Multiple sampling points were selected within each sampling area to provide extensive coverage, exact numbers depending on the area size, ease of access and known functions within the previous factory (Figure 1b). The soil samples were put in the brown paper geochemical sampling bags and dried in a drying cabinet at a temperature of <40 °C for 6 days. The dried soil samples were ground gently using a porcelain mortar and pestle, and passed through a plastic sieve of mesh size 2 mm. The coarse fractions (>2 mm) were discarded, and the fine fractions (<2 mm) were retained for subsequent analyses.
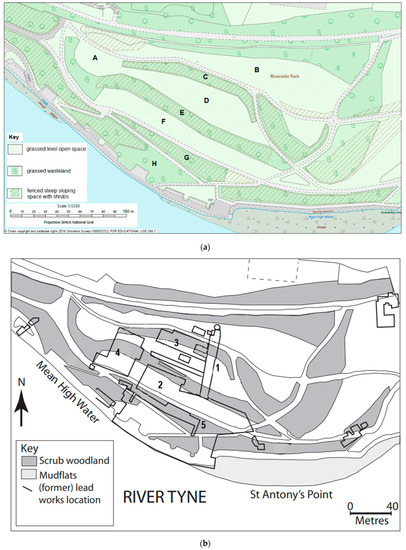
Figure 1.
Walker Riverside Park (a) location of the sampling areas (A–H), and (b) historic location of the Lead Works, superimposed on the site. 1. Main chimney, 2. Rolling mill, 3. Furnaces, 4. Storage, and 5. Refining.
2.3. Soil Sample pH and Organic Matter Content Determination
The soil pH was determined in a deionized water suspension in the ratio 1:2.5 (w/v) [17], using a pH meter (3010 Jenway, VWR International, Leicester, UK). The loss on ignition content (indicative of the organic matter content) of the soils was determined by taking 10 g of oven dried soil and subjecting it to 800 °C for 30 min in a preheated muffle furnace [18].
2.4. Soil Analysis by ED-XRF
Aliquots (~4.0 g) of samples, after being further powdered in a rotating ball mill, were accurately weighed and thoroughly mixed with Hoeschwax Hydrocarbon binder (~0.7 g) before being pressed (10-tonne pressure) into pellets for analysis. The ED-XRF instrument, Spectro Xepos (Spectro Analytical Instruments, Kleve, Germany), was operated using the standard Geochemistry Traces method. The EDXRF was operated according to the following for lead: X-ray tube, palladium and cobalt anode; 45.1 keV tube voltage; 400 s measurement time; 6 keV ≤ E ≤ 19 keV; and an air atmosphere.
2.5. Statistical Analysis
Microsoft Excel was used to test accuracy of the deployed analytical procedure via the analysis of CRMs of the same matrix types, including correlation analysis and paired t-test (two-tailed) for difference between the certified and measured values. The statistical distributions of sample data for each sampling area were presented in box and whisker charts showing the mean, upper and lower quartiles and outliers also using Excel. The final site-specific assessment was done using the Statistics Calculator (version 1, 2008) produced based on the guidance on comparing soil contamination data with a critical concentration from Chartered Institute of Environmental Health (CIEH) [19]. Briefly, after one-sample t statistic (t0) was calculated to find t(n−1, 0.95) where n is the number of samples in the dataset and n − 1 is the degrees of freedom, the 95% upper confidence limit (UCL0.95) was obtained as UCL0.95 = mean + (t(n−1, 0.95) × standard deviation/√n).
3. Results and Discussion
3.1. Characterization of the Topsoil Samples
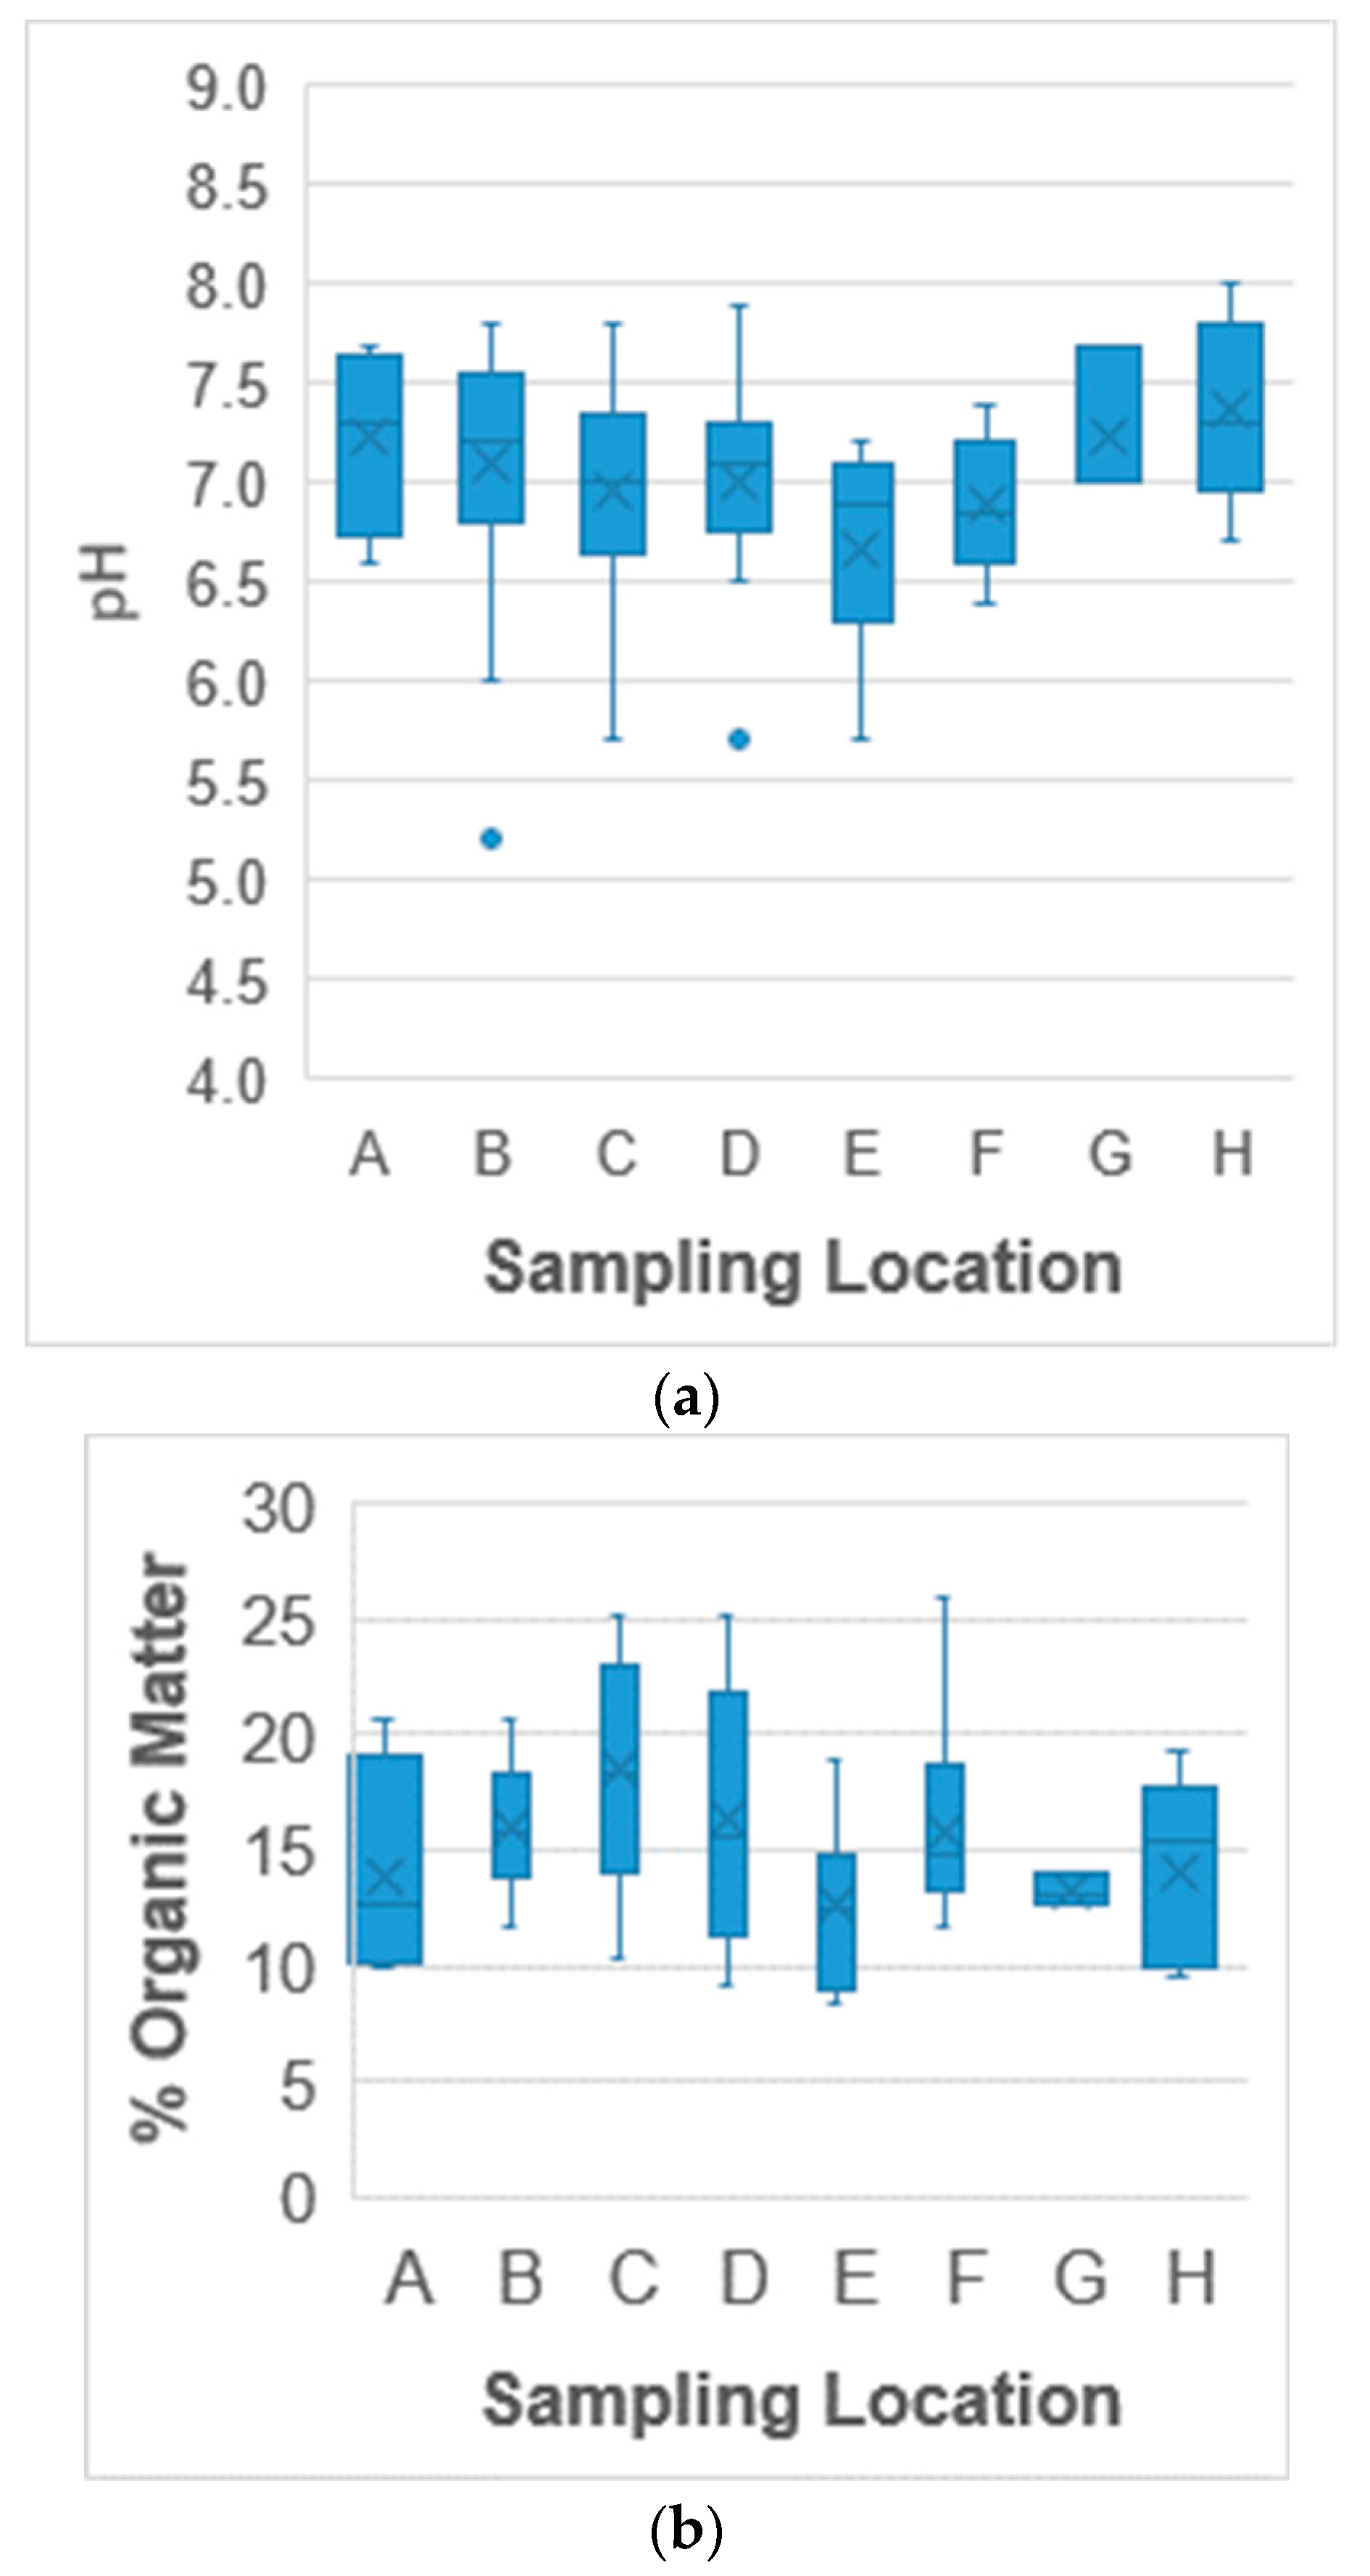
The soil samples collected from the site were characterised for acidity and organic matter content. All individual measurements for each sample, as well as the mean ± SD, for pH and percentage organic matter, are presented in Supplementary Material (Table S1). The statistical variations of pH value and organic matter content for each sampling area are shown in Figure 2. The soils from the study site were overall neutral (pH 7.0 ± 0.5), ranging between 5.2–8.0 with a median pH value of 7.1 and mode of 7.2. It is noted that no statistical difference, using the Student’s test at the 95% confidence interval, for pH (Figure 2a), when compared to the CLEA model’s default value (pH 7). The organic matter percentages (15.5 ± 4.1%) ranged from 8.4 to 25.9% with a median value of 15.1% and mode of 20.6%. In this situation a statistical difference, using the Student’s at the 95% confidence interval, for organic matter percentage (Figure 2b) is noted, when compared to the CLEA default value (6%). However, it is also noted that differences in the default parameter for organic matter percentage do not influence the metal assessment criteria for specific sites (in Section 3.3).
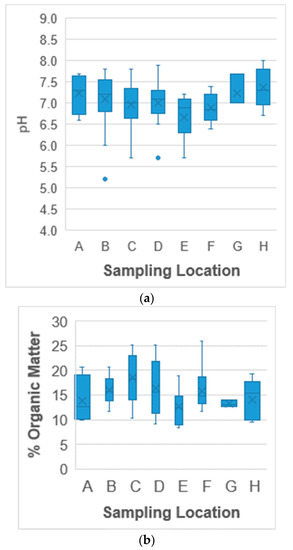
Figure 2.
Characteristics of the soils from Walker Riverside Park. (a) Acidity and (b) organic matter content. The x refers to the mean value, the shaded boxes represent the 95% confidence limit of the data while the whiskers represent variability outside the upper and lower quartiles and beyond the whiskers are outlier data points, per sampling location (A–H), see Figure 1a.
3.2. Concentrations of Pb in Soils
The collected soil samples were analysed by ED-XRF, which provided quantitative information for all elements commonly evaluated when assessing land contamination such as As, Cd, Cr and Pb defined for C4SLs. Initial data analysis revealed that the Cd concentrations (from below the detection limit to 51.0 mg/kg) were much lower than the generic C4SL-POSpark (880 mg/kg) and the maximum concentrations of As (5587 mg/kg) and Cr (622 mg/kg) did exceed their generic C4SL-POSpark values (168 and 250 mg/kg, respectively) but their concentration patterns were very similar to that of Pb, which was the dominating contaminant for a former lead works site. Therefore, the health risk assessment of the site was conducted solely based on the soil Pb levels.
To evaluate the accuracy of the approach, eight selected CRMs were analysed, which cover a very wide Pb concentration range from 14 to 5532 mg/kg. The certified and measured Pb concentrations are given in Table 1, and the correlation coefficient between them is 0.9999. The p value from the paired samples t-test is 0.1282, indicating that there is no significant difference between them (p > 0.05). It was noted that the measured values were, in average, 15.3% lower than the certified values. Therefore, a correction factor (of 1.18) was applied to all the study sample results.

Table 1.
Concentrations of Pb (mg/kg) in the tested certified reference standards.
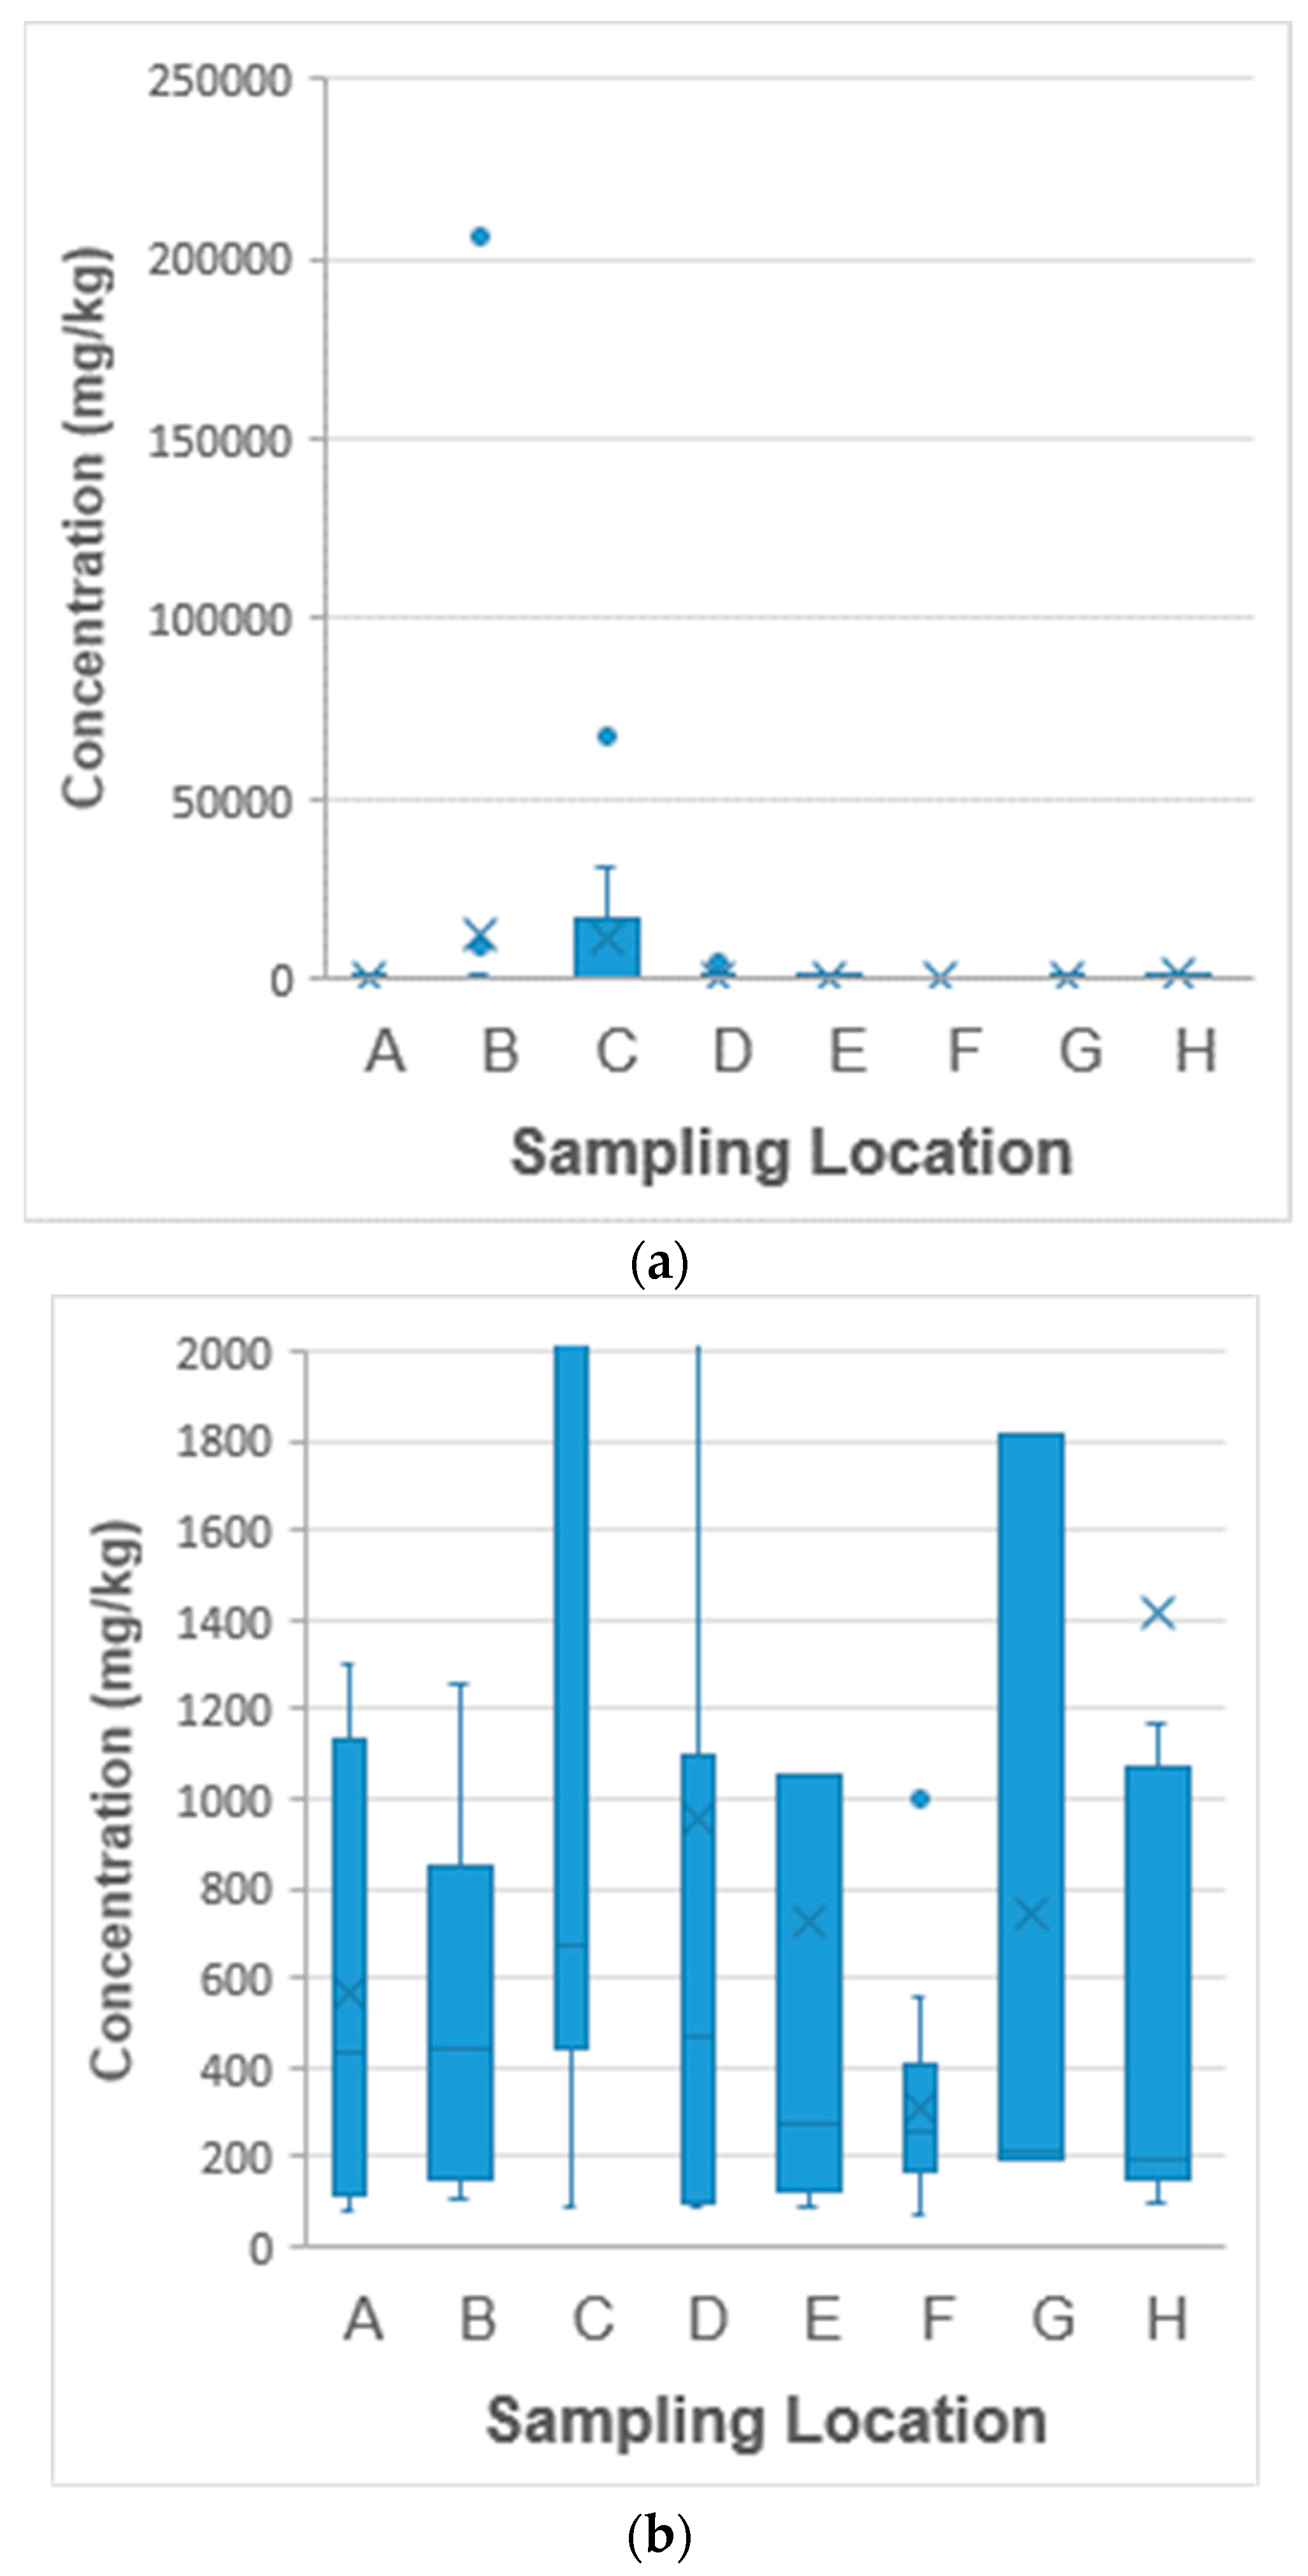
Concentration ranges of Pb in the study soil samples from each sampling area are shown in Figure 3. Figure 3a shows a plot of the overall results. However, the upper Pb concentration in selected samples in sampling areas B and C skew the image. Therefore, and within the context of the C4SL-POSpark concentration of 1300 mg/kg, the data is presented in Figure 3b. Huge variations were observed between and within sampling areas indicating a heterogeneous distribution of Pb. The full data is presented in Supplementary Material (Table S1) which highlights the number of replications per sampling location. In average, the Pb levels in sampling areas A, D, E, F and G (564, 953, 727, 314 and 742 mg/kg, respectively) are lower than the generic C4SL-POSpark (1300 mg/kg) followed by area H (1417 mg/kg) slightly above the generic limit, while areas B and C (12,350 and 11,745 mg/kg, respectively) over 9 times the threshold. Individually, majority of the concentrations are below the generic guideline value, down to 70 mg/kg, typically for the sampling points near the four edges of the site across all sampling areas. Over 16% of the results (13 out of 79) from all sampling areas except F, however, exceed the limit. Extremely high Pb levels were found in areas B (206,000 mg/kg or 20.6%) and C (67,298 and 30,882 mg/kg), while significantly elevated concentrations (2000–10,000 mg/kg) were recurrently detected across areas B, C, D, E and H particularly around the locations of the former main chimney (in the middle of area B, Figure 1b) and the horizontal condenser flue (running north to south across areas B, C and D, Figure 1b) associated with the ore smelting process in the centre of the site. The results suggest that added topsoil is insufficient, at least in some areas, to conceal the waste materials from previous industrial usage as the Pb concentrations appear to follow the pattern of use of the site. While the site is largely vegetated, it does have exposed soil particularly on the steep-sloped shrubby/wooded areas. Ash and clinker debris mixed with white and red lead deposits were observed previously in some exposed soil areas [13].

Figure 3.
Concentrations of Pb (mg/kg) in the soils from Walker Riverside Park. (a) Overall results and (b) aligned with C4SL-POSpark value of 1300 mg/kg. In each case the x refers to the mean value, the shaded boxes represent the 95% confidence limit of the data while the whiskers represent variability outside the upper and lower quartiles and beyond the whiskers are outlier data points, per sampling location (A–H), see Figure 1a.
The soil characteristics were examined; however, no clear link can be seen between the Pb concentration in a sample and its pH or organic matter content. For instance, the sample with the highest Pb level (206,000 mg/kg) has a high pH value of 7.8 but nearly average organic matter content of 14.1%. The samples with the second and third highest Pb level (67,298 and 30,882 mg/kg) both have the average pH value of 7.0 but high organic matter content of 23.1 or 18.4%. The fourth highest Pb concentration (9519 mg/kg) is associated with the highest pH value of 8.0 and a very low organic matter content of 10.2%, while the fifth and sixth highest Pb concentrations (8918 and 5289 mg/kg) associated with both average pH (6.9 or 7.1) and organic matter content (15.6 or 14.0%). On the other hand, three samples with the lowest pH values (5.2–5.7) all have a level of Pb below 700 mg/kg but high organic matter content (18.4–25.1%). Finally, six samples with the lowest organic matter content (<10%) have a very low Pb level (<200 mg/kg) except one sample (2500 mg/kg).
3.3. Site Specific Risk Assessment
The assessment of human health risk from the direct use of this site was modified using the CLEA model (version 1.071) and the SSAC value for Pb was generated based on adjusted exposure frequency and occupancy period while the exposure pathways, receptors, soil properties and relative bioavailability via soil ingestion were left as default. The parameters used for calculating the SSAC, Lead (C4SL child), are given in Table 2. Individually, nearly 9% of the individual samples, from sampling areas B, C, D and H, possessed Pb levels over the specific value, 2862 mg/kg. While the averages of areas A, D, E, F, G and H are below the new limit, the average Pb concentrations of areas B and C are at more than four times the SSAC.
Table 2.
CLEA parameter values used for calculating the SSAC, Pb (C4SL child).
Furthermore, the upper confidence limit (UCL) was calculated to statistically compare the Pb concentrations in the soil samples against the SSAC value in accordance with the guidance from Contaminated Land: Applications in Real Environment/Chartered Institute of Environmental Health (CL:AIRE/CIEH) [19]. The test scenario is to determine whether the true mean of samples is less than the critical concentration, i.e., the SSAC value of 2862 mg/kg, with the required evidence level set at 95% (the UCL). The comparison summarised in Table 3 confirms that the site remains contaminated, primarily because the UCLs of areas B and C in the centre of the site are greatly over the specific threshold, while that of area H is also slightly over, thus indicating that the site still represents a potential human health risk.
Table 3.
Statistical comparison of the soil sample Pb concentrations with the SSAC value.
4. Conclusions
The former St. Antony’s Lead Works site has been intensively investigated. The results show that topsoil in some areas of the site remain heavily contaminated posing human health risks. It appears that the pattern of Pb contamination is related to the features and structure of the previous factory. Further targeted soil treatment or remediation would be required if the site is to fully open to residents nearby for all kinds of recreational activity. Additional topsoil coverage and renewal of vegetation in currently exposed locations may bring the desired effect.
Supplementary Materials
The following supporting information can be downloaded at: https://www.mdpi.com/article/10.3390/separations9010012/s1, Table S1: Characteristics and Pb Concentrations of the Soils from Walker Riverside Park.
Author Contributions
Conceptualization, R.M. and J.R.D.; data curation, R.M. and J.R.D.; formal analysis, R.M. and J.R.D.; methodology, R.M. and J.R.D.; project administration, R.M. and J.R.D.; supervision, R.M. and J.R.D.; writing—original draft preparation, R.M.; writing—review and editing, R.M. and J.R.D. All authors have read and agreed to the published version of the manuscript.
Funding
This research received no external funding.
Institutional Review Board Statement
Not applicable.
Informed Consent Statement
Not applicable.
Data Availability Statement
Not applicable.
Acknowledgments
The authors are indebted to those Level 5 students who participated the lab work between 2018–2019. Gary Askwith is acknowledged for his technical support.
Conflicts of Interest
The authors declare no conflict of interest.
References
- US EPA. Framework for Metal Risk Assessment. 2007. Available online: https://www.epa.gov/sites/default/files/2013-09/documents/metals-risk-assessment-final.pdf (accessed on 19 October 2021).
- US EPA. Regional Screening Levels (RSLs): Generic Tables. 2019. Available online: https://www.epa.gov/risk/regional-screening-levels-rsls-generic-tables (accessed on 19 October 2021).
- Chinese Ministry of Environmental Protection. Risk Screening Guideline Values for Soil Contamination of Development Land (3rd Draft Edition). 2016. Available online: https://www.mep.gov.cn (accessed on 19 October 2021).
- Cheng, Y.Y.; Tang, Y.T.; Nathanail, C.P. Determination of the potential implementation impact of 2016 ministry of environmental protection generic assessment criteria for potentially contaminated sites in China. Environ. Geochem. Health 2018, 40, 967–985. [Google Scholar] [CrossRef] [PubMed]
- DEFRA; EA. Soil Guideline Values for Lead Contamination, R&D Publication SGV10. 2002. Available online: https://www.gov.uk/government/publications/contaminated-soil-assessing-risks-on-human-health (accessed on 19 October 2021).
- CL:AIRE. Development of Category 4 Screening Levels for Assessment of Land Affected by Contamination. SP1010. 2013. Available online: https://www.claire.co.uk/projects-and-initiatives/category-4-screening-levels (accessed on 19 October 2021).
- Middleton, D.R.S.; Watts, M.J.; Beriro, D.J.; Hamilton, E.M.; Leonardi, G.S.; Fletcher, T.; Close, R.M.; Polya, D.A. Arsenic in residential soil and household dust in Cornwall, south west England: Potential human exposure and the influence of historical mining. Environ. Sci.: Processes Impacts 2017, 19, 517–527. [Google Scholar] [CrossRef] [PubMed] [Green Version]
- Entwistle, J.A.; Amaibi, P.M.; Dean, J.R.; Deary, M.E.; Medock, D.; Morton, J.; Rodushkin, I.; Bramwell, L. An apple a day? Assessing gardeners’ lead exposure in urban agriculture sites to improve the derivation of soil assessment criteria. Environ. Internat. 2019, 122, 130–141. [Google Scholar] [CrossRef] [PubMed]
- Lei, K.; Giubilato, E.; Critto, A.; Pan, H.Y.; Lin, C.Y. Contamination and human health risk of lead in soils around lead/zinc smelting areas in China. Environ. Sci. Pollut. Res. 2016, 13, 13128–13136. [Google Scholar] [CrossRef] [PubMed]
- Jiang, Z.C.; Guo, Z.H.; Peng, C.; Liu, X.; Zhou, Z.R.; Xiao, X.Y. Heavy metals in soils around non-ferrous smelteries in China: Status, health risks and control measures. Environ. Pollut. 2021, 282, 117038. [Google Scholar] [CrossRef] [PubMed]
- Harvey, P.J.; Taylor, M.P.; Kristensen, L.J.; Grant-Vest, S.; Rouillon, M.; Wu, L.; Handley, H.K. Evaluation and assessment of the efficacy of an abatement strategy in a former lead smelter community, Boolaroo, Australia. Environ. Geochem. Health 2016, 38, 941–954. [Google Scholar] [CrossRef] [PubMed]
- Souza, L.Z.S.; de Andrade Lima, L.R.P. Risk assessment for the presence of potentially toxic elements in the vicinity of a former lead smelter in Bahia, Brazil. Environ. Earth Sci. 2021, 80, 532:1–532:11. [Google Scholar] [CrossRef]
- Newcastle City Council: PHEP Environment and Culture Directorate. Former St. Anthony’s Lead Works Site Desktop Study; Newcastle City Council: Newcastle upon Tyne, UK, 2006; p. 36. [Google Scholar]
- Evening Chronicle. Walker Riverside Park Closed over Pollution. 28 July 2011. Available online: https://www.chroniclelive.co.uk/news/north-east-news/walker-riverside-park-closed-over-1402109 (accessed on 19 October 2021).
- Okorie, A.; Entwistle, J.; Dean, J.R. The optimization of microwave digestion procedures and application to an evaluation of potentially toxic element contamination on a former industrial site. Talanta 2010, 82, 1421–1425. [Google Scholar] [CrossRef] [PubMed]
- Okorie, A.; Entwistle, J.; Dean, J.R. The application of in vitro gastrointestinal extraction to assess oral bioaccessibility of potentially toxic elements from an urban recreational site. Appl. Geochem. 2011, 26, 789–796. [Google Scholar] [CrossRef]
- Rowell, D.L. Soil Science—Methods & Applications; Pearson Education: Essex, UK, 1994. [Google Scholar]
- Avery, B.W.; Bascomb, C.L. Soil Survey Laboratory Methods. Soil Survey of England and Wales Technical Monograph, No. 6; Rothamsted Experimental Station: Harpenden, UK, 1987. [Google Scholar]
- CL:AIRE/CIEH. Guidance on Comparing Soil Contamination Data with a Critical Concentration. 2008. Available online: https://www.cieh.org/media/1237/guidance-on-comparing-soil-contamination-data-with-a-critical-concentration.pdf (accessed on 19 October 2021).
Publisher’s Note: MDPI stays neutral with regard to jurisdictional claims in published maps and institutional affiliations. |
© 2022 by the authors. Licensee MDPI, Basel, Switzerland. This article is an open access article distributed under the terms and conditions of the Creative Commons Attribution (CC BY) license (https://creativecommons.org/licenses/by/4.0/).