Article

Sensitivity Increase in Headspace Analysis of Hydrocarbons in Water by Using Online Selective Elimination of Gas Extractant

by
Oleg V. Rodinkov
1,
Alexey Y. Pisarev
1,
Leonid N. Moskvin
1,
Aleksandra S. Bugaichenko
1,* and
Pavel N. Nesterenko
2,3
1
Institute of Chemistry, Saint-Petersburg State University, 198504 Saint Peterburg, Russia
2
Chemistry Department, M.V. Lomonosov Moscow State University, 119991 Moscow, Russia
3
Research and Science Department, Shenzhen MSU-BIT University, Longgang District, Ruyi Rd. 299, Shenzhen 518172, China
*
Author to whom correspondence should be addressed.
Separations 2022, 9(1), 15; https://doi.org/10.3390/separations9010015
Submission received: 9 December 2021 / Revised: 29 December 2021 / Accepted: 10 January 2022 / Published: 14 January 2022
(This article belongs to the Section Environmental Separations)

Abstract

:
In this study, a novel approach in headspace gas chromatographic analysis using the selective absorption of the gas extractant during concentration of the analytes was developed. The carbon dioxide used as the gas extractant was removed from the sample flow by passing it through a column packed with microdispersed sodium hydroxide granules. The analytical capabilities of the suggested method were illustrated by the determination of aliphatic and aromatic hydrocarbons in water. We established that this method allows the preconcentration of analytes in the gas phase to be increased proportionally to the volume ratios of the gas extractant before and after absorption, while the analyte limits of detection decrease 30-fold. For example, benzene can be detected in water at a concentration of 0.5 μg/L.

1. Introduction

The general method of determining volatile organic compounds (VOCs) in aqueous solutions is headspace analysis (HSA), which is based on various modes of the gas-phase extraction of analytes and their gas chromatographic (GC) determination [1,2,3,4,5,6]. HSA is a nonalternative method for the analysis of hydrocarbons, solving problems in the areas of sanitation and environmental control, in particular, the use of headspace analysis in the case of highly toxic aromatic hydrocarbons dissolved in water, the determination of which requires highly efficient concentration methods. By considering the partition of VOCs between the aqueous and the gas phase, the gas-phase extraction isolation of analytes enables an increase in the sensitivity of the analysis by one to three orders of magnitude compared to the direct injection of aqueous samples (without enrichment) into the gas chromatograph. Even so, it is not always sufficient to meet the maximum permissible level (several parts per billion) for the determination of benzene in natural and drinking water. Therefore, an additional preconcentration of analytes must be used for GC analysis. A combination of HSA with gas-phase adsorption is often used for the preconcentration of analytes. Additionally, the preconcentration of VOCs using static gas-phase extraction, known as headspace solid-phase microextraction (HS SPME) [7,8,9,10,11], dynamic [9,12,13], and continuous gas-phase extraction [14,15,16], can be achieved.
There are two common methods for the dynamic gas extraction of analytes. In the first, a flow of the gas extractant is passed through the stationary liquid phase, whereas in the second, continuous gas extraction, it is passed through the mobile liquid phase (so that the two phases are mobile). The dynamic gas extraction method used in this study is known as purge-and-trap (P&T). The results from comparing the analytical capabilities of HS SPME and P&T [9] have not revealed any clear advantage of one method over the other. The advantage of P&T is the possibility of extracting VOCs in a continuous flow-through mode [17,18]. However, both methods experience a possible problem associated with the incomplete extraction of VOCs at the thermal desorption stage, causing poor precision in and uncertain validity of the analytical results [19]. However, this problem has been dealt with in various commercial systems.
The aim of the present work was the development of a new version of sensitive HSA exploring the additional preconcentration of VOCs using the selective trap of the gas extractant. Carbon dioxide was chosen as the gas extractant capable of selective absorption by solid alkali. Alternatively, other highly efficient absorbents can be used for carbon dioxide capture [20].

2. Materials and Method

2.1. Theoretical Background

During gas-phase extraction, a molar fraction ni of the ith extracted component in the gas phase, which is in equilibrium with the source solution, can be expressed as:
n i = p i p i + p j + p L 0 + p E G
where pi is the partial pressure of the ith extracted component; Σpj is the sum of partial pressures of other volatile components from the analyzed solution and impurities in the gas extractant; pL0 is the saturated vapor pressure of the solvent at a given temperature; pEG is the pressure of the gas extractant. In the headspace analysis of aqueous solutions, the value of pEG has the main impact (>95%) on the denominator in Equation (1) under normal conditions, in the case of using pure-enough gas extractant. If gas-extractant flow containing the extracted analytes is directed to a column that is packed with material selectively absorbing the gas extractant, then a directly proportional increase in the molar fraction of analytes in the gas phase occurs according to a decrease in the denominator in Equation (1). An additional preconcentration effect can be obtained for the HSA of aqueous solutions due to the absorption of both the carrier gas and the solvent vapors, which are inevitably present in the flow of the gas extractant coming from the headspace of the analyzed liquid. As defined, the analytes that are not absorbed must stay in the gas-phase flow.
A feature of the developed method that should be taken into account is the longitudinal molecular diffusion of the concentrated analytes in the gas phase of the absorption cartridge. As a result of the gas-extractant elimination, analytes, which are present therein, tend to concentrate from the gas phase onto the first sections of the absorption cartridge, while diffusing toward the opposite end of the cartridge and outside of it. In the case of a one-dimensional model, the process of longitudinal diffusion in the gas phase of a column can be described by an equation well-known in the theory of chromatography:
C i ( x , t ) = C i 0 exp ( x 2 4 D i t )
where Ci(x,t) is the concentration of the ith component at a distance x from a column inlet at time t from the start of the diffusion process; Ci0 is a concentration of the ith component at the column inlet (x = 0) at the initial time (t = 0); Di is the diffusion coefficient of the ith component. Considering the high diffusion rates in the gas phase, for example, the concentration of benzene (D ≈ 0.25 cm2/s at 20 °C) at the column outlet (length, 15 cm) in 2 min will be 6.5 times less than the initial concentration at the inlet. For this reason, high flow rates of the gas extractant should be used and gas-phase extraction must be completed in the shortest possible time to minimize the negative effect of longitudinal diffusion on the preconcentration of the analytes in the gas flow exiting the absorption cartridge.
For the analysis of aqueous samples using the proposed method, the most convenient gas extractants include carbon dioxide, hydrogen, and steam. In addition to the technical difficulties involved in performing gas-phase extraction at high temperatures, the use of steam is limited by the absence of selective absorbents that do not retain polar organic substances. For example, popular desiccants such as CaCl2 and Mg(ClO4)2 are not suitable, as they can retain lower alcohols and ketones together with steam [21]. Potentially, potassium fluoride, which is not soluble in polar organic solvents compared to ordinary dehydrators [22], might be used as a selective absorbent of water vapor. Hydrogen is widely used in gas chromatography (GC) in terms of its application with flame ionization detector (FID) and is readily absorbed by palladium, its alloys, and some other metals at room temperature [23]. Unfortunately, these metals are effective catalysts for hydrogenation in various organic substances [24], which makes their chromatographic identification difficult. Thus, carbon dioxide is the most suitable gas extractant for the proposed has method because of its low cost, operational safety, and availability. Moreover, various substances can efficiently absorb it [20]. Carbon dioxide absorption by alkali is well-known; for example, the application of widely available solid sodium hydroxide was described [25]. The interaction between carbon dioxide and sodium hydroxide is considered to be chemisorption, including both adsorption on the surface of solid sodium hydroxide and absorption in the aqueous liquid layer formed as a result of the reaction:
2 NaOH + CO2 → Na2CO3 + H2O
The release of water does not affect the retention of nonpolar analytes that are poorly soluble in water. Polar analytes (alcohols, ketones, and ethers) may react with alkali in the presence of water.
Among the possible variants of continuous HSA, chromatomembrane HSA with simultaneous movement of flows of an aqueous sample and a gas extractant through the cell with a biporous hydrophobic matrix is the most efficient and convenient one to be integrated into online analysis [26]. The main advantages of a continuous HSA mode are the high efficiency of mass transfer between the flows of the liquid and gas phases and the possibility of continuous isolation of VOCs from the analyzed aqueous phase flow into the gas-extractant flow. The application of 3D printing technology for making chromatomembrane cells creates new prospects in chromatomembrane HSA [27].

2.2. Reagents

In this study, a set of test substances including benzene, toluene, hexane, and heptane was used due to their chemical inertness toward alkali metal hydroxides used for carbon dioxide absorption. The choice of these substances was also connected with a strong need for their determinations in water at the trace level. Model aqueous solutions with a concentration of 5 mg/L were prepared by using chromatographically pure substances from unopened glass ampoules (Reachem, Moscow, Russia) and deionized water. High-purity, 99.8%, carbon dioxide was obtained from NII KM (Moscow, Russia). The main characteristics of the test substances are listed in Table 1.

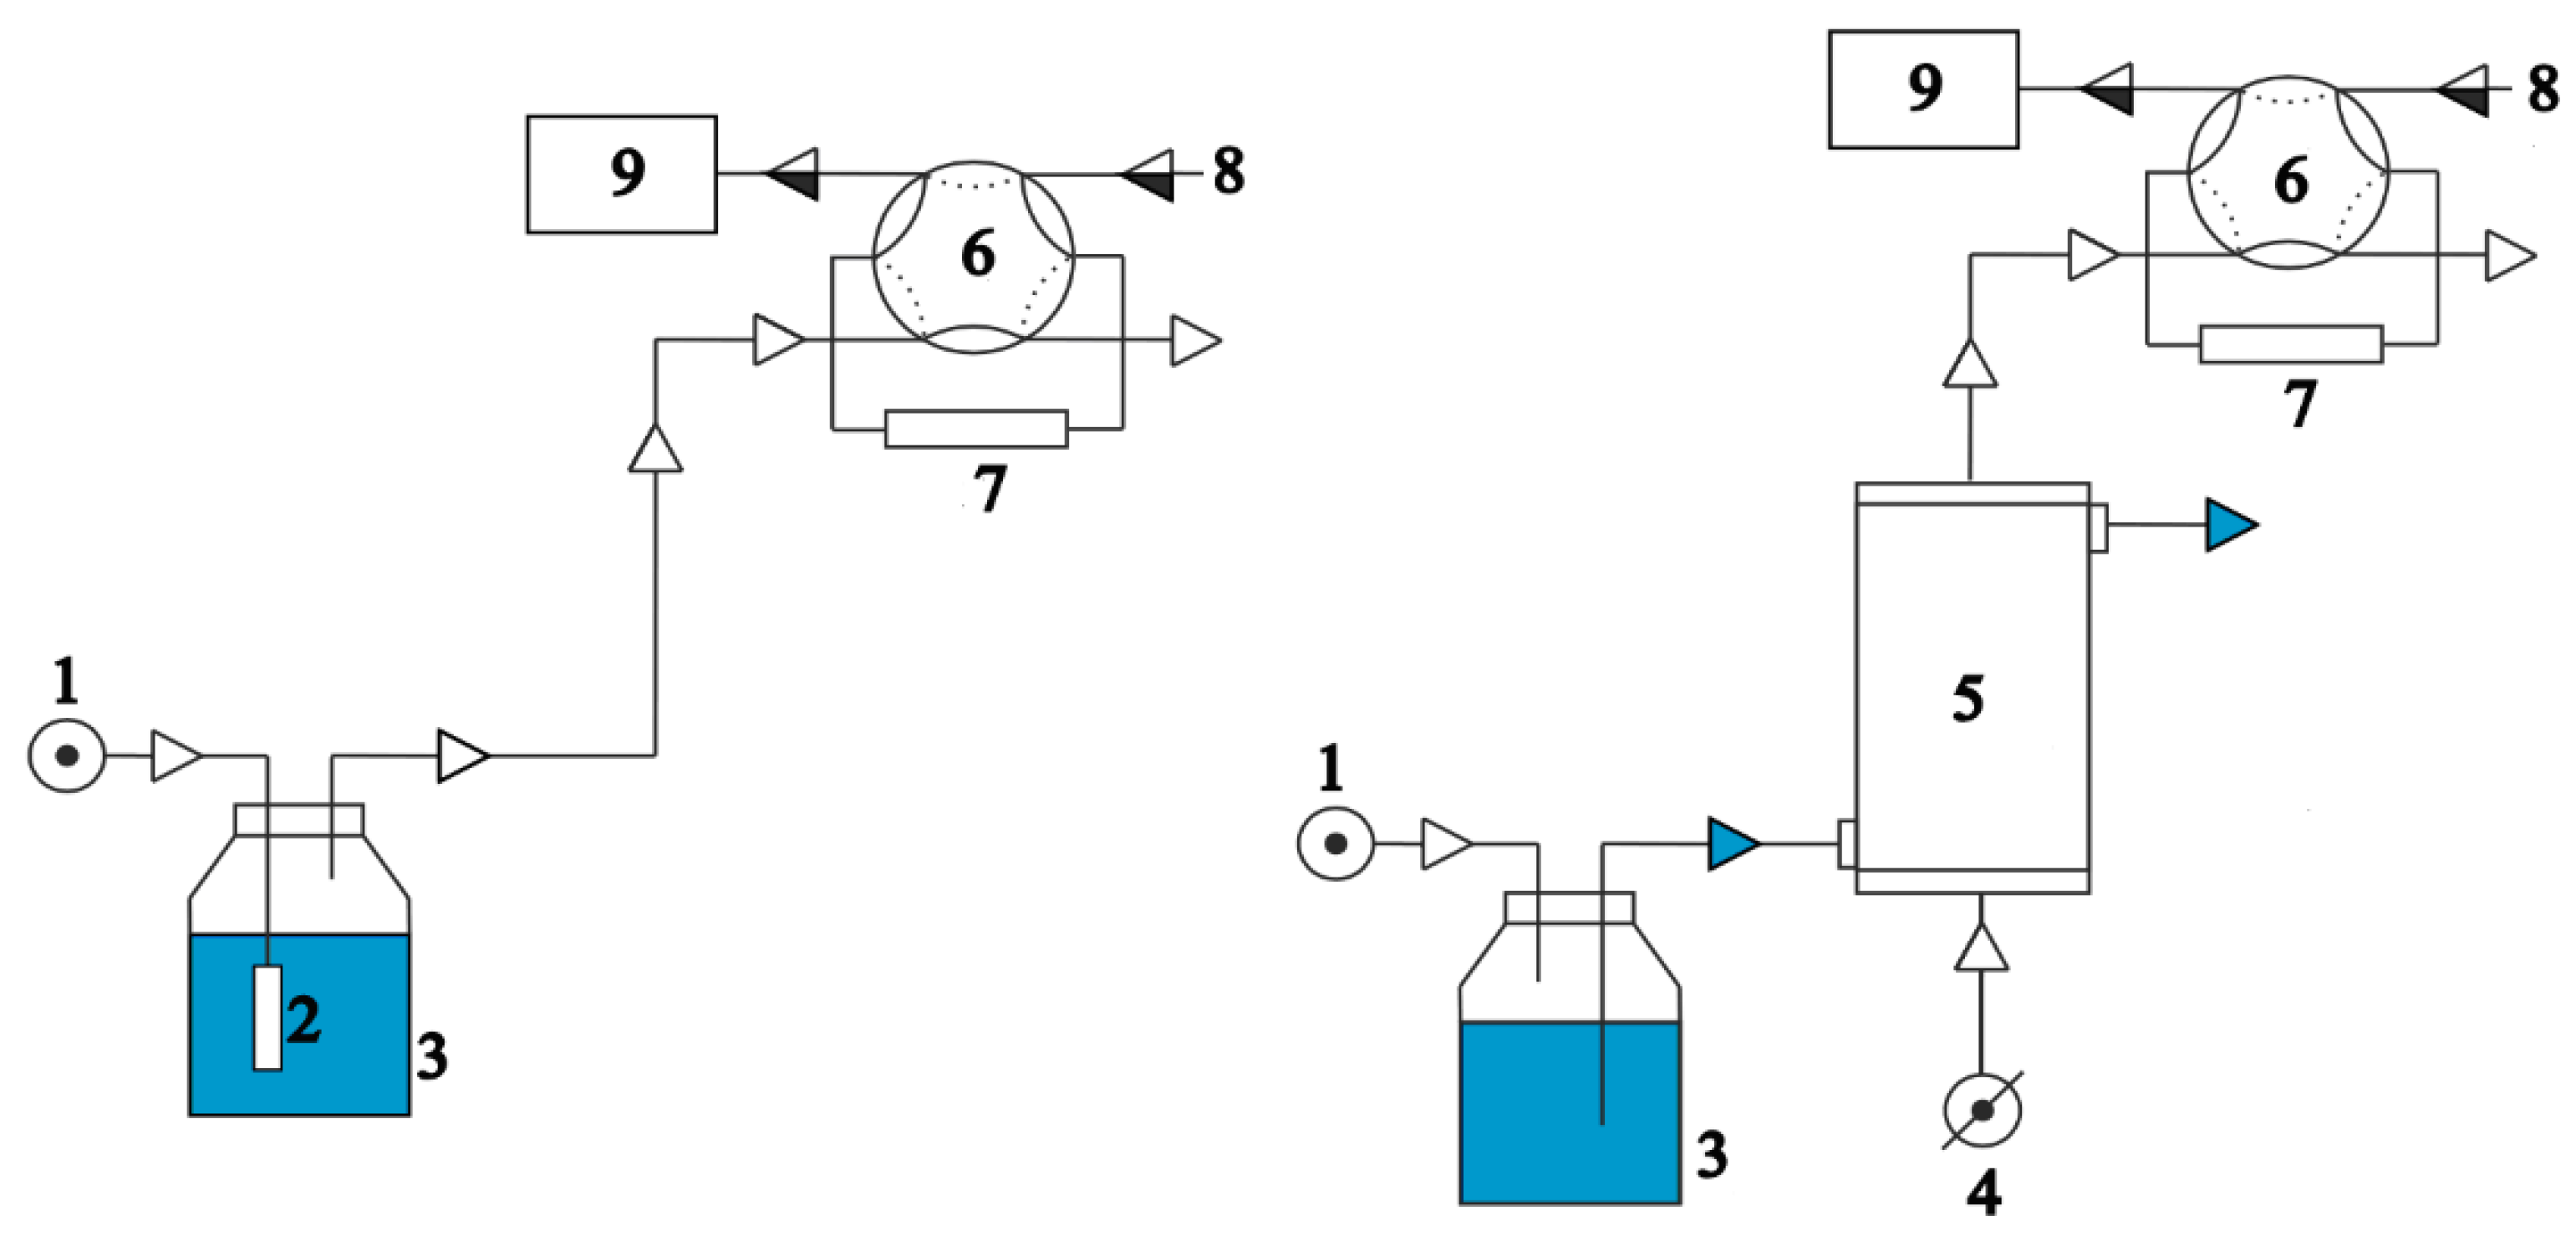
2.3. Instrumentation
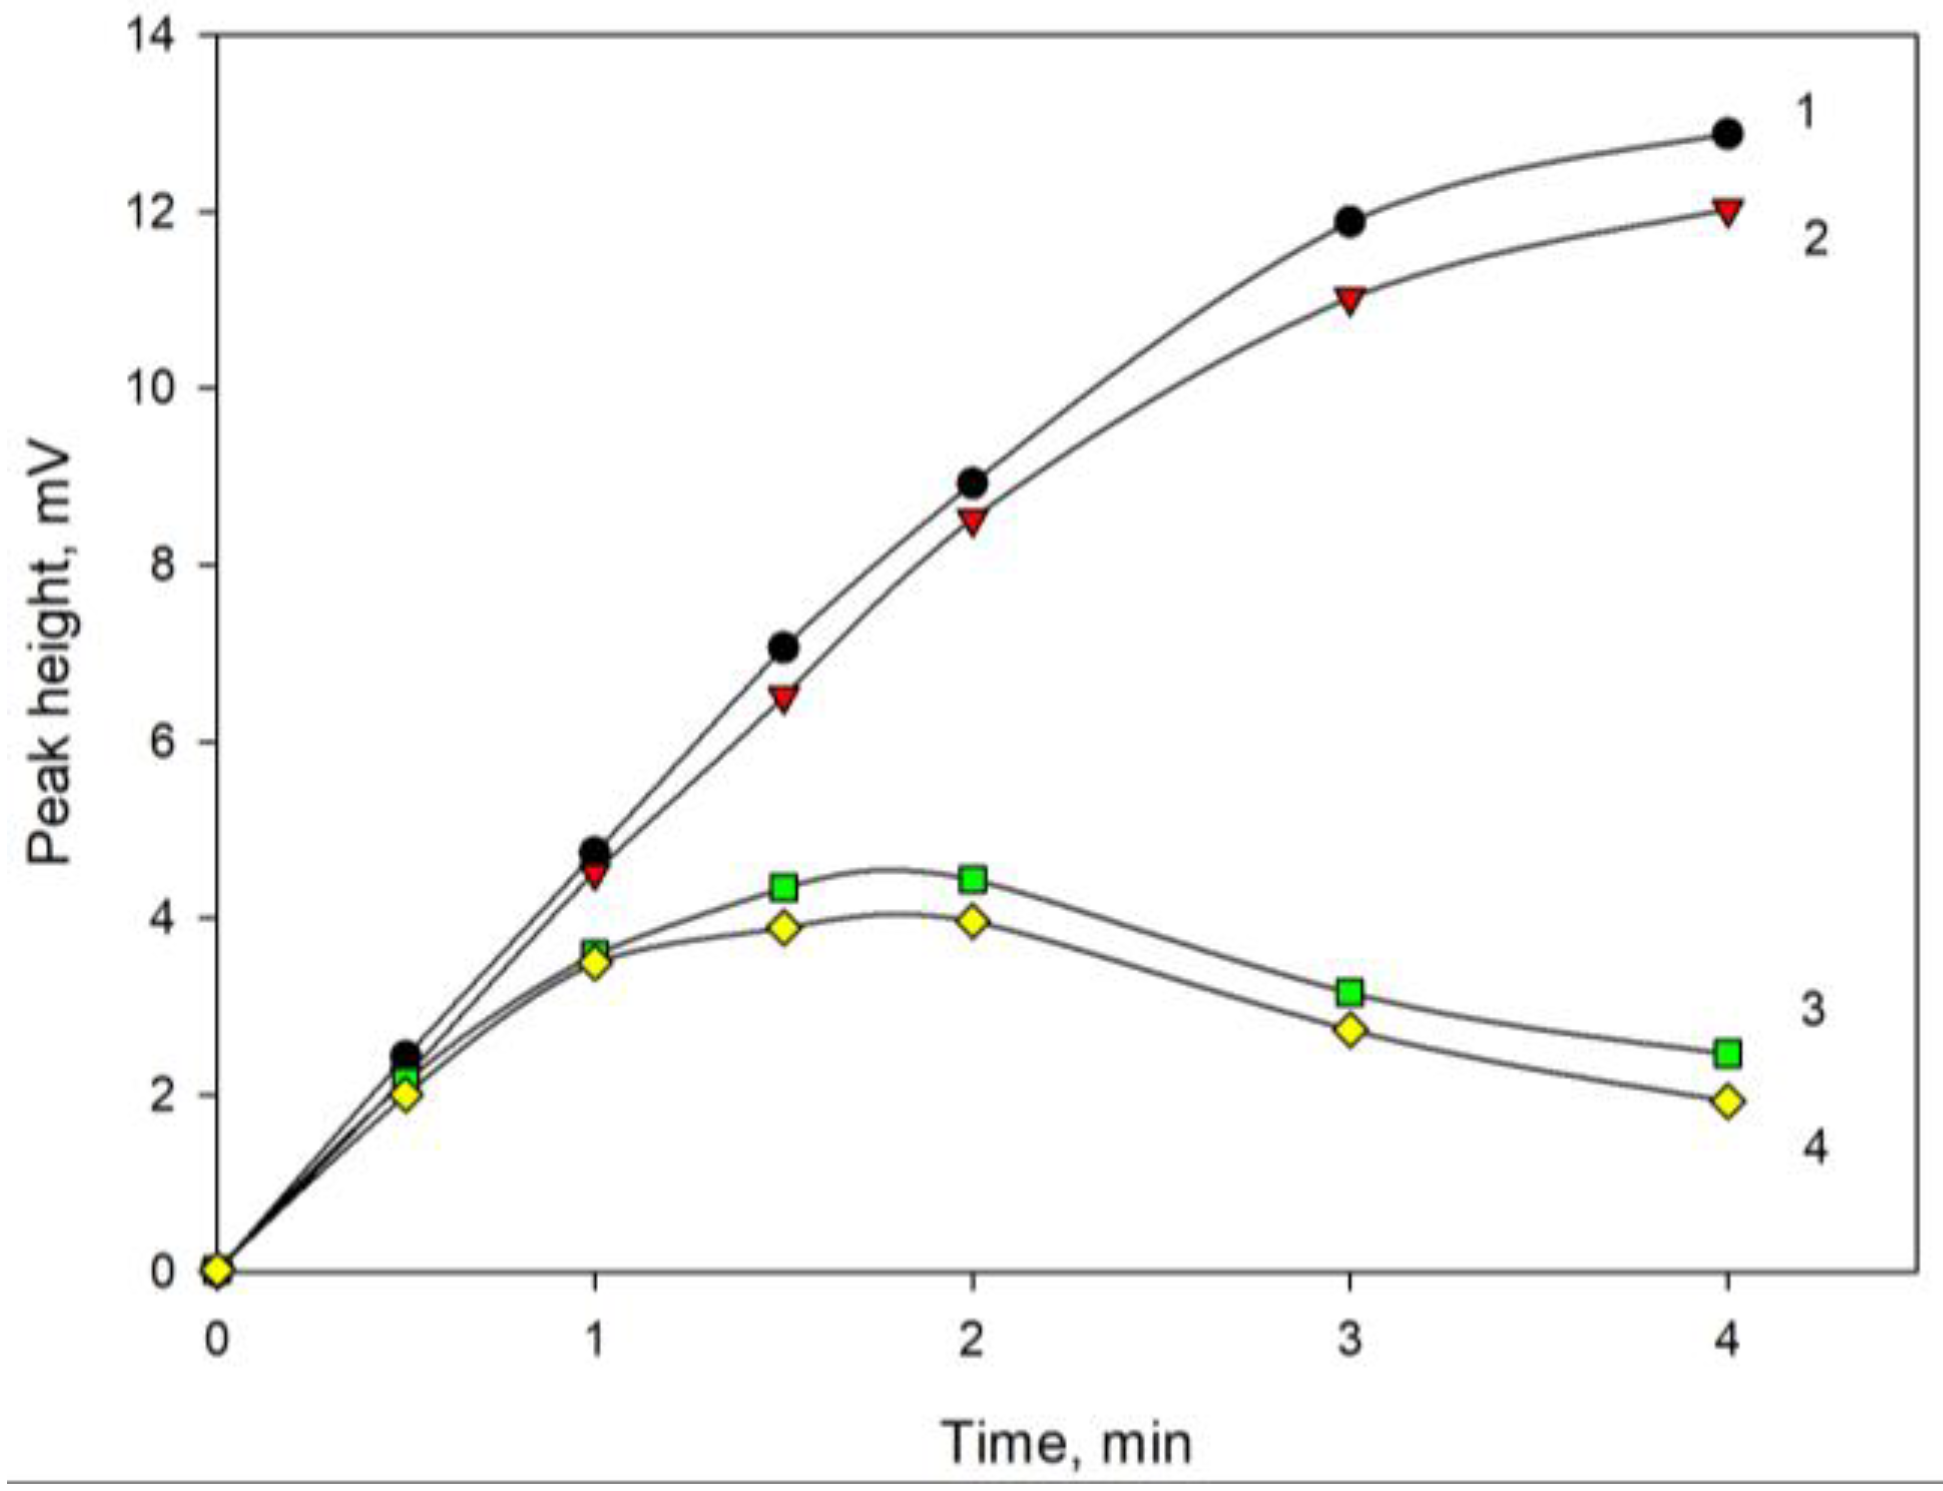
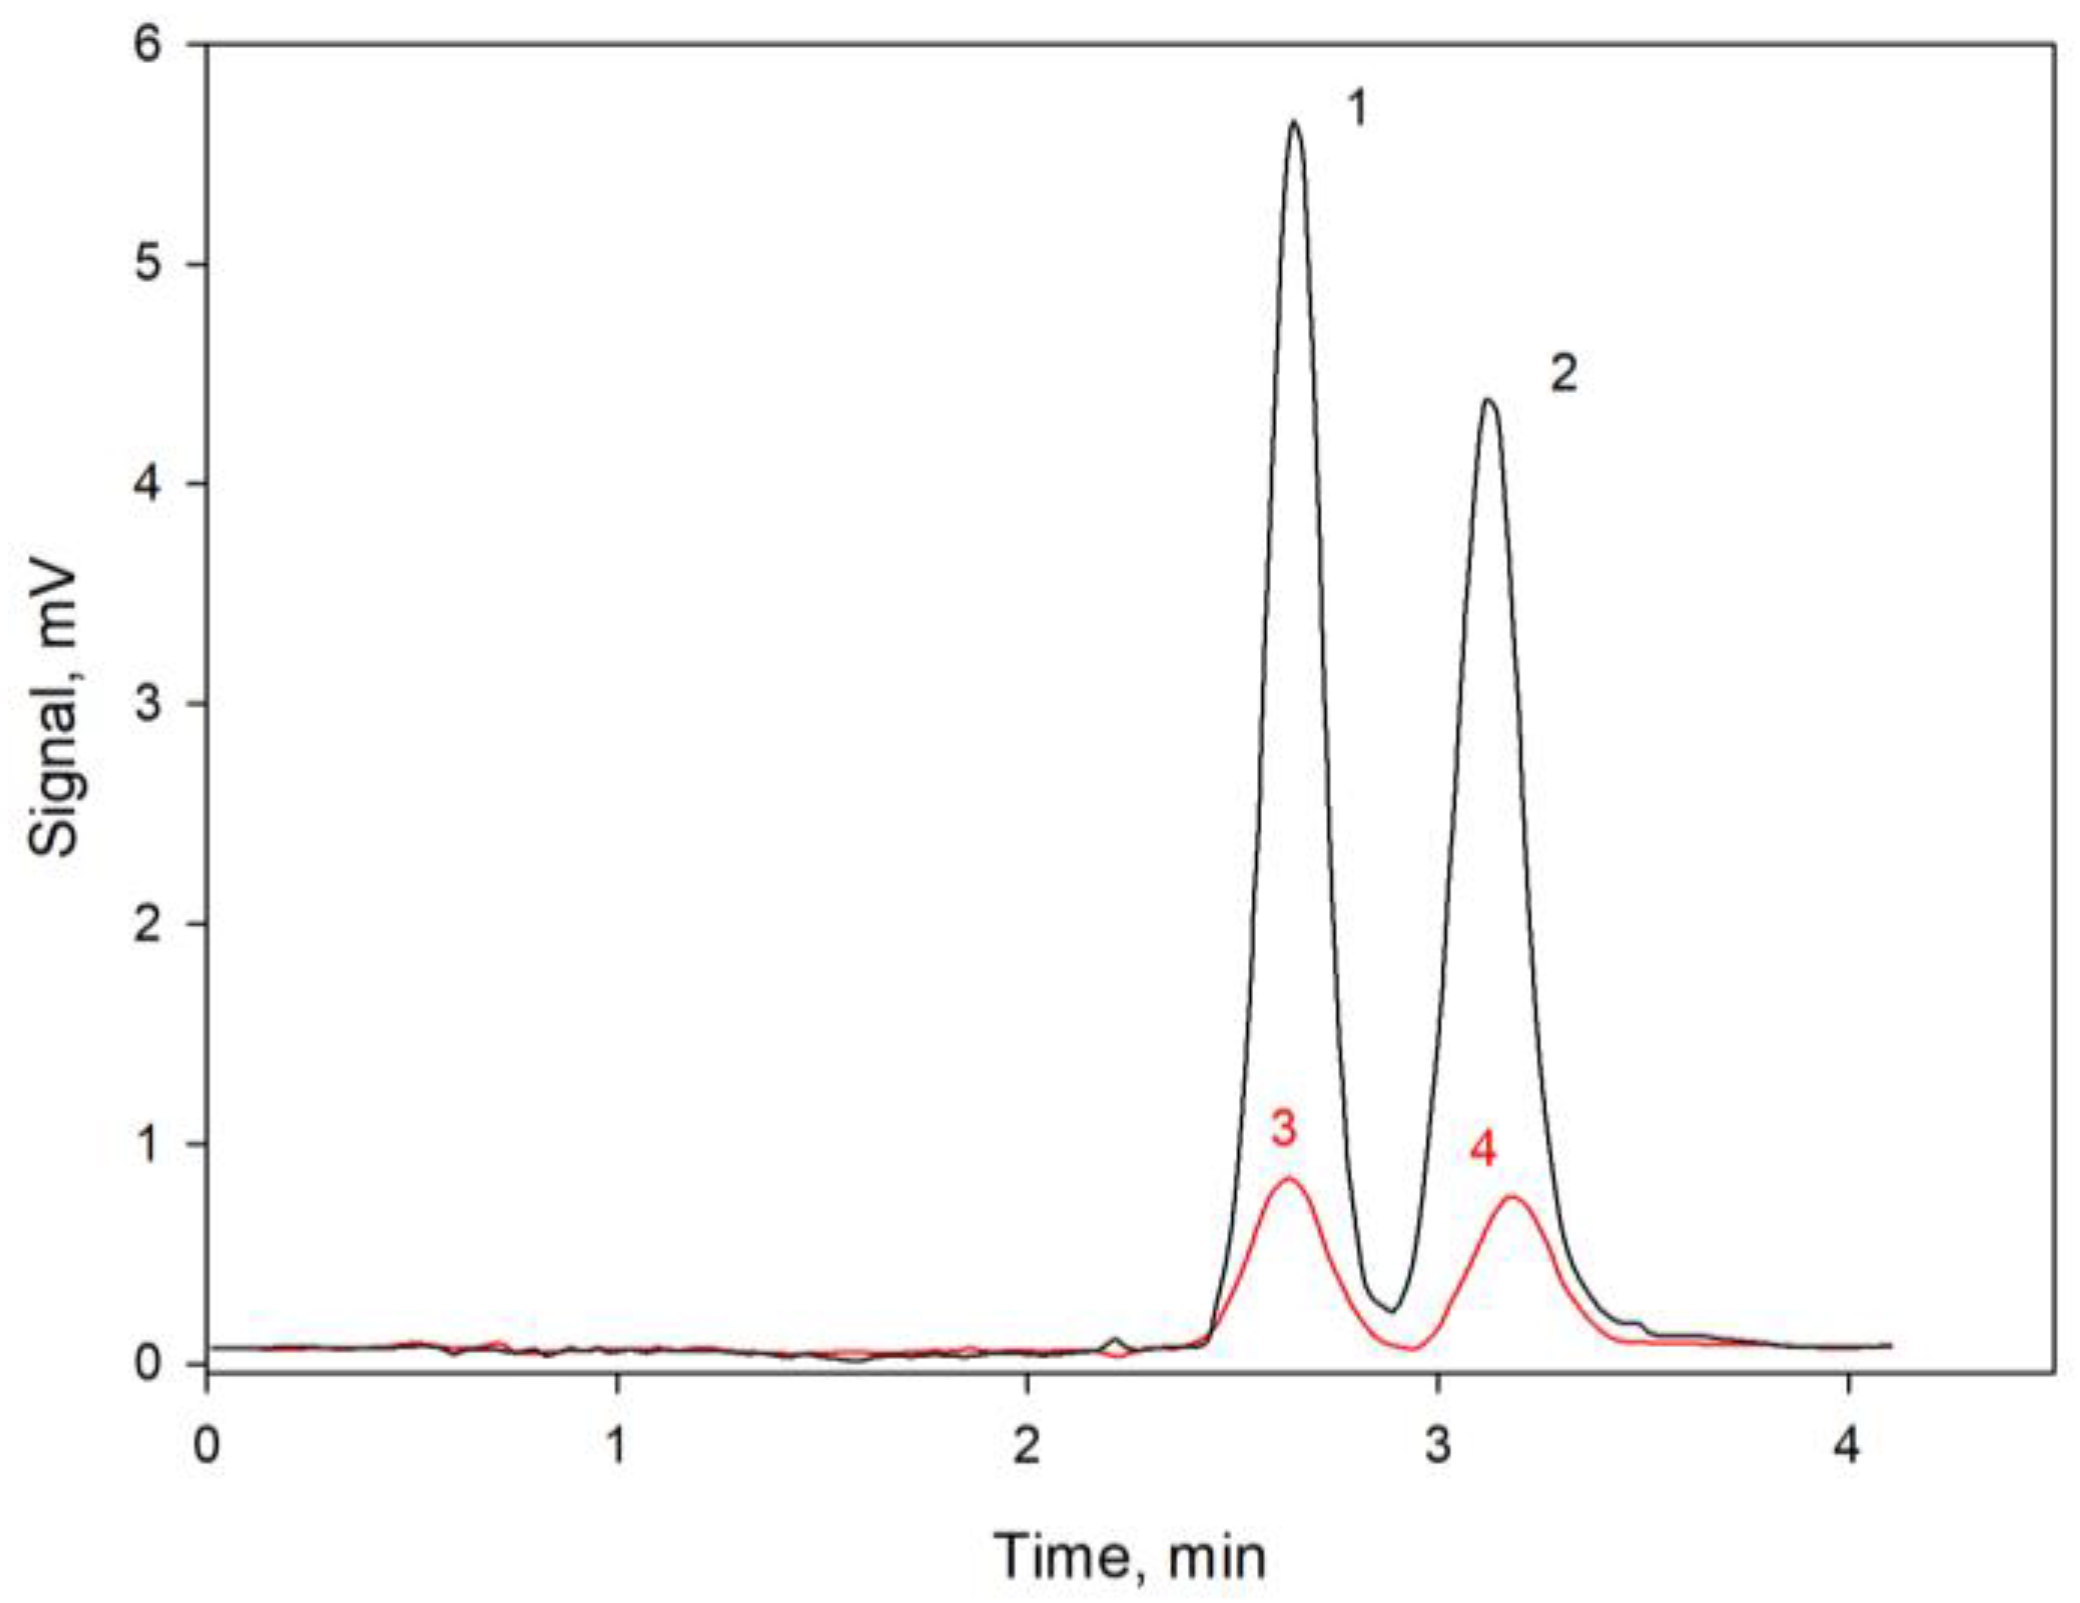
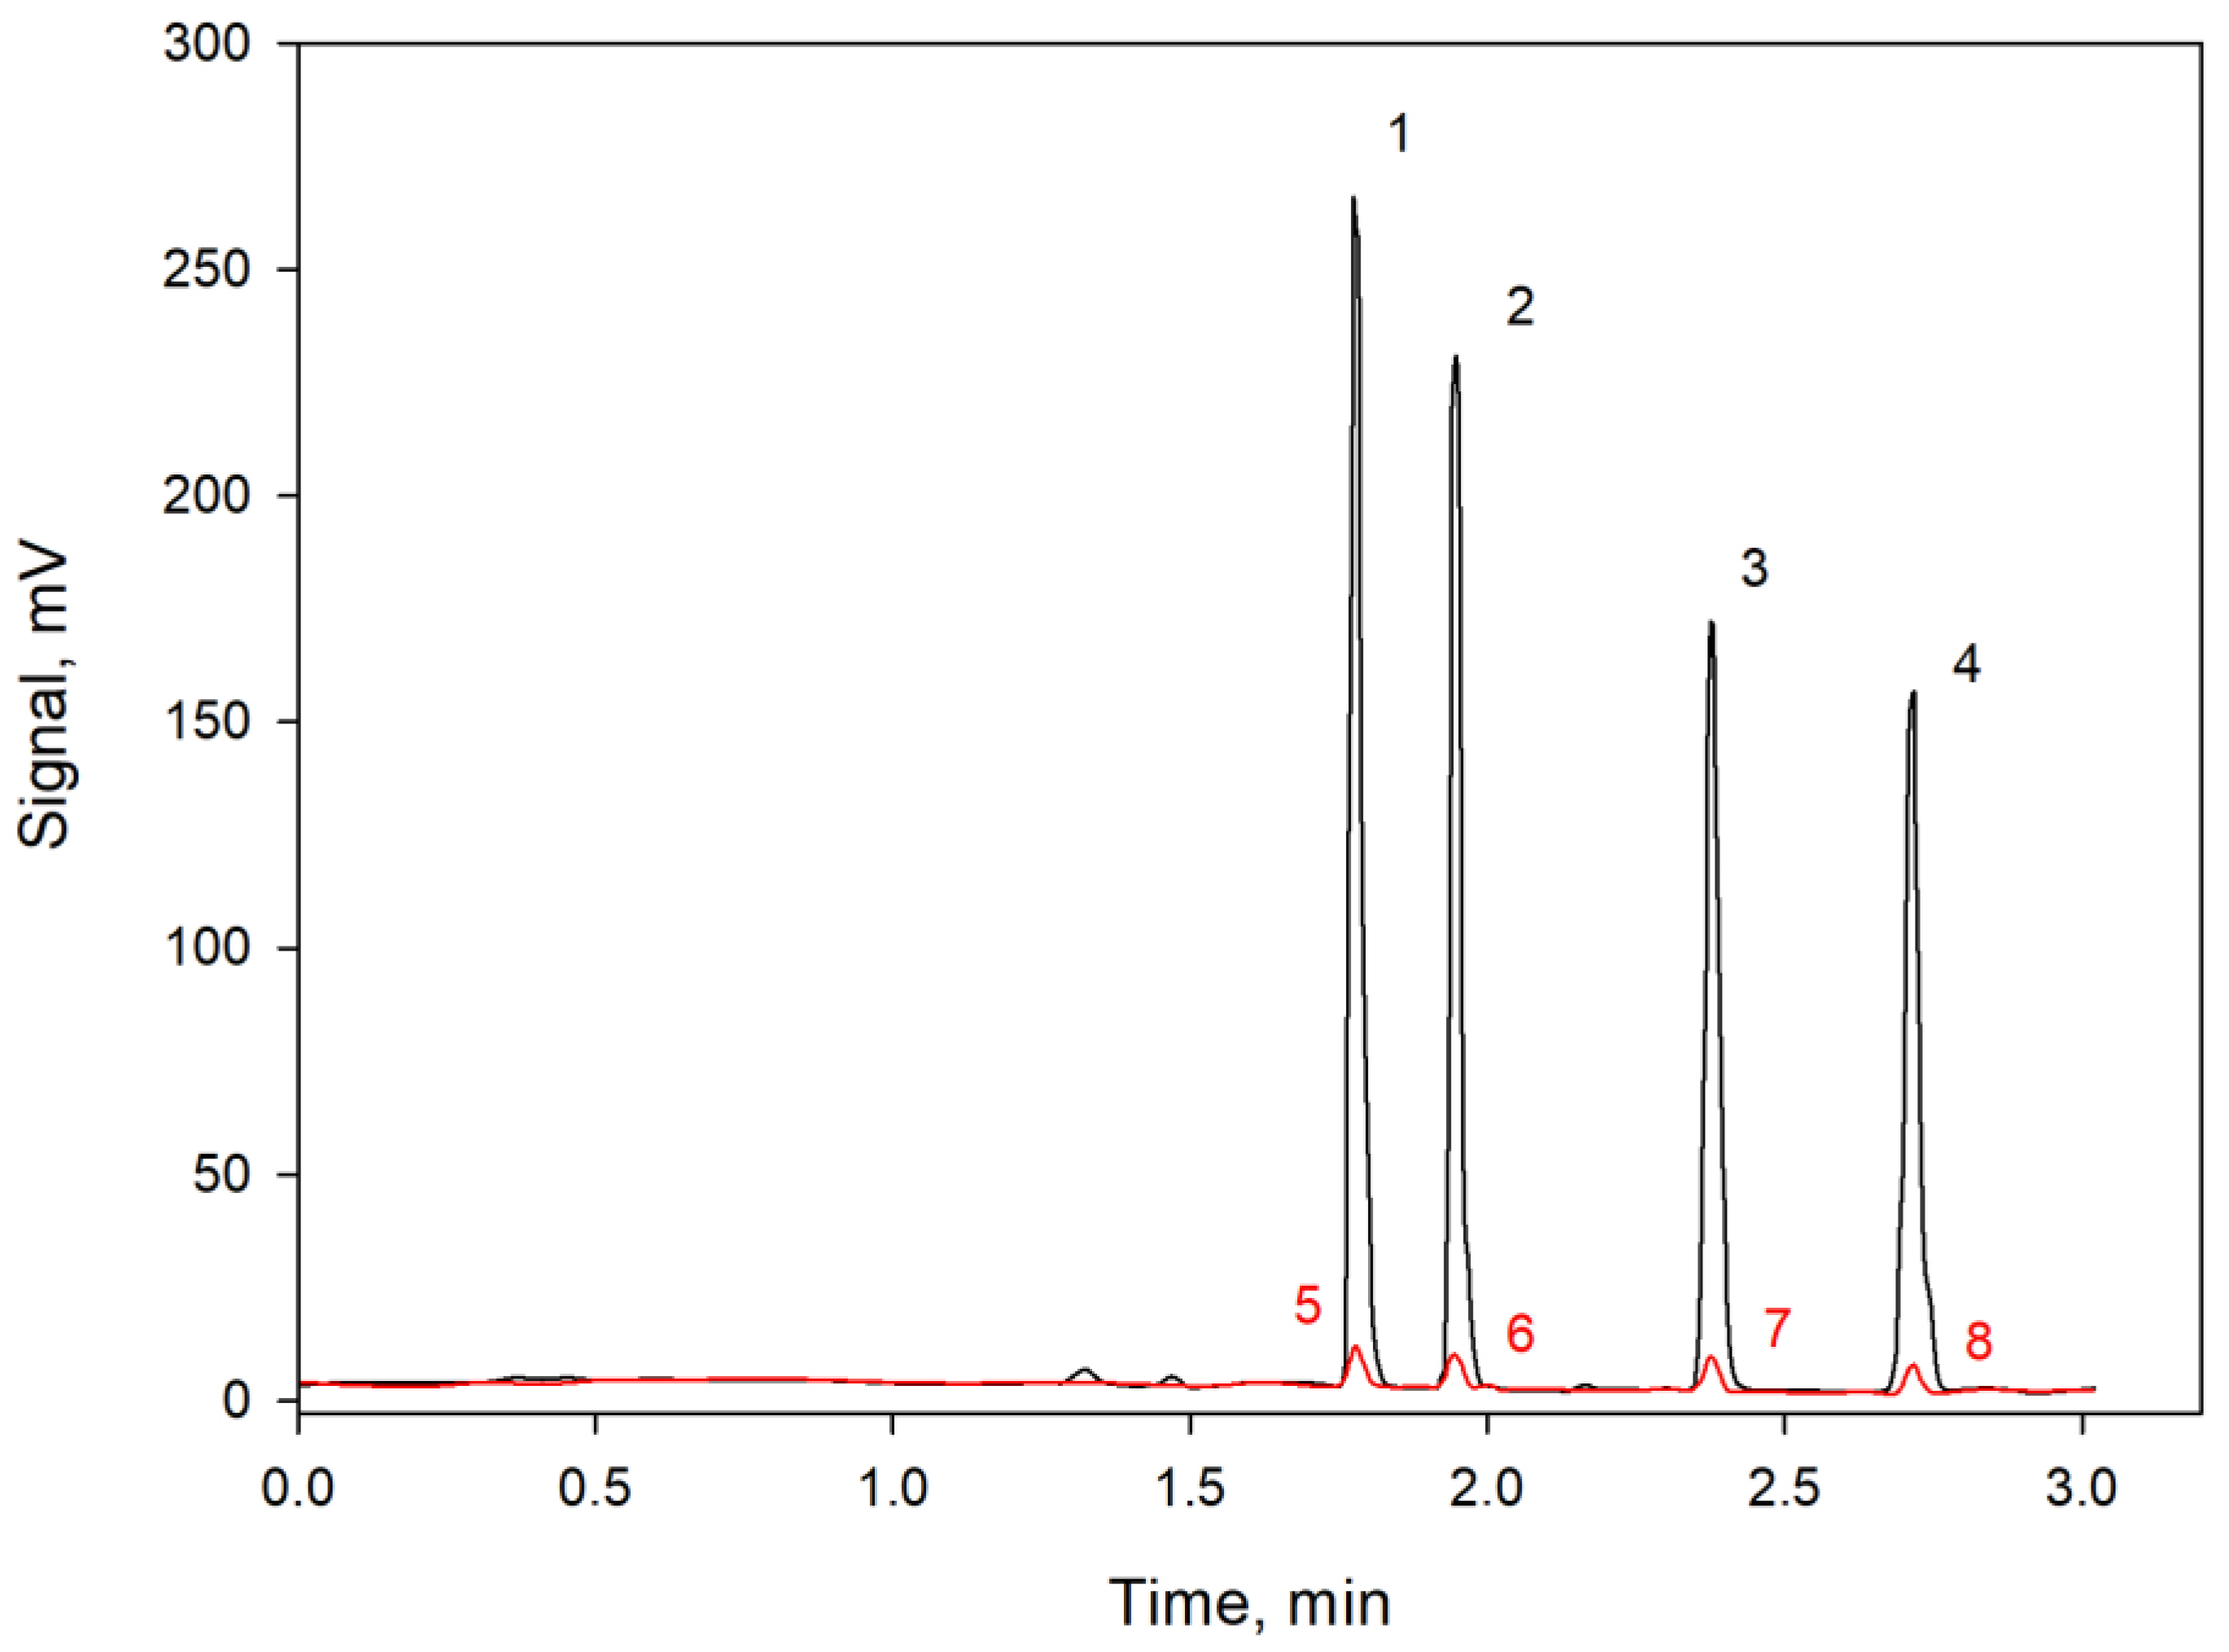
A schematic diagram of the experimental setup used for dynamic HSA and absorption of the gas extractant is shown in Figure 1. A flow of carbon dioxide from a gas cylinder via a flow regulator (1) and a porous glass sparger (2) was passed through an aqueous solution of VOCs in the sample vessel (3) with a volume of 250 mL. The analyzed VOCs from the solution were transferred into a flow of the gas extractant according to their partition coefficients and passed via a switching valve (6) into an absorber tube (7) (120 × 14 mm ID) packed with sodium hydroxide granules (18 g) with a particle size ranging between 2 and 5 mm. The choice of this particle size range was defined by the necessity of having a uniform package of absorbing cartridges and the permeability sufficient for passing carbon dioxide at high flow rates. The absorbing cartridge was installed in the GC line where a gas sample loop is usually placed. After passing through a certain volume of the gas extractant, the sample valve was switched into the “inject” position as marked by the dotted lines in Figure 1, left. Meanwhile, a flow of the carrier gas (nitrogen) (8) transferred the VOCs concentrated in the absorbing cartridge into the GC instrument (9). The gas sparger (2) improved the mass transfer and efficiency of the gas extraction process by increasing the gas–liquid interphase area.
A scheme of the experimental setup used for continuous chromatomembrane HSA with the absorption of the gas extractant is shown in Figure 1, right. The excessive pressure of the carrier gas (nitrogen) was adjusted by the pressure regulator (1) and applied to the gas phase in the sample vessel (3) pushing an analyzed solution into the chromatomembrane cell (5). Simultaneously, a flow of the gas extractant (carbon dioxide) adjusted by the flow regulator (4) was also delivered into the chromatomembrane cell. Then, the flow of gas extractant containing extracted analytes came through the switching valve (6) into the absorbing cartridge (7) packed with sodium hydroxide. After this point, the same procedures were performed similarly to the scheme of dynamic HAS shown in Figure 1, left.
The chromatomembrane cell used in this work contained a 9 cm × 6 cm × 2 cm biporous PTFE parallelepiped as an extracting element. The aqueous phase flow entered through a 9 cm × 2 cm cross-section, which was perpendicular to the direction of the gas-phase flow through a 9 cm × 6 cm cross-section
In both versions of HSA, the dependence of peak heights and peak areas was studied as a function of the time of pass flow of carbon dioxide, as the gas extractant, through the absorber column packed with sodium hydroxide. The analysis was carried out using a gas chromatograph Crystal-5000.2 (Chromatec, Yoshkar-Ola, Russia) equipped with FID and a 6-way injection valve for gas samples. A separation column (2 m × 3 mm ID) packed with Chromaton N-AW (60–80 mesh) coated with 5% OV-17 and a fused silica capillary column (10 m × 0.53 mm × 2.65 μm) coated with 100% dimethylpolysiloxane were used. The temperatures of the packed column and the fused silica capillary column were 100 and 70 °C, respectively, and the temperature of the detector was 160 °C. The flow rate of the gas carrier through the packed column was 20 mL/min. The Chromateck-Analytik 3 software complex was used for data acquisition and processing.

3. Discussion

As the results of the study showed, the absorbing cartridge packed with granular sodium hydroxide removed carbon dioxide from the gas phase, while hydrocarbons, which do not have acid properties, were not absorbed by alkali and stayed in the gas phase. The experimentally obtained dependences of the relative peak heights of benzene and toluene and the passage time of carbon dioxide from the solution (by dynamic HSA) through the absorbing cartridge are given in Figure 2. The peak height of the analyte after passing carbon dioxide through the absorbing cartridge for 15 s was taken as a unit of measurement.
As shown in Figure 2, there was an increase in the peak heights of the analytes directly proportional to the passage time of carbon dioxide within the first two minutes. Then, the growth slowed down and practically stopped after 3 min. The increase in the slowing down of the peak area occurred simultaneously with the continuous, quick absorption of carbon dioxide and stopped before the capacity of the absorbing cartridge ran out, which was equal to approximately 10 L, according to the stoichiometry of the chemical reaction. Apart from this, the time when this slowing down begins depends on the carbon dioxide flow rate. The absorbing cartridge should be replaced and repacked when carbon dioxide absorption declines, which occurs after passing approximately 3 L of carbon dioxide. Both factors prove the negative effect of longitudinal diffusion on the elution profile of the analytes out of the absorption tube. This diffusion is known to be dependent on neither the absorber capacity toward carbon dioxide nor its flow rate at the column inlet.
For the determination of aromatic hydrocarbons having distribution coefficients between the water and gas phases much higher than one (Table 1), the method chosen of carrying out gas-phase extraction is not essential. We revealed that the analyte concentration in a flow of the gas extractant in the cases of both dynamic and chromatomembrane extractions remains constant for a long time and corresponds to an equilibrium saturation of the gas extractant with the analyte. For aliphatic hydrocarbons having distribution coefficients significantly less than one, a sharp decrease in the analyte concentration during the passing of the gas-extractant through the immobilized solution was observed for dynamic gas-phase extraction. This finding explains the declines in curves 3 and 4 after 2 min shown in Figure 3.
In contrast, in the case of the chromatomembrane version, the gas-extractant flow was always in contact with fresh portions of the solution, which enabled the analytes to be extracted into a smaller volume of the gas extractant and enhanced the sensitivity of HSA. Figure 3 is an illustration of this conclusion, showing the dependencies of the peak heights of n-hexane and n-heptane compared during the passage time of the gas-extractant flow (30 mL/min) with regard to dynamic HSA (curves 3 and 4) and chromatomembrane HSA (curves 1 and 2) with the passing of the aqueous phase sample through the chromatomembrane cell at a rate of 30 mL/min.
To demonstrate the advantages of the proposed HSA version, the gas chromatograms of aromatic hydrocarbons were obtained with and without selective absorption of the gas extractant. Figure 4 shows that the HSA version with the selective absorption of gas extractant provided a three-fold increase in sensitivity for GC determination of benzene and toluene using a packed column. A more profound positive effect of the application of the proposed method was obtained for the determination of alkanes by capillary GC. According to Figure 5, the selective absorption of the gas extractant resulted in a 10-fold increase in chromatographic peak heights. Two GC systems were tested to show the suitability of the bulky preconcentration scale (e.g., the sample vessels had a 250 mL volume). Clearly, a further decrease in limit of detection (LOD) values can be achieved with a more compact HSA system.
In HSA, the dependences of peak area on the concentration of analytes present linear plots with zero intercepts (Figure 6). As for dynamic HSA combined with capillary GC application, the calculated limits of detection (LODs), according to the 3σ rule, are 0.5 (0.05) μg/L for benzene, 0.6 (0.06) μg/L for toluene, 0.030 μg/L for n-hexane, and 0.035 μg/L for n-heptane. The values in brackets are approximate values for the mass spectrometry detector (MSD). According to the literature, when MSD was used in the case of benzene, the LOD was 0.2 μg / L for static HSA [34]; for HS-SPME, 0.04 μg/L [9]; and for P&T, 0.06 μg/L [9]. Thus, the sensitivity of the proposed method is not inferior to the most effective concentration methods. This method can be used to determine other analytes that do not interact with alkalis, for example, permanent gases dissolved in water (oxygen, nitrogen, hydrogen, helium, etc.). The relative standard deviation (RSD) for all analytes did not exceed 6% for a value of n = 5. Moreover, the sensitivity of this method is in line with the WHO guidelines and the Russian sanitary requirements [31,32,33].
Considering the strong dependence of distribution coefficients on temperature and the sample composition [29], the standard addition method should be used for quantitative analysis. This method is performed by recording the signals of the sample and of the sample with a known amount of standard addition. The result of the replicate measurement is calculated using the formula:
c = c a d V a d S V s ( S a d S )
where cad is the concentration of analyte in the solution of standard addition (mg/L); Vad is the volume of the solution of standard addition in the sample (mL); Vs is the sample volume, mL; S and Sad are the peak areas of analyte signals recorded for the original sample and the sample containing standard addition (mVs), respectively. The set of model solutions with known standard additions of benzene and toluene in the range from 10 to 500 μg/L was analyzed. We determined that the effect of systematic error was negligible.
In the case of aliphatic hydrocarbons, the standard addition method leads to significant bias. It is assumed that this is due to the very small distribution coefficients of the analytes and, consequently, their significant volatilization during the preparation of the solution.

4. Conclusions

A new method of headspace GC analysis was proposed with the selective absorption of the gas extractant. The analytical capability of the suggested method was illustrated by an example of the determination of aromatic and aliphatic hydrocarbons in aqueous solutions with the absorption of carbon dioxide as a gas extractant in a cartridge packed with dispersed sodium hydroxide. The proposed method of headspace analysis can be carried out both in the conventional dynamic gas-phase extraction mode by surging the gas extractant through the liquid sample, and in the chromatomembrane mode of this process by continuous passage of flows of the gas extractant and the liquid sample through the chromatomembrane cell. A further enhancement in the sensitivity of the HSA method is connected to the optimization of conditions and using smaller absorption cartridges for the absorption of the gas- extractant.

Author Contributions

Conceptualization, O.V.R., P.N.N. and L.N.M.; methodology, O.V.R. and P.N.N.; software, A.Y.P.; validation, A.S.B. and A.Y.P.; formal analysis, O.V.R. and P.N.N.; investigation, A.S.B. and A.Y.P.; resources, A.S.B.; data curation, O.V.R. and P.N.N.; writing—original draft preparation, O.V.R. and A.Y.P.; writing—review and editing, O.V.R. and A.S.B.; visualization, O.V.R. and A.S.B.; supervision, O.V.R., P.N.N. and L.N.M.; project administration, A.S.B. All authors have read and agreed to the published version of the manuscript.

Funding

This research received no external funding.

Data Availability Statement

Not applicable.

Conflicts of Interest

The authors declare no conflict of interest.

References

  1. Demestere, K.; De Wulf, J. Sample preparation for the analysis of volatile organic compounds in air and water matrices. J. Chromatogr. A 2007, 1153, 130–144. [Google Scholar] [CrossRef]
  2. Chen, Y.; Guo, Z.; Wang, X.; Qiu, C. Sample preparation. J. Chromatogr. A 2008, 1184, 191–219. [Google Scholar] [CrossRef]
  3. Chary, N.S.; Fernandez-Alba, A. Determination of volatile organic compounds in drinking and environmental waters. Trend Anal. Chem. 2012, 32, 60–75. [Google Scholar] [CrossRef]
  4. Antoniou, C.V.; Koukouraki, E.; Diamadopoulos, E. Determination of chlorinated volatile organic compounds in water and municipal wastewater using headspace-solid phase microextraction-gas chromatography. J. Chromatogr. A 2006, 1132, 310–314. [Google Scholar] [CrossRef] [PubMed]
  5. Cai, M.; Huang, P.; Zhang, M.; Li, W.-Q. A purge and trap gas chromatographic method for detection of chlorofluorocarbons in seawater. Chin. J. Anal. Chem. 2013, 41, 268–272. [Google Scholar] [CrossRef]
  6. Rodinkov, O.; Bugaichenko, A.; Moskvin, L. Static head space analysis and its status. J. Anal. Chem. 2020, 75, 1–17. [Google Scholar] [CrossRef]
  7. Diwan, A.; Singh, B.; Roychowdhury, T.; Yan, D.D.; Tedone, L.; Nesterenko, P.N.; Paull, B.; Sevy, E.T.; Shellie, R.A.; Kaykhaii, M.; et al. Porous, high capacity coatings for solid phase microextraction (SPME) by sputtering. Anal. Chem. 2016, 88, 1593–1600. [Google Scholar] [CrossRef]
  8. Lambropoulou, D.A.; Konstantinou, I.K.; Albanis, T.A. Recent developments in headspace microextraction techniques for the analysis of environmental contaminants in different matrices. J. Chromatogr. A 2007, 1152, 70–96. [Google Scholar] [CrossRef] [PubMed]
  9. Lara-Gonzalo, A.; Sanchez-Urıa, J.E.; Segovia-Garcıa, E.S.; Sanz-Medel, A.S. Critical comparison of automated purge and trap and solid-phase microextraction for routine determination of volatile organic compounds in drinking waters by GC-MS. Talanta 2008, 74, 1455–1462. [Google Scholar] [CrossRef]
  10. Herrington, J.; Gomez-Ríos, G.; Myers, C.; Stidsen, G.; Bell, D. Hunting molecules in complex matrices with SPME arrows: A review. Separations 2002, 7, 12. [Google Scholar] [CrossRef] [Green Version]
  11. Paiva, C.; Crucello, J.; Porto, N.; Hantao, L. Fundamentals of and recent advances in sorbent-based headspace extractions. TrAC-Trends Anal. Chem. 2021, 139, 116252. [Google Scholar] [CrossRef]
  12. Ueta, I.; Razaka, N.; Mizuguchia, A.; Kawakuboa, S.; Saitob, Y.; Jinno, K. Needle-type extraction device for the purge and trap analysis of 23 volatile organic compounds in tap water. J. Chromatogr. A 2013, 1317, 211–216. [Google Scholar] [CrossRef] [PubMed]
  13. Wojnowski, W.; Majchrzak, T.; Dymerski, T.; Gebicki, J.; Namiesnik, J. Dynamic headspace sampling as an initial step for sample preparation in chromatographic analysis. J. AOAC Inter. 2017, 100, 1599–1606. [Google Scholar] [CrossRef]
  14. Brown, M.A.; Miller, S.; Emmert, G.L. On-line purge and trap gas chromatography for monitoring of trihalomethanes in drinking water distribution systems. Anal. Chem. Acta 2007, 592, 154–161. [Google Scholar] [CrossRef] [PubMed]
  15. Saridara, C.; Brukh, R.; Mitra, S. Development of continuous on-line purge and trap analysis. J. Sep. Sci. 2006, 29, 446–454. [Google Scholar] [CrossRef]
  16. Auer, N.R.; Manzke, B.U.; Schulz-Bull, D.E. Development of a purge and trap continuous flow system for the stable carbon isotope analysis of volatile halogenated organic compounds in water. J. Chromatogr. 2006, 1131, 24–36. [Google Scholar] [CrossRef]
  17. Hyötyläinen, T. Principles, developments and applications of on-line coupling of extraction with chromatography. J. Chromatogr. A 2007, 1153, 14–28. [Google Scholar] [CrossRef]
  18. Hyötyläinen, T. On-line coupling of extraction with gas chromatography. J. Chromatogr. A 2008, 1186, 39–50. [Google Scholar] [CrossRef]
  19. Ramos, L. Critical overview of selected contemporary sample preparation techniques. J. Chromatogr. A 2012, 1221, 84–98. [Google Scholar] [CrossRef]
  20. Kenarsari, S.D.; Yang, D.; Jiang, G.; Zhang, S.; Wang, J.; Russell, A.G.; Wei, Q.; Fan, M. Review of recent advances in carbon dioxide separation and capture. RSC Adv. 2013, 3, 22739–22773. [Google Scholar] [CrossRef]
  21. Li, H.; Zhan, H.; Fu, S.; Liu, M.; Chai, X.-S. Rapid determination of methanol in black liquors by full evaporation headspace gas chromatography. J. Chromatogr. A 2007, 1175, 133–136. [Google Scholar] [CrossRef]
  22. Rodinkov, O.V.; Zhuravljova, G.A.; Vaskova, E.A.; Platonov, I.A. Potassium fluoride as a selective moisture trapping agent for SPE-TD-GC-FID determination of volatile organic compounds in air. Anal. Methods 2015, 7, 458–465. [Google Scholar] [CrossRef]
  23. Jewell, L.L.; Davis, B.H. Review of absorption and adsorption in the hydrogen-palladium system. Appl. Catal. A Gen. 2006, 310, 1–15. [Google Scholar] [CrossRef]
  24. Fiorini, D.; Boarelli, M.C. Solid-phase microextraction may catalize hydrogenation when using hydrogen as carrier in gas chromatography. J. Chromatogr. A 2016, 1453, 134–137. [Google Scholar] [CrossRef] [PubMed]
  25. Kianpour, M.; Sobati, M.; Shahhosseini, S. Experimental and modeling of CO2 capture by dry sodium hydroxide carbonation. Chem. Eng. Res. Design 2012, 90, 2041–2050. [Google Scholar] [CrossRef]
  26. Moskvin, L.N.; Rodinkov, O.V. Continuous chromatomembrane headspace analysis. J. Chromatogr. A 1996, 725, 351–359. [Google Scholar] [CrossRef]
  27. Moskvin, L.N.; Rodinkov, O.V.; Moskvin, A.L.; Spivakovskii, V.; Vlasov, A.Y.; Bugaichenko, A.S.; Samokhin, A.S.; Nesterenko, P.N. Chromatomembrane preconcentration of phenols using a new 3D printed microflow cell followed by reversed-phase HPLC determination. J. Sep. Sci. 2021, 44, 2449–2456. [Google Scholar] [CrossRef]
  28. Lide, D.R. (Ed.) Aqueous Solubility and Henry’s Law Constants of Organic Compounds. In CRC Handbook of Chemistry and Physics; Internet Version 2005; CRC Press: Boca Raton, FL, USA, 2005. [Google Scholar]
  29. Ioffe, B.V.; Vitenberg, A.G. Head-Space Analysis and Related Methods in Gas Chromatography; Wiley: New York, NY, USA, 1984. [Google Scholar]
  30. Lazarev, N.V.; Levina, E.N. Harmful substances in industry. In Handbook for Chemists, Engineers and Doctors; Organic Substances; Khimiya: Saint Petersburg, Russia, 1976; Volume 1. [Google Scholar]
  31. Toluene in drinking-water. In WHO Guidelines for Drinking-Water Quality; World Health Organization: Geneva, Switzerland, 2004.
  32. Benzene in drinking-water. In WHO Guidelines for Drinking-Water Quality; World Health Organization: Geneva, Switzerland, 2003.
  33. GN 2.1.5.2280-07; Maximum Allowable Concentrations (MAC) of Chemical Substances in Water of Water Objects of Domestic and General Water Use; Hygiene Standards: Moscow, Russia, 2008.
  34. Golfinopoulos, S.K.; Lekkas, T.D.; Nikolaou, A.D. Comparison of methods for determination of volatile organic compounds in drinking water. Chemosphere 2001, 45, 275–284. [Google Scholar] [CrossRef]
Figure 1. Schematic diagrams of the experimental setup used for dynamic HSA (left) and for continuous chromatomembrane HSA (right) with absorption of the gas extractant in both cases. 1: carrier gas flow regulator; 2: gas sparger; 3: sample vessel with an aqueous solution of VOCs; 4: gas-extractant flow regulator; 5: chromatomembrane cell; 6: switching valve; 7: CO2 absorbing cartridge; 8: inlet for the carrier gas; 9: gas chromatograph.
Separations 09 00015 g001
Figure 2. Dependencies of peak heights of toluene (1, 3) and benzene (2, 4) in dynamic HSA obtained for a series of model solutions at flow rates of 15 mL/min (3, 4) and 30 mL/min (1, 2).
Separations 09 00015 g002
Figure 3. Dependencies of peak heights of n-heptane (2, 4) and n-hexane (1, 3) on the passing time of the gas-extractant (30 mL/min) through aqueous solution in the case of chromatomembrane (1, 2) and dynamic HSA (3, 4).
Separations 09 00015 g003
Figure 4. GC determination of benzene (1, 3) and toluene (2, 4) in a model solution (5 mg/L) with preconcentration by a selective adsorption of the gas-extractant (1, 2) and without it (3, 4). CO2 flow rate—30 mL/min, time—2 min. Separation column—Chromaton N-AW (60–80 mesh) coated with 5% OV-17.
Separations 09 00015 g004
Figure 5. Gas chromatograms obtained with capillary GC column used for the determination of n-hexane (1, 5), benzene (2, 6), n-heptane (3, 7) and toluene (4, 8) in a model solution after preconcentration via selective adsorption of the gas-extractant (1, 2, 3, 4) and without it (5, 6, 7, 8). Concentrations of n-hexane and n-heptane—0.2 mg/L; benzene and toluene—5 mg/L. CO2 flow rate—30 mL/min, time—2 min. Fused silica column with dimethylpolysiloxane coating.
Separations 09 00015 g005
Figure 6. Peak area of dependencies on preconcentrations of aliphatic (A) and aromatic (B) hydrocarbons found by using dynamic gas extraction combined with capillary GC. 1—benzene, 2—toluene, 3—n-hexane, and 4—n-heptane.
Separations 09 00015 g006
Table 1. Characteristics of analytes.
AnalyteBoiling
Temperature, °C [28]
Solubility
in Water (25 °C),
g/L [28]
K 1, at 25 °C [29,30]Maximum Allowable in Water, μg/L
WHO [31,32]Russia [33]
Benzene80.11.784.0 [29]101.0
Toluene110.60.5313.6 [29]70024
n-Hexane69.00.110.021 [30] -
n-Heptane98.40.0240.019 [30] -
1K—distribution coefficient is defined as the ratio of analyte concentrations in the aqueous and gas phases.
Publisher’s Note: MDPI stays neutral with regard to jurisdictional claims in published maps and institutional affiliations.

