Article

Steam and Pressure Management for the Conversion of Steelworks Arising Gases to H2 with CO2 Capture by Stepwise Technology

1
Sustainable Technologies for Industrial Processes (STIP), Netherlands Organization for Applied Scientific Research (TNO), P.O. Box 1, 1755 ZG Petten, The Netherlands
2
Swerim AB, P.O. Box 812, 97125 Luleå, Sweden
*
Author to whom correspondence should be addressed.
Separations 2022, 9(1), 20; https://doi.org/10.3390/separations9010020
Submission received: 26 November 2021 / Revised: 19 December 2021 / Accepted: 23 December 2021 / Published: 17 January 2022
(This article belongs to the Special Issue Adsorption Based Reactive-Separation Processes)

Abstract

:
Steel production is a main source of CO2 emissions globally. These emissions must be drastically reduced to meet climate change mitigation goals. STEPWISE is a Sorption Enhanced Reactive Process (SERP) technology that converts steel works arising gases to H2 with simultaneous CO2 capture. The main energy requirements of the process are the high- and low-pressure steam quantities that are needed to rinse and regenerate the adsorbent. In this simulation study, the separation performance of STEPWISE is evaluated over a range of steam and feed pressure inputs by searching those design points where CO2 recovery and purity percentages are equalized. This method is used to facilitate the comparison of different operating regimes. Results highlight the importance of the rinse to purge ratio (R/P) as a design variable. A higher R/P ratio is demonstrated to maintain CO2 recovery and purity of ~95.5%, while total steam consumption and feed carbon loading are reduced by 27% and 20%, respectively. This is achieved without changing other parameters, like cycle time. Additionally, it is demonstrated that the CO2 capture performance can be maintained for varying feed pressure values by tuning the feed carbon loading. Future studies are recommended to focus on the expected role of the feed gas steam content on these findings.

1. Introduction

Anthropogenic emission of carbon species is projected to disrupt the Earth’s climate over the coming decades. Carbon Capture and Storage (CCS) is thereby gaining importance as a strategy to prevent carbon emissions from reaching the atmosphere. This is particularly relevant for those industrial sectors that can hardly avoid the use of carbon, like steel making. In this context, sorption-enhanced reactive processes (SERPs) are receiving increasing attention as strategic technologies to accelerate CCS implementation in such industrial sectors [1,2,3,4]. SERPs are integrated conversion/separation processes that achieve a greater product yield from equilibrium-limited reactions by adsorbing one of the product species on a solid surface [5].
Gas adsorption is a well-established industrial process for the separation and purification of gases [1,5,6,7,8,9]. It is widely applied, as an example, to separate H2 and O2, respectively, from natural gas reformate and air [6,8,9]. During an adsorption process, a gas species, or adsorbate, is selectively transferred to a solid surface. Subsequently, this gas species is recovered by regenerating the solid material, or sorbent. Regeneration can be achieved by heating the sorbent to higher temperatures or by lowering the adsorbate partial pressures [9,10].
Various SERP concepts have been proposed and investigated for the conversion of methane- or syngas-like mixtures to H2, with simultaneous capture of CO2 [11,12,13,14,15,16]. Among these processes, the sorption-enhanced water gas shift (SEWGS) process shows significant potential to capture CO2 with low costs and energy penalties [4,13]. In the SEWGS process, CO2 is selectively adsorbed to shift the thermodynamic equilibrium of the water gas shift reaction (WGS) towards the production of H2 Equation (1).
CO + H 2 O CO 2 + H 2     Δ H = 41   kJ / mol
The implementation of SEWGS as pre-combustion capture technology has been assessed on the treatment of coal and natural gas-derived syngas for the production of electricity or hydrogen. More recently, the conversion of carbon-rich steelworks arising gases to a low-carbon hydrogen fuel gas has been more intensively investigated [15,17,18,19,20,21,22].
As carbon dioxide emissions from iron and steel making are considered to be among the hardest to abate [2,23], SEWGS development is rapidly moving towards higher technology readiness levels (TRL) in this field of use [14,24,25]. In the recently concluded H2020 STEPWISE project, a SEWGS process was developed and piloted at TRL 6 for the treatment of blast furnace gas (BFG). In the STEPWISE pilot, a single column pilot reactor can be exposed up to 800 Nm3/h of BFG, which is directly supplied from the SSAB blast furnace in Luleå, Sweden [14]. More recently, the STEPWISE pilot has been used to demonstrate the production of methanol from its BFG-derived H2 and CO2 streams in the H2020 FReSMe project [26]. Further pilot campaigns at TRL 6 are planned as part of the currently on-going H2020 C4U project [27], and plans for the construction of a first multi-columns pilot have begun as part of the H2020 INITIATE project [25].
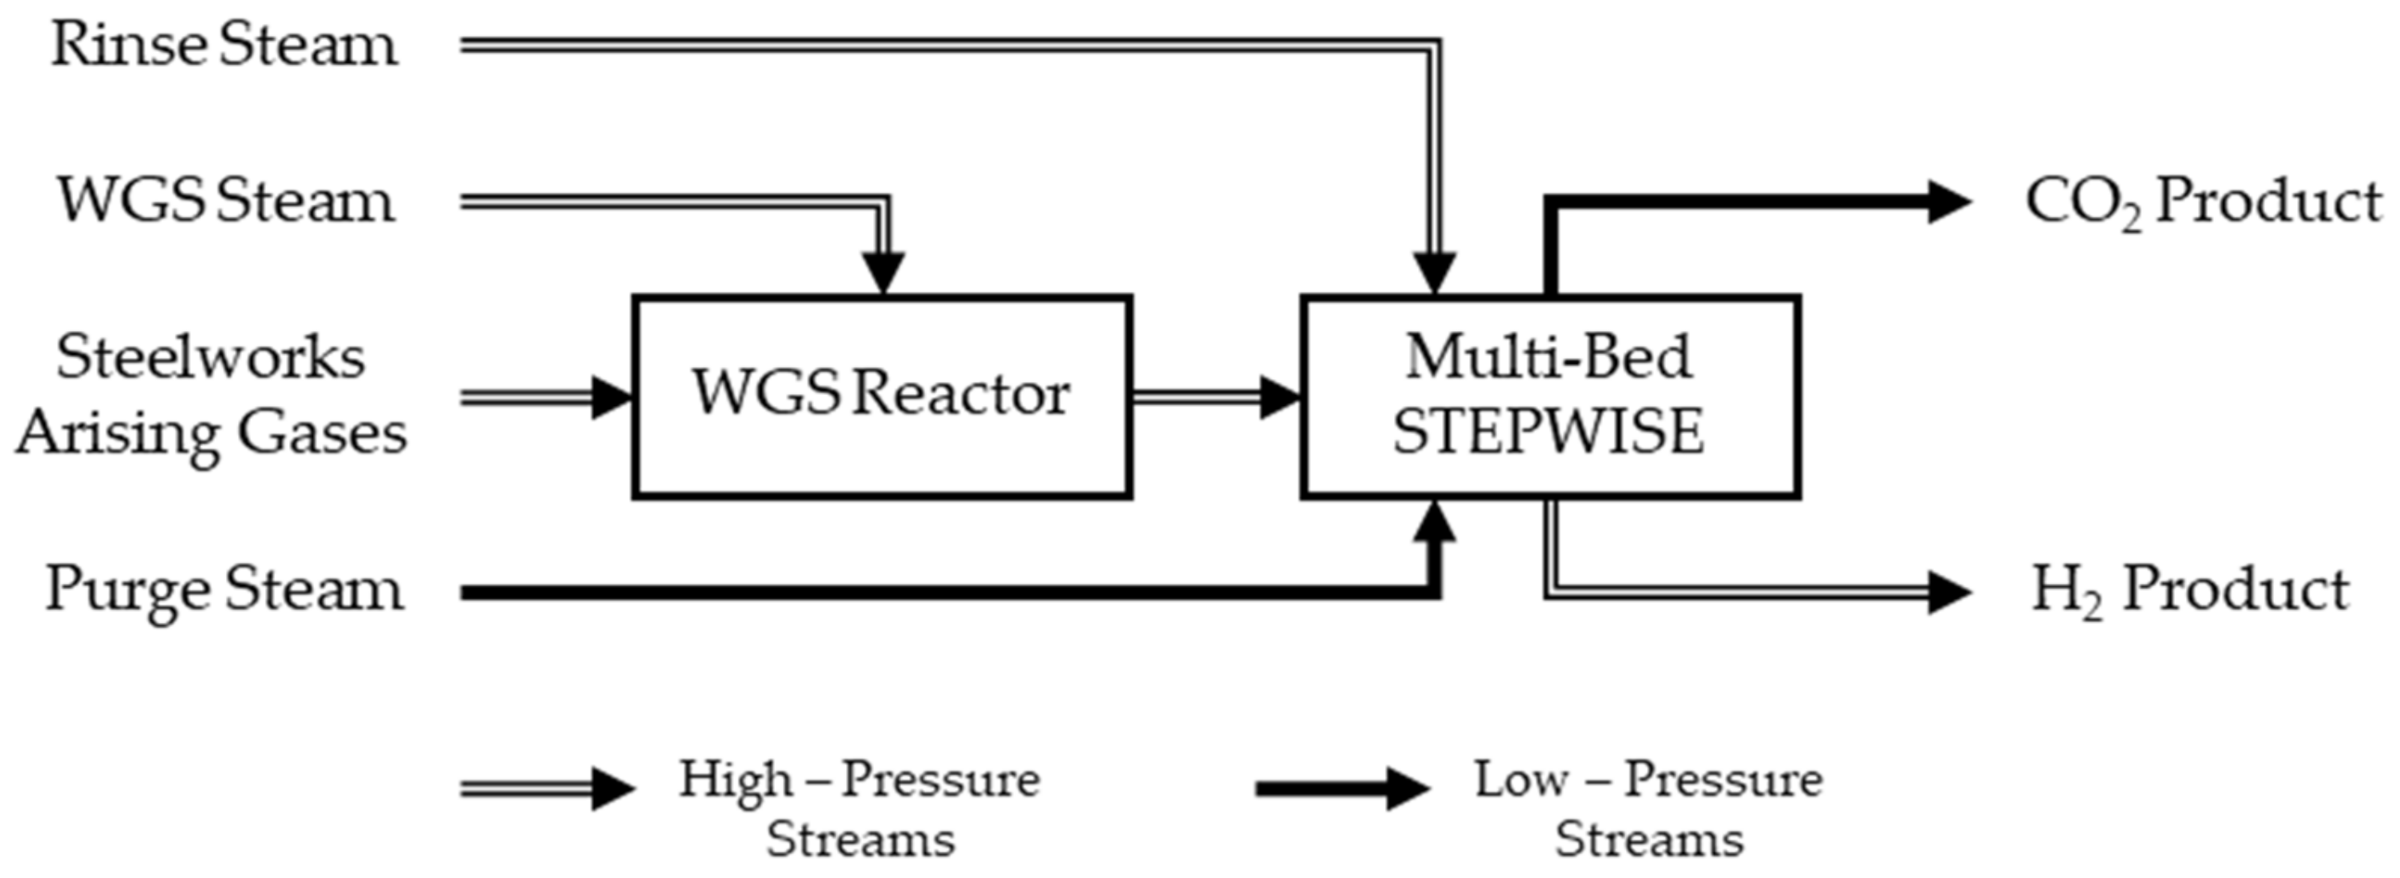
Essentially, when industrially relevant scales are considered, STEPWISE is designed to work as a multi-bed pressure swing adsorption (PSA)-like technology, as illustrated in Figure 1 [14,19]. The STEPWISE reactive columns are packed with a potassium-promoted hydrotalcite-based (K-HTC) CO2 sorbent. This functions at temperatures between 300 and 550 °C [14]. Hydrotalcites are especially interesting as SEWGS sorbents due to their good hydrothermal stability, high selectivity towards CO2 adsorption, fast sorption kinetics, and stable cyclic performances [12,13,28,29,30,31,32]. Furthermore, hydrotalcites are catalytically active towards CO conversion by WGS reaction and allow the simultaneous co-adsorption of acid gases [33].
In a typical STEPWISE multi-bed layout, an initial single stage WGS reactor (pre WGS) converts part of the incoming CO. Deep conversion of CO is not required, thereby avoiding multiple reactive and intercooling stages [14]. High-pressure (HP) steam is supplied as a reactant to the pre-WGS. Additional HP steam is added to the STEPWISE unit to increase the sharpenss of the CO2 separation by rinsing the sorbent with a steam front [12,34,35,36]. Low-pressure (LP) steam is used as purging agent to regenerate the sorbent and recover the CO2 product at low pressures [12]. Both the rinse and purge steam amounts are usually expressed in relation to the amount of carbon fed (i.e., CO and CO2) through steam-to-carbon ratios (S/C) [12,24,35,36,37].
Generally, for any given pre-shifted feed gas composition, the main process parameters of STEPWISE include the following: (1) sorbent bed properties (bed void fraction, particle size, particle porosity, density); (2) reactor column sizes (length and diameter); (3) temperature and pressure conditions; and (4) amount of carbon fed as CO and CO2, which we express here in terms of gas-hourly-space-velocity (GHSVc) and (5) S/C ratios.
In addition to these process parameters, a Skarstrom cycle needs to be designed [38]. This is essentially a pre-programmed sequence of steps, which allows to operate semi-batch PSA-like processes on a continuous mode [5,9,10,39]. Cycle steps, such pressure equalizations (PEQs), rinse, and blow down (BD), which are valid for the STEPWISE technologies, are described extensively by previous authors [12,35,36,37]. The parallel optimization of the Skarstrom cycle, or cycle design, and the process parameters is central to achieve high separation performances at low processing costs for STEPWISE, as for any other PSA-like technology [5,8,9,39].

1.1. Optimization of SEWGS Based Processes via Computer Simulations

Typically, the optimal design of PSA technologies aims to (1) maximize separation performances (i.e., product recovery and purity); (2) optimize energy performances; and (3) minimize processing costs [40]. When PSA physical models are used, this results in a mixed nonlinear integer optimization problem with partial differential and algebraic equation (PDAE) integration. The use of accurate physical models to conduct this optimization is thereby known to be computationally expensive and intricated. However, this is also more suited to generate new process knowledge in contrast to reduced order models [39,41,42,43,44].
When physical models are used, the main challenge is to optimize both process parameters, like pressure and steam inputs, and the cycle design. Different approaches are available to deal with this challenge. Some authors make use of process superstructures [45,46]. Others fix either the process parameters or the cycle design [47,48,49,50]. Alternatively, the problem complexity is reduced by solving ideal single column cycles. These cycles do not meet multi-bed schedule constrains and do not account for the required number of columns or idle times. However, the study of ideal single column cycles is found useful to generate process insights at the initial stage of the design. This approach is taken by Casas (2013) and Streb (2020), as an example, to highlight the effects of process parameters and individual step times on capture performances [51,52,53].
Concerning SEWGS optimization, the necessity of generating new process knowledge has driven different authors to focus mostly on using physical models to execute parametric sensitivities with pre-specified cycle designs [12,24,35,36,37]. First, Reijers et al. (2011) conducted a parametric sensitivity on cycle time, feed flow rate, and purge and rinse steam flows, with a fixed six-column cycle design, including one feed co-current pressure equalization, feed countercurrent rinse, feed countercurrent blow down, feed-countercurrent repressurization with partial recycle of the light H2 product, and an idle step [37]. An alternative eight-column cycle was studied by Boon et al. (2015). This cycle presents three feed countercurrent PEQs, feed-co-current rinse, and no idle steps in comparison to Reijers’s one [12]. A single-column full PDAE model is implemented on MATLAB and used to analyze separation performances over varying total cycle time, rinse, and purge steam flow amounts. The same cycle but with three feed co-current PEQs and feed countercurrent rinse steps is studied by Jansen et al. (2011), analyzing SEWGS separation performances for different purge and rinse flows [24].
As pointed out by Boon et al. (2015), Reijers observed that carbon purity (CP) and carbon capture ratio (CCR) rise proportionally with the supplied rinse and purge steam amounts although with reducing gain after a certain point. However, it is not possible simultaneously to increase both CCR and CP by modifying only one variable, as CP drops with higher purge as well as CCR with higher rinse [12]. Only under specific regimes, CP may also rise with a higher purge input [12]. According to Boon et al. (2015), CP is strongly influenced by the progression of the CO2 front during the adsorption step [12]. In most cases, a higher purge amount will cause the bed to be more deeply regenerated at the beginning of adsorption step. A cleaner bed will then further reduce the CO2 front progression, and consequently the CP [12].
More recently, Najmi et al. (2016) studied a multi-train configuration, including two trains of eight columns [36]. In that work, both feed flow rate and steam inputs are varied with a fixed cycle design. Interestingly, it is concluded that a modification of the rinse and purge steam inputs is not sufficient by itself to maintain CO2 recovery and purity unchanged, while feed flow rate is varied. Accordingly, it is indicated that the duration of the adsorption step should be changed as well. This new duration is needed to compensate for the varying progression of the CO2 front during the adsorption step. However, following the influence of the purge steam input on the progression of the CO2 front that was inferred by Boon et al. (2015), it shall be possible to retain separation performances without necessarily changing the cycle time as well.

1.2. Aim of This Work

In this study, we expand the work of previous authors on the role of the rinse and purge steam amounts to achieve high separation performance by SEWGS with hydrotalcite-based sorbents. An investigation on the effect of the adsorption pressure is also added. Specifically, we aim to show the influence of the selected process parameters (rinse steam, purge steam, and adsorption pressure) over the progression and shape of the CO2 front over different cycle steps. This is done to demonstrate the retention of high separation performances at different feed carbon loads.

2. Materials and Methods

2.1. Parametric Approach

A systematic parametric approach is devised to analyze the STEPWISE separation performance at different feed pressure and steam inputs (Figure 2). The parametric approach comprises two steps: (1) a basis of design step, where an ideal single column schedule with null idle times is fixed, together with other basic process parameters and bed properties; and (2) a process parameters optimization step, whereby parametric sensitivities are conducted to achieve evaluate separation performances.
Separation performances are measured with Carbon Capture Ratio (CCR) and Carbon Purity (CP) indicators, as defined in Equations (2) and (3). Process parameters are systematically varied in order to find operating points whereby CCR and CP are (almost) equal. These points lie on the diagonal of a CCR/CP Pareto chart and are referred as Pareto diagonal solutions or diagonal solutions.
The systematic identification of diagonal solutions is proposed as a method to rapidly evaluate different sets of process parameters in terms of separation performances. Essentially, the solution space order is reduced by combining CO2 recovery and purity into a single indicator. For each set of parameters, diagonal solutions are then searched by tuning the feed carbon loading, which is expressed as carbon gas hourly space velocity (GHSVc) and is defined in Equation (10).
Although the diagonal solutions do not necessarily match those optimum solutions that best compromise between CCR and CP, maximize efficiency, or minimize costs, this approach is proposed to facilitate the identification and comparison of different operating points. It is therefore used to highlight how the studied parameters affect capture performances rather than to find their optimal design values.
Additionally, in order to show the trade-off between system throughput and energy consumption, the system is re-parametrized in terms of S/C variations. Instead of the conventional study of system performance in terms of S/Cr and S/Cp [12,24,35,36,37,54], a new variable is introduced to systematically track rinse and purge steam distribution at a fix total steam consumption. This is called the rinse-to-purge ratio (R/P), and it is defined according to Equation (8). It is important to realize that rinse and purge steam have different pressure qualities. This difference is not highlighted in the results of this study, as the aim is to highlight the process influence of steam inputs and carbon load on separation performance.
Since we intend to focus on studying the steam and pressure role on the reactor performances, individual step times and cycle time are not parametrized. This is done to facilitate a broad mapping of the studied parameters. Therefore, only ideal single-column capture performances are presented, while the required number of columns or idle times are not determined.

2.2. Basic Assumptions

The assumed STEPWISE column characteristics are presented in Table 1. Two steelworks arising gases (SAG) mixtures are used to define the inlet gas specifications of the pre WGS reactor (Table 2). Based on these two mixtures, four different inlet compositions are derived to conduct STEPWISE simulations (Table 3). Compositions are named with letters.
STEPWISE feed compositions are obtained from the respective SAG mixtures with Aspen Plus software. Specifically, the pre WGS reactor is modelled with an adiabatic Gibbs reactor block. Inlet temperature is fixed at 340 °C, while different shift intensities are assumed by using steam to CO ratios (S/CO) from 1.5 to 1.9 at pre WGS inlet. The Peng Robinson equation of states (EOS) is used to conduct these calculations. The pressure value is fixed at the desired inlet pressure of the STEPWISE reactor, as outlined in Table 1.
Composition A is derived from a mixture of blast furnace gas (BFG) and basic oxygen furnace gas (BOFG). This mixture is computed using the availability and composition of these gases, as specified by Hooey et al. (2013) [55]. The same shift intensity is used for all cases with this composition. Concerning compositions B′, B″, and B‴, composition values are obtained for different shift intensities, driven by different steam-to-carbon-monoxide (S/CO) inputs at the simulated pressure levels.
Concerning cycle design, the assumed ideal single-column cycle structure with zero idle times is depicted in Figure 3. In terms of steps, this is equivalent to the structure that is proposed by Boon et al. (2015) [12]. The cycle includes adsorption and rinse steps at the same high-pressure level. The rinse step is co-current with the feed. Subsequently, three co-current pressure equalization steps occur, to be followed by countercurrent blow-down and purge steps. Column pressure is then increased countercurrently with the pressure equalization products. At last, repressurization is conducted with a partial reflux of light H2 product. Total cycle time is kept unchanged to evaluate S/C ratios and adsorption pressure performances. As mentioned earlier, individual step times variations to minimize number of columns and meet multi-bed scheduling constraints are outside the scope of this work.

2.3. Parametric Studies

Three parametric studies were conducted. These are summarized in Table 4 by showing the respective manipulated variables. Each study correspond to a series of STEPWISE simulations.
In the first study, GHSVc was kept constant, as done in some previous works [12,24,37], while R/P ratio and total steam consumptions were varied.
In a second study, GHSVc was systematically varied, trying to achieve the pareto diagonal solution for different R/P ratios and total steam consumption, according to the proposed methodology. Some simulations were conducted on the feed composition B′, which was derived from a pure pre-shifted BOFG.
Finally, pressure variations were similarly analyzed in a third study on both BFG/BOFG and pure BOFG derived gases. Pressure and GHSVc are reported with dimensionless figures (i.e., PF in Equation (9) and GHSVr in Equation (11)) by using the reference values that are reported in Table 5.

2.4. Models

A STEPWISE column mathematical model was developed and implemented in MATLAB. This model is largely based on the previously presented SEWGS model by Boon et al. (2015) [12,56]. Specifically, it includes:
  • Continuity, momentum, energy, and species balances;
  • WGS reaction kinetics and equilibrium relationships;
  • Adsorption and desorption kinetics represented by linear driving force (LDF) method;
  • CO2-H2O dual interaction model with the K-HTC sorbent, which includes multi-site adsorption and nanopore condensation effects, as described by Coenen et al. (2017) and Boon et al. (2015), respectively [32,57];
  • Heat or reaction and heat of adsorption formulations [12];
  • Valve equations;
  • Pressure drop factor by Ergun approximation;
  • Ideal gas law equation of states (EOS);
  • Gas physical property models, including gaseous species’ heat conductivity, specific heat capacity, diffusivity, viscosity, and density relationships;
  • Axial dispersion; and
  • Bed to wall radial heat transfer coefficient.
The resulting set of PDAE was solved numerically. Equations were discretized over the time and space according to the method of lines. Space discretization included a combination of upwind, central difference, and Barton schemes, as outlined by Boon et al. (2015) [56]. Time integration as achieved with a first-order Euler scheme. Uniform grids of 200 and 50 points were used, respectively, for space and time.
A cycle routine was added to the column model. The routine can sequentially simulate the various steps of an ideal single-column cycle by varying flow directions and boundary conditions, according to a prespecified cycle structure. Consequently, the model solution includes all relevant column transient profiles over time and space for each cycle step.

2.5. Definitions

Throughout this study, the following definitions apply:
CCR = CO 2 CO 2 P CO Feed + CO 2 Feed
CP = y CO 2 CO 2 P 1 y H 2 O CO 2 P
S / C t = H 2 O R + H 2 O P CO Feed + CO 2 Feed
S / C r = H 2 O R CO Feed + CO 2 Feed
S / C p = H 2 O P CO Feed + CO 2 Feed
S / CO = H 2 O Feed CO Feed
R / P = S / C r S / C p
PF = P P 0
GHSVc   = CO Feed + CO 2 Feed V Bed
GHSV r = GHSVc GHSV 0

3. Results and Discussion

3.1. Study 1: Steam to Carbon Variations at Constant GHSVc

CCR and CP of this first study are shown in Figure 4. These are computed for different S/C ratios at constant GHSVc., using composition A. Higher CP values are achieved by growing the S/Cr at constant GHSVc and S/Ct. CCR conversely reduces. These trends are observed at both S/Ct of 0.8 and 1.1, and it is consistent with previous work on SEWGS optimization [12,24,37].
During the rinse step, the further addition of HP steam results on a greater removal of other gas species, thereby improving the CP. The HP steam increases the removal of impurities in two ways. First, it advances the CO2 front progression by volumetric expansion. Secondly, it partially adsorbs near the column entrance by displacing part of the pre-loaded CO2, according to the so called roll-up or roll-over effect [9,12]. The displaced CO2 gets adsorbed towards the end of column, effectively concentrating impurities near the H2 product side [12]. This improves the separation sharpness. However, the purge steam is reduced in order to keep a constant S/Ct. This reduction leads to a lower CO2 recovery. The R/P ratio cannot thereby improve both CCR and CP when it is the only modified parameter.
When the S/Ct is increased by mean of higher S/Cp, the CCR improves at every simulated point. This is because the greater amount of purge steam is more effective in recovery the CO2, as observed by other authors and presented in Figure 5d–h [12,24,37]. Conversely, the CP does not grow. Specifically, it drops from 97.47 to 96.95% at S/Cr of 0.3, while it is substantially unchanged at 94.45%, when the S/Cr is fixed at 0.2. This CP reduction is caused by a reduced progression of the CO2 front during the adsorption and rinse steps. The reduced progressions of these fronts are shown in Figure 5a–c and Figure 5b–d, for a S/Cr of 0.2. Accordingly, a greater fraction of impurities is then found in the column before the blow-down step (Figure 5c–g).
However, the CO2 front progression and width of the mass transfer zone (MTZ) do not vary significantly with a higher S/Ct, when both S/Cr and S/Cp are both changed, as shown in Figure 6a–e. The adsorptive rinse becomes actually more pronounced when the rinse-to-purge ratio (R/P) grows together with the S/Ct (Figure 6b–f). This leads to a greater progression of the CO2 front during the rinse step, even with a higher S/Cp value. Consequently, a reduced cumulative fraction of impurities is found at the end of the third PEQ step (Figure 6c–g). The CP is thereby enhanced to ~97%. Additionally, the CCR is also improved by the greater recovery of CO2 during the purge step (Figure 6d–h). Therefore, it can be concluded that higher CCR and CP can be attained by manipulating simultaneously the R/P and S/Ct ratios.

3.2. Study 2: Steam to Carbon Variations at Different GHSVc

3.2.1. Results with Composition A

Figure 7 illustrates the obtained separation performances with simultaneous S/C and GHSVc variations. Pareto lines are generated by varying the GHSVc for different steam inputs. In most cases, the diagonal solution lies on a CP constrained branch. Here, CP is less sensitive than CCR to the GHSVc. However, the slope of the pareto line rises as the R/P ratio increases. Therefore, CP sensitivity grows higher, while CCR sensitivity reduces. This is observed for both S/Ct values, with a stronger effect at the higher values. As such, the R/P ratio is found to effectively determine CCR and CP sensitivities near the diagonal solution.
In Figure 8a–c, GHSVc, CCR, and CP are re-plotted in relation to their respective S/Cr input values at constant S/Ct. The diagonal solution (i.e., the point where CCR = CP) rises with increasing S/Cr, or R/P, while the GHSVc reduces. This points out a trade-off between separation performance and throughput. A higher R/P ratio improves CO2 separation at the expense of carbon loading without incurring in a higher total steam demand.
This observation implies that separation performance may be retained at a new GHSVc by manipulating the steam supply and its R/P ratio. This is demonstrated in Figure 9, where two operating points from Figure 8 are compared. These points, namely point I and II, differ in terms of GHSVc but show a comparable separation performance. Point II exhibits a lower GHSVc than point I, specifically by 20%. However, the separation performances remain close at ~95.5%. Only the supplied steam amounts are modified. Specifically, the R/P ratio is increased by ~5.4 times, from 0.11 to 0.60, while the S/Ct drops from 1.1 to 0.8. The retention of the separation performance is thereby achieved without changing any other process or cycle parameter, such as cycle time, as indicated by other authors [36].
Typically, a lower GHSVc reduces the progression of the CO2 front during the adsorption step, improving the CCR at the expenses of CP [36,58]. However, by manipulating the R/P and S/Ct simultaneously, these effects can be balanced. As shown in Figure 10a–e, point II maintains a comparable CO2 front progression to point I regardless of lower GHSVc. Two factors determine this similarity, namely the greater rinse and reduced purge effectiveness of point II. In Figure 10b–f, point II shows a more intensive desorptive rinse than point I. The inlet H2O displaces a greater amount of CO2, while the CO2 slip is simultaneously reduced. This leads to a higher CCR and supports a greater progression of the CO2 front before pressure gets reduced. Additionally, it determines a greater CO2 gas fraction at the start of the blow down step, improving the CP (Figure 10c–g). However, the reduced purge intensity leaves a greater amount of CO2 in the column at the end of the regeneration step (Figure 10e–h). Although this causes both CCR and CP to reduce, it also contributes to maintain a high progression of the MTZ in the adsorption step.
In conclusion, a point with higher R/P at a lower S/Ct shows a more effective rinse but a less effective purge step. The more effective rinse increases the available CO2 fraction at the beginning of the blow-down step, further advances the CO2 front during the rinse step, and reduces the rinse induced CO2 slip. The less effective purge reduces the recovered CO2 during the purge step but supports a deeper progression of the CO2 front in the adsorption step. It is therefore possible to achieve the same separation performance at a different GHSVc by careful tuning of these effects.

3.2.2. Results for Composition F

Figure 8c also illustrates the simulation results with composition B′ and a S/Ct of 1.1. This new composition has almost double the inlet steam content of composition A, namely 29.9%mol (Table 3). Given a constant R/P ratio, composition B′ achieves a higher separation performance than composition A but lower GHSVc. This is highlighted by comparing point I and III in both Figure 8 and Figure 9. Specifically, a R/P ratio of 0.1 corresponds to separation performances of ~95% and ~97%, respectively, with composition A (point I) and B′ (point III). The feed steam content appears, therefore, to reproduce the same effects of the R/P. A superior separation performance is achieved with higher inlet steam content at the same steam consumption but with reduced GHSVc. This indicates a similar dependency of separation performances to both the inlet steam content and the R/P. Consequently, the R/P ratio offers an approach to balance changes in inlet steam content, as for GHSVc, without changing other parameters.

3.3. Study 3: Adsorption Pressure Variations at Different GHSVc

Feed pressure is expected to influence both the separation performance and throughput of a STEPWISE cycle. These influences are demonstrated in Figure 11. Here, diagonal separation performance and GHSVc are presented for different feed pressure values. A dimensionless pressure factor (PF) is used on the x axis, as defined in Equation (9). An attempt is made to reach the diagonal solution at each pressure level by varying the GHSVc. Results are shown for those two steelworks arising gas mixtures that are outlined in Table 2. A slightly different composition is fed to the STEPWISE column at each pressure level of the purge BOFG treatment case, according to values in Table 3. These compositions (i.e., B′, B″, and B‴) are determined by WGS equilibrium calculations at varying shift intensity (i.e., S/CO).
Both the separation performance and the GHSVc show a peak over the studied pressure range considering the BOFG/BFG derived composition (A, Table 3). However, the GHSVc is somewhat underestimated at a PF of 2. On this point, CP is still slightly larger than the CCR. Thus, it may not be definitely excluded by a steadily increasing GHSVc trend.
Considering BOFG-derived mixtures (B′, B″ and B‴ Table 3), some separation performances are still relatively distant from their respective diagonal solutions. It is therefore harder to conclude on the performance trends in this case. Nevertheless, a higher inlet steam content appears to always improve the separation performance at the expenses of the GHSVc. This could be confirmed as a different inlet steam content is shown to similarly modify diagonal performances at all pressure values. To this end, a better approximation of the diagonal solution is required than in Figure 11b.
Focusing on the BFG/BOFG case, the feed gas density drops significantly at low PF values. This causes a proportional growth of the inlet superficial velocity. A broader MTZ is thereby established during the adsorption step (Figure 12). The CO2 front progression also reduces, as lower carbon loading (i.e., GHSVc) is needed at the respective diagonal solutions. A broader MTZ limits the diagonal GHSVc value since CO2 breakthrough is more rapidly achieved. Therefore, a higher pressure improves both the width and progression of the MTZ, thereby increasing the diagonal GHSVc.
Separation performance would also be expected to grow steadily with pressure, as both width and progression of the MTZ are improved. However, the separation performance is found to reduce after a PF of ~0.8. This is determined by the increasing CO2 initial concentration towards the H2 product side of the bed. This can be clearly seen at a PF of 1.46 and 2.08, respectively, in Figure 12e and Figure 12f. This effect is typically called CO2 cross-over, referring to the countercurrent transport of CO2 across columns during the pressure equalization steps. When CO2 cross-over occurs, the CCR drops before any CO2 breakthrough is observed due to the pre-loaded CO2 gas.
In addition to CO2 cross-over, the rinse expansion grows with pressure, as shown in Figure 13. Therefore, the rinse-induced CO2 slip increases with pressure, further reducing the CCR. In conclusions, the increasing efficiency of the adsorption step is at some point outbalanced by the rising rinse-induced CO2 slip and cross-over effects. As such, the existence of an optimum diagonal CCR value over pressure is explained.
Next to the CCR, the diagonal CP trend is also explained. First, the increasing rinse front progression and cross-over extent are reason behind a CP growth. Additionally, the adsorptive rinse intensity is found to initially rise with pressure. A more intense adsorptive rinse corresponds to sharper and deeper CO2 roll over towards the H2 product side of the bed. Accordingly, the cumulative fraction of gaseous impurities at the end of the third PEQ step is minimized (Figure 14). However, the displaced amount of CO2 appears to peak at a PF of 0.50 (Figure 13c). Beyond this value, CO2 displacement reduces, growing the cumulative fraction of impurities. Therefore, a trade off exists between the CO2 displacement intensity and the rinse front progression over pressure.
At a PF of 0.5, the displacement is maximized, but the CO2 fraction before blow down is still limited by the confined progression of the rinse front. A PF of 0.75 enhances sufficiently the rinse front progression without excessively reducing the adsorptive rinse effectiveness. In conclusion, a feed pressure optimum exists among the Pareto diagonal solutions. This is the point that best compromise between rinse front progression, adsorptive rinse, and cross-over intensities.
The location of this optimum can be influenced by cycle design or process parameters selection. However, key insights on the optimization of the design itself have been found that have practical relevance. As shown in Figure 11a, the diagonal solution is essentially unchanged at more than 96%, when feed pressure reduces from 24 to 18. This is obtained by simultaneously reducing the GHSVc. Smaller and less energy-intensive feed gas compression can be accordingly implemented at the same separation performance. This pressure reduction will bring cost savings when its effect exceeds the reduced system capacity that follows a smaller GHSVc. More generally, capture performance above 90% is achieved over a broad range of pressure values (from 12 to 50 bar). This highlights the robustness of the STEPWISE technology and design flexibility from a process integration perspective.

4. Conclusions

In this work, we studied the steam and pressure requirements to achieve high CO2 purity and recovery with the STEPWISE technology. Reactor performances were evaluated via numerical simulations and structured parametric sensitivities. These were executed over a range of S/C and pressure input values. For each set of input parameters, the diagonal Pareto solution (i.e., CCR = CP) was searched by varying the inlet carbon loading (i.e., GHSVc).
The use of HP rinse and LP purge steam amounts are confirmed to increase the flexibility of STEPWISE in achieving deep CO2 separation. Higher CCR and CP were directly obtained by increasing simultaneously the R/P and S/Ct ratios. The diagonal solution was maintained at ~95% even when carbon loading was decreased by 20%. This was achieved by increasing the R/P ratio, while the S/Ct was reduced from 1.1 to 0.8. The combination of a higher R/P ratio with a lower S/Ct improved the rinse effectiveness at the expense of a less-performing purge. These effects balance the reduced CO2 front progression that follows a lower GHSVc, as shown by column concentration profiles. Therefore, steam consumption and throughput can be traded off by tuning the R/P ratio while keeping all other parameters unchanged, including cycle time. It is important that future energy and economic optimization consider the R/P parameter, including the different quality of these two stem inputs.
As the adsorption pressure increases, larger GHSVc are found at the diagonal separation performances. During the adsorption step, a higher pressure improves both the width and progression of the MTZ, thereby improving the GHSVc. Conversely, an optimum pressure value was found where the Pareto diagonal solution peaks. This is the point that best compromises between rinse front progression, adsorptive rinse, and cross-over intensities. The peaking shape of the diagonal solutions over pressure implies that milder feed gas compression can be implemented by reducing the GHSVc, while the separation performance is retained. As capture performance above 90% is achieved over a broad range of pressure values (from 12 to 50 bar), STEPWISE could be adapted to fit process integration schemes that minimize the processing costs of different applications.
A superior separation performance was also achieved with a higher inlet steam content. This change comes with a reduction of the GHSVc, and it appears to be valid over a range of feed pressure values. Consequently, optimal R/P ratio and feed pressure values can be expected to depend on the initially available HP steam within the feed gas. This shall be more extensively investigated in future studies, together with the impact of different cycle structures (e.g., number of PEQ, type and number of refluxes).

Author Contributions

Conceptualization, F.S.; data curation, L.L. and M.S.; investigation, F.S., L.L. and M.S.; methodology, F.S. and J.J.; project administration, J.A.Z.P.; software, L.L. and M.S.; supervision, J.A.Z.P.; writing—original draft, F.S.; writing—review and editing, J.J., H.J.A.E.v.D., J.B. and P.C. All authors have read and agreed to the published version of the manuscript.

Funding

This research has received funding from the European Union’s Horizon 2020 research and innovation programme under grant agreement No 727504, the FReSMe project, and from DETEC (CH), BMWi (DE), RVO (NL), Gassnova (NO), BEIS (UK), Gassco, Equinor, and Total in the ERANET ACT ELEGANCY, Project No 271498, which is co-funded by the European Commission under the Horizon 2020 programme, ACT Grant Agreement No. 691712.

Institutional Review Board Statement

Not Applicable.

Informed Consent Statement

Not Applicable.

Data Availability Statement

Data will be made available on request.

Conflicts of Interest

The authors declare no conflict of interest.

Abbreviations

BDBlow down
BOFGBasic oxygen furnace gas
BFGBlast furnace gas
EOSEquation of states
HPHigh pressure
LDFLinear driving force
LPLow pressure
MTZMass transfer zone
PDAEPartial differential algebraic equations
PEQPressure equalization
PSAPressure swing adsorption
REPRepressurization
SERPSorption enhanced reactive processes
SEWGSSorption Enhanced Water Gas Shift
WGSWater Gas Shift

Symbols

CCR%molCarbon Capture Ratio
CP%molCarbon Purity
GHSV0Nm3 h−1 m−3Reference feed gas hourly space velocity
GHSVcNm3 h−1 m−3Feed gas hourly space velocity
GHSVr(Nm3 h−1 m−3) (Nm3 h−1 m−3)−1Relative feed gas hourly space velocity
ymol mol−1Molar fraction
PbarTotal pressure
P0barReference pressure value
PFbar bar−1Pressure factor
R/PmolH2O molH2O−1Rinse to purge steam ratio
S/CrmolH2O molC−1Rinse steam to feed carbon ratio
S/CpmolH2O molC−1Purge steam to feed carbon ratio
S/CtmolH2O molC−1Total steam to feed carbon ratio
S/COmolH2O molCO−1Steam to CO ratio at WGS inlet

References

  1. Abanades, J.; Arias, B.; Lyngfelt, A.; Mattisson, T.; Wiley, D.; Li, H.; Ho, M.; Mangano, E.; Brandani, S. Emerging CO2 capture systems. Int. J. Greenh. Gas Control 2015, 40, 126–166. [Google Scholar] [CrossRef] [Green Version]
  2. Ramírez-Santos, Á.A.; Castel, C.; Favre, E. A review of gas separation technologies within emission reduction programs in the iron and steel sector: Current application and development perspectives. Sep. Purif. Technol. 2018, 194, 425–442. [Google Scholar] [CrossRef]
  3. Reijers, H.T.J.; Boon, J.; Elzinga, G.D.; Cobden, P.D.; Haije, W.G.; Brink, R.W.V.D. Modeling Study of the Sorption-Enhanced Reaction Process for CO2 Capture. II. Application to Steam-Methane Reforming. Ind. Eng. Chem. Res. 2009, 48, 6975–6982. [Google Scholar] [CrossRef] [Green Version]
  4. Zhu, X.; Li, S.; Shi, Y.; Cai, N. Recent advances in elevated-temperature pressure swing adsorption for carbon capture and hydrogen production. Prog. Energy Combust. Sci. 2019, 75, 100784. [Google Scholar] [CrossRef]
  5. Rodrigues, A.E.; Madeira, L.M.; Wu, Y.-J.; Faria, R. Sorption Enhanced Reaction Processes; World Scientific Publishing Co. Pte Ltd.: London, UK, 2017. [Google Scholar]
  6. Grande, C.A. Advances in Pressure Swing Adsorption for Gas Separation. ISRN Chem. Eng. 2012, 2012, 1–13. [Google Scholar] [CrossRef] [Green Version]
  7. Sircar, S. Pressure swing adsorption. Ind. Eng. Chem. Res. 2002, 41, 1389–1392. [Google Scholar]
  8. Sircar, S.; Golden, T.C. Pressure Swing Adsorption Technology for Hydrogen Production. In Hydrogen and Syngas Production and Purification Technologies; Liu, K., Song, C., Subramani, V., Eds.; John Wiley & Sons: New York, NY, USA, 2009; pp. 414–450. [Google Scholar] [CrossRef]
  9. Yang, R.T. Gas Separation by Adsorption Processes; Imperial College Press: London, UK, 1997. [Google Scholar]
  10. Ruthven, D.M. Principles of Adsorption and Adsorption Processes; John Wiley & Sons: New York, NY, USA, 1984. [Google Scholar]
  11. Hufton, J.R.; Mayorga, S.; Sircar, S. Sorption-enhanced reaction process for hydrogen production. AIChE J. 1999, 45, 248–256. [Google Scholar] [CrossRef]
  12. Boon, J.; Cobden, P.; van Dijk, H.; Annaland, M.V.S. High-temperature pressure swing adsorption cycle design for sorption-enhanced water–gas shift. Chem. Eng. Sci. 2015, 122, 219–231. [Google Scholar] [CrossRef] [Green Version]
  13. Boon, J.; Coenen, K.; Dijk, E.; Cobden, P.; Gallucci, F.; Annaland, M. Sorption-Enhanced Water–Gas Shift. Adv. Chem. Eng. 2017, 51, 1–96. [Google Scholar]
  14. van Dijk, H.; Cobden, P.; Lundqvist, M.; Cormos, C.; Watson, M.; Manzolini, G.; van der Veer, S.; Mancuso, L.; Johns, J.; Sundelin, B. Cost Effective CO2 Reduction in the Iron & Steel Industry by Means of the SEWGS Technology: STEPWISE Project. Energy Procedia 2017, 114, 6256–6265. [Google Scholar] [CrossRef] [Green Version]
  15. Walspurger, S.; Boon, J.; Peper, S.; Cobden, P.; van Dijk, E.; Overwater, K. Process Intensification is the Key to CO2 Emission Abatement: Options for Steam Reforming to Hydrogen. In Proceedings of the 10th European Congress of Chemical Engineering, Nice, France, 27 September 2015. [Google Scholar]
  16. Xiu, G.-H.; Li, P.; Rodrigues, A.E. Sorption-enhanced reaction process with reactive regeneration. Chem. Eng. Sci. 2002, 57, 3893–3908. [Google Scholar] [CrossRef]
  17. Gazzani, M.; Macchi, E.; Manzolini, G. CO2 capture in integrated gasification combined cycle with SEWGS—Part A: Thermodynamic performances. Fuel 2013, 105, 206–219. [Google Scholar] [CrossRef]
  18. Gazzani, M.; Macchi, E.; Manzolini, G. CO2 capture in natural gas combined cycle with SEWGS. Part A: Thermodynamic performances. Int. J. Greenh. Gas Control 2013, 12, 493–501. [Google Scholar] [CrossRef]
  19. Manzolini, G.; Giuffrida, A.; Cobden, P.; van Dijk, H.; Ruggeri, F.; Consonni, F. Techno-economic assessment of SEWGS technology when applied to integrated steel-plant for CO2 emission mitigation. Int. J. Greenh. Gas Control 2020, 94, 102935. [Google Scholar] [CrossRef]
  20. Manzolini, G.; Macchi, E.; Gazzani, M. CO2 capture in Integrated Gasification Combined Cycle with SEWGS—Part B: Economic assessment. Fuel 2013, 105, 220–227. [Google Scholar] [CrossRef]
  21. Manzolini, G.; Macchi, E.; Gazzani, M. CO2 capture in natural gas combined cycle with SEWGS. Part B: Economic assessment. Int. J. Greenh. Gas Control 2013, 12, 502–509. [Google Scholar] [CrossRef]
  22. Petrescu, L.; Chisalita, D.-A.; Cormos, C.-C.; Manzolini, G.; Cobden, P.; Van Dijk, H.A.J. Life Cycle Assessment of SEWGS Technology Applied to Integrated Steel Plants. Sustainability 2019, 11, 1825. [Google Scholar] [CrossRef] [Green Version]
  23. De Pee, A.; Pinner, D.; Roelofsen, O.; Somers, K.; Speelman, E.; Witteveen, M. Decarbonization of Industrial Sectors: The Next Frontier; McKinsey Global Institute: New York, NY, USA, 2018; Volume 66, Available online: https://www.mckinsey.com/~/media/mckinsey/business%20functions/sustainability/our%20insights/how%20industry%20can%20move%20toward%20a%20low%20carbon%20future/decarbonization-of-industrial-sectors-the-next-frontier.pdf (accessed on 20 November 2021).
  24. Jansen, D.; van Selow, E.; Cobden, P.; Manzolini, G.; Macchi, E.; Gazzani, M.; Blom, R.; Henriksen, P.P.; Beavis, R.; Wright, A. SEWGS Technology is Now Ready for Scale-up! Energy Procedia 2013, 37, 2265–2273. [Google Scholar] [CrossRef] [Green Version]
  25. INITIATE Project, Press Release: “Valorising Emissions from Steel Making into Sustainable Products”. 2020. Available online: https://www.initiate-project.eu (accessed on 20 November 2021).
  26. FReSMe Project, Press Release: “Major Milestone Achieved: We Are Already Producing Methanol from Residual Steel Gases”. 2020. Available online: http://www.fresme.eu (accessed on 20 November 2021).
  27. Climate Strategies, C4U Project, Press Release: “EU Invests €13.8m into State of the Art Carbon Dioxide CAPTURE Technology”. 2020. Available online: https://climatestrategies.org (accessed on 20 November 2021).
  28. Oliveira, E.; Grande, C.; Rodrigues, A.E. CO2 sorption on hydrotalcite and alkali-modified (K and Cs) hydrotalcites at high temperatures. Sep. Purif. Technol. 2008, 62, 137–147. [Google Scholar] [CrossRef]
  29. Yong, Z.; Mata, A.V.; Rodrigues, A. Adsorption of Carbon Dioxide onto Hydrotalcite-like Compounds (HTlcs) at High Temperatures. Ind. Eng. Chem. Res. 2001, 40, 204–209. [Google Scholar] [CrossRef]
  30. Yong, Z.; Mata, V.; Rodrigues, A.E. Adsorption of carbon dioxide at high temperature—A review. Sep. Purif. Technol. 2002, 26, 195–205. [Google Scholar] [CrossRef]
  31. van Selow, E.; Cobden, P.; Wright, A.; Brink, R.V.D.; Jansen, D. Improved sorbent for the sorption-enhanced water-gas shift process. Energy Procedia 2011, 4, 1090–1095. [Google Scholar] [CrossRef] [Green Version]
  32. Coenen, K.; Gallucci, F.; Pio, G.; Cobden, P.; van Dijk, E.; Hensen, E.; Annaland, M.V.S. On the influence of steam on the CO2 chemisorption capacity of a hydrotalcite-based adsorbent for SEWGS applications. Chem. Eng. J. 2017, 314, 554–569. [Google Scholar] [CrossRef]
  33. van Dijk, H.; Walspurger, S.; Cobden, P.; Brink, R.V.D.; de Vos, F. Testing of hydrotalcite-based sorbents for CO2 and H2S capture for use in sorption enhanced water gas shift. Int. J. Greenh. Gas Control 2011, 5, 505–511. [Google Scholar] [CrossRef]
  34. Choi, W.-K.; Kwon, T.-I.; Yeo, Y.-K.; Lee, H.; Song, H.K.; Na, B.-K. Optimal operation of the pressure swing adsorption (PSA) process for CO2 recovery. Korean J. Chem. Eng. 2003, 20, 617–623. [Google Scholar] [CrossRef]
  35. Zhu, X.; Shi, Y.; Li, S.; Cai, N. Two-train elevated-temperature pressure swing adsorption for high-purity hydrogen production. Appl. Energy 2018, 229, 1061–1071. [Google Scholar] [CrossRef]
  36. Najmi, B.; Bolland, O.; Colombo, K.E. A systematic approach to the modeling and simulation of a Sorption Enhanced Water Gas Shift (SEWGS) process for CO2 capture. Sep. Purif. Technol. 2016, 157, 80–92. [Google Scholar] [CrossRef]
  37. Reijers, R.; van Selow, E.; Cobden, P.; Boon, J.; Brink, R.V.D. SEWGS process cycle optimization. Energy Procedia 2011, 4, 1155–1161. [Google Scholar] [CrossRef] [Green Version]
  38. Skarstrom, C.W. Method and Apparatus for Fractionating Gaseous Mixtures by Adsorption. U.S. Patent 2,944,627, 12 July 1960. [Google Scholar]
  39. Wang, Y.; Dowling, A.W.; Krieft, C.; Walther, A.; Biegler, L.T. Pressure Swing Adsorption Optimization Strategies for CO2 Capture. In Computer Aided Chemical Engineering; Elsevier: Amsterdam, The Netherlands, 2015; pp. 197–223. [Google Scholar]
  40. Biegler, L.T.; Jiang, L.; Fox, V.G. Recent Advances in Simulation and Optimal Design of Pressure Swing Adsorption Systems. Sep. Purif. Rev. 2005, 33, 1–39. [Google Scholar] [CrossRef]
  41. Agarwal, A.; Biegler, L.T. A trust-region framework for constrained optimization using reduced order modeling. Optim. Eng. 2011, 14, 3–35. [Google Scholar] [CrossRef]
  42. Pai, K.N.; Prasad, V.; Rajendran, A. Experimentally validated machine learning frameworks for accelerated prediction of cyclic steady state and optimization of pressure swing adsorption processes. Sep. Purif. Technol. 2020, 241, 116651. [Google Scholar] [CrossRef]
  43. Subraveti, S.G.; Li, Z.; Prasad, V.; Rajendran, A. Machine Learning-Based Multiobjective Optimization of Pressure Swing Adsorption. Ind. Eng. Chem. Res. 2019, 58, 20412–20422. [Google Scholar] [CrossRef]
  44. Subraveti, S.G.; Pai, K.N.; Rajagopalan, A.K.; Wilkins, N.S.; Rajendran, A.; Jayaraman, A.; Alptekin, G. Cycle design and optimization of pressure swing adsorption cycles for pre-combustion CO2 capture. Appl. Energy 2019, 254, 113624. [Google Scholar] [CrossRef]
  45. Agarwal, A.; Biegler, L.T.; Zitney, S.E. Superstructure-Based Optimal Synthesis of Pressure Swing Adsorption Cycles for Precombustion CO2 Capture. Ind. Eng. Chem. Res. 2010, 49, 5066–5079. [Google Scholar] [CrossRef]
  46. Dowling, A.W.; Vetukuri, S.R.R.; Biegler, L.T. Large-scale optimization strategies for pressure swing adsorption cycle synthesis. AIChE J. 2012, 58, 3777–3791. [Google Scholar] [CrossRef]
  47. Liu, Z.; Grande, C.; Li, P.; Yu, J.; Rodrigues, A.E. Multi-bed Vacuum Pressure Swing Adsorption for carbon dioxide capture from flue gas. Sep. Purif. Technol. 2011, 81, 307–317. [Google Scholar] [CrossRef]
  48. Ribeiro, A.; Grande, C.; Lopes, F.; Loureiro, J.M.; Rodrigues, A.E. A parametric study of layered bed PSA for hydrogen purification. Chem. Eng. Sci. 2008, 63, 5258–5273. [Google Scholar] [CrossRef]
  49. Solares, R.A.A.; dos Santos, D.S.; Ingram, A.; Wood, J. Modelling and parameter estimation of breakthrough curves for amine-modified activated carbons under pre-combustion carbon capture conditions. Fuel 2019, 253, 1130–1139. [Google Scholar] [CrossRef]
  50. Solares, R.A.A.; Wood, J. A parametric study of process design and cycle configurations for pre-combustion PSA applied to NGCC power plants. Chem. Eng. Res. Des. 2020, 160, 141–153. [Google Scholar] [CrossRef]
  51. Casas, N.; Schell, J.; Joss, L.; Mazzotti, M. A parametric study of a PSA process for pre-combustion CO2 capture. Sep. Purif. Technol. 2013, 104, 183–192. [Google Scholar] [CrossRef]
  52. Streb, A.; Hefti, M.; Gazzani, M.; Mazzotti, M. Novel Adsorption Process for Co-Production of Hydrogen and CO2 from a Multicomponent Stream. Ind. Eng. Chem. Res. 2019, 58, 17489–17506. [Google Scholar] [CrossRef] [Green Version]
  53. Streb, A.; Mazzotti, M. Novel Adsorption Process for Co-Production of Hydrogen and CO2 from a Multicomponent Stream—Part 2: Application to Steam Methane Reforming and Autothermal Reforming Gases. Ind. Eng. Chem. Res. 2020, 59, 10093–10109. [Google Scholar] [CrossRef]
  54. Zhu, X.; Shi, Y.; Li, S.; Cai, N. Elevated temperature pressure swing adsorption process for reactive separation of CO/CO2 in H2-rich gas. Int. J. Hydrogen Energy 2018, 43, 13305–13317. [Google Scholar] [CrossRef]
  55. GHG, I. Iron and Steel CCS Study (Techno-Economics Integrated Steel Mill); IEA: Paris, France, 2013. [Google Scholar]
  56. Boon, J. High-Temperature Separation of Carbon Dioxide and Hydrogen by Sorption-Enhanced Water-Gas Shift and Palladium Membranes, Eindhoven University of Technology (TUE). 2016. Available online: https://research.tue.nl (accessed on 20 November 2021).
  57. Boon, J.; Cobden, P.D.; van Dijk, H.A.J.; Hoogland, C.; van Selow, E.R.; Annalan, M.v. Isotherm model for high-temperature, high-pressure adsorption of CO2 and H2O on K-promoted hydrotalcite. Chem. Eng. J. 2014, 248, 406–414. [Google Scholar] [CrossRef]
  58. Rezaei, F.; Mosca, A.; Webley, P.; Hedlund, J.; Xiao, P. Comparison of Traditional and Structured Adsorbents for CO2 Separation by Vacuum-Swing Adsorption. Ind. Eng. Chem. Res. 2010, 49, 4832–4841. [Google Scholar] [CrossRef]
Figure 1. Sketch of a possible STEPWISE multi-bed layout with pre WGS reactor, H2 product repressurization, high-pressure (co-current) rinse, and low-pressure (countercurrent) purge steam supplies. For ease of graphical representation, possible pressure equalization lines are not shown.
Separations 09 00020 g001
Figure 2. Systematic parametric approach that is devised for this work. Column dimensions, bed properties, and cycle design are fixed in step 1. GHSVc, adsorption pressure, steam inputs, and inlet compositions are parametrized in step 2. A study is conducted with constant GHSVc. Two other studies are conducted by optimizing the GHSVc such that CCR and CP are found to be equal for each set of parameters.
Separations 09 00020 g002
Figure 3. Visualization of the simulated cycle steps, showing the specified flow directions and refluxes.
Separations 09 00020 g003
Figure 4. Pareto profiles at constant S/Ct and GHSVc of 1.0. Label values indicate the respective S/Cr of each point. The arrow indicates the effect of increasing both S/Ct and R/P ratios on CCR and CP.
Separations 09 00020 g004
Figure 5. From the top to bottom, CO2 concentration profiles during the adsorption (ae) and rinse (df) steps and final cumulative gas compositions of the third PEQ (cg) and purge steps (dh). From left to right, figures differ in terms of S/C inputs at constant GHSVc. Results are shown for composition A in Table 3.
Separations 09 00020 g005aSeparations 09 00020 g005b
Figure 6. From the top to bottom, CO2 concentration profiles during the adsorption (ae) and rinse (df) steps and final cumulative gas compositions of the third PEQ (cg) and purge steps (dh). From left to right, figures differ in terms of S/C inputs at constant GHSVc. Results are shown for composition A in Table 3.
Separations 09 00020 g006aSeparations 09 00020 g006b
Figure 7. GHSVc variations for different S/Ct and R/P ratios. All results are based on composition A and feed pressure of 24 bar. Labelled values indicate the simulated GHSVc/GHSV0.
Separations 09 00020 g007
Figure 8. GHSVc, CCR, and CP results when both GHSVc and S/Cr are varied to identify the diagonal Pareto optimal solution. In (a), S/Ct is fixed at 1.1, while in (b) at 0.8. Both (a,b) are based on composition A. (c) shows results for a S/Ct of 1.1 with feed composition B′.
Separations 09 00020 g008
Figure 9. Comparison between point I from Figure 8a , point II from Figure 8b, and point III from Figure 8c. Comparing points II with point I, the same separation performance (CP, CCR) is achieved at reduced GHSV and S/Ct by increasing the R/P. Comparing point III with point II, inlet steam content appears to influence the R/P intensity, boosting separation performance at the expenses of the feed carbon loading.
Separations 09 00020 g009
Figure 10. From the top to bottom, CO2 concentration profiles during the adsorption (ae) and rinse (df) steps and final cumulative gas composition of the third PEQ (cg) and purge steps (dh). From left to right, figures differ in terms of S/C inputs and GHSVc., respectively; point I and point II from Figure 8 are illustrated. Results are based on composition A.
Separations 09 00020 g010aSeparations 09 00020 g010b
Figure 11. GHSVc, CCR, and CP as function of the simulated PF values. On the left side, (a) results for composition A are shown. The GHSVc of the diagonal solution rises proportionally to feed gas pressure, up to PF ~1.5. The diagonal solution shows a maximum of ~97% at PF ~0.8. On the right side, (b) results for compositions B′, B″ and B‴ are reported. Again GHSVc is observed to rise with PF, even though the diagonal solutions are not yet fully identified for the points at PF = 1.5 and PF = 2.2.
Separations 09 00020 g011
Figure 12. CO2 concentration profiles during the adsorption step at different PF and GHSVc for composition A in Table 3.
Separations 09 00020 g012
Figure 13. Rinse step CO2 concentration profiles at different pressure ratios for composition A in Table 3.
Separations 09 00020 g013
Figure 14. Third PEQ step cumulative gas fractions at different pressure ratios for composition A in Table 3.
Separations 09 00020 g014
Table 1. STEPWISE column basic properties for this study.
VariableUnitValue
Column lengthm12.5
Column diameterm4.0
Bed void fraction 0.4
Sorbent densitykg m−32055
Average particle diametermm5.0
Regeneration Pressurebar1.2
Heat transfer conditions-Adiabatic
Table 2. Steelworks arising gases compositions that are assumed for the WGS feed stream. One WGS feed mixture comprises both Blast Furnace Gas (BFG) and Basic Oxygen Furnace Gas (BOFG). A second WGS feed mixture is based on a pure BOFG composition.
SAG Spec. (%mol)BFG/BOFG MixBOFG
CO222.818.0
CO25.668.0
H24.02.0
N247.612.0
Table 3. STEPWISE inlet compositions and their respective pressure, temperature, shift intensity (S/CO), and original SAG stream that is fed to the WGS reactor.
CompositionAB′B″ B‴
Used SAG BFG/BOFGBOFG
Pbar5–50243550
T°C400400400400
S/CO 1.501.871.761.83
H2O%mol14.5429.8527.7427.52
H2%mol16.0427.0027.5827.70
CO%mol5.303.824.344.53
CO2%mol29.6834.0534.8735.00
N2%mol34.445.285.475.25
Table 4. Parametric ranges of the three parametric studies to optimize process parameters at a given ideal cycle design.
StudySAGComp.S/CrS/CpS/CtP (bar)GHSVc
1BFG/BOFGA0.1, 0.2, 0.31.0, 0.9, 0.81.124Ref. Value
BFG/BOFGA0.2, 0.30.6, 0.50.824Ref. Value
2BFG/BOFGA0.1, 0.2, 0.31.0, 0.9, 0.81.124Varied
BFG/BOFGA0.1, 0.2, 0.30.7, 0.6, 0.50.824Varied
BOFGB′0.1, 0.2, 0.31.0, 0.9, 0.81.124Varied
3BFG/BOFGA0.11.01.15, 12, 18, 24, 35, 50Varied
BOFGB′, B″, B‴0.11.01.124, 35, 50Varied
Table 5. Reference values for dimensionless quantities among the parametric input and output variables.
ParameterUnitReference Value
GHSV0Nm3 h−1 m−3593.6
P0bar24.0
Publisher’s Note: MDPI stays neutral with regard to jurisdictional claims in published maps and institutional affiliations.

