1. Introduction
Amphetamine-related drugs (ADRs) are stimulants with structural and functional similarities to endogenous amines, such as dopamine [
1]. These sympathomimetic drugs are composed of a phenyl ring connected to an amine group through a two-carbon side chain bearing a methyl group. ARDs include a wide range of compounds, such as amphetamine (AMP), methamphetamine (MAMP), beta-methylphenethylamine (BMPEA), ephedrine (EPH), pseudoephedrine (PEPH), norephedrine (NEPH), norpseudoephedrine or cathine (CAT), methylenedioxyamphetamine (MDA), methylenedioxymethamphetamine (MDMA), methylenedioxyethylamphetamine (MDEA), and phentermine (PHE). These compounds release catecholamines such as dopamine from the presynaptic cleft at both the central and peripheral sites [
1].
ARDs are a unique class of sympathomimetic chemicals. On the basis of their origin, ARDs can be classified as either synthesized (AMP, BMPEA, MAMP, MDA, MDEA) or naturally occurring (MDA, MDEA) (EPH, PEPH, NEPH, and CAT) [
2]. In this study, a mixture of synthetic and naturally occurring ARDs, including AMP, BMPEA, CAT, EPH, NEPH, and PEPH, were selected based on their prevalence of abuse in Saudi Arabia. Two pairings of these analytes (EPH and PEPH; NEPH and CAT) are structural diastereomers, while one pair represents positional isomerism (AMP and BMPEA). These sympathomimetics stimulate the release of catecholamines, including dopamine, serotonin, and noradrenaline [
3]. The chemical structures of the ARDs used for this study are depicted in
Figure 1.
ARDs are common compounds implicated in drug abuse in Saudi Arabia. This drug abuse plays an important role in early mortality due to traffic accidents, violence, and overdose [
4]. Consequently, the whole of Saudi society is affected by abuse of ARDs. Therefore, control of ARD abuse is important.
In forensic toxicology, analysis of ARDs may be utilized to identify those driving or performing other tasks under the influence of drugs, to clarify the manner and cause of death, and to identify individuals who have been exposed to drugs in the recent past. For the purposes of estimating of the degree of drug toxicity, this analysis is best carried out using blood samples, as blood drug concentrations are generally best correlated with the extent of toxicity [
5].
The importance of isomeric form identification is growing, particularly in forensic and doping control situations. This is due to the fact that different isomers have varying levels of safety, efficacy, and legislative control. The positional isomer of amphetamine, BMPEA, is currently uncontrolled, whereas amphetamine is a controlled substance. BMPEA can be found in nutritional supplements for athletes and dieters [
6,
7,
8]. Because of the fact that they are both positional isomers, their similar mass spectra can lead to incorrect identification [
9]. Misinterpretation in this regard may result in a false conviction. Therefore, complete resolution at the level of the chromatogram’s baseline is essential in avoiding errors in the identification process of these drugs. Consequently, the innovative aspect of this analytical approach is its capacity to obtain the entire chromatogram baseline resolution for all isomeric analytes.
The six selected ARDs in this study include two pairs of diastereomers (NEPH and CAT and EPH and PEPH) and one pair of positional isomers (AMP and BMPEA). Therefore, it was anticipated that fragmentation patterns for each pair of isomers would be quite similar or indistinguishable.
Within the field of forensic toxicology, new analytical methods must undergo a process comprised of three stages prior to being adopted and incorporated within laboratories’ standard analytical methods. These three stages involve development, validation, and verification. It is crucial in forensic toxicological analysis to obtain reliable, consistent, and accurate measurements. Therefore, validation of the developed method is a prerequisite for analyzing actual samples in forensic casework. Validation involves performing a set of experiments to estimate the efficacy and reliability of an analytical method [
10]. In forensic toxicological analysis, these experiments must be performed according to the most recent professional standards for the intended application. Such standards are exemplified by those established by the Scientific Working Group for Forensic Toxicology (SWGTOX) [
10].
In this study, a pseudo-isocratic UPLC-qTOF-MS technique was developed and validated for the analysis of amphetamine-related drug isomers in blood after extraction by mixed-mode solid-phase extraction (MMSPE) applying SWGTOX-established standards.
2. Materials and Methods
2.1. Experimental Materials
Standards for (±) amphetamine, (S,S)-(+)-pseudoephedrine, (1S,2R)-(+)-ephedrine-d3 HCl, and (±)-amphetamine-d11 were purchased from Cerilliant (Round Rock, TX, USA) as 1 mg/mL methanolic solutions and diluted as required. (R*,S*)-(±)-ephedrine HCl, DL-norephedrine, and (R)-(+)-β-methylphenethylamine were obtained from Sigma Aldrich (Oakville, Ontario, Canada) as 1 mg/mL methanolic solutions and diluted as required. (+)-Norpseudoephedrine hydrochloride (cathine hydrochloride) was purchased from LGC Standards (Manchester, NH, USA) as a 0.1 mg/mL methanolic solution and diluted as required. The ACN, MeOH, and purified water used in drug extraction and UPLC analysis were of reagent grade and were obtained from EMD Milipore (Billerica, MA, USA). Ammonium acetate was purchased from Mallinckrodt Baker Inc. (Phillipsburg, NJ, USA). Acetic acid and HCl were obtained from BDH (Radnor, PA, USA). Ammonium hydroxide, ammonium formate, and formic acid were purchased from Fisher Chemicals (Bridgewater, NJ, USA). Mixed-mode SPE (Oasis MCX, 30 mg) and FTPE (HLB Prime, 100 mg) were purchased from Waters (Milford, MA, USA). Blank human and animal whole blood were obtained from Utak Laboratories Inc. (Valencia, CA, USA).
Methanolic combined working solutions of the analytes were made at different concentrations levels (20, 40, 200, 500, 800, and 1000 ng/mL) for the spiking of drug-free blood, and the preparation of calibration standards samples. Three internal standard (IS) solutions containing 20, 500, and 1000 ng/mL of the deuterated analogues of ephedrine and amphetamine were prepared in MeOH for determination of matrix effects.
2.2. Sample Preparation and Extraction
Spiked and drug-free blood (250 μL) were mixed sequentially with 1 mL each of 0.1 M HCl and ACN. The mixtures were vortexed and centrifuged at 5000 rpm for 15 min at room temperature, and the supernatants were decanted into clean tubes. MMSPE was carried out using Oasis MCX 96-well plates. The wells were conditioned with 1 mL of MeOH and equilibrated with 1 mL of water. The supernatants obtained from the pre-treatment step were loaded under gravity, and SPE wells were washed sequentially with 1 mL each of 0.1 M HCl, MeOH, and 5% NH4OH. The wells were dried under vacuum (−10 kPa) for 10 min, and the analytes were eluted with 1 mL of 5% NH4OH in MeOH (
Figure 2). The eluates were evaporated to dryness under vacuum centrifugation at 30 °C, then the residues were reconstituted in 200 μL of mobile phase A and subjected to UPLC-qTOF-MS analysis (
Figure 3).
2.3. Analytical Methods
Chromatographic separations were obtained on an ACQUITY UPLC™ HSS T3 column (100 mm × 2.1 mm, 1.8 µm) maintained at 45 °C. Mobile phase A consisted of water, 0.1% formic acid, and 5 mM sodium formate; mobile phase B was composed of ACN and 0.1 % formic acid. The mobile phase composition was controlled as follows: 0–1 min, 0% B; and 1–10 min, 5% B (pseudo-isocratic) for complete baseline resolution of the isomeric analytes; 10–11 min, 5–30% B, 11–12 min, 30–50% B; 12–13 min, 50–100% B; 13–14 min, 100–0% B; and 14–15 min, 0% B. The flow rate was 0.5 mL/min, and the injection volume was 5 µL.
Table 1 shows the optimized run method conditions.
Mass spectrometry was performed on a Waters Acquity UPLC equipped with a Waters Xevo G2-XS-qTOF-MS (Waters, Medford, MA, USA). Data were acquired in sensitivity mode using positive electrospray ionization with a resolution >20,000 at full width half maximum. The acquisition range was
m/z 50–601 using a scan time of 0.1 s. The capillary voltage and cone voltage were 0.8 kV and 20 V, respectively. The source temperature was 140 °C, the desolvation gas flow rate was 900 L/h at 250 °C, and the cone gas flow rate was 50 L/h. Data acquisition used the MS
E mode, with low collision energy (4 eV) and high-energy ramp (10–40 eV). Mass correction was performed during acquisition using an external reference (lockspray) composed of 2 µg/mL leucine enkephalin (monitoring
m/
z = 278.1114) solution infused at a flow rate of 5 µL/min at 5 s intervals.
Table 1 shows the analytical parameters of the analytes.
2.4. Method Validation
Method validation was performed in accordance with the guidelines established by SWGTOX. Matrix Interferences (MIs) were evaluated to confirm the absence of substances that might interfere with analyte detection in blood matrices. Five different types of aged animal and human drug-free blood matrices were pretreated and extracted in triplicate by following the aforementioned pretreatment and extraction method. These extracted samples were analyzed for MIs by UPLC-qTOF-MS.
The term “Matrix Effects” (MEs) refers to the modification or interference of the instrument response, whether direct or indirect, carried on by the co-eluting substances present in the sample matrix [
10]. MEs were evaluated using five different types of aged animal and human drug-free blood matrices. All blood samples were pretreated and extracted in triplicate by following the pretreatment and extraction method. The extracted drug-free samples were spiked with combined working standard and IS solutions in triplicate at concentrations of 20 (low), 500 (medium), and 1000 (high) ng/mL. Spiked samples and corresponding neat standards were analyzed, and their peak areas were used to determine the magnitude of MEs using the following equation:
where ME less than 100 indicates suppression and ME greater than 100 indicates enhancement. The acceptable range of MEs is considered as 100 ± 25 = 75–125 [
10]. MEs at each concentration level are represented as the percentage increase or decrease in the peak areas of analytes in the samples relative to those of analytes in the neat standards.
Recovery refers to the fraction of the original analyte mass that is carried through the extraction process and is present in the final extract. It is determined as the ratio of analyte response in an extract to that of a drug-free extract when the sample is spiked with the same mass of the analyte. Two different types of aged animal drug-free blood matrices were evaluated for recovery in triplicate at three concentration levels (low, medium, and high) in pre- and post-extraction spiked samples. Both samples were processed by following the MMSPE pretreatment and extraction method. The samples were spiked with combined working standard and IS solutions in triplicate at concentrations of 20 (low), 500 (medium), and 1000 (high) ng/mL either before (pre-extraction spiked) or after (post-extraction spiked) extraction. The spiked samples were analyzed, and their peak areas were used to determine the magnitude of recovery using the following equation:
Carryover was evaluated by analyzing extracts of 250 μL of drug-free blood (n = 3) after analyzing a high-concentration calibrator (1000 ng/mL, n = 3) of the analytes. Both the samples were pretreated and extracted by the described extraction method.
Calibrators (250 µL) were prepared in drug-free aged bovine blood matrix at concentrations of 20, 40, 200, 500, 800, and 1000 ng/mL using combined working standard solutions, each containing 125 ng of ISs. All samples were pretreated and extracted by the described extraction method and analyzed by UPLC-qTOF-MS. Quantification was performed by measurement of the ratio of peak areas of the analytes relative to those of the corresponding deuterated analogs in the specific extracted ion chromatogram (EICs); deuterated AMP was used for quantifying AMP and BMPEA and deuterated EPH was used for quantifying EPH, PEPH, NEPH, and CAT. Calibration curves were constructed and assessed using quadratic regression (considered acceptable if R2 ≥ 0.99) of peak area ratios versus concentration on each of five different days. Each calibration curve was constructed using six calibrators in triplicate for each analyte. Furthermore, a batch of blind samples was analyzed in triplicate at two concentration levels along with the calibrators for the purpose of assessing analytical bias.
The working concentration range of the method was 20–1000 ng/mL for all analytes. The LOD was administratively defined as 20 ng/mL using the lowest non-zero calibrator method (the calibrator with lowest concentration assayed with a response that met precision criteria) due to the lack of toxicological significance of the analyte compounds at blood concentrations below 20 ng/mL. Fifteen samples with analytes at a concentration of 20 ng/mL were used to identify the LOD. All these samples were pretreated and extracted by following the described extraction method. Similarly, the LOQ was identified by following the same method used for identifying the LOD.
Analytical precision was measured as the coefficient of variation (%CV) of triplicate measurements at the assayed concentration range on each of five different days. It was considered acceptable when the %CV was ≤20% [
10]. Bias was determined after blinded analysis of triplicate samples at two different concentrations of each analyte per run. Bias was considered acceptable when the measured concentration was within 20% of the theoretical concentration [
10].
Analyte stability within the autosampler (maintained at 10 °C) of the UPLC-qTOF-MS was evaluated by repeated injection of extracted samples at three different concentration levels (40, 500, and 1000 ng/mL; n = 3) after 0, 12, 24, and 36 h. Analytes were considered stable if the deviation in analyte response was within 20% of the response of the corresponding sample at t = 0 h
2.5. Data Processing
Two types of software were used to process the raw data obtained from the analysis. Masslynx 4.1 software (Waters, Manchester, UK) was used to manually assess analyte identification criteria. The raw data were processed automatically utilizing the streamlined workflow of the UNIFI 1.7.0 software (Waters, Manchester, UK) for identification and quantification of the analytes. Compound identification was based on retention time (±0.05 min), mass deviation (±10 mDa), and appropriate isotope profile.
4. Discussion
Drug analyses in forensic toxicology are performed to identify the use of drugs of forensic relevance or whether the subject was under the influence of certain drugs during a particular period [
11]. Results of these analyses must be accurate and reliable in order to avoid any false positive or false negative results, as these could lead to severe consequences. Therefore, the utilization of highly sensitive and selective hyphenated analytical techniques, such as liquid chromatography-mass spectrometry (LC-MS), is necessary to qualitatively and quantitatively analyze drugs in blood samples [
12].
This study was conducted to develop and validate a qualitative and quantitative analytical method to determine ARDs in blood by UPLC-qTOF-MS after extracting the samples by MMSPE. Validation of the analytical method was based on standards established by SWGTOX [
10]. To optimize the extraction process, several experiments were performed, including the evaluation of different precipitation agents, modes of SPE, and conditions of UPLC-qTOF-MS analysis. Samples of blood were precipitated using MeOH and ACN either alone or in combination. Based on visual inspection of the supernatant (i.e., clarity), ACN was deemed to be the most suitable precipitation agent in the pretreatment step of blood samples. After evaluating two types of SPE platforms for the extraction step, MMSPE was found to be superior to molecularly imprinted polymers-solid phase extraction (MIP-SPE), as it did not elicit any interference with responses associated with key analytes.
Prior to the development of hyphenated LC-MS, the GC-MS method was the ideal standard analytical method for detecting ARDs in blood. Kudo et al. described a method for qualifying and quantifying thirteen different ARDs in blood using GC-MS with an enhanced polymer column. This method was developed after the analytes were extracted from blood using SPE and derivatized via acetalization. This study did not focus on isomeric analytes [
13].
The separation of structurally isomeric analytes requires an extended runtime to ensure full baseline resolution of the analytes, especially when they yield the same fragment ions. In such an analytical assay, mobile phase composition is maintained as isocratic (constant mobile phase composition) or “pseudo-isocratic”, where the mobile-phase composition gradient is extremely shallow [
14,
15]. Developing a properly resolved diastereomer chromatogram with LC is difficult in practice. Consequently, it is essential to choose the appropriate mobile phase, chromatographic conditions, and column type. Chobiski et al. used an isocratic UPLC-MS/MS method with a run time of 9.5 min to separate amphetamine (AMP) from its structural isomer, beta-methylphenethylamine (BMPEA) [
6]. Moreover, Sorensen [
16] described the extraction and analysis of cathinones and related ephedrines in forensic blood samples utilizing simple extraction procedures and LC-MS/MS analyses. However, due to the use of gradient elution, the two employed pairs of diastereomers (EPH and PEPH; NEPH and CAT) were not fully resolved, whereas PEPH was successfully separated from the EPH diastereoisomer in our analytical method, as were NEPH and CAT.
In this study, the six selected ARDs included two pairs of diastereomers (NEPH and CAT and EPH and PEPH) and one pair of positional isomers (AMP and BMPEA). Therefore, it was anticipated that fragmentation patterns for each pair of isomers would be identical or indistinguishable. To overcome this analytical challenge, chromatographic resolution of the ARDs was crucial. Accordingly, a pseudo-isocratic elution method was developed in which the composition of the UPLC mobile phase was varied at very shallow gradients (from 0% B to 5% B over 9 min) to facilitate the complete baseline resolution of the isomeric analytes.
On the other hand, the capacity of the qTOF-MS to generate two mass spectra simultaneously (MS
E mode), one at high collision energy and the other at low collision energy, is another one of its distinguishing characteristics. The high collision mass spectrum identifies the fragmentation pattern of the analyte, whereas the low collision energy identifies the analyte’s molecular ion. Rapid alternating acquisition of MS spectra at low (LE) and high (HE) collision energies during qTOF-MS analysis was performed in the MS
E mode. Ions from intact molecules were generally and predominantly detected at LE, whereas more extensive fragmentation data were acquired at HE. This technique enables the acquisition of ions from precursor molecules and their fragment ions in a single injection [
17]. Low capillary voltage (0.8 kV) facilitated the detection of low-molecular-mass ARDs (135–168 Da) with optimum sensitivity. Similarly, the cone voltage was set to a low voltage (20 V), as shown in
Table 2.
Both isomer pairs, NEPH and CAT and EPH and PEPH, formed [M+H]
+ ions, with
m/z 152 and 166, respectively. Consequently, by losing water from their molecular ions [M+H-H
2O]
+, the isomer pairs formed fragments with
m/z 134 and 148, respectively. NEPH and CAT yielded [M+H-H
2O-NH
2]
+ with
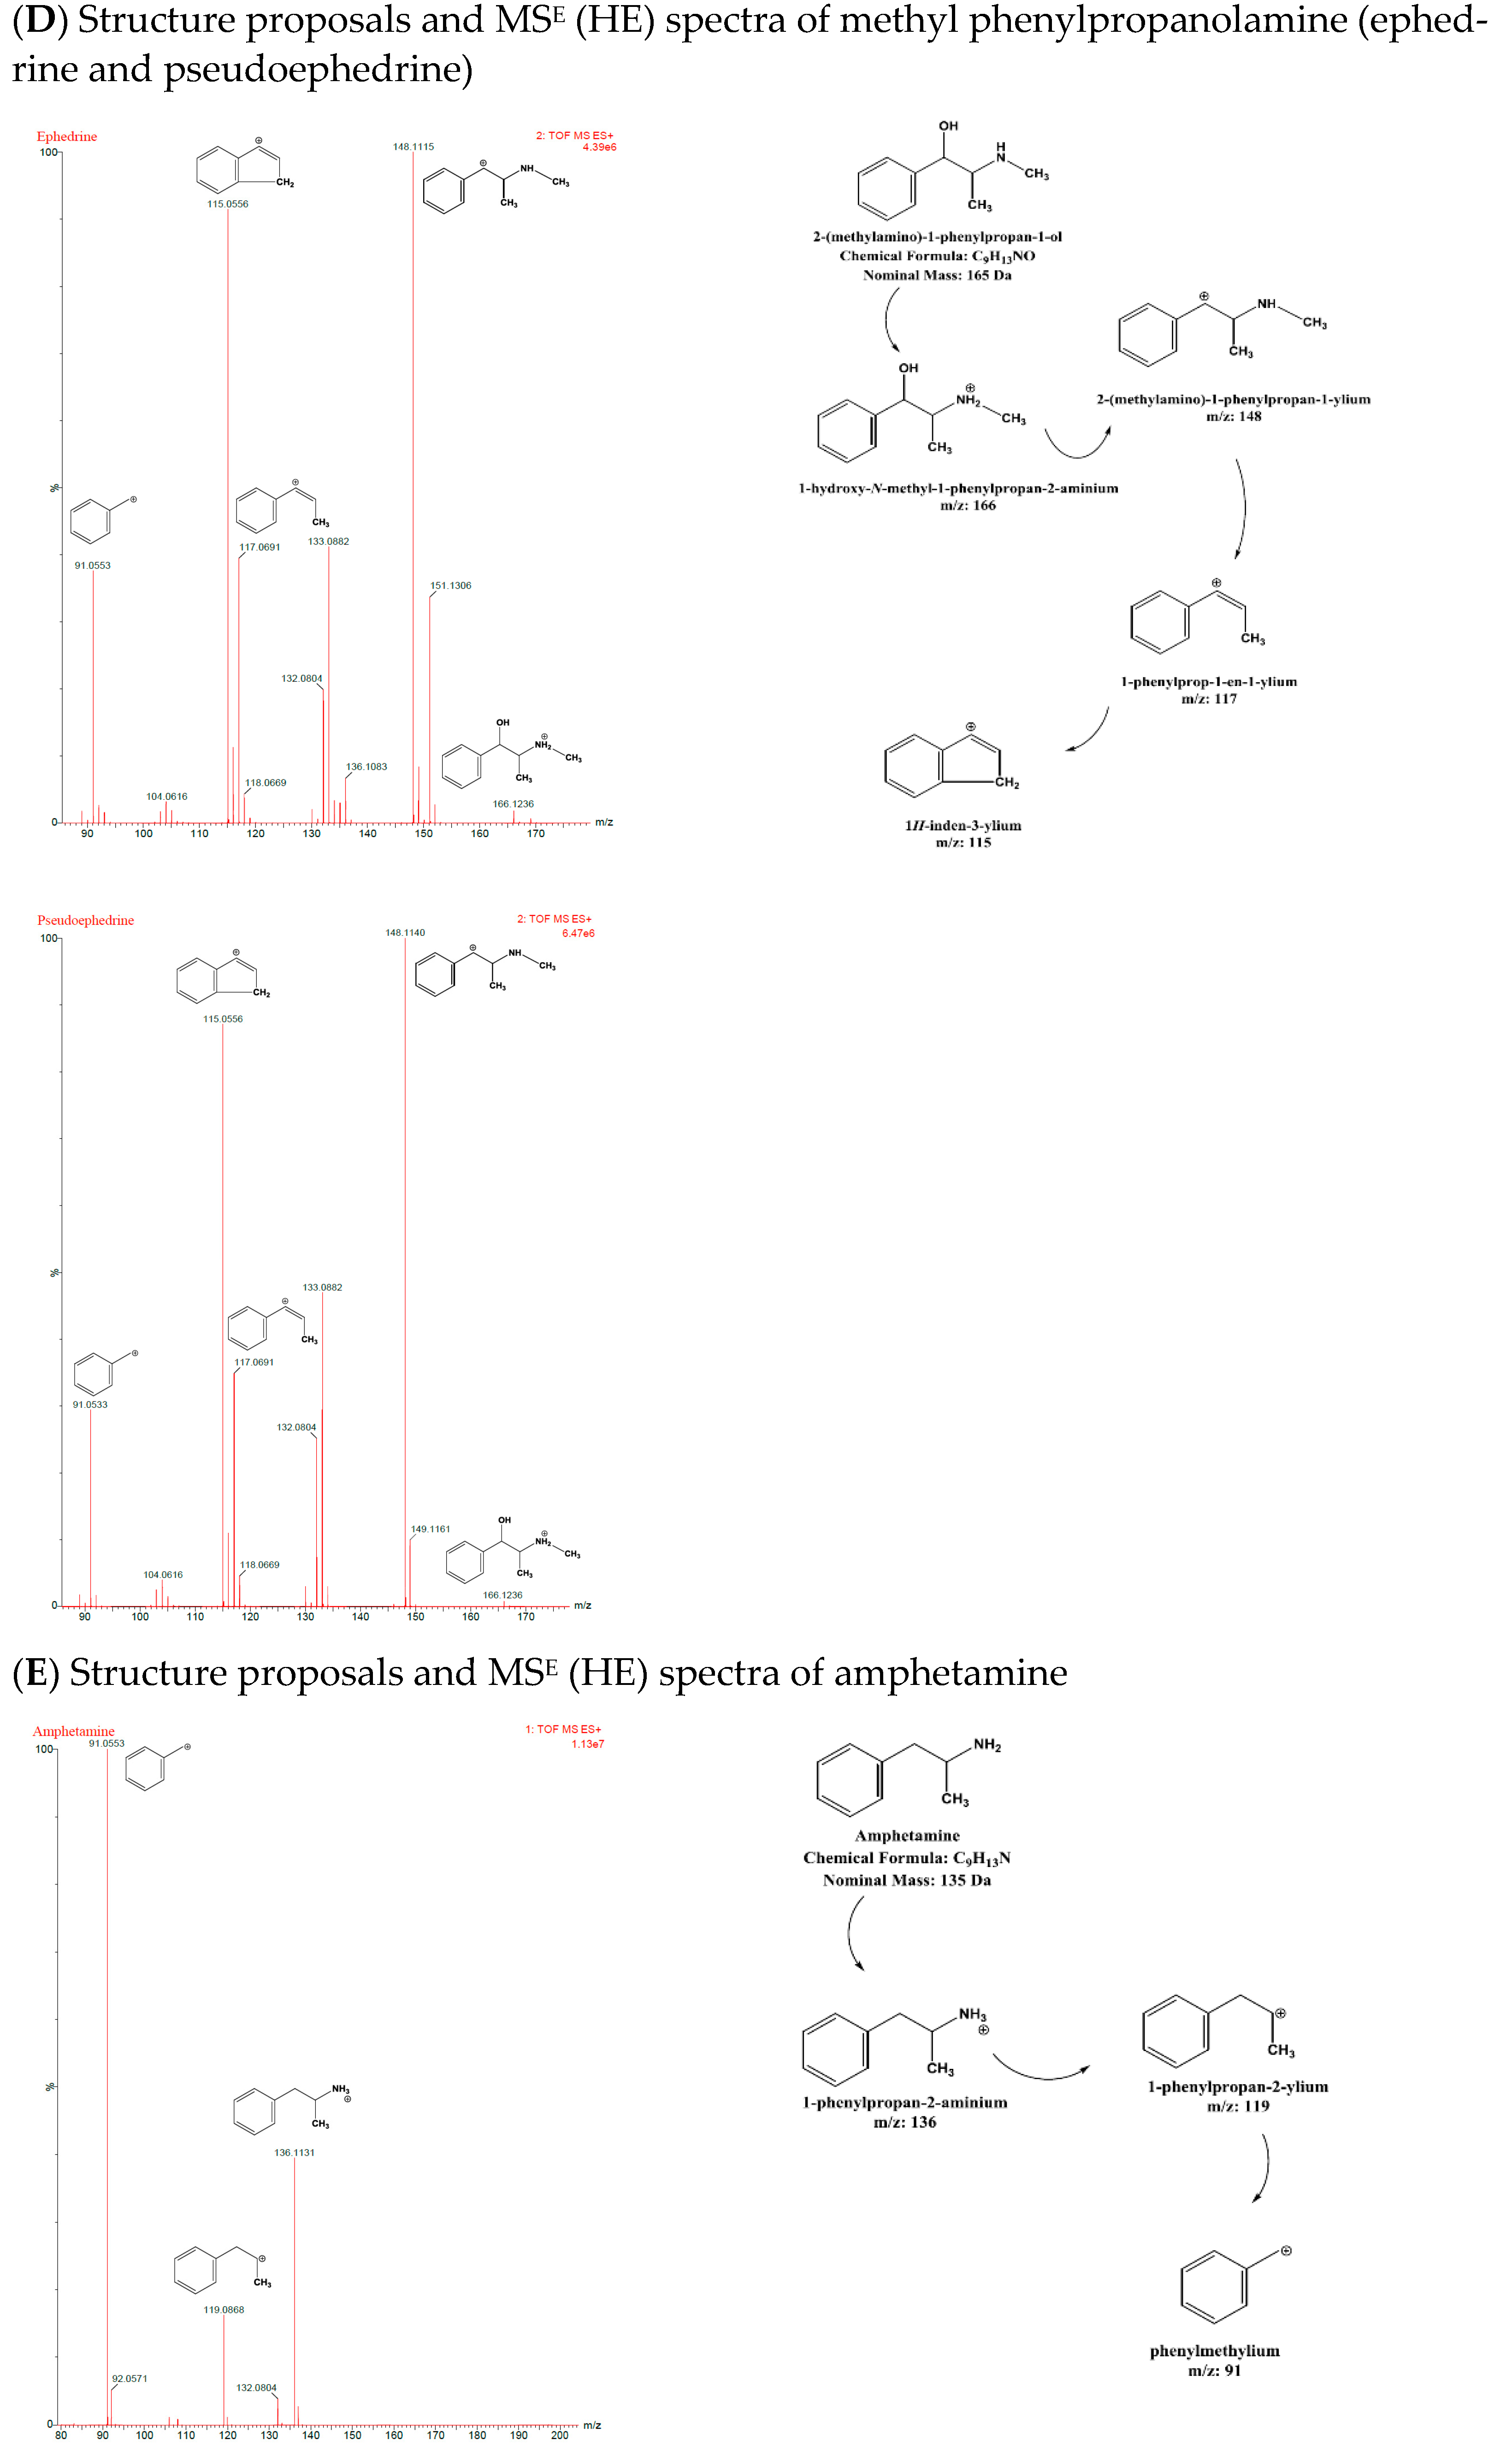
m/z 117 after subsequently losing ammonia, whereas EPH and PEPH yielded [M+H-H
2O-NH-CH
3]
+ with
m/z 117 after losing methylamine. Moreover, [M+H-H
2O-NH
2-H
2]
+ with
m/z 115 was formed by both isomer pairs due to the loss of H2 [
17]. Ephedrine-d3 yielded [M+H]
+, [M+H-H
2O]
+, and [M+H-H
2O-CH
3]
+ with
m/z 169, 151, and 136, respectively [
17]. AMP and BMPEA displayed the same fragmentation pattern, forming [M+H]
+ with
m/z 136. Subsequently, they formed [M+H-NH
2]
+ with
m/z 119 by losing ammonia and tropylium ion [M+H-NH
2-CH
3-CH]
+ with
m/z 91 as a result of a β-C-C cleavage. Amphetamine-d11 formed [M+H]
+, [M+H-NH
2]
+, and [M+H-NH
2-CD3-CD]
+ with
m/z 147, 130, and 98, respectively.
Figure 6A–E shows chemical structure proposals for molecular ion fragmentation acquired at high collision energy (HE) during qTOF-MS analysis for amphetamine-d 11, ephedrine-d 3, phenylpropanolamine (norephedrine and cathine), and methyl phenylpropanolamine (ephedrine and pseudoephedrine).
The developed method was validated by evaluating matrix interference, matrix effects, recovery, carryover, autosampler stability, and calibration to measure bias, intra- and inter-day accuracy, and precision. Five types of drug-free blood matrices were extracted and analyzed without the addition of ISs. Each sample was analyzed to confirm the absence of matrix interference by monitoring the quantifier and qualifier ions of the analytes of interest at their respective retention times; no matrix interferences was detected in any of the five blood matrices.
Changes (enhancement or suppression) in analyte responses due to matrix effects must be less than 25%, as per SWGTOX guidelines. Matrix effects of the five different blood matrices on the responses of all analytes at all concentration levels assayed were less than 25% (with %CV ≤20%). The majority of the matrix effects values were negative for bovine and human source 1, 2, and 3 blood matrices, indicating ion suppression. However, ion enhancement was observed in the sheep blood matrix, as shown by positive matrix effects values. Recovery was evaluated using aged bovine and sheep blood matrices; it was 65–90% for all analytes extracted from bovine blood, whereas it was 60–90% for all analytes extracted from sheep blood at all concentration levels (with %CV ≤20%). Low recovery values, especially at low analyte concentrations, were observed. These low recovery values might be due to the loss of analytes because of the polarity and volatility of ARDs. The deactivation of any utilized glass apparatus during the extraction and preventing the protonated amine group of ARDs from interacting with the hydroxyl group of glass silicone could increase analyte recovery and reduce matrix effects. This remedial step was not incorporated in this study due the high cost of silanized glass tubes. Therefore, further experiments are required to verify its benefits.
Analyte carryover may compromise the accuracy of qualitative or quantitative analysis. ARDs were evaluated for carryover by analyzing drug-free blood extracts immediately following the analysis of the corresponding upper calibrator (1000 ng/mL) in triplicate. None of the analytes in this study displayed carryover effects.
Accuracy and precision were determined by constructing calibration curves for each analyte on each of five separate days and running two blind samples (one high (640–960 ng/mL) and one low (32–48 ng/mL) unknown concentration samples) with each curve. The curves were produced using calibrators prepared in triplicate at 20, 40, 200, 500, 800, and 1000 ng/mL. The LOQ was determined to be the lowest point on the curve that demonstrated a precision of ≤20% and an S/N ratio ≥ 10. The LOD was determined to be equal to the LOQ as the lowest concentration that was measured on the curve (the lowest non-zero calibrator method). The R2 values (0.999–1) observed for each curve showed a good fit; each curve was fit with a quadratic regression equation.
The concentration of each unknown blind sample was calculated using the equation of the line of best fit, and bias was determined by comparing the calculated and theoretical concentrations using the following equation:
Bias values up to 20% are permissible as per SWGTOX guidelines [
10]. The high and low concentration blind samples for all analytes exhibited acceptable bias values, indicating that the method is reliable at both the high and low ends of the curve. Bias results of ten blind and calibrator samples analyzed on five separate days are shown for each analyte in
Table S4.
Precision, expressed as %CV, is the closeness of agreement between a series of measurements obtained from multiple samples of the same homogenous sample population [
10]. Imprecision can lead to inaccurate quantitative results. SWGTOX guidelines state that the %CV shall not exceed 20% at any concentration level. Intra- and inter-run precisions were calculated. Intra-run precision was calculated using the values obtained in each run after triplicate analyses at each concentration, as follows:
Inter-run precision was calculated using the values obtained in each run after triplicate analyses at each concentration, as follows:
The %CV for all analytes at all six concentrations were within the acceptable precision limit (≤20%).
Table S4 presents the accuracy and precision results of the assay.
The stability of each analyte while samples resided in the autosampler was assessed. Stability is defined as the ability of an analyte to resist chemical change in a matrix under specific conditions for given time intervals [
10]. It is a measure of the time for which an analyte can remain under those conditions before the interpretation of its concentration is affected; a change in response beyond ±20% from the initial response indicates a loss of analyte stability. The relative change in response was measured at three concentrations (40, 500, and 1000 ng/mL) in triplicate at 0, 12, 24, and 36 h. The samples were maintained in the autosampler at 10 °C. All analytes were stable throughout the period of evaluation, as shown in
Table S5, indicating that ARDs can be reliably quantified for at least 36 h under the autosampler conditions used here. The research presented here used aged blood in developing a method for the identification and quantification of ARDs. This study was performed on aged animal blood matrices because of our limited access to aged human blood. This type of study should be expanded to include aged human blood.


