Abstract
Green Deep Eutectic Solvents (DESs) are considered here as an alternative to conventional organic solvents and ionic liquids (IL) for the extraction of phenolic compounds from pyrolysis oil. Although ionic liquids have shown a promising future in extraction processes, DESs possess not only most of their remarkable physico-chemical properties, but are also cheaper, easier to prepare and non-toxic, increasing the infatuation with these new moieties to the detriment of ionic liquids. In this work, phenol was selected as a representative of phenolic compounds, and toluene and heptane were used to model the pyrolysis oil. COSMO-RS was used to investigate the interaction between the considered Dess, phenol, n-heptane, and toluene. Two DESs (one ammonium and one phosphonium based) were subsequently used for experimental liquid–liquid extraction. A ternary liquid–liquid equilibrium (LLE) experiment was conducted with different feed concentrations of phenol ranging from 5 to 25 wt% in model oil at 25 °C and at atmospheric pressure. Although both DESs were able to extract phenol from model pyrolysis oil with high distribution ratios, the results showed that ammonium-based DES was more efficient than the phosphonium-based one. The composition of phenol in the raffinate and extract phases was determined using gas chromatography. A similar trend was observed by the COSMO-RS screening for the two DESs.
1. Introduction
At present, the growing concerns over the energy crisis and climate change have shifted global attention towards renewable and environmentally friendly sources of energy to satisfy the world’s expanding energy demand [1]. Biomass is considered to be one of the most attractive, realistic and economically viable alternatives. One of the many ways of converting biomass into valuable products is through the pyrolysis process, in which biomass is thermally and anaerobically decomposed into products, namely bio-oil.
The pyrolysis oil or bio-oil produced contains highly oxygenated chemical compounds, and these compounds are responsible for its poor fuel oil properties, hence impeding its potential to replace conventional fuels such as gasoline and diesel. To overcome these disadvantages, bio-oil needs upgrading [2]. Phenolic compounds contained in bio-oil are an important commodity to be recovered, and their recovery can be achieved through liquid–liquid extraction (LLE) methods. The performance of LLE strongly depends on the choice of solvent used; hence, it is important to carefully select a solvent [3,4,5]. An ideal solvent should possess favorable physical properties [6].
In the past few years, ionic liquids (IL), which are composed of anions and cations, have been used in various separation technologies and applications [7]. IL serve as an attractive alternative solvent because they are stable, have low volatility—thus making them recyclable—and are non-flammable. However, most of the synthetic ones (among imidazolium, pyridinium, etc.) are highly viscous, hygroscopic, highly toxic and most of the biocompatible ones are costly to prepare, hampering a full development of this sector with such moieties.
Hence, deep eutectic solvents (DESs) were introduced to overcome the drawbacks of IL [8,9]. DESs are green solvents that can be easily synthesized by combining hydrogen bond acceptors (HBAs) and hydrogen bond donors (HBDs) [10]. They possess low volatility and toxicity, and are non-flammable and non-corrosive. DESs have been employed in many research fields, including separation. Due to their high selectivity and solubility properties, DESs show great potential as extraction solvents, and have been used for separation of glycerol from biodiesel [11,12], aromatics from aliphatics [3,4,13,14], and phenols from oils [15,16,17,18]. Jiao et al. [15,16] reported that imidazole and amide compounds could separate phenol and cresols from oil with an efficiency of more 90% by forming DES with phenol. Yi et al. [17] reported phenolic compound extraction efficiency of 98.5% using choline chloride-based DESs under optimum conditions. In addition, Li et al. [18] reported extraction of phenol using betaine-based DESs, resulting in an efficiency of 94.6%, with 5.2% neutral oil entrainment.
In this study, DESs are used to extract phenolic compounds from model oil. DES have been widely used in the separation of liquid mixtures, but not much attention has been given to their application in upgrading bio-oil. Therefore, this study will focus on addressing the concerns that will arise from the potential incorporation of DES in the extraction of phenolic compounds from bio-oil derived from biomass pyrolysis via both computational and experimental methods.
The computational work included the use of a quantum chemical method, Conductor-like Screening Model for Real Solvents (COSMO-RS), to screen potential DESs that could give high phenol separation efficiency from the model oil. Twenty-four DESs were screened in this work, of which 20 of them are ammonium- and phosphonium-based DESs. Ammonium- and phosphonium-based DESs are commonly used in the separation of hydrocarbon liquid mixtures, and have been proven to be effective in selectively extracting the intended solutes. The DESs methyltriphenylphosphonium bromide (MTPPBr): ethylene glycol (EG) with a molar ratio of 1:3, and choline chloride (ChCl): Monoethanolamine (MEA), with a molar ratio of 1:5 were chosen for experimental comparison, and both reported the highest capacity at infinite dilution for phenol through COSMO-RS calculations. Experimental work included the synthesis and characterization of MTPPBr/EG (1:3) and ChCl/MEA (1:5) DESs, extraction experiments, and compositional analysis.
2. Computational Methodology
Geometry Optimization
First, the geometry and charge density of all molecules used in this work were optimized using the TmoleX software package [19] using the def2-TZVPD basis set and the density function theory (DFT).
Once the geometry optimization of the molecules are completed, “.cosmo” files are generated using the single point calculation before being imported to the COSMOthermX software for solvent screening. In this work, all single point calculations were performed using the BP_TZVPD_FINE_19.ctd parameterization. This parameterization is selected because it is the most accurate interpretation for calculations involving DES and IL, as it uses fine cavity, which is a novel type of molecular surface cavity construction [20].
The molecules involved in the system, which comprises DES (HBA and HBD), solute (phenol), and carrier (model oil components, i.e., toluene and heptane), are specified first. Within the COSMO-RS framework, DESs are regarded as binary mixtures of HBA and HBD at a fixed molar ratio [19].
For solvent screening, activity coefficient at infinite dilution of solute and carrier in DESs are desired. Liquid–liquid phase calculations were performed at 25 °C in isothermal condition. Ternary mixture was selected where the molar ratio of HBA and HBD of DES is defined first, followed by the solute (phenol) and carrier (hydrocarbon). The main objective of this step is to evaluate the activity coefficient at infinite dilution, . Indeed, describes the molecular interaction of the solute and solvent at solute concentration of almost zero. From the predicted values, the performance of each solvent could be assessed by evaluating the selectivity, , the capacity, , and the performance index, , at infinite dilution using Equations (1)–(3), respectively:
where is the selectivity of phenolic compounds to model oil at infinite dilution, is the capacity of phenolic compounds at infinite dilution, is the activity coefficient of model oil at infinite dilution, and is the activity coefficient of phenolic compounds at infinite dilution. In this work, a collection of 24 DESs were screened, and the results are described afterward.
3. Materials and Methods
The chemicals used in this work are listed in Table 1, with their source and purity. No further purification was required for any of the chemicals.

Table 1.
List of chemicals used in this work.
3.1. DES Synthesis and Characterization
Both DESs were mixed in their specific molar ratios in screw-capped bottles. All apparatuses were dried beforehand to avoid contamination with water. Ammonium (ChCl) and phosphonium (MTPPBr) salts were weighed on an electrical weighing balance at known quantity while the HBDs were pipetted into the bottle using a micropipette. The mixtures were agitated on a magnetic stirrer at 200 rpm and 348 K until a clear, colorless, homogenous DES solution was formed. The DES solution was left overnight to ensure that the solution was stable. For example, 16.4 g of MTPPBr salt and 8.6 g of HBD were used to prepare 25 g of MTPPBr/EG DES.
Once the DESs were successfully synthesized, they were further characterized by measuring some of their physical properties. Density and viscosity measurements were performed as a function of temperature at the range of 303.15–333.15 K. The densities and viscosities of all synthesized DESs were measured using an Anton Paar density meter (DMA 4100 M) and Lovis 2000 ME microviscometer. Each measurement was performed in triplicate. Structure and purity analysis on the DESs was conducted using 1H-NMR spectroscopy.
3.2. Liquid–Liquid Extraction
Feed solution consisting of mixtures of heptane or toluene and phenol at various concentrations (5, 10, 15, 20 and 25 wt%) were prepared in close-capped vials. The DESs were mixed with the feed at a 1:1 mass ratio in sealed tubes. The samples were stirred for 2 h, followed by a settling time of approximately 2 h. Samples were then withdrawn from the top and bottom layers, and both were analyzed using gas chromatography (GC). The samples were diluted using acetonitrile. The GC-2010 Pro (Shimadzu) system equipped with a flame ionization detector (FID) and HP-5 column (5% Diphenyl/95% Dimethylpolysiloxane, 30 m, 0.32 mm ID, 0.25 µm df) was used to determine the compositions of the raffinate-phase and DES-phase. The carrier gas was helium with a split mode. The GC liner was cleaned after each system analysis to avoid column contamination with non-volatiles compounds (i.e., the DES constituents). To determine the composition, a calibration curve of heptane/phenol and toluene/phenol was prepared (Figures S1 and S2). The optimum GC conditions are provided in Table 2. Each measurement was performed in triplicate, and the uncertainty in the reported molar compositions was estimated to be equal to 0.008. The presence of DES in the hydrocarbon-rich phases was checked by 1H NMR analysis, and can be considered to be negligible.
Table 2.
Gas chromatography operating conditions.
4. Results and Discussion
4.1. Computational Screening Using COSMO-RS
In this study, COSMO-RS is used to carry out the screening process of DES-containing systems via qualitative and quantitative screening, by predicting the liquid–liquid equilibrium properties and extraction capability of the system consisting of DES, solute (phenolic compound) and carrier (heptane or toluene). A collection of 24 DESs chosen from the literature (Table 3) were screened using COSMO-RS.
Table 3.
List of deep eutectic solvents (DESs) used in COSMO-RS screening.
To verify the accuracy of the COSMO-RS calculations, the distribution coefficient, D, in phenol-containing systems estimated by COSMO-RS was compared to the experimental data reported in literature. Burghoff et al. [28] reported the distribution coefficient of phenol in various solvents, i.e., organic solvents and ILs at 298.15 K. Hence, the data from this publication are used to benchmark our COSMO-RS prediction. The data in Figure 1 show a comparison between the experimental values and the predicted values of distribution ratio of phenol in various solvents shown in logarithmic scale. As can be seen, the experimental values correspond satisfactorily to the predicted values, as shown from the points scattered closely around the parity line, proving that COSMO-RS is a reliable tool for screening solvents for extraction processes.
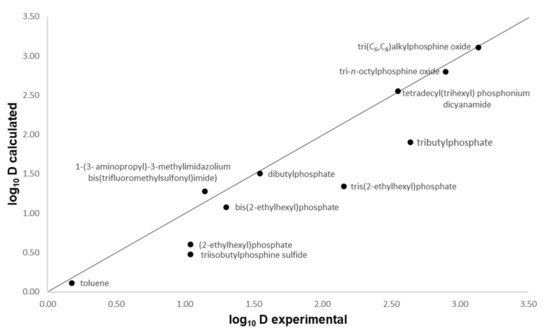
Figure 1.
Comparison of COSMO-RS predicted and experimental logarithmic scale distribution coefficients (log10 D) of phenol in various solvents.
As seen from Figure 2, which shows the capacity of phenol in the DES, the top five DESs reporting the highest capacity at infinite dilution for phenol are ChCl/MEA (1:5) (95.5), MTPPBr/TEG (1:5) (44.1), Bet/Lea (1:2) (38.4), TBACl/TEG (3:1) (29.6), and TPABr/EG (1:3) (20.9). The capacity of a DES towards phenol indicates the extraction capability of the DES in accommodating as much phenol as possible in the extraction phase. However, it is also important to take into consideration the selectivity of the DES towards phenol compared to its carrier compounds, in this case compared to toluene and heptane, respectively.
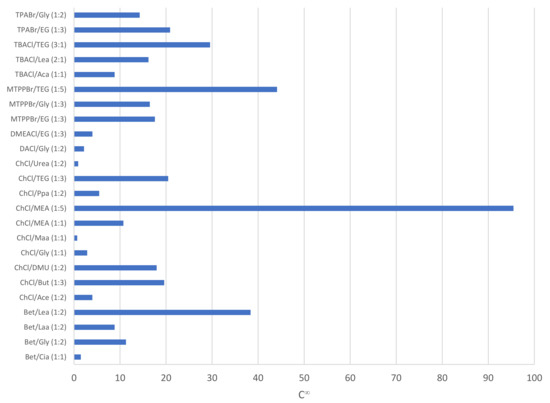
Figure 2.
Capacity of phenol in various DESs.
Figure 3a displays the selectivity at infinite dilution for the DESs in a phenol/toluene system, and Figure 3b shows this for the phenol/heptane system. From these figures, it is obvious that ChCl-based DESs bear a superior selectivity towards phenol compared to both toluene and heptane. The selectivity of DES towards phenol in heptane is greater by an order of magnitude when compared to the selectivity of DES towards phenol in toluene. This means that the DES is more selective toward phenol when the model oil consists of straight-chain hydrocarbons like heptane than when it is made up of more aromatic compounds like toluene, due to competing pi–pi interactions between phenol/toluene that do not exist with heptane as solvent.
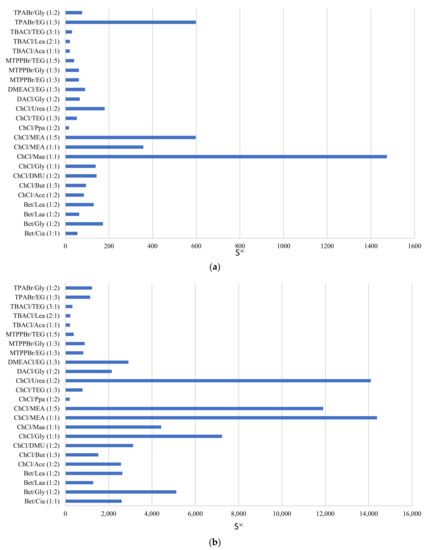
Figure 3.
Selectivity of phenol in DESs using (a) toluene and (b) heptane as the model oil.
Nevertheless, it is more meaningful to evaluate the DES based on the parameter performance index (PI), which is a product of the capacity and selectivity at infinite dilution, as described in Equation (3). PI considers both the capability of the solvent in extracting the solute (phenol) and in being selective toward the solute compared to the carrier phase (toluene or heptane).
Figure 4 shows the PI of the DESs for the separation of phenol from toluene (Figure 4a) and for the separation of phenol from heptane (Figure 4b). In both Figure 4a,b, the DES ChCl:MEA (1:5) shows superior performance in extracting phenol from both toluene and heptane. Therefore, we selected ChCl:MEA (1:5) for the experimental LLE work based on its superior performance. Furthermore, we selected one phosphonium-based DES (MTPPBr:EG, 1:3 molar ratio) to compare the performance with the ammonium-based DESs.
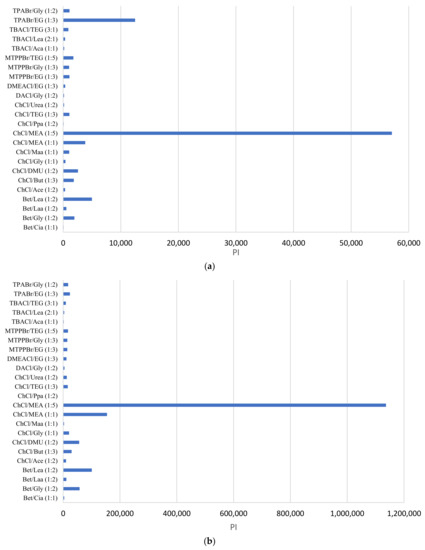
Figure 4.
Performance index of DESs for the separation of (a) phenol in toluene, and (b) phenol in heptane.
Thereafter, the σ-profile and σ-potential of the selected DESs, MTPPBr/EG (1:3) and ChCl/MEA (1:5), towards model pyrolysis oil were generated. Figure 5 shows the σ-profiles of all the species involved in the system, where Figure 5a shows the σ-profile for the system ChCl/MEA (1:5), phenol, heptane, and toluene; and Figure 5b shows that for the system MTPPBr/EG (1:3), phenol, heptane, and toluene. In COSMO-RS, species with a narrow σ-profile correspond to low polarity, while species with a more broad range correspond to higher polarity [6]. From the figure, heptane shows a peak within the range of −0.008 eA−2 < σ < 0.008 eA−2, which lies in the non-polar region. This indicates the presence of van der Waals forces, as these forces occur between non-polar molecules. The forces allow molecules of heptane to attract each other and hold the molecules together [29]. Toluene is more polarized than heptane due to the presence of an aromatic ring in its structure; thus, the σ-profile of toluene is distributed wider in the range of −0.005 eA−2 < σ < +0.005 eA−2, but it still shows characteristics of a non-polar species.
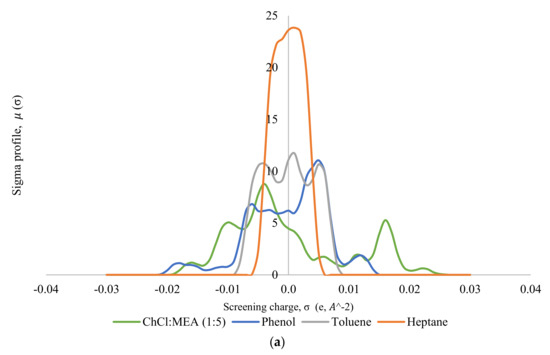
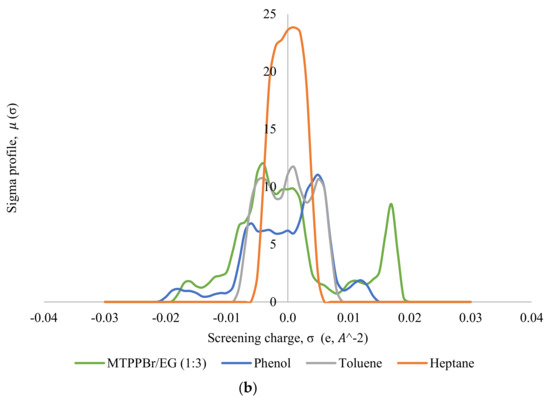
Figure 5.
σ-profiles of species in the phenol-containing system; (a) is for the system containing the DES ChCl:MEA (1:5), and (b) is for the system containing the DES MTPPBr/EG (1:3).
Phenol shows a symmetric σ-profile with peaks in both H-bond acceptor and H-bond donor regions. The peak at +0.005 eA−2 for phenol indicates the -face of the aromatic ring, and the peak at −0.006 eA−2 is due to the polarized hydrogens. The hydroxyl group attached to the aromatic rings increases the polarity of the phenol moiety overall with the highly polar hydrogen atom bonded to the oxygen, which is strongly electronegative. The electron pairs of oxygen atoms cause partial transfer of negative charge from the oxygen atom to the carbon atom on the ring, thereby delocalizing the -electron charges [30]. Phenol can be the H-bond acceptor and donor.
In Figure 5a, the σ-profile of the DES ChCl/MEA (1:5) indicates high compatibility with phenol thanks to the dual role of hydrogen bond donor and hydrogen bond acceptor towards phenol, where it shows significant peaks at σ < −0.011 eA−2 and at σ > +0.011 eA−2. ChCl/MEA (1:5) is generally more polarized compared to MTPPBr/EG (1:3). Figure 5b shows a peak at +0.017 eA−2, which represents the bromide ion in the DES MTPPBr/EG (1:3) and at +0.011 eA−2, corresponding to the presence of an oxygen atom in ethylene glycol. It confirms that the DES is able to enable hydrogen bonding interaction with phenolic compounds and act as H-bond donor [31]. As seen from Figure 5, the σ-profile of the DES is complementary to the σ-profiles of phenol, and not with heptane and toluene, which explains the good capacity and selectivity of the DES towards phenol.
Figure 6 shows the σ-potentials of all the species involved in the system, where Figure 6a shows the σ-potentials for the system ChCl/MEA (1:5), phenol, toluene, and heptane; and Figure 6b shows that for the system MTPPBr/EG (1:3), phenol, toluene, and heptane. In σ-potential, negative (σ) values correspond to better affinity of the species at that σ, which means more interaction between the molecules. Positive (σ) values, on the other hand, indicate increasing repulsive interaction between molecules [6]. As seen from Figure 6, heptane and toluene have a parabolic potential curve centered at σ = 0; thus, interaction can only occur at the non-polar region. This is a characteristic of non-polar hydrocarbons. The small gap between the potential curves of DES with heptane and toluene indicates minor hydrophobicity towards each other, thus ensuring minimal interaction between the two solvents [29].
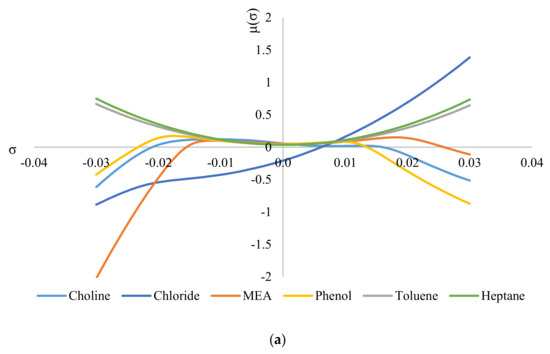
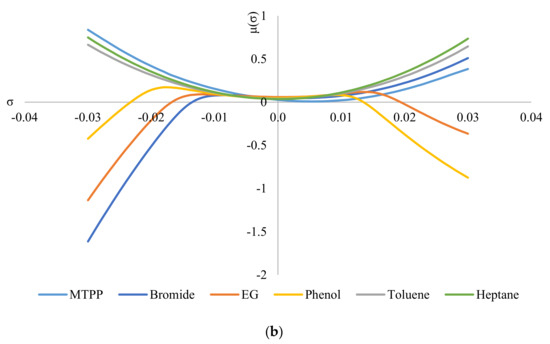
Figure 6.
σ−potentials of species in the phenol−containing systems: (a) systems containing the DES ChCl:MEA, and (b) systems containing the DES MTPPBr:EG.
When comparing Figure 6a with Figure 6b, the constituents for ChCl:MEA (1:5) show greater presence and affinity as hydrogen bond donors compared to MTPPBr/EG (1:3). This can be seen from the negative values of μ for choline cation, chloride anion, MEA, and phenol. Except for chloride anion, all the other DES constituents show negative values of μ on both sides of the graph, i.e., they have affinity towards both hydrogen bond donors and hydrogen bond acceptors. Meanwhile, for MTPPBr/EG (1:3), the methyltriphenylphosphonium cation does not have negative μ values on the right side of the graph, thus limiting the affinity towards hydrogen bond acceptors.
4.2. Physical Properties of DES
Both MTPPBr/EG (1:3) and ChCl/MEA (1:5) DESs were stable at room temperature after synthesis and remained in liquid form after 24 h. The physical properties of the DESs were measured. Density and viscosity were both measured in a temperature range of 303.15–333.15 K.
Figure 7 shows that density decreases with increasing temperature. This is due to the increase in thermal energy from heating leading to higher molecular mobility, and thus, reduced density. For DES formed with hydroxyl group HBDs, density increases with increasing hydroxyl group [32]. MTPPBr/Gly DES has higher density (1.3 g/cm3) than MTPPBr/EG (1:3) due to the presence of more hydroxyl groups, but viscosity dramatically drops with temperature for the latter, reaching a similar value to that of ChCl/MEA (1:5) [25]. The experimental density for MTPPBr/EG (1:3) found in this work was compared to values reported in the literature, and it was found that the experimental values were close to the values reported by [32] for MTPPBr/EG DES, with a density of 1.238 g/cm3 at 303.15 K. Similarly, the experimental density of ChCl/MEA (1:5) was 1.05 g/cm3 at 303.15 K, which is close to the value (1.07 g/cm3) reported by Mjalli et al. [33]. The relationship between density and temperature is expressed below
where is the density in g/cm3, T is the temperature in , and and are fitting parameters. The change in with shows a linear trend.
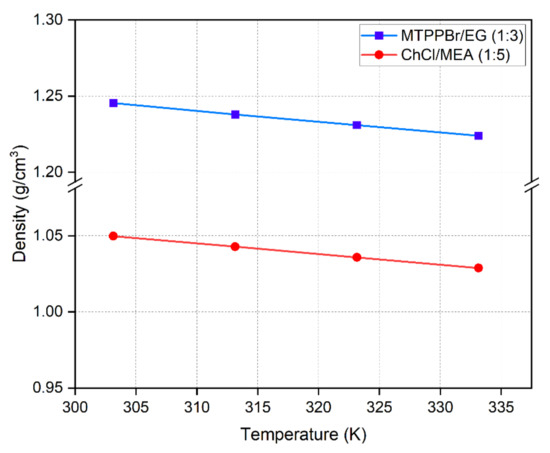
Figure 7.
Density of DESs as a function of temperature.
Meanwhile, the viscosity–temperature relationship is expressed following the Arrhenius model,
where is the dynamic viscosity, is the pre-exponential constant, is the activation energy divided by gas constant, R, and is temperature in K. Figure 8 shows that viscosity exponentially decreases with increasing temperature. The increase in thermal energy causes DES molecules to move further apart, leading to availability of a large space that permits free movement of molecules, decreasing viscosity. The experimental viscosity results also show a trend with consistent with the values reported by [32,33].
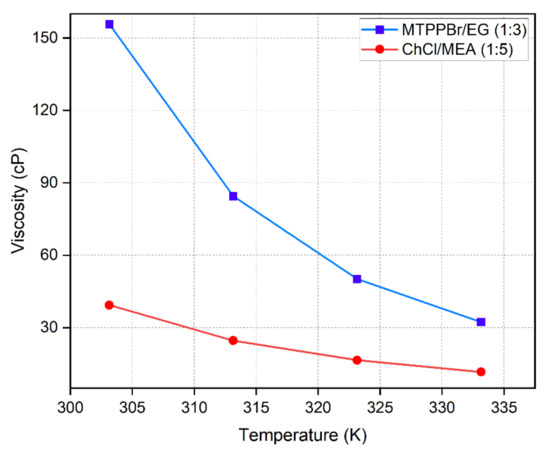
Figure 8.
Viscosity of DESs as a function of temperature.
4.3. Experimental Results
The LLE data of ternary systems were experimentally obtained at 298.15 K and 101 kPa bar to investigate the performance of ammonium and phosphonium-based DESs towards the extraction of phenol from model pyrolysis oil. Table 4 presents the acquired LLE data, which are visually represented as triangular ternary plots in Figure 9. The distribution coefficient values (D) obtained from the experimental LLE data may be used to further evaluate the extraction performance of both DESs and are presented in Table 4. As the composition of phenol increases in the feed, the fraction of toluene decreases in the raffinate phase. However, the concentration of phenol remaining in the raffinate phase for all feed compositions is still very small. It was also observed that the concentrations of phenol left in the raffinate phase were very minute, indicating almost quantitative extraction. However, the presence of toluene in the extract (DES) phase for the systems {toluene (1) + phenol (2) + MTPPBr/EG (1:3) (3)} and {toluene (1) + phenol (2) + ChCl/MEA (1:5) (3)} were quite noticeable, indicating that a further purification step of phenol from the extraction phase may be necessary.
Table 4.
Ternary LLE data for systems {toluene or heptane (1) + phenol (2) + MTPPBr/EG (1:3) (3)} and {toluene or heptane (1) + phenol (2) + ChCl/MEA (1:5) (3)} at 298.15 K and 101 kPa, as well as distribution ratio, D of DESs towards phenol.
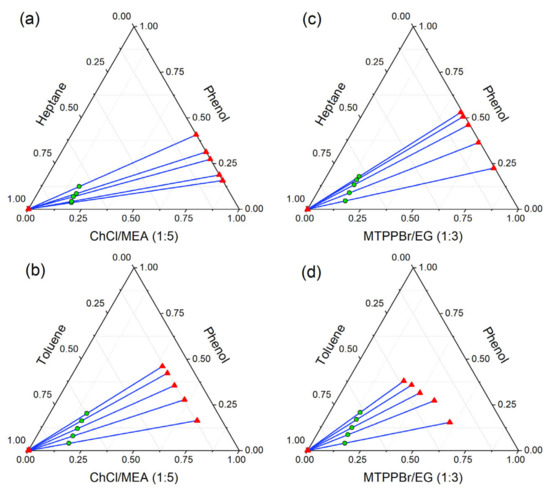
Figure 9.
Ternary liquid–liquid equilibrium diagram in mole fraction for (a) heptane (1) + phenol (2) + ChCl/MEA (1:5) (3); (b) heptane (1) + phenol (2) + MTPPBr/EG (1:3) (3); (c) toluene (1) + phenol (2) + ChCl/MEA (1:5) (3); and (d) toluene (1) + phenol (2) + MTPPBr/EG (1:3) (3).
The selection of an appropriate solvent and the determination of the cost of the liquid–liquid extraction process are both highly dependent on the mutual solubility between extract and raffinate phases, which is of critical relevance. DES samples from the hydrocarbon-rich phases were examined using an 1H NMR spectrometer to ensure that the presence of the compound could be regarded as minimal in these phases. The 1H NMR spectra were recorded using a JEOL RESONANCE spectrometer ECX-500 II, with dimethyl sulfoxide (DMSO-D6) as the solvent at 24 °C. NMR results revealed that there was no detectable quantity of DESs in the raffinate phases of all ternary systems, as shown in Figures S3–S6 in the Supplementary Materials. These findings imply that no additional solvent recovery is required following the extraction process, thus reducing both the operating and capital costs of the extraction process.
The triangular phase diagrams shown in Figure 9 indicate that all ternary systems exhibit Type I phase behavior, where they show only one immiscibility region and one of the binary systems exhibits partial immiscibility.
As can be seen from Figure 9, all of the systems have positive tie-line slopes, indicating that the quantity of phenol in the DES-rich phase is greater than in the toluene/heptane-rich phase at equilibrium. This implies that a reduced amount of solvent is needed to perform a high degree of extraction. Furthermore, the slopes increase with increasing phenol (solute) concentration. This suggests that the lower the solute concentration, the higher the concentration of solvent (DES) required to extract the solute from the solution. It can also be observed from Figure 9 that the higher the length of the tie-lines, the greater the immiscibility.
Each experiment was performed in triplicate, and the standard deviations (STDEVs) for all ternary systems are provided in the Supporting Materials (Tables S1–S8).
The distribution ratio is related to the solvent’s solute-carrying capacity (DES) and measures the amount of solvent required for extraction. The selectivity of a solvent is a measure of its ability to remove a solute (phenol) from a diluent (hydrocarbons). D and S can be expressed as follows:
where is the solute composition and is the model oil composition. Superscripts and refer to the extract and raffinate phases respectively.
For ternary systems including {toluene/heptane + phenol + MTPPBr/EG (1:3)} and {toluene/heptane + phenol + ChCl/MEA (1:5)}, the plots of D and S are shown in Figure 10 and Figure 11, respectively, as a function of the phenol mole fraction in the feed. Both ammonium and phosphonium-based DESs can be employed as efficient solvents for the extraction of phenolic compounds from model pyrolysis oil, since the S values are always greater than 1. To achieve a high separation efficiency, a smaller amount of solvent is needed, resulting in reduced operating costs, as the distribution coefficient values obtained in this study are higher than unity. According to Meindersma and de Haan [34], selectivity is directly linked to the number of stages required, and hence to the extraction column size. To achieve a given separation degree with fewer steps, higher selectivity is needed. The distribution ratio, on the other hand, reflects the needed flow rate of the solvent. It is true that a higher distribution ratio requires a lower solvent-to-feed ratio. As a result, the most cost-effective solution would be to use smaller extraction equipment that requires less capital and energy. In the case of toluene as a model oil, the distribution coefficient, D, and the selectivity, S, show a decreasing trend with increadsing phenol concentration in the feed solution for both DESs. Hence, the removal of phenol towards the DES-rich phase is more satisfactory at low concentrations of phenol.
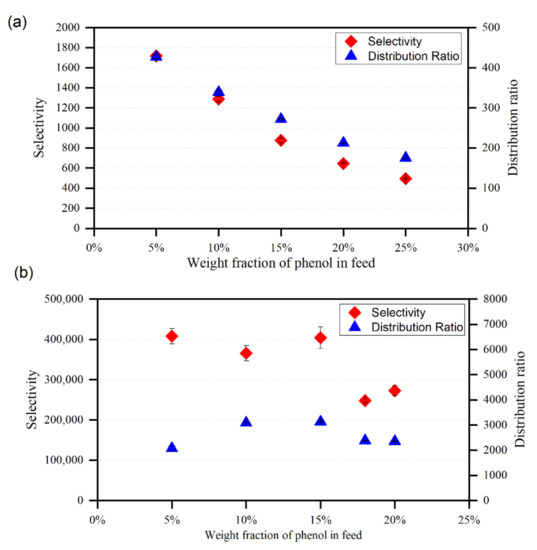
Figure 10.
Variation of the selectivity and distribution ratio with phenol mole fraction in the feed for (a) {toluene + phenol + MTPPBr/EG (1:3)}, (b) {heptane + phenol + MTPPBr/EG (1:3)}.
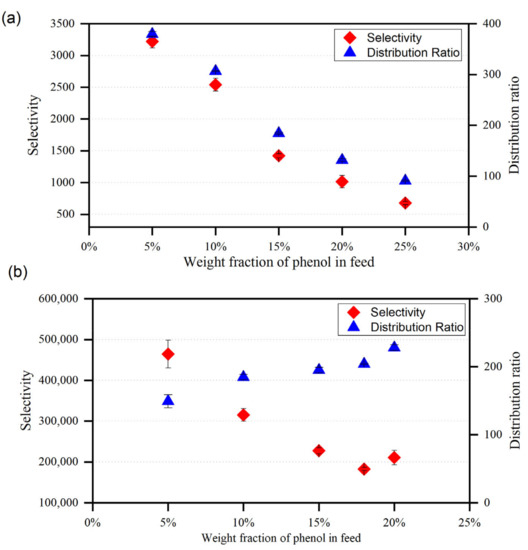
Figure 11.
Variation of the selectivity and distribution ratio with phenol mole fraction in the feed for (a) {toluene + phenol + ChCl/MEA (1:5)}, (b) {heptane + phenol + ChCl/MEA (1:5)}.
In comparison with MTPPBr/EG (1:3), the selectivity profiles presented in Figure 10 and Figure 11 suggest that the DES ChCl/MEA (1:5) exhibits greater selectivity values for the removal of phenol from toluene. This might be because the ternary systems comprising MTPPBr/EG (1:3) have greater toluene concentrations in the extract phase than those containing ChCl/MEA. (1:5). Even though MTPPBr/EG (1:3) has a greater distribution coefficient towards phenolic compounds, it also has a more favorable interaction with toluene than ChCl/MEA (1:5).
The high D obtained proves that MTPPBr/EG (1:3) is suitable for use as a solvent for phenol extraction from model oil, as it means that less solvent is required to perform the extraction process. Since D >1, it is indicated that a large amount of phenol can be extracted in a single stage, and only a small amount of solvent is required for the subsequent extraction stage. Moreover, the S obtained is >1, which also indicates that extraction using MTPPBr/EG (1:3) DES is feasible. In addition, the equilibrium concentration of DES in raffinate phase is zero, which shows that there is no cross-contamination occurring during extraction.
4.4. Consistency Test
The reliability of ternary liquid–liquid equilibrium tie-lines was checked using the Hand (Equation (8)) and Othmer–Tobias (Equation (9)) correlations, which are expressed below.
For the Hand correlation, , and correspond to the mass composition of phenol in the raffinate phase, the molar composition of heptane or toluene in the raffinate phase, and the mass composition of DES in the extract phase, respectively. For the Othmer–Tobias correlation, corresponds to the mass composition of DES in the raffinate phase, and the constants a, b, c and d are the fitting parameters. The linear regression data and fitting parameters for both correlations are displayed in Table 5. Both correlations show a linear regression >0.9.
Table 5.
Linear regression data and fitting parameters of Hand and Othmer–Tobias correlation for the ternary LLE system.
5. Conclusions
In this work, two DESs, MTPPBr/EG and ChCl/MEA, were synthesized at a molar ratio of 1:3 and 1:5, respectively. These DESs were used for the liquid–liquid extraction of phenolic compounds from pyrolysis oil. The ability of the synthesized DESs to selectively extract phenol from model oil were demonstrated as it was possible to extract a large amount of phenol in a single extraction stage, based on the high values of distribution ratio reported from the LLE experiments. To investigate the effectiveness of ammonium- and phosphonium-based DESs in the extraction of phenol from model pyrolysis oil, LLE data of ternary systems were acquired experimentally at 298.15 K and 101 kPa pressure. In the removal of phenol from toluene, ChCl/MEA (1:5) exhibited higher selectivity values than MTPPBr/EG (1:3). This could be due to the fact that the toluene content in the extract phase was higher in the ternary systems containing MTPPBr/EG (1:3) than in the systems containing ChCl/MEA (1:5). Although MTPPBr/EG (1:3) had a higher distribution coefficient for phenolic compounds, it also had a more favorable interaction with toluene compared to ChCl/MEA (1:5). Furthermore, the DESs were not found in the raffinate phase, which showed no cross-contamination. In addition, the performance of COSMO-RS was evaluated, and it was observed that COSMO-RS is a reliable tool for predicting the thermodynamic properties of molecules, such as the activity coefficient at infinite dilution, as well as for screening a wide variety of DESs. This prediction is in qualitative and quantitative agreement with the experimental results. The σ-profile and σ-potential are also useful for explaining the interaction of DESs with phenolic compounds. From the σ-profile and σ-potential generated, it was shown that the DES had good intermolecular interaction with phenol due to the hydrogen bonding, allowing phenol to be extracted. The DES also had high polarity compared to the model oil. All in all, the DES selected via COSMO-RS prediction proved to be a good solvent for efficiently extracting phenol from the model oil.
Supplementary Materials
The following supporting information can be downloaded at: https://www.mdpi.com/article/10.3390/separations9110336/s1, Table S1: Data for Figure 1—Benchmarking the COSMO-RS prediction by comparing the log of distribution ratio of phenol in various solvents based on experimental data reported by Burghoff et al.; Table S2: Standard deviation (STDEV) for the ternary system MTPPBr/EG (1:3) (1)/phenol (2)/toluene (3) for mole fractions x: Top layer.; Table S3: Standard deviation (STDEV) for the ternary system MTPPBr/EG (1:3) (1)/phenol (2)/toluene (3) for mole fractions x: bottom layer.; Table S4: Standard deviation (STDEV) for the ternary system MTPPBr/EG (1:3) (1)/phenol (2)/heptane (3) for mole fractions x: Top layer.; Table S5: Standard deviation (STDEV) for the ternary system MTPPBr/EG (1:3) (1)/phenol (2)/heptane (3) for mole fractions x: bottom layer.; Table S6: Standard deviation (STDEV) for the ternary system ChCl/EtA (1:5) (1)/phenol (2)/toluene (3) for mole fractions x: Top layer.; Table S7: Standard deviation (STDEV) for the ternary system ChCl/EtA (1:5) (1)/phenol (2)/toluene (3) for mole fractions x: bottom layer.; Table S8: Standard deviation (STDEV) for the ternary system ChCl/EtA (1:5) (1)/phenol (2)/heptane (3) for mole fractions x: Top layer.; Figures S1 and S2: GC calibration curve of heptane/phenol and toluene/phenol Figures S3 and S4: 1H NMR spectra of MTPPBr/EG (1:3) and ChCl/MEA (1:5) pure DESs in DMSO-d6; Figures S5 and S6: 1H NMR spectra of MTPPBr/EG (1:3) and ChCl/MEA (1:5): (a) pure DES; and (b) heptane-rich phase (Top Layer); Tables S1–S8: Standard deviation (STDEV) for all ternary system.
Author Contributions
Conceptualization, H.F.H. and M.K.H.-K.; Methodology, H.F.H. and L.E.B.; Software, H.F.H., N.A.M.H. and M.K.H.-K.; Validation, H.F.H., J.-M.L. and M.K.H.-K.; Formal Analysis, I.W. and L.E.B.; Investigation, M.K.H.-K., L.E.B. and I.W.; Resources, H.F.H. and M.K.H.-K.; Data Curation, H.F.H., N.A.M.H. and M.K.H.-K.; Writing—H.F.H., N.A.M.H. and I.W.; Writing—Review and Editing, H.F.H., J.-M.L., M.A.H. and M.K.H.-K.; Supervision, M.K.H.-K.; Project Administration, H.F.H., M.A.H. and M.K.H.-K.; Funding Acquisition, M.K.H.-K. All authors have read and agreed to the published version of the manuscript.
Funding
This research was funded by the Researchers Supporting Project number (RSP-2021/361), King Saud University, Riyadh, Saudi Arabia.
Institutional Review Board Statement
Not applicable.
Informed Consent Statement
Not applicable.
Conflicts of Interest
The authors declare no conflict of interest.
References
- Venkata Mohan, S.; Pandey, A. Chapter 1—Sustainable Hydrogen Production: An Introduction. In Biohydrogen, 2nd ed.; Pandey, A., Mohan, S.V., Chang, J.-S., Hallenbeck, P.C., Larroche, C., Eds.; Elsevier: Amsterdam, The Netherlands, 2019; pp. 1–23. [Google Scholar]
- Yang, H.; Yao, J.; Chen, G.; Ma, W.; Yan, B.; Qi, Y. Overview of upgrading of pyrolysis oil of biomass. Energy Procedia 2014, 61, 1306–1309. [Google Scholar] [CrossRef]
- Salleh, M.Z.M.; Hadj-Kali, M.; Wazeer, I.; Ali, E.; Hashim, M.A. Extractive separation of benzene and cyclohexane using binary mixtures of ionic liquids. J. Mol. Liq. 2019, 285, 716–726. [Google Scholar] [CrossRef]
- Mulyono, S.; Hizaddin, H.F.; Wazeer, I.; Alqusair, O.; Ali, E.; Hashim, M.A.; Hadj-Kali, M.K. Liquid-liquid equilibria data for the separation of ethylbenzene/styrene mixtures using ammonium-based deep eutectic solvents. J. Chem. Thermodyn. 2019, 135, 296–304. [Google Scholar] [CrossRef]
- Hadj-Kali, M.K.; Al-Anazi, A.M.; Alhawtali, S.M.; Wazeer, I. Liquid-liquid separation of n-hexane/1-hexene and cyclohexane/cyclohexene using deep eutectic solvents. J. Mol. Liq. 2021, 344, 117776. [Google Scholar]
- Mulyono, S.; Hizaddin, H.F.; Alnashef, I.M.; Hashim, M.A.; Fakeeha, A.H.; Hadj-Kali, M.K. Separation of BTEX aromatics from n-octane using a (tetrabutylammonium bromide + sulfolane) deep eutectic solvent—experiments and COSMO-RS prediction. RSC Adv. 2014, 4, 17597–17606. [Google Scholar] [CrossRef]
- Hadj-Kali, M.K.; Althuluth, M.; Mokraoui, S.; Wazeer, I.; Ali, E.; Richon, D. Screening of ionic liquids for gas separation using COSMO-RS and comparison between performances of ionic liquids and aqueous alkanolamine solutions. Chem. Eng. Commun. 2020, 207, 1264–1277. [Google Scholar] [CrossRef]
- Płotka-Wasylka, J.; De la Guardia, M.; Andruch, V.; Vilková, M. Deep eutectic solvents vs ionic liquids: Similarities and differences. Microchem. J. 2020, 159, 105539. [Google Scholar] [CrossRef]
- Wazeer, I.; Hadj-Kali, M.K.; Al-Nashef, I.M. Utilization of deep eutectic solvents to reduce the release of hazardous gases to the atmosphere: A critical review. Molecules 2020, 26, 75. [Google Scholar] [CrossRef]
- Wazeer, I.; AlNashef, I.M.; Al-Zahrani, A.A.; Hadj-Kali, M.K. The subtle but substantial distinction between ammonium-and phosphonium-based deep eutectic solvents. J. Mol. Liq. 2021, 332, 115838. [Google Scholar] [CrossRef]
- Shahbaz, K.; Mjalli, F.; Hashim, M.; AlNashef, I. Using deep eutectic solvents based on methyl triphenyl phosphunium bromide for the removal of glycerol from palm-oil-based biodiesel. Energ Fuel 2011, 25, 2671–2678. [Google Scholar] [CrossRef]
- Tang, B.; Zhang, H.; Row, K.H. Application of deep eutectic solvents in the extraction and separation of target compounds from various samples. J. Sep. Sci. 2015, 38, 1053–1064. [Google Scholar] [CrossRef] [PubMed]
- Rodriguez, N.R.; Requejo, P.F.; Kroon, M.C. Aliphatic–aromatic separation using deep eutectic solvents as extracting agents. Ind. Eng. Chem. Res. 2015, 54, 11404–11412. [Google Scholar] [CrossRef]
- Hadj-Kali, M.K.; Salleh, M.Z.M.; Wazeer, I.; Alhadid, A.; Mulyono, S. Separation of Benzene and Cyclohexane Using Eutectic Solvents with Aromatic Structure. Molecules 2022, 27, 4041. [Google Scholar] [CrossRef] [PubMed]
- Jiao, T.; Qin, X.; Zhang, H.; Zhang, W.; Zhang, Y.; Liang, P. Separation of phenol and pyridine from coal tar via liquid–liquid extraction using deep eutectic solvents. Chem. Eng. Res. Des. 2019, 145, 112–121. [Google Scholar] [CrossRef]
- Jiao, T.; Zhuang, X.; He, H.; Li, C.; Chen, H.; Zhang, S. Separation of phenolic compounds from coal tar via liquid–liquid extraction using amide compounds. Ind. Eng. Chem. Res. 2015, 54, 2573–2579. [Google Scholar] [CrossRef]
- Yi, L.; Feng, J.; Li, W.-Y. Separation of phenolic compounds from coal liquefaction oil by choline chloride-glycerol deep eutectic solvents. Energy Procedia 2019, 158, 5169–5174. [Google Scholar] [CrossRef]
- Li, G.; Xie, Q.; Liu, Q.; Liu, J.; Wan, C.; Liang, D.; Zhang, H. Separation of phenolic compounds from oil mixtures by betaine-based deep eutectic solvents. Asia-Pac. J. Chem. Eng. 2020, 15, e2515. [Google Scholar] [CrossRef]
- Wojeicchowski, J.P.; Ferreira, A.M.; Abranches, D.O.; Mafra, M.R.; Coutinho, J.A. Using COSMO-RS in the Design of Deep Eutectic Solvents for the Extraction of Antioxidants from Rosemary. ACS Sustain. Chem. Eng. 2020, 8, 12132–12141. [Google Scholar] [CrossRef]
- Paduszyński, K. An overview of the performance of the COSMO-RS approach in predicting the activity coefficients of molecular solutes in ionic liquids and derived properties at infinite dilution. Phys. Chem. Chem. Phys. 2017, 19, 11835–11850. [Google Scholar] [CrossRef]
- Bajkacz, S.; Adamek, J. Development of a Method Based on Natural Deep Eutectic Solvents for Extraction of Flavonoids from Food Samples. Food Anal. Methods 2018, 11, 1330–1344. [Google Scholar] [CrossRef]
- Wibowo, H.; Liao, W.; Zhou, X.; Yu, C.; Rahim, D.A.; Hantoko, D.; Qun, H.; Yan, M. Study on the effect of operating parameters towards CO2 absorption behavior of choline chloride–monoethanolamine deep eutectic solvent and its aqueous solutions. Chem. Eng. Process.-Process Intensif. 2020, 157, 108142. [Google Scholar] [CrossRef]
- García, A.; Rodríguez-Juan, E.; Rodríguez-Gutiérrez, G.; Rios, J.J.; Fernández-Bolaños, J. Extraction of phenolic compounds from virgin olive oil by deep eutectic solvents (DESs). Food Chem. 2016, 197, 554–561. [Google Scholar] [CrossRef] [PubMed]
- Smith, E.L.; Abbott, A.P.; Ryder, K.S. Deep Eutectic Solvents (DESs) and Their Applications. Chem. Rev. 2014, 114, 11060–11082. [Google Scholar] [CrossRef] [PubMed]
- Garcia, G.; Aparicio, S.; Ullah, R.; Atilhan, M. Deep eutectic solvents: Physicochemical properties and gas separation applications. Energy Fuel 2015, 29, 2616–2644. [Google Scholar] [CrossRef]
- Van Osch, D.J.G.P.; Dietz, C.H.J.T.; Warrag, S.E.E.; Kroon, M.C. The Curious Case of Hydrophobic Deep Eutectic Solvents: A Story on the Discovery, Design, and Applications. ACS Sustain. Chem. Eng. 2020, 8, 10591–10612. [Google Scholar] [CrossRef]
- Jibril, B.; Mjalli, F.; Naser, J.; Sani Gano, Z. New tetrapropylammonium bromide-based deep eutectic solvents: Synthesis and characterizations. J. Mol. Liq. 2014, 199, 462–469. [Google Scholar] [CrossRef]
- Burghoff, B.; Goetheer, E.L.V.; Haan, A.B.d. COSMO-RS-Based Extractant Screening for Phenol Extraction As Model System. Ind. Eng. Chem. Res. 2008, 47, 4263–4269. [Google Scholar] [CrossRef]
- Kamarudin, A.F.; Hizaddin, H.F.; El-Blidi, L.; Ali, E.; Hashim, M.A.; Hadj-Kali, M.K. Performance of p-Toluenesulfonic Acid–Based Deep Eutectic Solvent in Denitrogenation: Computational Screening and Experimental Validation. Molecules 2020, 25, 5093. [Google Scholar] [CrossRef]
- Sobiesiak, M. Chemical Structure of Phenols and Its Consequence for Sorption Processes. In Phenolic Compounds-Natural Sources, Importance and Applications; IntechOpen: London, UK, 2017. [Google Scholar]
- Lemaoui, T.; Darwish, A.S.; Hammoudi, N.E.H.; Abu Hatab, F.; Attoui, A.; Alnashef, I.M.; Benguerba, Y. Prediction of Electrical Conductivity of Deep Eutectic Solvents Using COSMO-RS Sigma Profiles as Molecular Descriptors: A Quantitative Structure–Property Relationship Study. Ind. Eng. Chem. Res. 2020, 59, 13343–13354. [Google Scholar] [CrossRef]
- Ibrahim, R.K.; Hayyan, M.; AlSaadi, M.A.; Ibrahim, S.; Hayyan, A.; Hashim, M.A. Physical properties of ethylene glycol-based deep eutectic solvents. J. Mol. Liq. 2019, 276, 794–800. [Google Scholar] [CrossRef]
- Mjalli, F.S.; Murshid, G.; Al-Zakwani, S.; Hayyan, A. Monoethanolamine-based deep eutectic solvents, their synthesis and characterization. Fluid Phase Equilib. 2017, 448, 30–40. [Google Scholar] [CrossRef]
- Meindersma, G.W.; De Haan, A.B. Conceptual process design for aromatic/aliphatic separation with ionic liquids. Chem. Eng. Res. Des. 2008, 86, 745–752. [Google Scholar] [CrossRef]


Publisher’s Note: MDPI stays neutral with regard to jurisdictional claims in published maps and institutional affiliations. |
© 2022 by the authors. Licensee MDPI, Basel, Switzerland. This article is an open access article distributed under the terms and conditions of the Creative Commons Attribution (CC BY) license (https://creativecommons.org/licenses/by/4.0/).