Article

Influence of Feed Rate on the Performance of Hydrocyclone Flow Field

1
College of Mechanical & Electronic Engineering, Shandong University of Science and Technology, Qingdao 266590, China
2
Nanjing CAS BIDUN NEWMEM Technology Co., Ltd., Nanjing 210032, China
*
Author to whom correspondence should be addressed.
Separations 2022, 9(11), 349; https://doi.org/10.3390/separations9110349
Submission received: 21 September 2022 / Revised: 12 October 2022 / Accepted: 2 November 2022 / Published: 4 November 2022
(This article belongs to the Special Issue Research on Separation Performance of Separator)

Abstract

:
In order to clarify the influence of feed rate on a hydrocyclone flow field, numerical simulation was employed to model the influence of feed rate on the pressure field, velocity field, air column, turbulent kinetic energy, and split ratio. The results revealed that static pressure, tangential velocity, and radial velocity increased with an increase in the feed rate. When the feed rate at the inlet increases from 1 m/s to 5 m/s, the static pressure increases from 5.49 kPa to 182.78 kPa, tangential velocity increases from 1.97 m/s to 11.16 m/s, and radial velocity increases from 0.20 m/s to 1.16 m/s demonstrating that a high feed rate facilitated the strengthening separation of the flow field. Meanwhile, with the increase in the feed rate, the split ratio of the hydrocyclone decreased, indicating that the concentration effect of the hydrocyclone improved. Additionally, the formation time of the air column was reduced, and the flow field became more stable. Nevertheless, the axial velocity and the turbulent kinetic energy also increased with the increase in the feed rate, and the increase in the axial velocity reduced the residence time of the material in the hydrocyclone, which was not conducive to the improvement of separation accuracy. In addition, the increase in turbulent kinetic energy led to an increase in energy consumption, which was not conducive to the improvement of the comprehensive performance of the hydrocyclone. Therefore, choosing an appropriate feed rate is of great significance to the regulation of the flow field and the improvement of hydrocyclone separation performance.

1. Introduction

Hydrocyclone is a commonly used solid-liquid separation equipment, which is widely used in coal [1], petroleum [2], chemical industry [3] and other fields, because of its simple structure and excellent performance. However, the internal flow field of the hydrocyclone often changes with the change in operation parameters [4] and structural parameters [5], which in turn affects the hydrocyclone separation performance, of which the feed rate is an important operating parameter [6]. Therefore, studying the effect of feed rate on the internal flow field of the hydrocyclone can lay a theoretical foundation for analyzing the relationship between the feed rate and separation performance.
Guo et al. [7] reported that a variation in feed rate also caused changes in the pressure field and velocity field in the internal flow field of the hydrocyclone, and then affected the distribution law of the underflow and overflow products. Increasing the feed rate reduced the cutting particle size of the hydrocyclone and improved its classification accuracy and separation efficiency [8,9,10]. Meanwhile, increasing the feed rate increased the centrifugal force on the particles, thereby increasing the separation efficiency of the hydrocyclone [11,12,13]. Despite the initial increase in separation efficiency with the increase in feed rate, it eventually stabilized and no longer increased with the increase in feed rate [14,15]. Although the increase in feed rate improved the separation efficiency of the hydrocyclone, an excessively high feed rate made the turbulence too strong, which would reduce the separation efficiency of the hydrocyclone [7,16]. Im et al. [17] found that increasing the feed rate increased the overflow yield and decreased the separation efficiency. Tang et al. [18] reported that an excessively high feed rate would enhance the centrifugal force on the fine particles, reduce the overflow separation efficiency, and reduce the classification accuracy of the hydrocyclone. Li et al. [19] reported that an excessively high or excessively low feed rate would increase the disorder of particles within the hydrocyclone, thereby reducing the separation performance. Zhu and Liow [20] found that increasing the feed rate would enhance the fishhook effect of hydrocyclone separation, which was detrimental to the separation performance. Indeed, increasing the feed rate was beneficial for improving the separation performance, but a higher feed rate increased energy consumption [21,22]. Jiang et al. [23] and Jiang et al. [24] found that increasing the feed rate improved the separation performance of the two-stage and composite hydrocyclones, respectively.
In summary, the feed rate is an important operating parameter that affects the flow field and separation performance inside the hydrocyclone. However, the mechanism of the effect of feed rate on the internal flow field performance of hydrocyclone is still unclear. In order to improve the separation performance of the hydrocyclone, the numerical simulation method was used in this study to further study the effect of feed rate on the velocity field, pressure field, air column, turbulent kinetic energy, and split ratio in the hydrocyclone flow field, in order to provide a theoretical reference for improving the hydrocyclone separation performance.

2. Numerical Simulation Method

2.1. Modeling

3D modeling of a hydrocyclone with Ø75 mm, whose structure is shown in Figure 1a, was achieved using Solidworks. Table 1 lists the relevant structural parameters. The model was meshed with hexahedrons using ICEM CFD, as shown in Figure 1b.

2.2. Boundary Conditions

To compare and analyze the effect of feed rate on the flow field inside the hydrocyclone, numerical simulation was performed using Fluent. Among them, the multiphase flow model was of the volume of fluid (VOF) type. The VOF model was a simplified Euler–Eulerian mixing model, which could capture the gas-liquid interface of the air column in the hydrocyclone [25]. The sum of the volume fractions of each phase was 1, and the mathematical model is shown in Equation (1). The RSM (Reynolds Stress Model) model was used as the turbulence model. However, Shapiro et al. [26] propose a numerical simulation method for variable density incompressible fluids, which improves the computational accuracy of the numerical simulation of incompressible fluids. However, the RSM model is more suitable for the numerical simulation of hydrocyclones [27], which could well predict the change in the turbulence of the flow field in the hydrocyclone [28,29]. Its governing equation is shown in Equation (2).
q = 1 n α q = 1
where α q is the q -th phase volume fraction.
( ρ u i u j ¯ ) t + ( ρ u k u i u j ¯ ) x k = D T , i j + D L , i j + P i j + G i j + Φ i j + ε i j + F i j
where D T , i j is the turbulent diffusion term, D L , i j is the molecular diffusion term, P i j is the stress production term, G i j is the buoyancy generation term, Φ i j is the pressure strain term, ε i j is dissipation term, F i j is production by system rotation term. The expressions are as follows:
D T , i j = X k ( ρ u i u j u k ¯ + p u i ¯ δ k j + p u j ¯ δ i k )
D L , i j = x k [ μ x k ( u i u j ¯ ) ]
P i j = ρ ( u i u k ¯ u j x k + u j u k ¯ u i x k )
G i j = ρ β ( g i u j θ ¯ + g i u i θ ¯ )
ϕ i j = p ( u i x j + u j x i )
ε i j = 2 μ u i u j ¯ x k x k
F i j = 2 ρ Ω k ( u j u m ¯ e i k m + u i u m ¯ e j k m )
The inlet boundary condition is set “Velocity-inlet”; the inlet phase is clear water. The hydrocyclone feed rate is set to 1 m/s, 2 m/s, 3 m/s, 4 m/s, and 5 m/s, respectively. The overflow outlet and the underflow outlet are calibrated to the pressure outlet, and the air return coefficient is set to 1. The wall setting is “Wall”, and the wall shear condition is “No Slip”. Initialize the flow field and set the air volume fraction to 1, i.e., the hydrocyclone is filled with air by default. Select “Standard Wall Functions” for the near-wall treatment function. The time step is chosen as 1 × 10⁻⁴ s, and the time-averaged mass flow rate of the hydrocyclone inlet and outlet are taken as the convergence condition. SIMPLE is used in the Pressure–Velocity Coupling, PRESTO! is used in Pressure Spatial Discretization, and QUICK is used in Momentum, Turbulent Kinetic Energy, Turbulence Dissipation Rate, and Reynolds Stress Spatial Discretization.
The low hydrocyclone feed rate may cause instability of the velocity field in the hydrocyclone. For this issue, Thornber et al. [30] propose an improved numerical simulation method in Roe format that can effectively suppress the effects of low-velocity instability. In contrast, Xu et al. [31] suggest that for hydrocyclones, the formation of a stable-shaped air column inside the hydrocyclone indicates the stability of the flow field inside the hydrocyclone and that the low-velocity instability has less impact on the stability of the hydrocyclone flow field.

2.3. Independence Verification of Model and Grid

For the computational uncertainty, Karimi et al. [32] indicate that the grid convergence index is a practical method for calculating computational uncertainty, which is a useful tool for quantifying computational uncertainty in computational fluid dynamics (CFD) simulations. Moreover, Schwarz et al. [33] point out that although computational fluid dynamics can predict the performance of hydrocyclones, the numerical calculation model is subject to uncertainty and combining experimental results, numerical simulation results, and the modeling process is an effective solution to address the uncertainty in the numerical calculation. In order to verify the accuracy of the numerical simulation, the numerical simulation results were compared with previous literature.
Figure 2a shows the numerical simulation results and data reported in previous studies [34]. As observed, at the same feature height (z = 192 mm), the tangential velocity and axial velocity of the numerical simulation are in good agreement with the experimental data, which verifies the correctness of the numerical simulation model and related settings.
The number of grids affects the accuracy of the simulation results and the time cost of the simulation calculation. The accuracy of the results increases with the increase in the number of elements, and the calculation time will also increase [35]. Therefore, it is necessary to carry out the mesh independence test to determine the appropriate number of meshes. The Ø75 mm hydrocyclone model is divided into 22,938, 33,909, 53,828, 76,417, and 116,125 elements, and the grid independence is verified. Figure 2b shows the tangential velocity simulated under different mesh counts. Herein, the difference in the tangential velocity of the five grids is rather small, and in order to improve the accuracy of numerical simulation, the number of grids is set to 116,125.

3. Simulation Results and Discussion

In order to analyze the effect of feed rate on the hydrocyclone flow field, six characteristic sections, as shown in Figure 3, were selected for the simulation. Among them, z0 is the reference origin, z1 and z2 are the two characteristic sections of the conical section, and z3 is the characteristic section at the end of the overflow pipe. Since the conical section is the main separation area of the hydrocyclone, two characteristic sections (z = 90 mm, z = 170 mm) are selected in the conical section for comparison. Because the turbulence intensity at the end of the overflow pipe varies greatly, the turbulent kinetic energy is analyzed at z3.

3.1. Static Pressure Distribution

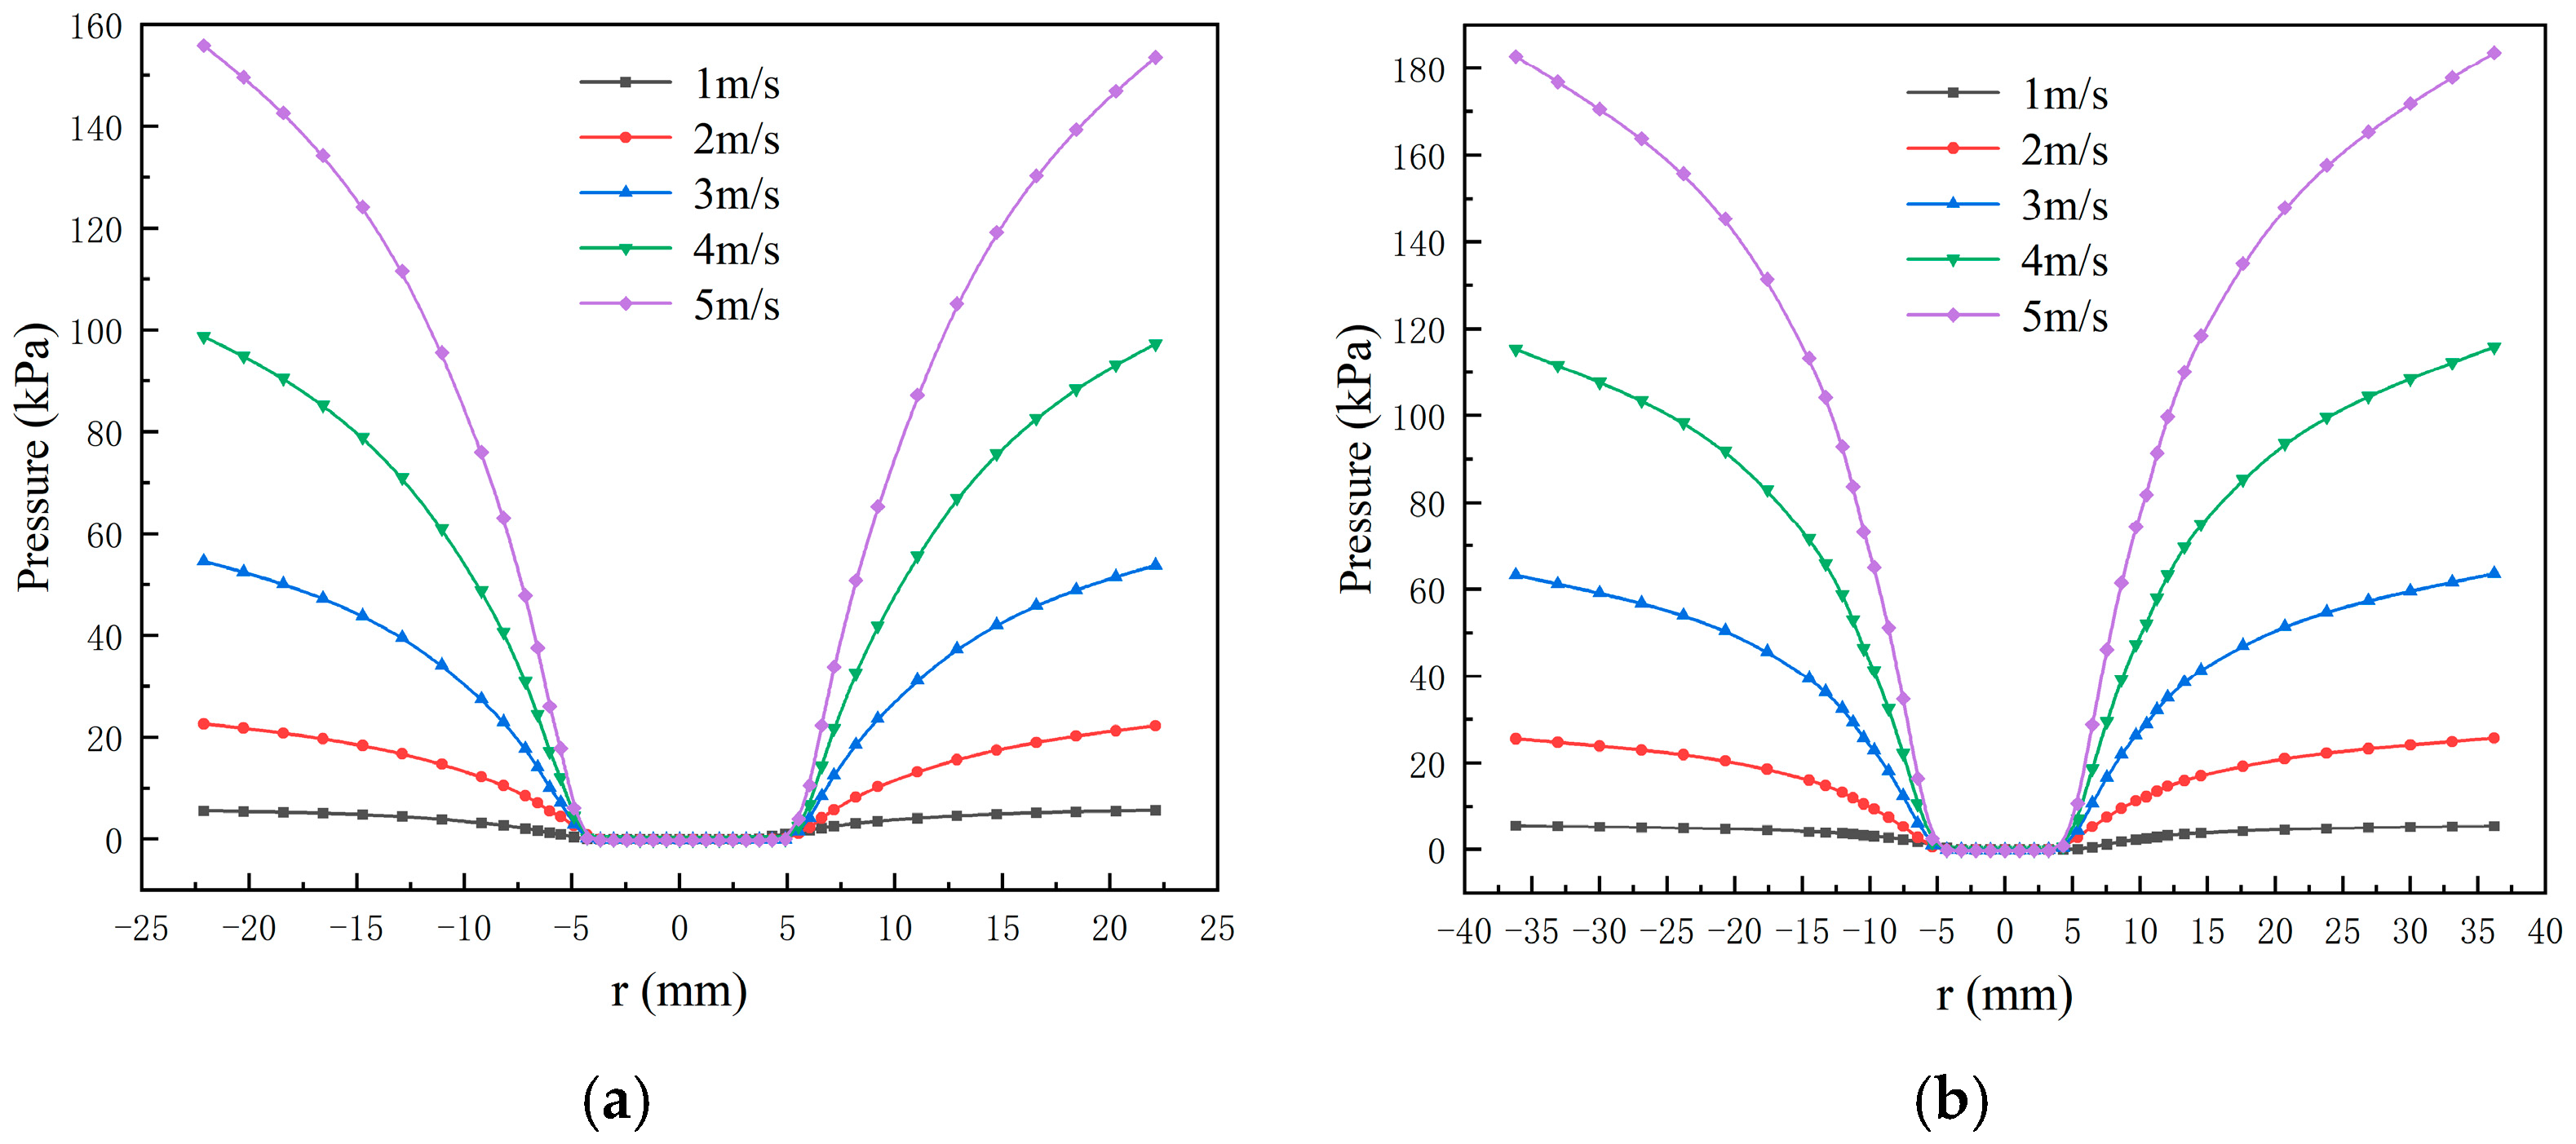
Figure 4 shows the clouds of static pressure at a characteristic section under different feed rates, and Figure 5 illustrates the distributions of the static pressure at the characteristic section cone z1 and z2. As observed, the static pressure had consistent trends and symmetric distributions under different feed rates. The static pressure was highest at the wall, decreased gradually from the wall to the axis, and became negative at the axis; that is, negative pressure occurred at the axis, resulting in an air column. The static pressure gradually decreased radially from the wall to the axis because of the increase in the tangential velocity along the same direction. This implies that more and more static pressure is converted into kinetic energy. Additionally, as the feed rate increased from 1 m/s to 5 m/s, the maximum value of the static pressure increased from 5.49 kPa to 182.78 kPa, with an increase of 177.29 kPa. Since the static pressure of the hydrocyclone was an important indicator of its handling capacity, this result indicated that increasing the feed rate was beneficial to improving the processing capacity of the hydrocyclone.
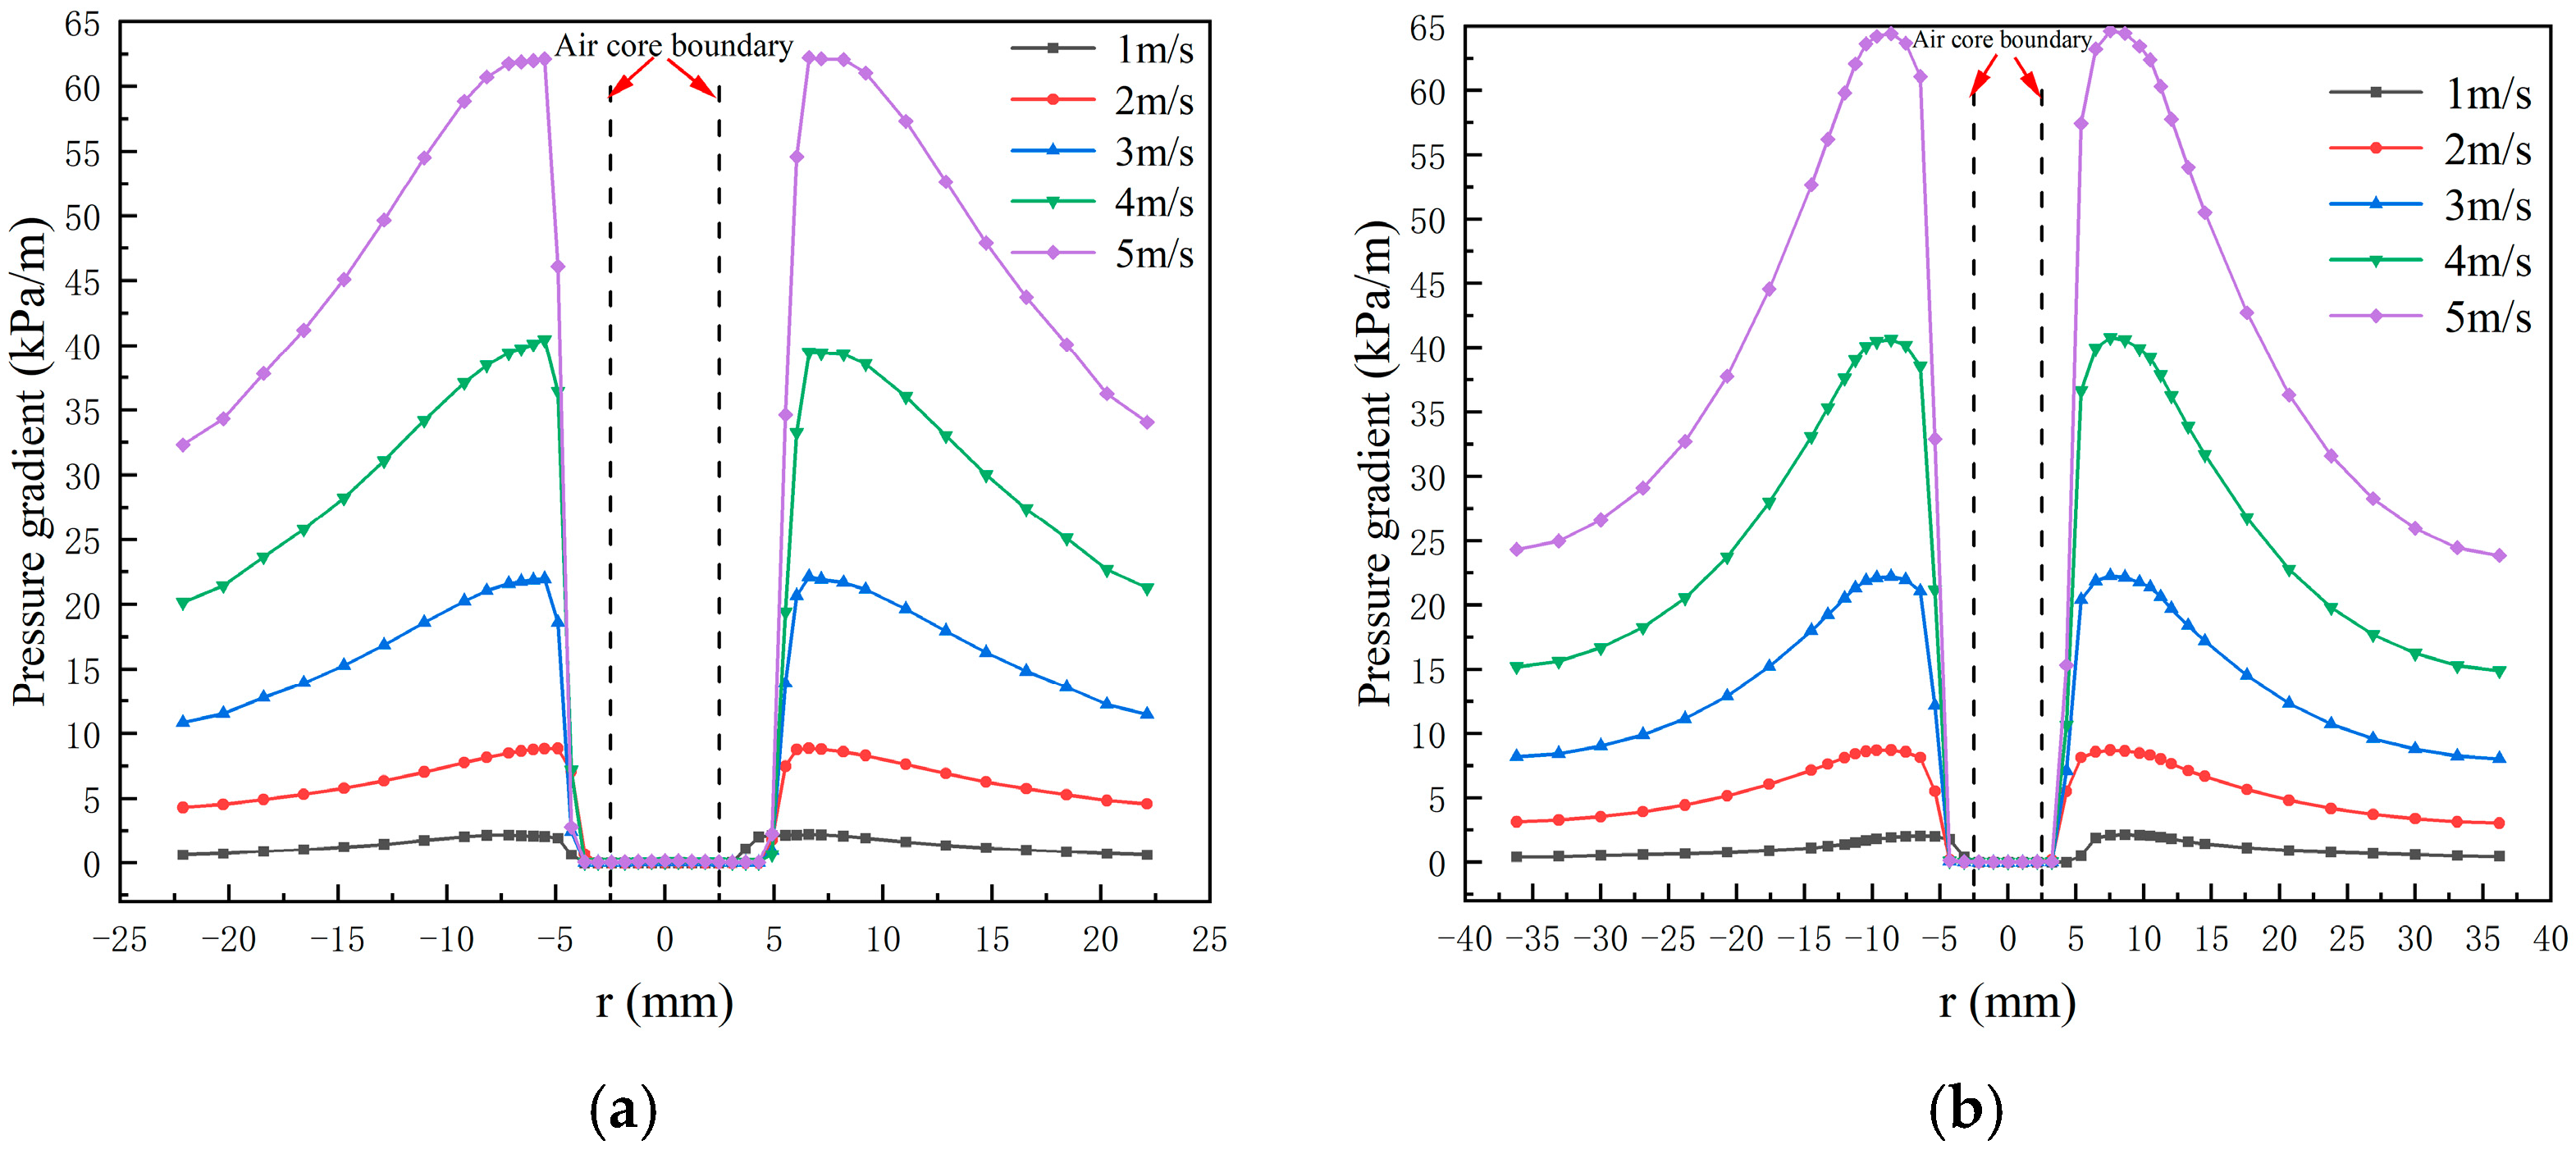
Figure 6 shows the distribution of the pressure gradient. As observed, the pressure gradient is symmetrically distributed around the axis, and the pressure gradient first increases and then decreases along the radial direction from the device wall to the axis, reaching a maximum near the air column and a minimum at the axis. Meanwhile, the pressure gradient increases with the feed rate at the inlet. As the feed rate increases from 1 m/s to 5 m/s, the maximum pressure gradient increases from 2.04 kPa/m to 64.43 kPa/m. Since the radial migration of fine particles is mainly affected by the pressure gradient force, increasing the feed rate is conducive to the radial migration of fine particles from the outer swirl to the inner swirl, reducing the proportion of fine particles in the outer swirl, thereby improving the separation accuracy of the hydrocyclone.

3.2. Velocity Distribution

3.2.1. Distribution of Tangential Velocity

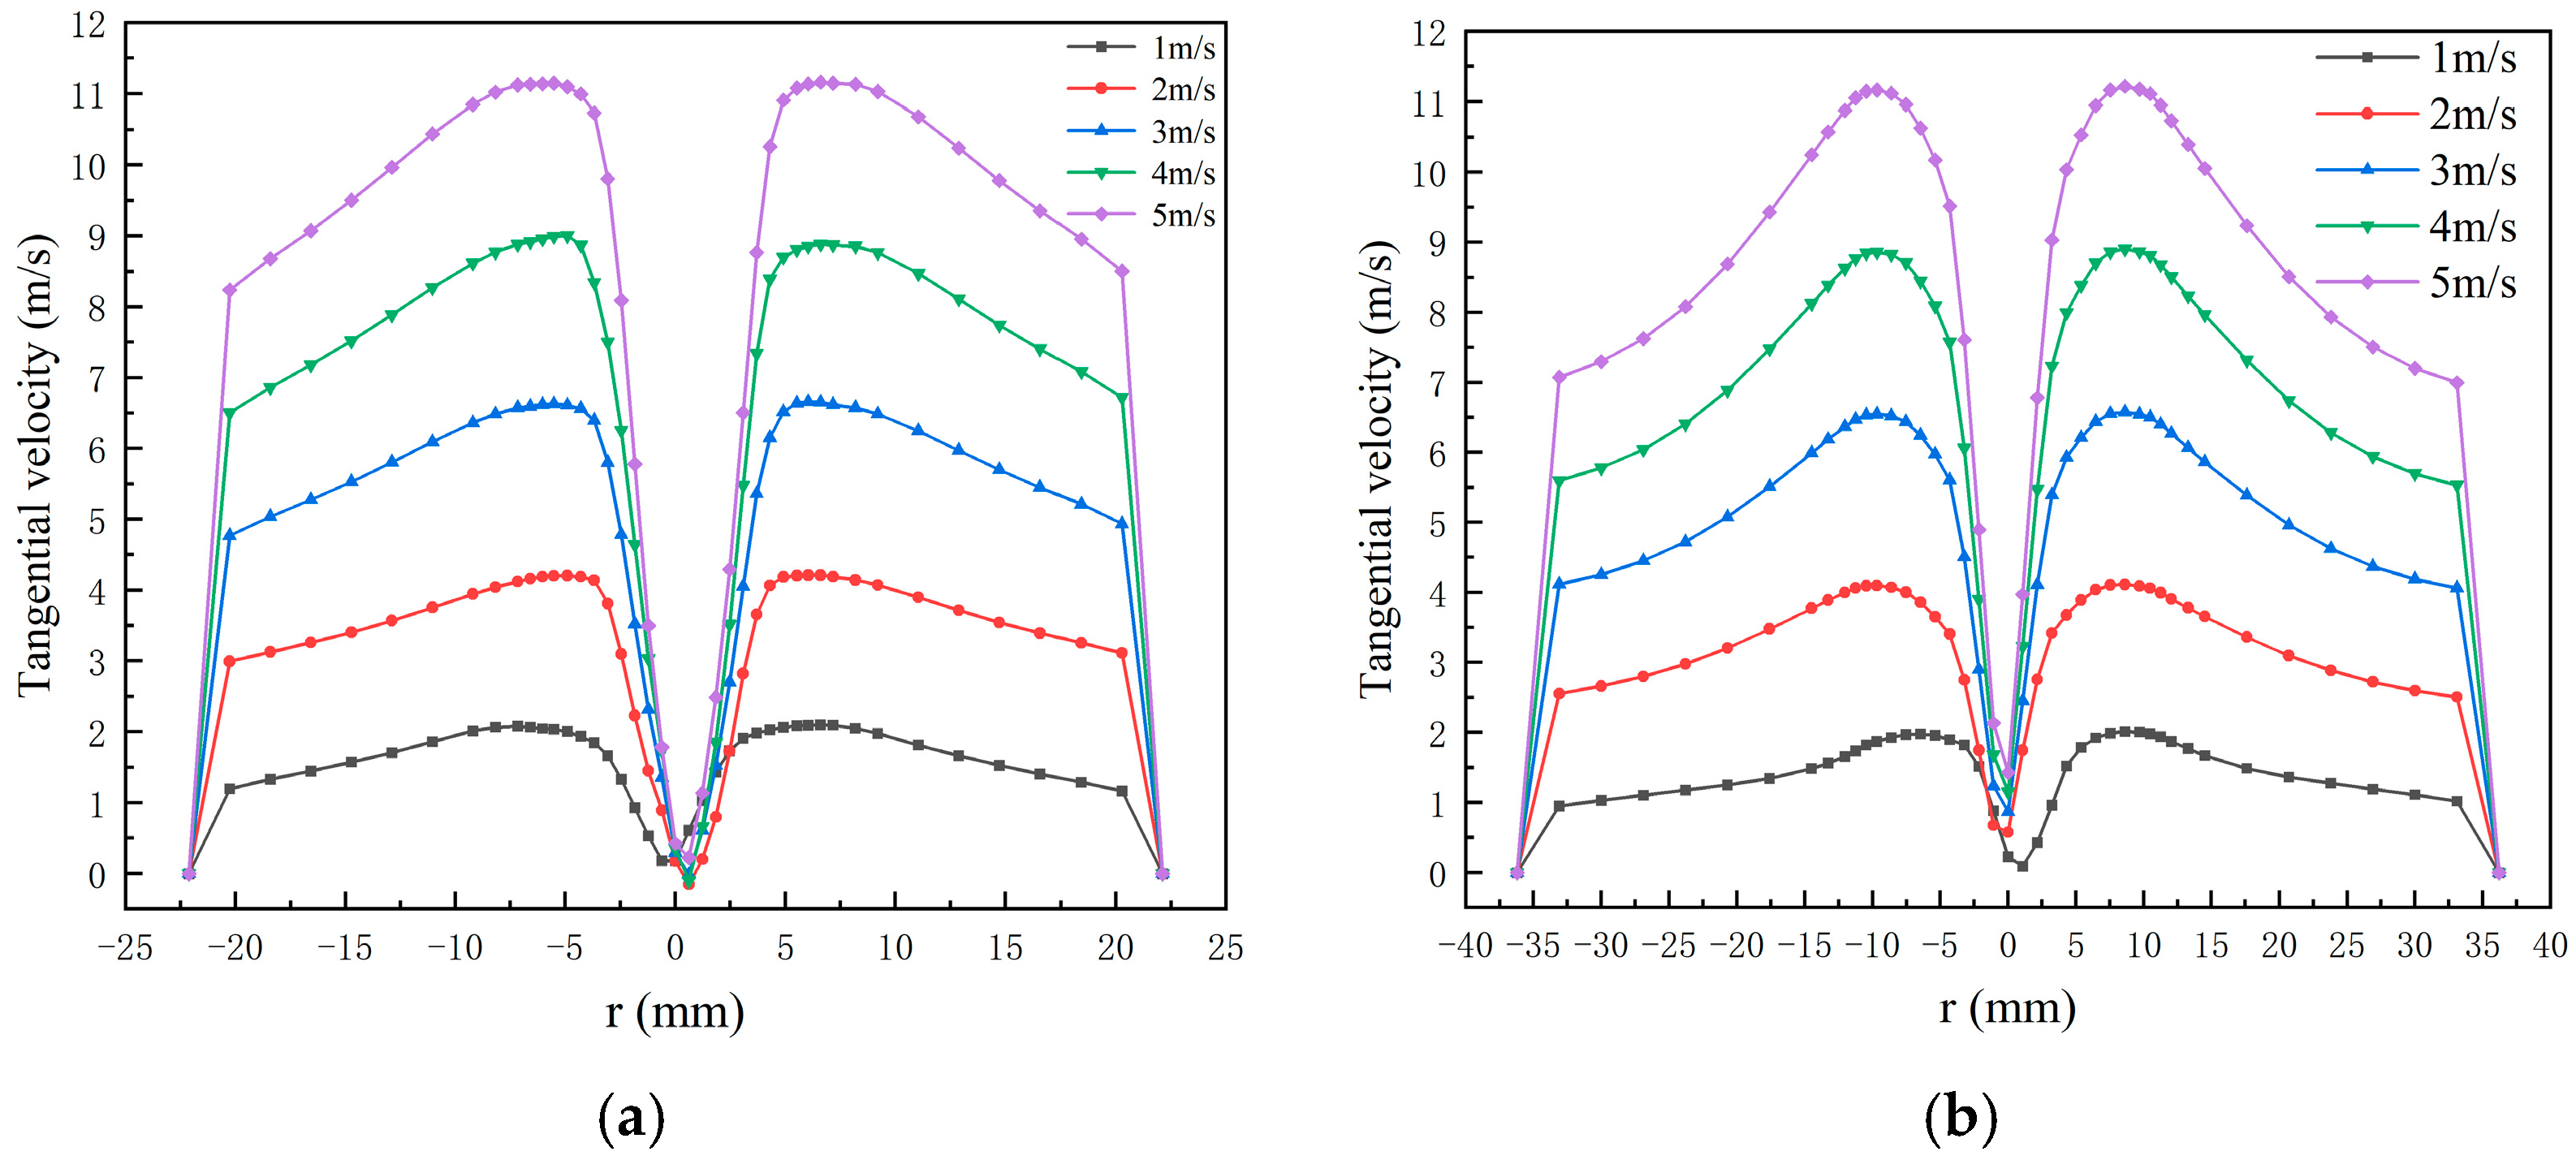
Figure 7 illustrates the distributions of the tangential velocity. As observed, the tangential velocity curves under different feed rates are all “M”-shaped symmetrical distributions centered on the axis. At the hydrocyclone wall, the tangential velocity is zero. From the wall to the center, the tangential velocity increases first and then decreases radially. This is because the tangential velocity distribution in the swirl field presents a combined vortex distribution. The outside is a free vortex, and the tangential velocity increases with the decrease in the radius. The inside is a forced vortex, and the tangential velocity decreases with the decrease of radius, reaching a maximum value at the confluence of the free vortex and the forced vortex. Additionally, the tangential velocity increases with the feed rate. As the feed rate at the inlet increases from 1 m/s to 5 m/s, the tangential velocity maximum increases from 1.97 m/s to 11.16 m/s. The increase in tangential velocity enhances the centrifugal strength, and increasing the feed rate increases the centrifugal force on the particles. This is beneficial to particle separation.

3.2.2. Distribution of Axial Velocity

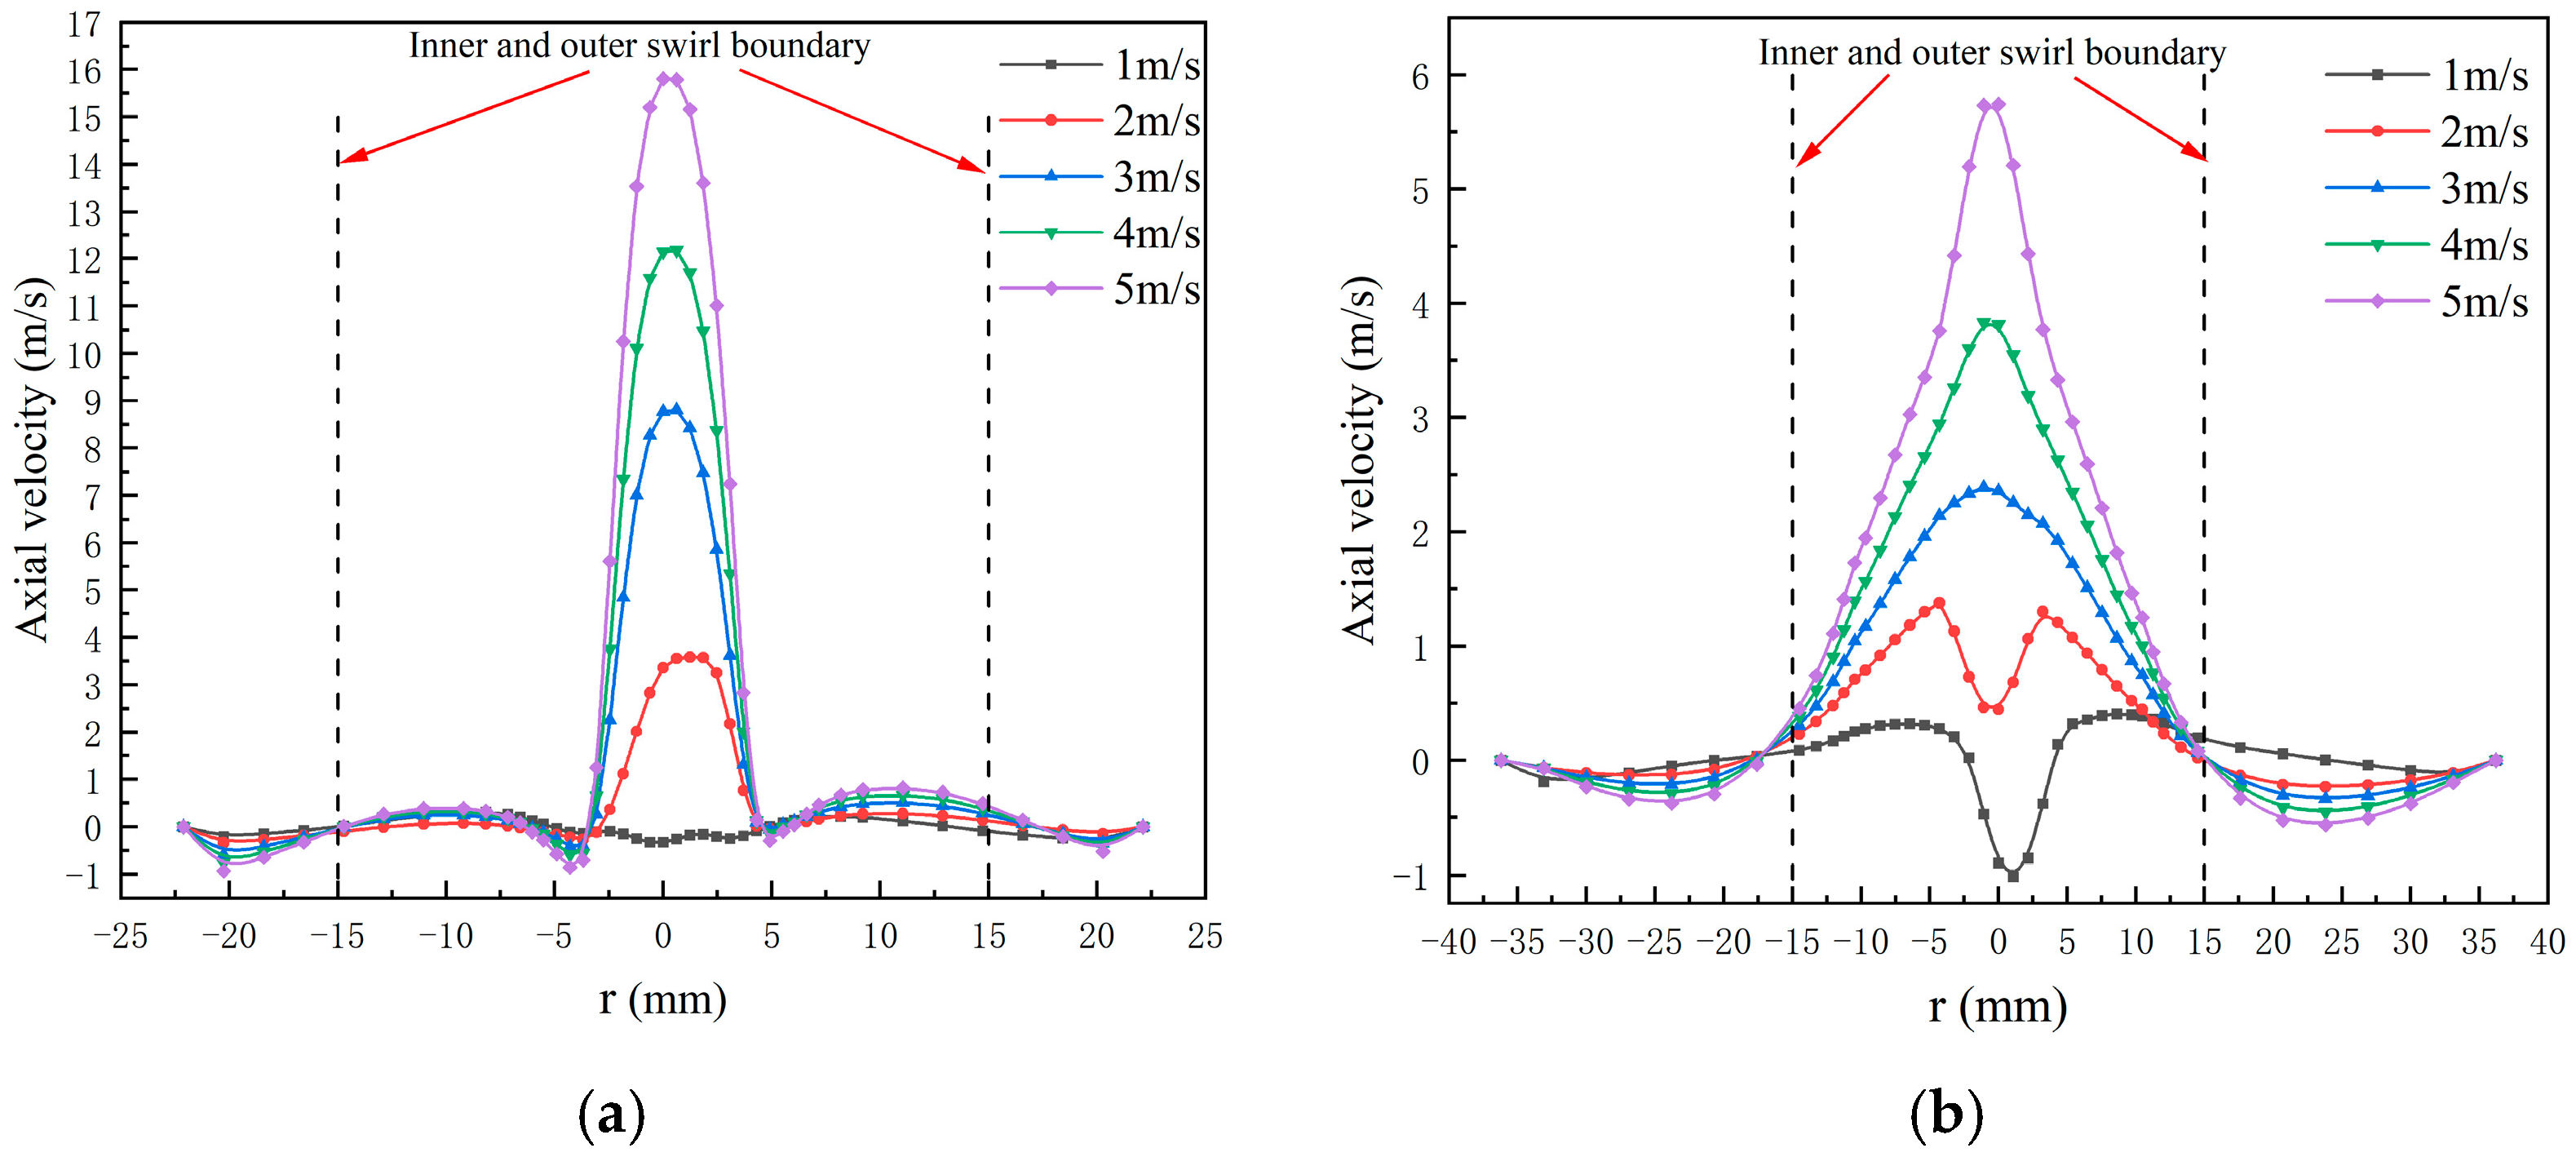
Figure 8 shows the distributions of the axial velocity. As observed, the axial velocity is axisymmetrically distributed, and the axial velocity is zero at the wall. In the outer swirl, the axial velocity is negative, and the absolute value of the axial velocity increases with the increase in the feed rate, indicating that increasing the feed rate can improve the underflow yield. In the inner swirl, the axial velocity is positive, which increases with the feed rate, indicating that increasing the feed rate can improve the overflow yield. The results show that increasing the feed rate improves the processing capacity. However, the increase in axial velocity will reduce the residence time of the particles in the swirl chamber, resulting in insufficient particle separation and reducing the separation accuracy of the particles.
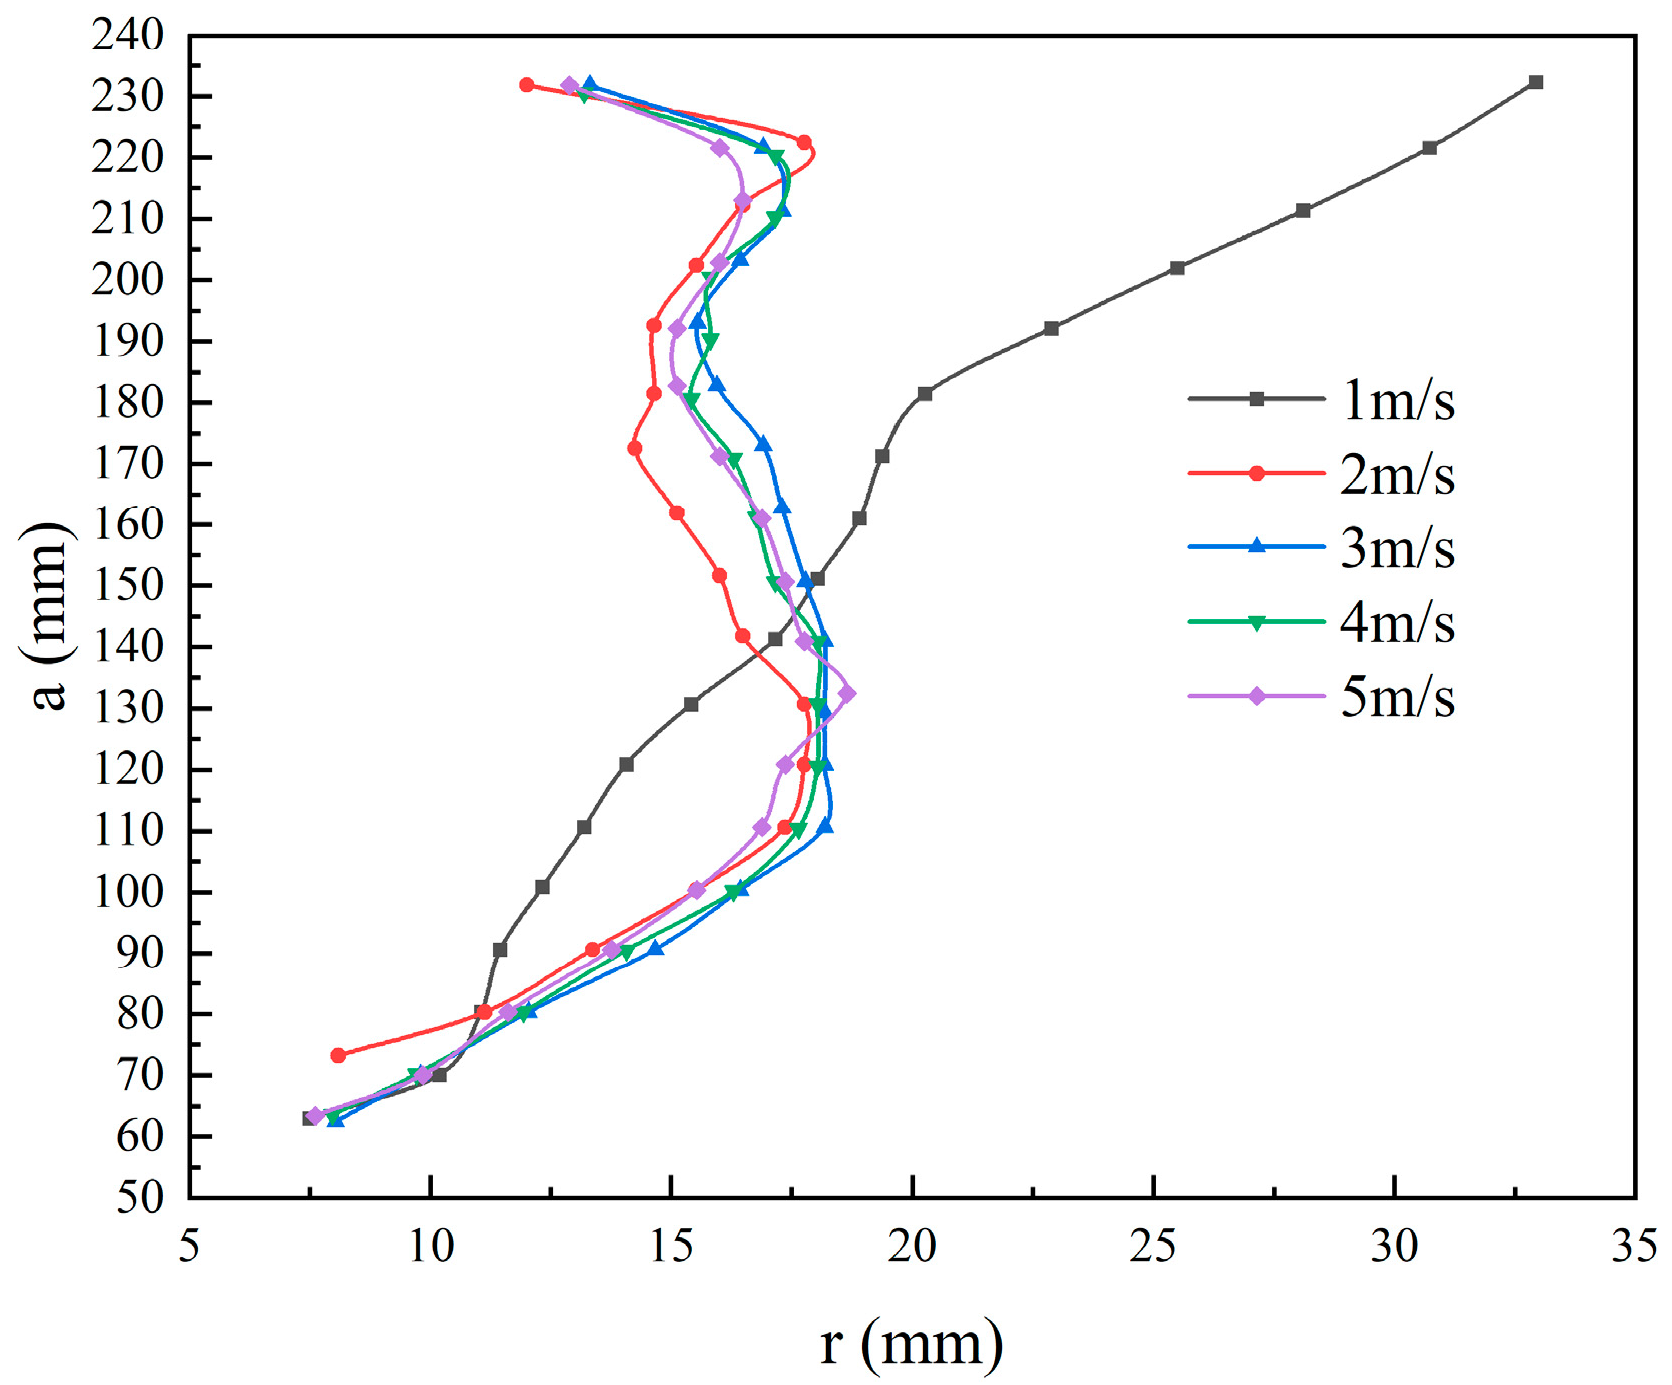
Figure 9 is the LZVV (locus of zero vertical velocity), which is a curve formed by connecting points whose axial velocity is 0 and is also the dividing line between the inner swirl and the outer swirl. Inside the LZVV is the inner swirl, and this part of the fluid is discharged from the overflow. Outside the LZVV is the outer swirl, and this part of the fluid is discharged from the underflow. Therefore, its position and shape have an important impact on the separation performance of the hydrocyclone. As observed, the LZVV falls sharply as the feed rate at the inlet reaches 1 m/s and becomes stabilized once the feed rate at the inlet reaches a critical level. In summary, a high feed rate at the inlet favors the stability of the flow field and improves the separation performance of the hydrocyclone.

3.2.3. Distribution of Radial Velocity

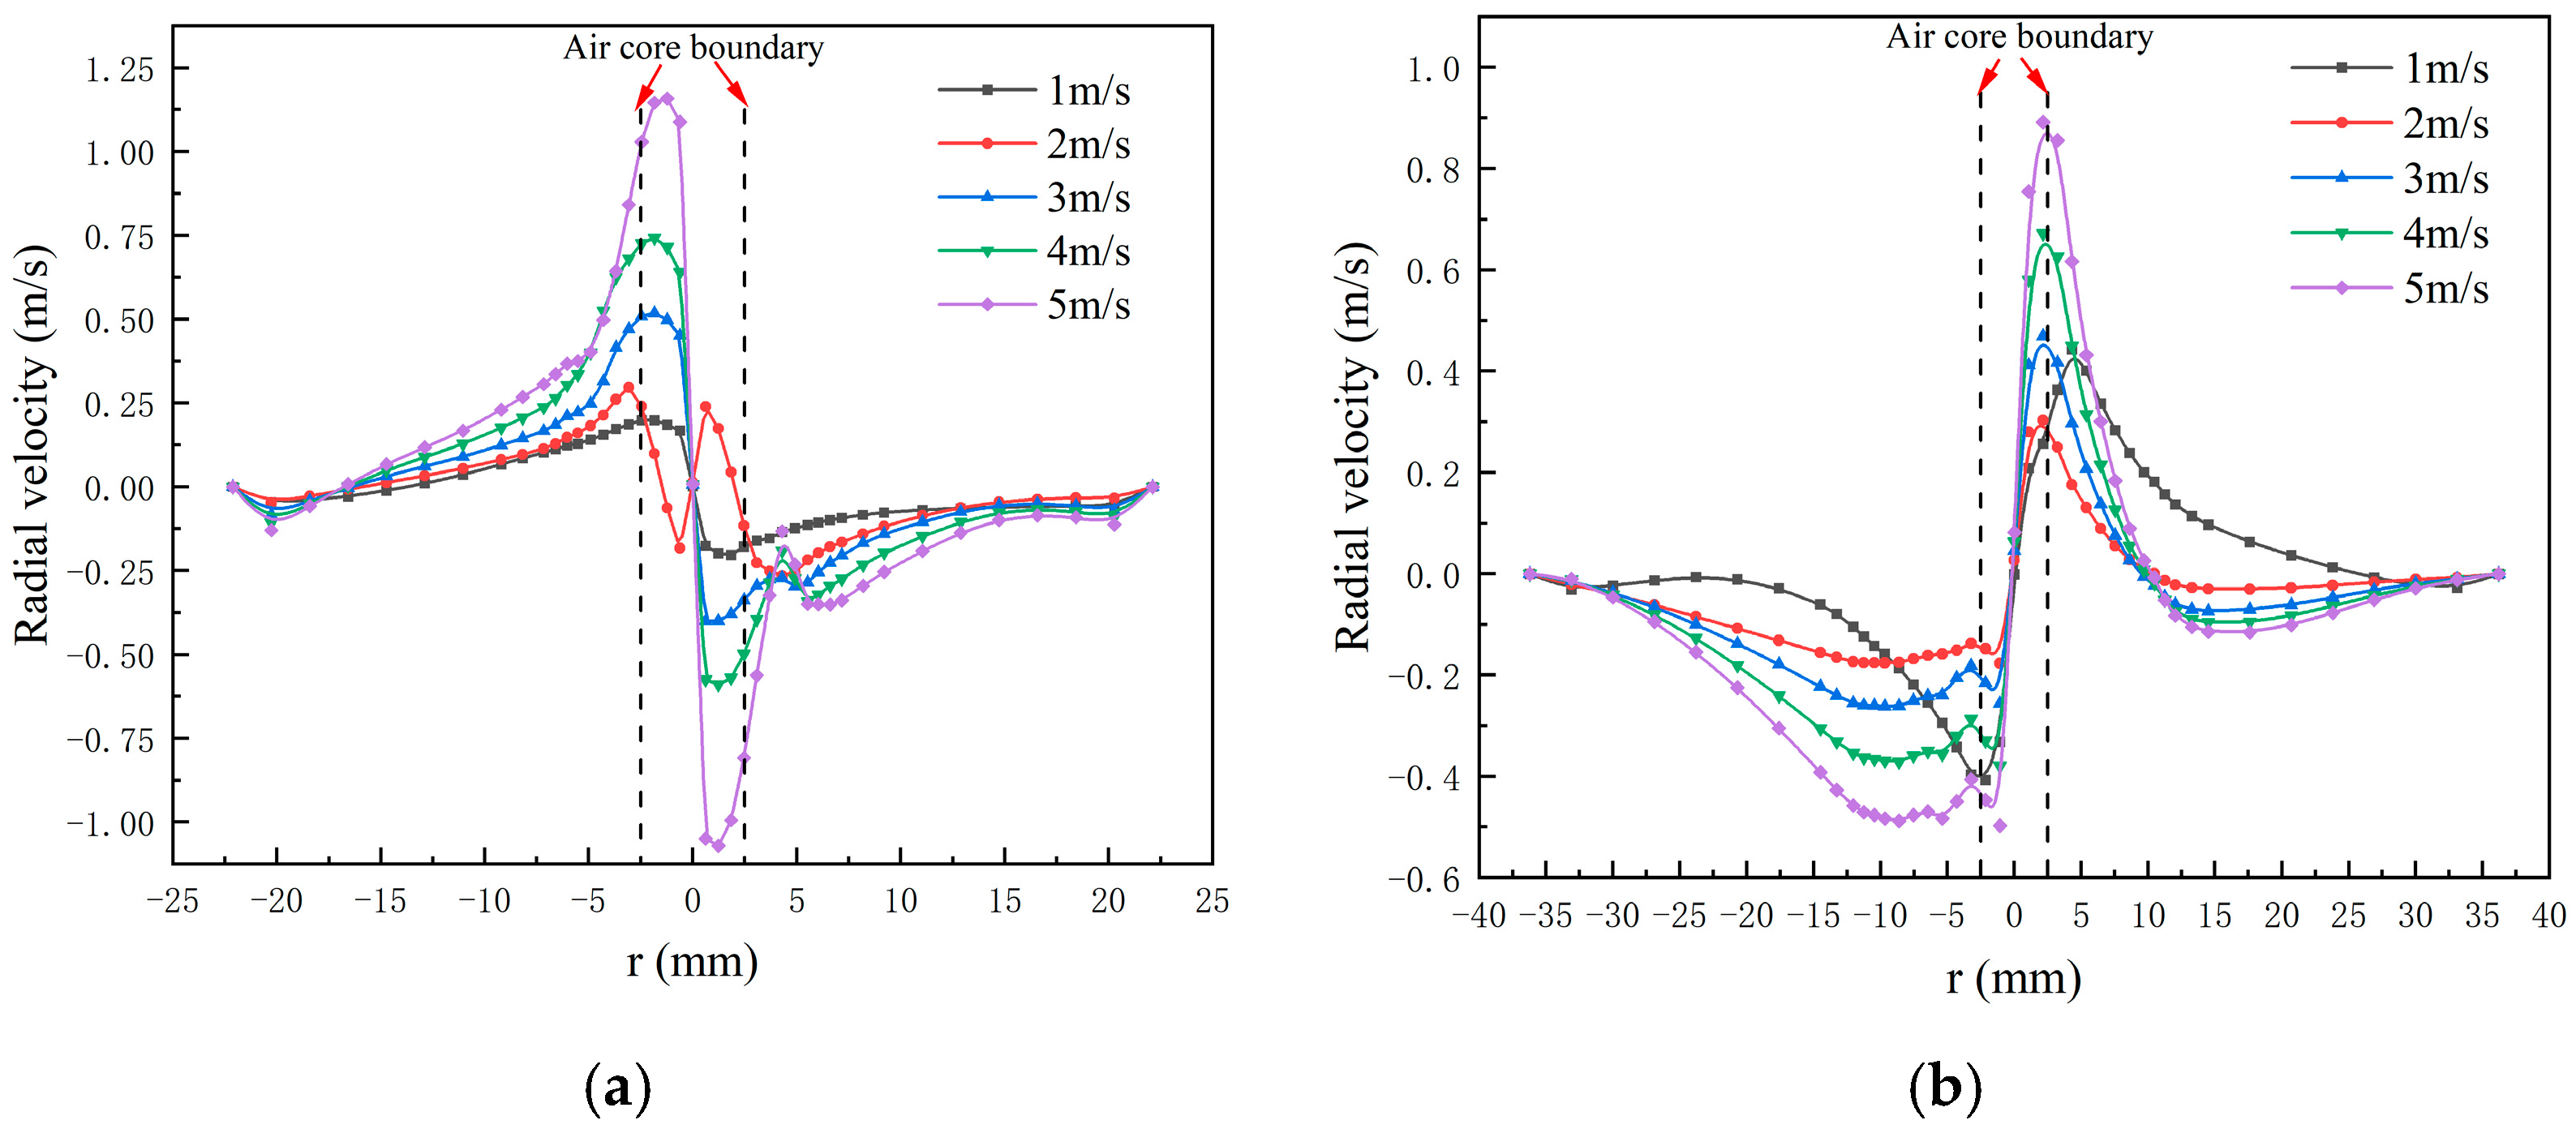
Figure 10 illustrates the distribution of the radial velocity. As observed, the radial velocity is distributed symmetrically around the center, and the radial velocity is zero at the wall. The radial velocity first increases and then decreases from the wall to the axis, reaches a maximum value near the edge of the air column, and then decreases sharply, becoming zero at the axis. Additionally, the radial velocity increases with the feed rate. As the feed rate at the inlet increases from 1 m/s to 5 m/s, the maximum radial velocity increases from 0.20 m/s to 1.16 m/s. Since the increase in radial velocity can shorten the time for fine particles to gather to the axis in the inner swirl, increasing the feed rate leads to enhanced separation efficiency of fine particles.

3.3. Turbulent Kinetic Energy

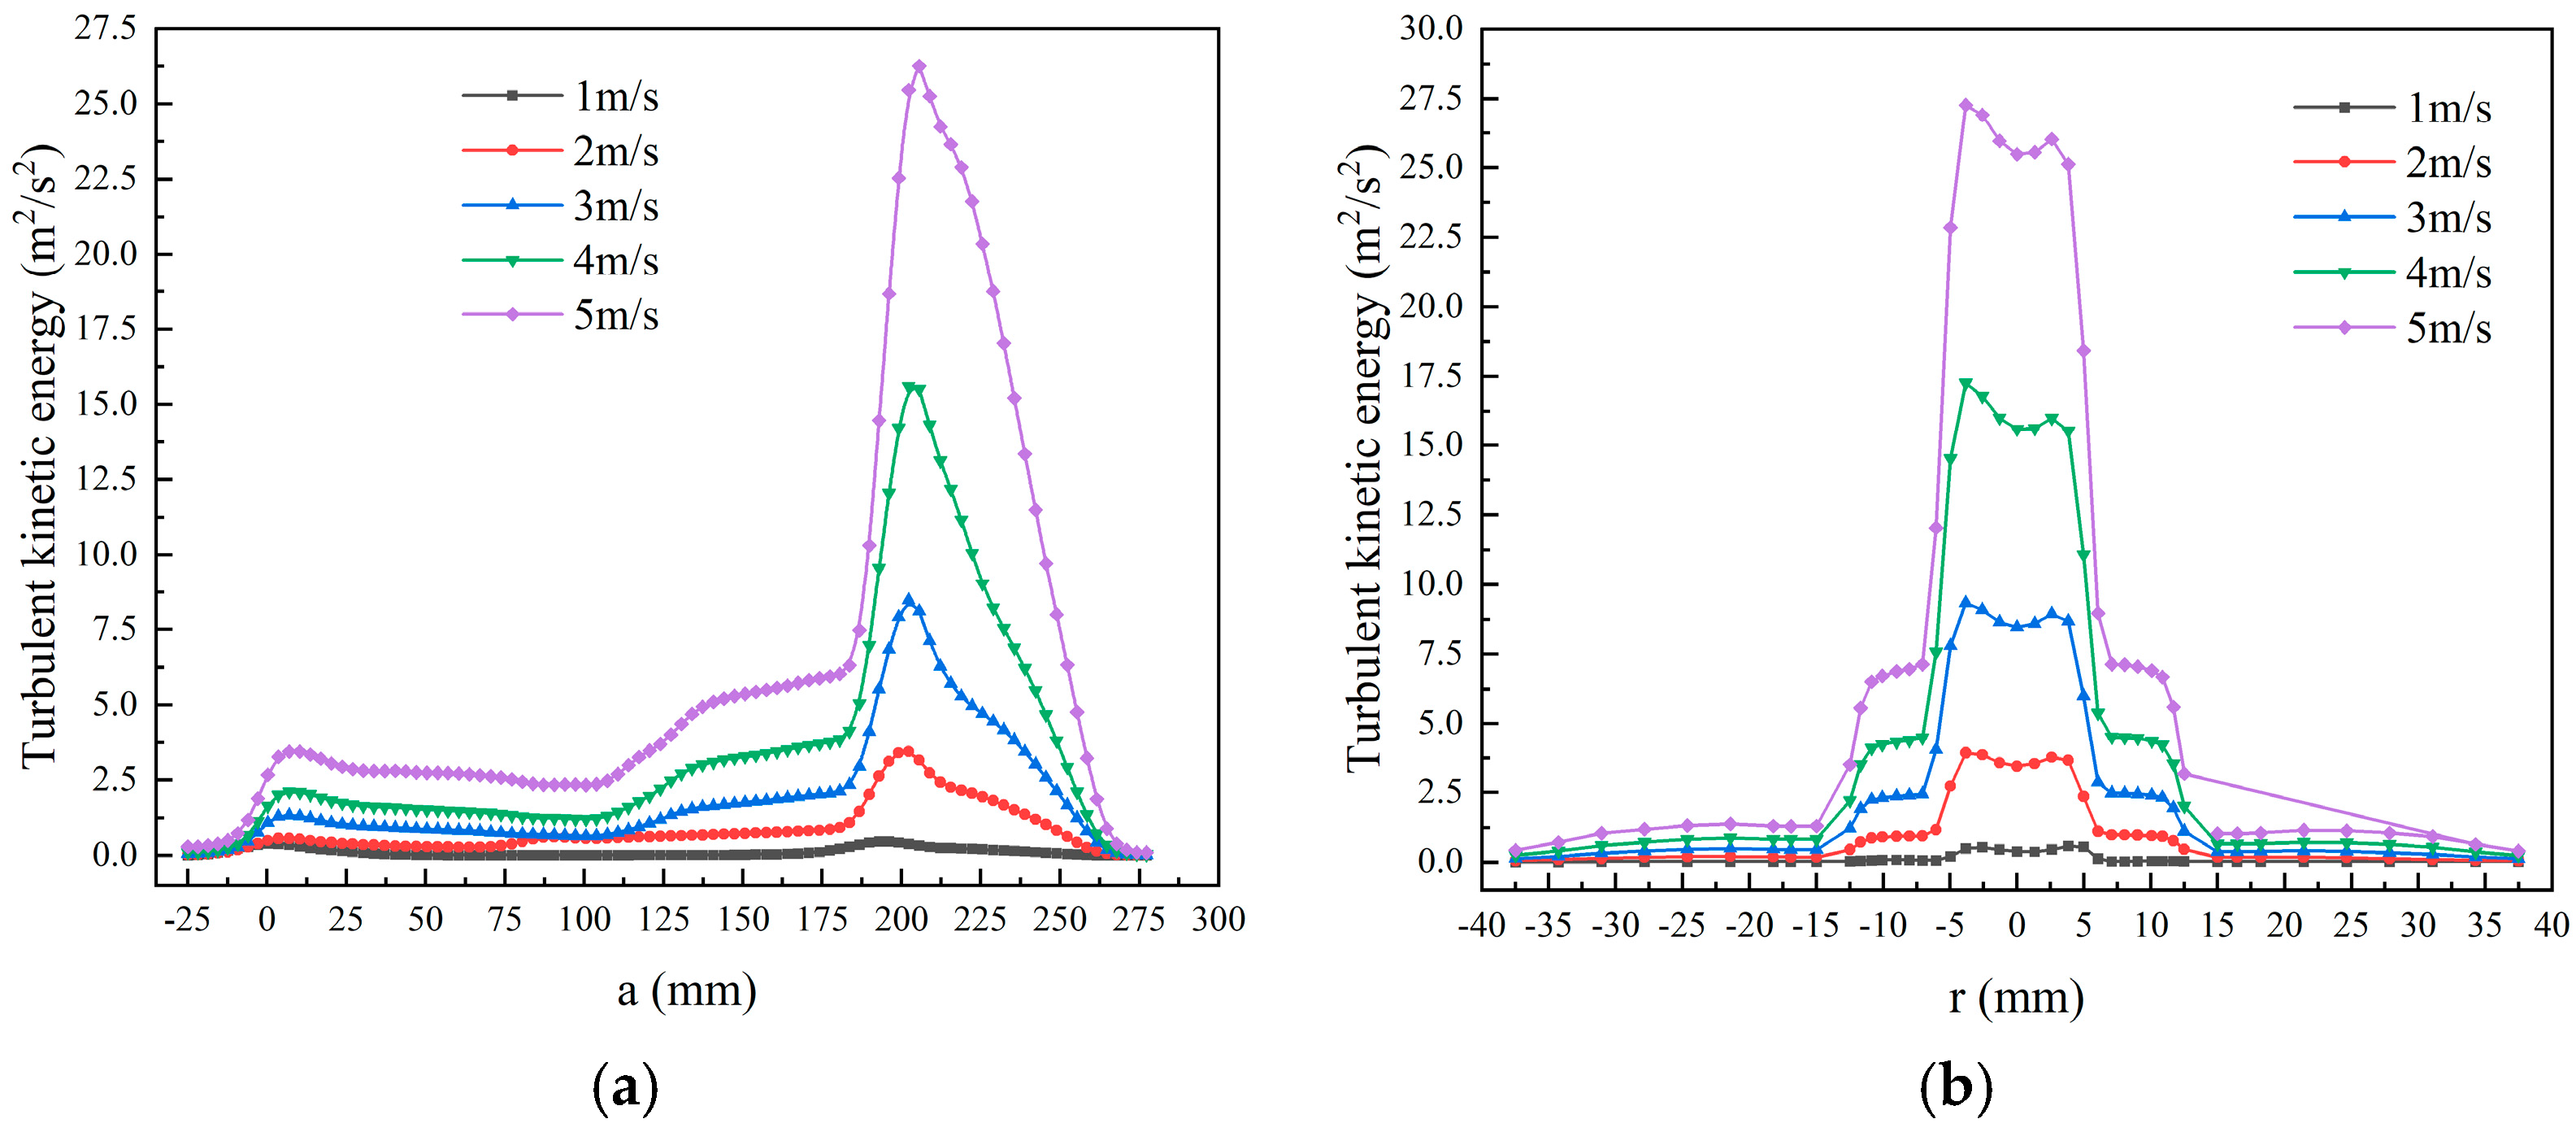
Figure 11a shows the axial distribution of turbulent kinetic energy. As observed, the turbulent kinetic energy shows a gradually increasing trend with the increase in feed rate. Along the axial direction, the turbulent kinetic energy at the underflow outlet (z = −25 mm) and the overflow outlet (z = 283 mm) is negligibly small, tending to zero. At the hydrocyclone cone (0 mm < z < 177 mm), the turbulent kinetic energy tends to be stable, with a small change. In the hydrocyclone column (z > 177 mm), the turbulent kinetic energy begins to change sharply with the increase in the feed rate and increases with the increase in the z value, reaching a maximum value at the bottom of the overflow pipe (z = 202 mm). Finally, there is a decreasing trend as the z value increases. The extreme value at the bottom of the overflow pipe is caused by the intersection of the inner swirl, short-circuit flow, and strong eddy current, where the turbulent kinetic energy distribution curve is shown in Figure 11b. As the feed rate at the inlet increases from 1 m/s to 5 m/s, the extremum of kinetic energy ranges from 0.49 m2/s2 to 27.27 m2/s2. The larger turbulent kinetic energy will cause a disordered flow field, which tends to reduce the hydrocyclone separation accuracy. Therefore, to improve the overall separation performance of hydrocyclone, the choice of feed rate must be reasonable.

3.4. Effects of the Feed Rate at Inlet on the Air Column

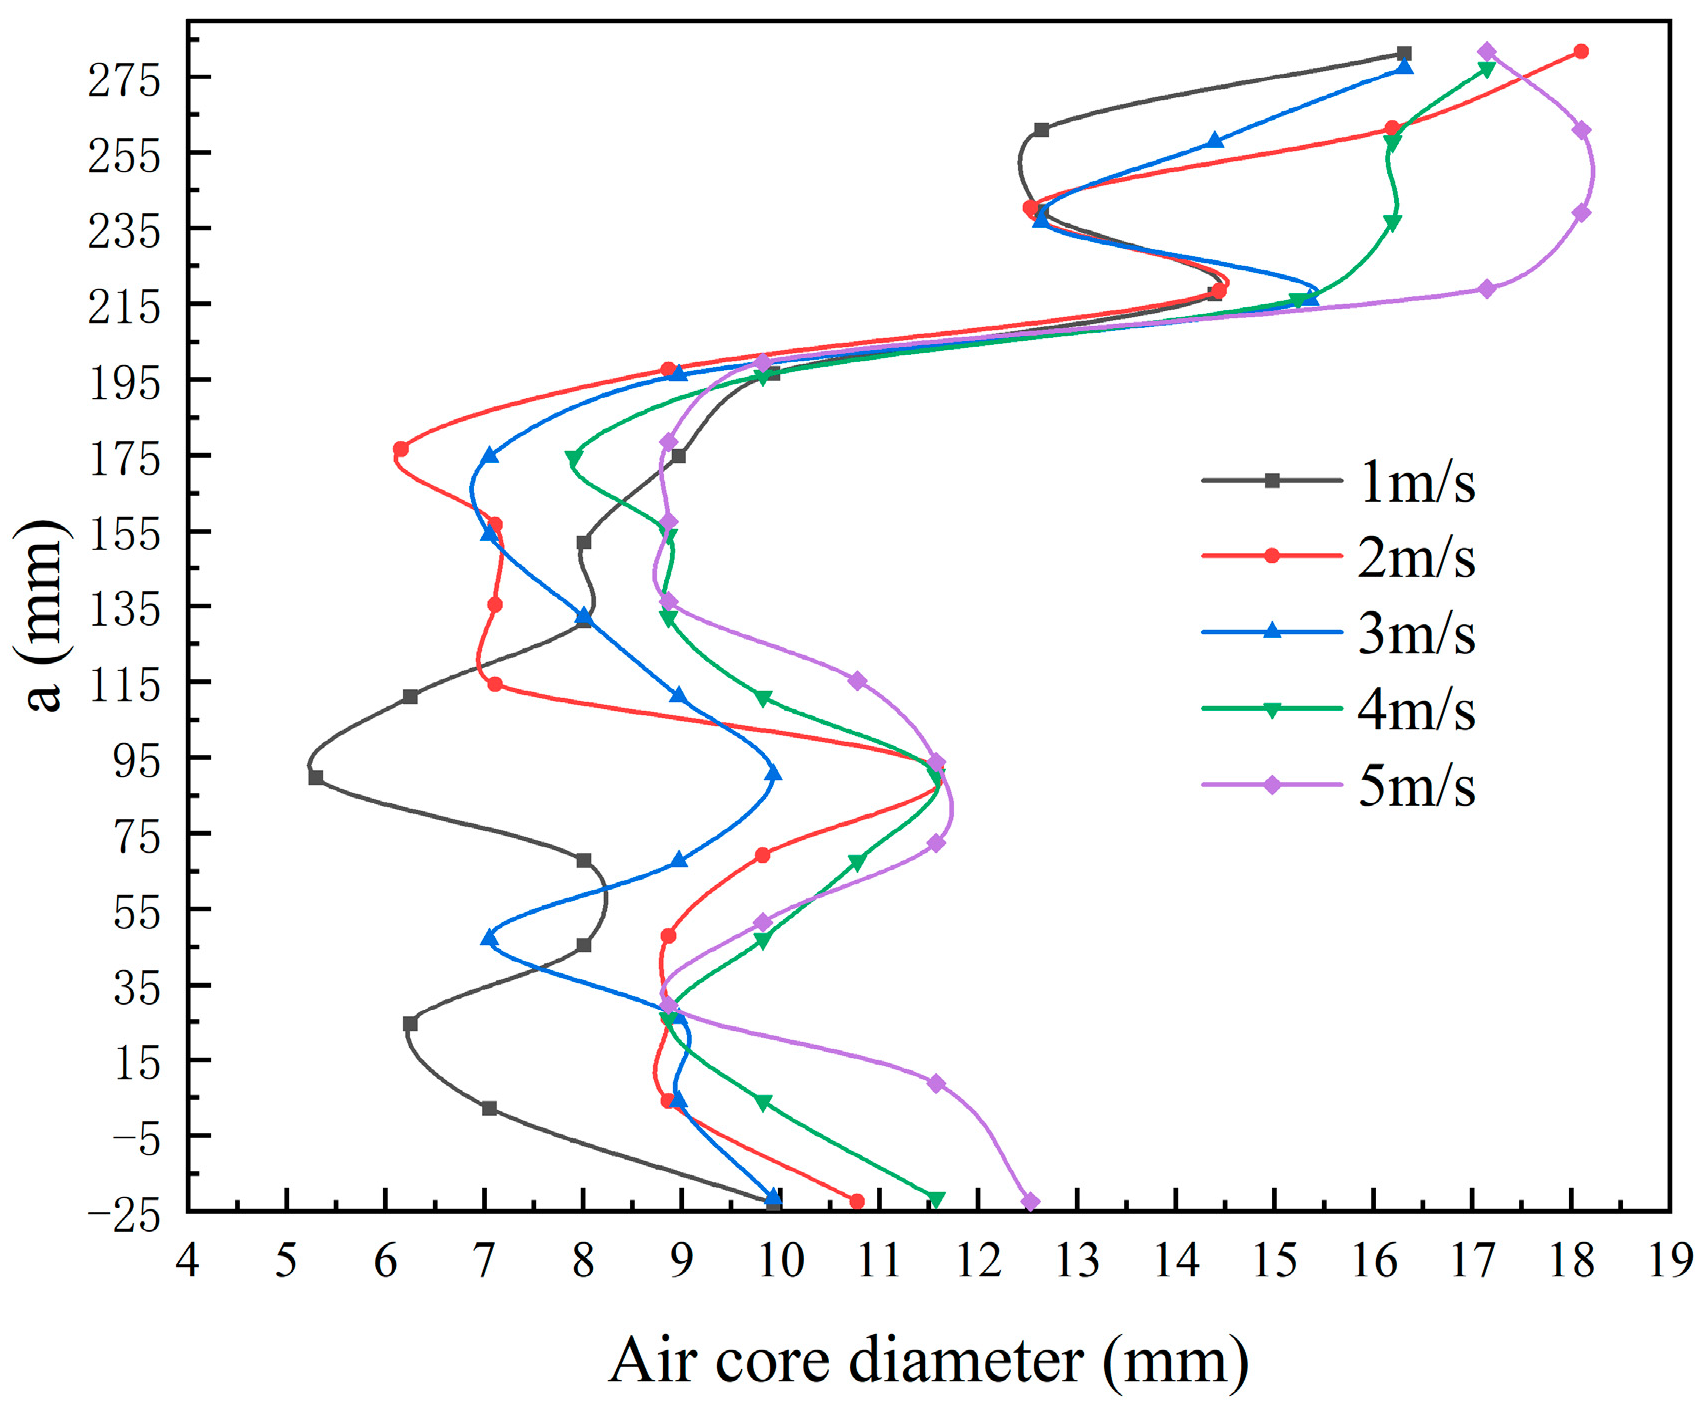
The air column has a great influence on the separation performance of the hydrocyclone, and its formation is an important sign of the stability of the flow field in the hydrocyclone [36]. Figure 12 illustrates the evolution process of air column generation and the development of stability under different feed rates. Herein, the red part represents the volume fraction of air, and the blue part represents the volume fraction of water. As observed, the feed rate has a great influence on the formation time of the air column. The time from the appearance to the stabilization of the air column is shortened with the increase in the feed rate. Figure 13 shows the axial distribution of the air column diameter. As observed, the fluctuation of the air column diameter becomes smaller with the increase in feed rate, indicating that increasing the feed rate can reduce the formation time of the air column and strengthen its morphology, resulting in increased stability of the flow field in the hydrocyclone.

3.5. Effects of the Feed Rate at Inlet on the Split Ratio

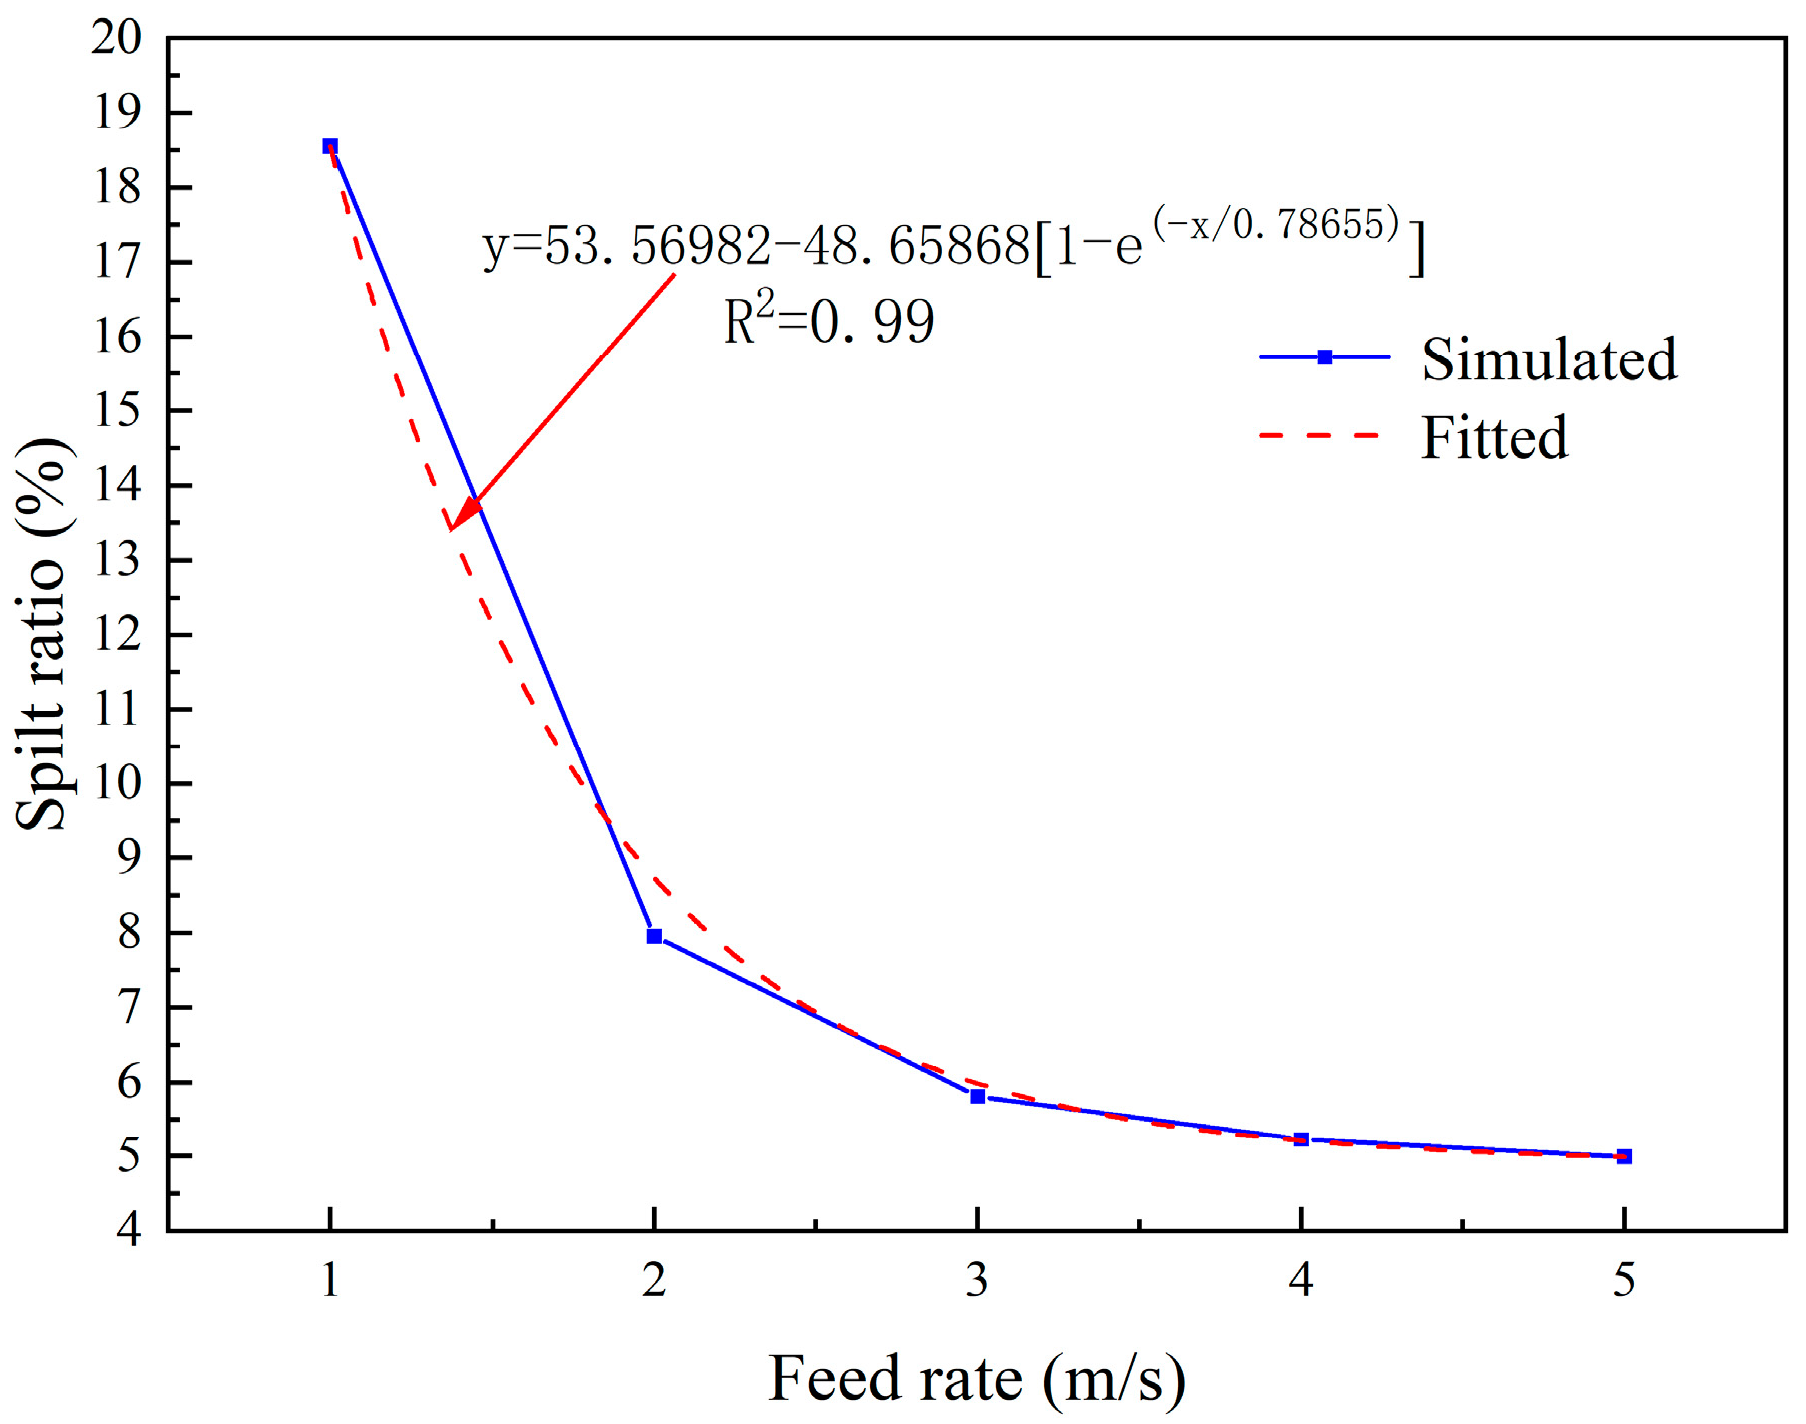
The split ratio is the ratio of the volume flow of the hydrocyclone underflow outlet to the volume flow of the feed port, and it is an important parameter for evaluating the hydrocyclone separation performance. Figure 14 is the influence curve of the different feed rates on the split ratio. As observed, the split ratio decreases with the increase in feed rate. When the feed rate increases to a certain value, the split ratio gradually becomes stable. In summary, the flow discharged from the underflow outlet becomes smaller with the increase in feed rate, which is more conducive to the improvement of hydrocyclone concentration performance. Nevertheless, an excessively high feed rate can sometimes cause a large amount of fluid to accumulate in the underflow outlet, causing a blockage of the discharge and affecting the normal operation of the hydrocyclone.

4. Conclusions

In this study, the influence of feed rate on the flow field performance in hydrocyclone was determined through numerical simulation. The main conclusions are as follows:
(1)
Increasing the feed rate led to increased static pressure, radial pressure gradient, tangential velocity and radial velocity, and reduced the split ratio in the swirl field, which was beneficial to the separation of the two solid-liquid phases in the hydrocyclone. This was beneficial in improving the separation accuracy of the hydrocyclone.
(2)
Increasing the feed rate led to reduced fluctuations of the air column and the LZVV, as well as reduced the formation time of the air column, which was beneficial to the stability of the flow field in the hydrocyclone.
(3)
Increasing the feed rate led to increased axial velocity and turbulent kinetic energy, resulting in a negative impact on the separation accuracy and energy consumption of the hydrocyclone.

Author Contributions

Y.Z. and M.X. designed this study. J.Y. and Y.D. were mainly responsible for all simulations and data analysis. M.X., X.Y. and X.T. contributed to writing of the manuscript. All authors have read and agreed to the published version of the manuscript.

Funding

This study was financially supported by the Natural Science Foundation of Shandong Province, China (ZR2020ME105) and the National Natural Science Foundation of China (22108159).

Data Availability Statement

Not applicable.

Conflicts of Interest

The authors declare no conflict of interest.

References

  1. Xie, H.Y.; Sun, R.; Ren, X.J.; You, Z.C.; Liu, Y.H.; Feng, D.X.; Chen, L.Z. Development of a novel fluidized hydrocyclone concentrator for mineral separation. Sep. Purif. Technol. 2020, 248, 116960. [Google Scholar] [CrossRef]
  2. Zhao, S.; Sun, J.P.; Wang, S.L.; Sun, Z.H. Modeling and Numerical Simulation of the Inlet Velocity on Oil-Water Two-Phase Vapor Separation Efficiency by the Hydrocyclone. Energies 2022, 15, 4900. [Google Scholar] [CrossRef]
  3. Lv, X.F.; Du, Y.H.; Du, S.J.; Xiang, L. Graded Preparation and Industrial Applications of Large-Ball Polyolefin Catalyst Carriers. Catalysts 2022, 12, 117. [Google Scholar] [CrossRef]
  4. Kuang, S.B.; Chu, K.W.; Yu, A.B.; Vince, A. Numerical study of liquid-gas-solid flow in classifying hydrocyclones: Effect of feed solids concentration. Miner. Eng. 2012, 31, 17–31. [Google Scholar] [CrossRef]
  5. Hou, D.X.; Zhao, Q.; Cui, B.Y.; Wei, D.Z.; Song, Z.G.; Feng, Y.Q. Geometrical configuration of hydrocyclone for improving the separation performance. Adv. Powder Technol. 2022, 33, 103419. [Google Scholar] [CrossRef]
  6. Liu, B.; Wang, H.J.; Li, L.C.; Zhao, Z.J.; Xu, L.P.; Xue, J.L. Study of GLR and Inlet Velocity on Hydrocyclone for Fracturing Flow-Back Fluids. J. Math. Probl. Eng. 2019, 2019, 1–12. [Google Scholar] [CrossRef] [Green Version]
  7. Guo, D.; Jiang, X.Y.; Guo, M.Z.; Zeng, M.; Wu, N.; Hao, L.L.; Wang, C. Role of hydrocyclone separator on the formation and separation of aerobic granular sludge: Evaluating granulation efficiency and simulating hydrodynamic behavior. Sep. Purif. Technol. 2022, 283, 120231. [Google Scholar] [CrossRef]
  8. Yuan, H.X.; Fang, Y.; Fu, S.C.; Ye, J.; Fang, Y. Analysis of the classification performance of micron particles with hydrocyclones. Chem. Ind. Eng. Prog. 2017, 36, 4371–4377. [Google Scholar] [CrossRef]
  9. Zhu, G.F.; Liow, J.L.; Neely, A. Computational study of the flow characteristics and separation efficiency in a mini-hydrocyclone. Chem. Eng. Res. Des. 2012, 90, 2135–2147. [Google Scholar] [CrossRef]
  10. Murthy, Y.R.; Bhaskar, K.U. Parametric CFD studies on hydrocyclone. Powder Technol. 2012, 230, 36–47. [Google Scholar] [CrossRef]
  11. Razmi, H.; Goharrizi, A.S.; Mohebbi, A. CFD simulation of an industrial hydrocyclone based on multiphase particle in cell (MPPIC) method. Sep. Purif. Technol. 2018, 209, 851–862. [Google Scholar] [CrossRef]
  12. Abdollahzadeh, L.; Habibian, M.; Etezazian, R.; Naseri, S. Study of particle’s shape factor, inlet velocity and feed concentration on mini-hydrocyclone classification and fishhook effect. Power Technol. 2015, 283, 294–301. [Google Scholar] [CrossRef]
  13. Wu, S.E.; Hwang, K.J.; Cheng, T.W.; Hung, T.C.; Tung, K.L. Effectiveness of a hydrocyclone in separating particles suspended in power law fluids. Powder Technol. 2017, 320, 546–554. [Google Scholar] [CrossRef]
  14. Bagdi, P.; Bhardwaj, P.; Sen, A.K. Analysis and Simulation of a Micro Hydrocyclone Device for Particle Liquid Separation. J. Fluids Eng. 2012, 134, 021105. [Google Scholar] [CrossRef]
  15. Qiu, S.Z.; Wang, G.R.; Wang, L.Z.; Fang, X. A Downhole Hydrocyclone for the Recovery of Natural Gas Hydrates and Desanding: The CFD Simulation of the Flow Field and Separation Performance. Energies 2019, 12, 3257. [Google Scholar] [CrossRef] [Green Version]
  16. Dong, H.; Wu, K.S.; Kuang, Y.C.; Dai, M.L. Study on separation law of hydrate slurry in hydrocyclone based on CFD-DEM. J. Zhejiang Univ. (Eng. Sci.) 2018, 52, 1811–1820. [Google Scholar] [CrossRef]
  17. Im, I.T.; Gwak, G.D.; Kim, S.M.; Park, Y.K. A Numerical Study of the Flow Characteristics and Separation Efficiency of a Hydrocyclone. KSCE J. Civ. Eng. 2018, 22, 4272–4281. [Google Scholar] [CrossRef]
  18. Tang, B.; Xu, Y.X.; Song, X.F.; Sun, Z.; Yu, J.G. Effect of inlet configuration on hydrocyclone performance. Trans. Nonferrous Met. Soc. China 2017, 7, 1645–1655. [Google Scholar] [CrossRef]
  19. Li, F.; Liu, P.K.; Yang, X.H.; Zhang, Y.K.; Zhao, Y.Q. Effects of inlet concentration on the hydrocyclone separation performance with different inlet velocity. Powder Technol. 2020, 375, 337–351. [Google Scholar] [CrossRef]
  20. Zhu, G.F.; Liow, J.L. Experimental study of particle separation and the fishhook effect in a mini-hydrocyclone. Chem. Eng. Sci. 2014, 111, 94–105. [Google Scholar] [CrossRef]
  21. Su, T.L.; Zhang, Y.F. Effect of the Vortex Finder and Feed Parameters on the Short-Circuit Flow and Separation Performance of a Hydrocyclone. Processes 2022, 10, 771. [Google Scholar] [CrossRef]
  22. Junkratuek, A.; Srudhiprom, J.; Srinophakun, T. Computational fluid dynamics of a horizontal hydrocyclone for freezing desalination. Asia-Pac. J. Chem. Eng. 2017, 12, 765–774. [Google Scholar] [CrossRef]
  23. Jiang, L.Y.; Liu, P.K.; Zhang, Y.K.; Yang, X.H.; Wang, H. The Effect of Inlet Velocity on the Separation Performance of a Two-Stage Hydrocyclone. Minerals 2019, 9, 209. [Google Scholar] [CrossRef] [Green Version]
  24. Jiang, J.; Ying, R.; Feng, J.A.; Wang, W.B. Computational and Experimental Study of the Effect of Operating Parameters on Classification Performance of Compound Hydrocyclone. Math. Probl. Eng. 2018, 2018, 7596490. [Google Scholar] [CrossRef] [Green Version]
  25. Xu, Y.X.; Tang, B.; Song, X.F.; Li, S.M.; Sun, Z.; Yu, J.G. Computational study and PIV validation of flow field in a hydrocyclone. J. East China Univ. Sci. Technol. (Nat. Sci. Ed.) 2013, 39, 52–56. [Google Scholar] [CrossRef]
  26. Shapiro, E.; Drikakis, D. Artificial compressibility, characteristics-based schemes for variable density, incompressible, multi-species flows. Part I. Derivation of different formulations and constant density limit. J. Comput. Phys. 2005, 210, 584–607. [Google Scholar] [CrossRef] [Green Version]
  27. Liu, P.K.; Fu, W.X.; Jiang, L.Y.; Zhang, Y.K.; Li, X.Y.; Yang, X.H.; Chen, B. Effect of back pressure on the separation performance of a hydrocyclone. Powder Technol. 2022, 409, 117823. [Google Scholar] [CrossRef]
  28. Zhang, Y.M.; Cai, P.; Jiang, F.H.; Dong, K.J.; Jiang, Y.C.; Wang, B. Understanding the separation of particles in a hydrocyclone by force analysis. Powder Technol. 2017, 322, 471–489. [Google Scholar] [CrossRef]
  29. Hao, M.X.; Zhang, Y.H.; Huang, Y.; Wang, H.L.; Li, H.; Du, J.Q.; Lv, W.J.; Li, J.P.; Fu, P.B.; Wu, J.W. Effect of particle self-rotation on separation efficiency in mini-hydrocyclones. Powder Technol. 2022, 399, 117165. [Google Scholar] [CrossRef]
  30. Thornber, B.J.R.; Drikakis, D. Numerical dissipation of upwind schemes in low Mach flow. Int. J. Numer. Methods Fluids 2008, 56, 1535–1541. [Google Scholar] [CrossRef]
  31. Xu, Y.X.; Song, X.F.; Sun, Z.; Tang, B.; Li, P.; Yu, J.G. Numerical Investigation of the Effect of the Ratio of the Vortex-Finder Diameter to the Spigot Diameter on the Steady State of the Air Core in a Hydrocyclone. Ind. Eng. Chem. Res. 2013, 52, 5470–5478. [Google Scholar] [CrossRef]
  32. Karimi, M.; Akdogan, G.; Dellimore, K.H.; Bradshaw, S.M. Quantification of numerical uncertainty in computational fluid dynamics modelling of hydrocyclones. Comput. Chem. Eng. 2012, 43, 45–54. [Google Scholar] [CrossRef]
  33. Schwarz, M.P.; Song, T.; Yang, T.H.; Zhou, J.W.; Wang, Q.K. Reconciliation of empirical correlations and CFD results for hydrocyclone performance for application in process modelling. Powder Technol. 2019, 144, 106028. [Google Scholar]
  34. Hsieh, K.T.; Rajamani, K. Phenomenological model of the hydrocyclone: Model development and verification for single-phase flow. Int. J. Miner. Process. 1988, 22, 223–237. [Google Scholar] [CrossRef]
  35. Feng, J.A.; Tang, X.Q.; Wang, W.B.; Ying, R.; Zhang, T. Reliability verification method of numerical simulation based on grid independence and time independence. J. Shihezi Univ. Nat. Sci. 2017, 35, 52–56. [Google Scholar] [CrossRef]
  36. Xu, Y.X.; Song, X.F.; Sun, Z.; Tang, B.; Yu, J.G. Steady-State Distribution of Air-Core in a Hydrocyclone. Can. J. Chem. Eng. 2017, 95, 757–766. [Google Scholar] [CrossRef]
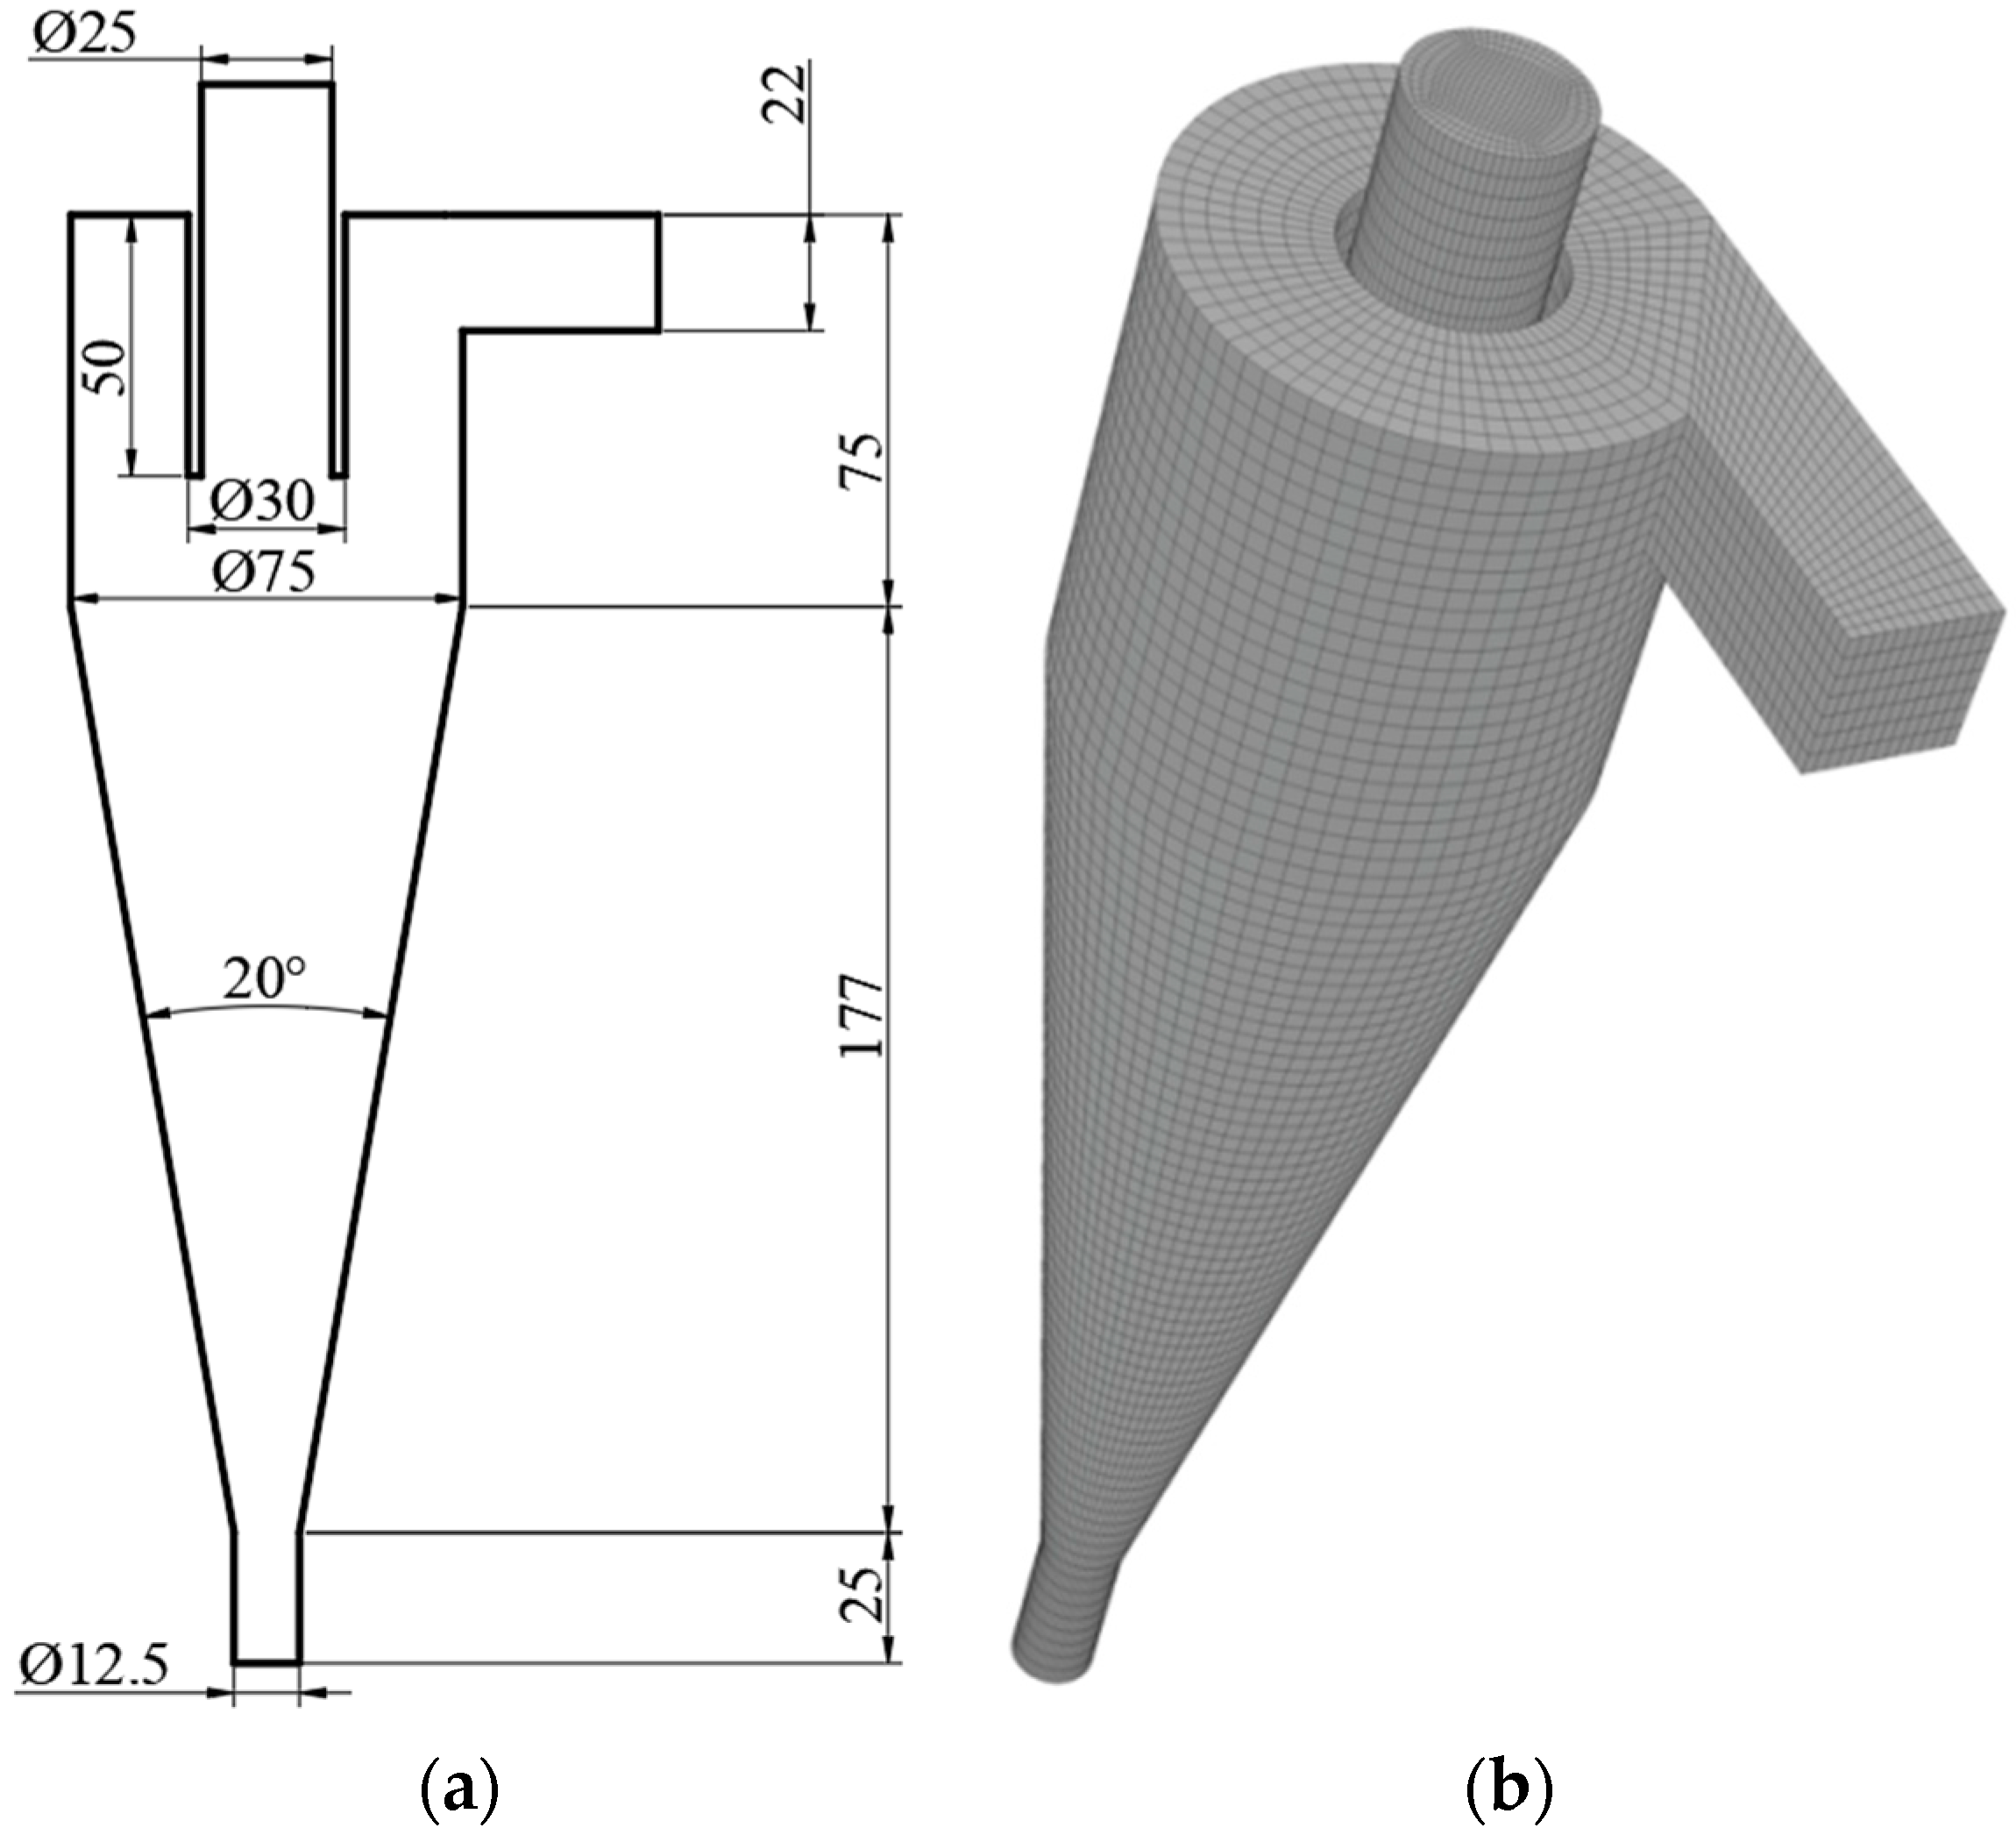
Figure 1. Hydrocyclone. (a) Schematic of hydrocyclone; (b) Meshing of hydrocyclone.
Separations 09 00349 g001
Figure 2. Independence verification of model and grid. (a) Independence verification of model; (b) Independence verification of grid.
Separations 09 00349 g002
Figure 3. Schematic of axial characteristic section of the hydrocyclone.
Separations 09 00349 g003
Figure 4. Clouds of static pressure under different feed rates.
Separations 09 00349 g004
Figure 5. Distributions of the static pressure. (a) z1 = 90 mm; (b) z2 = 170 mm.
Separations 09 00349 g005
Figure 6. Distribution of the pressure gradient. (a) z1 = 90 mm; (b) z2 = 170 mm.
Separations 09 00349 g006
Figure 7. Distribution of the tangential velocity. (a) z1 = 90 mm; (b) z2 = 170 mm.
Separations 09 00349 g007
Figure 8. Distributions of the axial velocity. (a) z1 = 90 mm; (b) z2 = 170 mm.
Separations 09 00349 g008
Figure 9. LZVV diagram.
Separations 09 00349 g009
Figure 10. Distribution of the radial velocity. (a) z1 = 90 mm; (b) z2 = 170 mm.
Separations 09 00349 g010
Figure 11. Turbulent kinetic energy. (a) Axial distribution of turbulent kinetic energy (b) Distribution of turbulent kinetic energy at z3.
Separations 09 00349 g011
Figure 12. Development of air column under different feed rates at inlet. (a) Development of air column at a feed rate at inlet of 1 m/s; (b) Development of air column at a feed rate at inlet of 2 m/s; (c) Development of air column at a feed rate at inlet of 3 m/s; (d) Development of air column at a feed rate at inlet of 4 m/s; (e) Development of air column at a feed rate at inlet of 5 m/s.
Separations 09 00349 g012aSeparations 09 00349 g012b
Figure 13. Axial distribution of air column diameter.
Separations 09 00349 g013
Figure 14. Split ratio curves under different feed rates at inlet.
Separations 09 00349 g014
Table 1. Main structural parameters.
Structural ParametersValue
Cylinder diameter/mm75
Import equivalent diameter/mm24.99
Overflow outlet diameter/mm25
Underflow outlet diameter/mm12.5
Overflow pipe insertion depth/mm50
Cone angle/(°)20
Cylinder height/mm75
Cone height/mm177
Publisher’s Note: MDPI stays neutral with regard to jurisdictional claims in published maps and institutional affiliations.