1. Introduction
Grapevine is one of the most important horticultural crops in the world planted on approximately 7.449 million ha in 2018, while in the same year, grapes were produced in the quantity of 77.8 million tons [
1]. Many different plant organs are responsible for the quality and quantity of grapes. Among them, leaves have a crucial role since this organ is responsible for photosynthesis, i.e., the assimilation of carbon dioxide and biosynthesis of carbohydrates. Grapevine leaf is composed of different tissues such as cuticle, upper and lower epidermis, and mesophyll that consists of palisade parenchyma and spongy parenchyma with embedded xylem and phloem. These tissues have various physiological functions and chemical compositions. The cuticle consists of cutin, polyphenols, and lipids. The vacuoles of epidermis cells contain among other compounds a high level of polyphenolics [
2].
As one of the most valuable compounds contained in grapevines, phenols are used in the food industry as a natural colorant and nutritional supplement [
3]. Moreover, due to their strong antioxidant activity, they are used in the pharmaceutical industry as an herbal medicine for treating heart diseases [
4] and improving microcirculation [
5]. They are responsible for the so-called French paradox, which explains the fact that there is a relatively low incidence of heart diseases among the French, even though their diet is rich in saturated fats [
6]. There are many grape by-products (pomace, shoots, petioles, stems, and leaves) that are also beneficial to human health, due to their high phenolic content and antioxidant power [
7], thus, it is important to investigate them as the functional ingredients for the food and pharmacy industry.
Previous research works regarding phenols have investigated flavonols [
4,
5,
8,
9,
10,
11], flavanols [
5,
8,
9,
11], hydroxycinnamic acids [
5,
8,
11,
12], hydroxybenzoic acids [
5,
12] and stilbenes [
8,
9,
11] in grapevine leaves, but also total phenolics, flavonoids, flavonols and flavanols in other grapevine parts—berry stems, petioles, and shoots [
13].
The biosynthesis of phenolic compounds can vary depending on different environmental stresses—drought [
11], UV-B radiation [
10], and pathogenic infections [
12]. They also depend on the analysed plant organ and plant age [
9,
13].
There is some research on the synthesis of phenolic compounds in stress conditions, such as limited water supply. As a defence response to stress (water deficit stress), plants produce free radicals. To prevent damages to free radicals, they also synthesize different protective compounds, and phenols are one of them [
11]. Prolonged drought stress leads to an increase in the formation of
cis-resveratrol-3-
O-glucoside,
trans-resveratrol-3-
O-glucoside, (-)-epicatechin, (-)-epicatechin gallate, kaempferol-3-
O-glucoside, cyanidin-3-
O-glucoside, quercetin-3-
O-glucoside, and quercetin-3-
O-glucuronide [
11], which is in the agreement with the study in [
10], where an increased concentration of kaempferol-3-
O-glucoside and quercetin-3-
O-glucoside was found in leaves during water stress conditions. UV-B radiation affects photosynthetic activity, thus reducing nutrient supply to the fruit. Flavonols protect plants against UV radiation by increasing the levels of quercetin-3-
O-glucoside and kaempferol-3-
O-glucoside, presenting as the biomarkers for UV-B stress [
10].
Basipetal leaves contain a higher concentration of
cis-resveratrol-3-
O-glucoside and (+)-catechin, while a higher concentration of quercetin-3-
O-glucuronide was detected in acropetal leaves [
9]. The leaf age influences the content of total phenolics, flavonoids, flavonols, and flavanols [
5,
9,
13]. The content of flavonols decreased in the period following 10 weeks after the grape harvest, meaning that, when searching for the maximum phenolic content, leaves should be harvested soon after the grape harvest, but also ensuring that the plants collect extra nutrients and recover enough to support the extra growth of the new shoots [
5].
Cell walls are composed of different structural components (polyphenols, polysaccharides, cell wall proteins), each playing important role in fruit ripening, disease resistance, and grape quality. In the grapevine, the leaf cell walls are the main structures that act as a defence against fungal infections [
14]. Hence, it is important to know the leaf cell wall structure and molecular composition, in order to understand fungal diseases progress and disease resistance. Pathogenic fungi
Botrytis cinerea,
Erysiphe necator,
Plasmopara viticola, which cause diseases such as grey rot and mildews, usually infect leaves first, degrading the cell walls enzymatically or parasitically and thus reducing photosynthetic activity, berry quality, and damaging vine health, generating severe economic consequences for the grape and wine industry around the world [
15]. Fungal pathogens usually affect the young leaves and, when leaves reached 80% of their final surface, they become practically resistant to them [
12]. The covalent binding of the phenols to polysaccharidic material of the cell wall reduces the sensitivity of the wall structure to the hydrolytic cleavage, which is causally related to the plant resistance to fungal diseases. The content of protocatechualdehyde and protocatechuic acid decreased during leaf development, enhancing the resistance to pathogenic diseases. This event may be a step towards developing the grapevine leaf’s defence system against fungal diseases [
12].
The berry stem at the stage of maturity showed higher amounts of flavonoids, flavonols, and flavonols content compared to other parts, including berries and the berry stems, leaves, petioles, and shoots showed a higher antioxidant power than berries [
13].
One of the crucial roles of polyphenolics in grapevine leaves, as mentioned above, is their protective activity against fungal diseases, one of which is downy mildew caused by
Plasmopara viticola. A vast study was conducted on the resistant cultivar Bianca with artificially inoculated leaf discs in which 176 metabolites were identified [
13]. Among them, 53 were involved in the response to the pathogen infection. During the later stages after inoculation, a major increase was found in some molecules deriving from resveratrol, such as
trans-ε-viniferin,
trans- and
cis-piceid, isorhapontin, ampelopsin H + vaticanol C-like isomer,
α-viniferin and pallidol. Moreover,
trans- and
cis-piceid,
trans-resveratrol,
trans-ε- and
trans-δ-viniferins, and pterostilbene were detected in another research [
16]. Similar compounds (
trans-isomers of piceid, resveratrol,
ε-viniferin and
δ-viniferin) were found in the leaf discs of four cultivars (Chasselas, interspecific hybrids IRAC 1999 (Gamaret × Solaris), IRAC 2292 (Seyval blanc × Gamaret),
Vitis candicans) inoculated with
Erysiphe necator, which is a causal agent of grapevine powdery mildew [
17]. These experiments indicate that phenolic compounds (emphasis on stilbenes) strongly contribute to the establishment of resistance mechanisms against grapevine fungal diseases. Since stilbenes’ synthesis mostly occurs in the leaves of resistant cultivars after they are attacked by a pathogen, these compounds prove to be a useful tool to distinguish susceptible from resistant cultivars. For the same reason, some of them are proposed as biomarkers for the resistance of grapevine to fungal diseases, which is important for a better understanding of the defence mechanism.
For obtaining precise and accurate results of a chemical analysis it is necessary to optimize every step in this process, thus the selection of an extraction method is mandatory. To the best of our knowledge, there is no standardized extraction method for the recovery of polyphenolics from grapevine leaves, thus the aim of this study was the optimization of a simple solid–liquid extraction method. Several parameters, i.e., the type of organic solvent, the sample weight, the extraction temperature, and the extraction time which could affect the extraction efficiency were evaluated and optimized using a response surface methodology (RSM) and employing a Box–Behnken experimental design (BBD).
2. Materials and Methods
2.1. Samples and Chemicals
Acetonitrile (ACN) of HPLC grade was obtained from J. T. Baker (Deventer, The Netherlands). Formic acid and 85% orthophosphoric acid were purchased from Sigma (St. Louis, MO, USA). Ethanol (EtOH) was provided by Kemika (Zagreb, Croatia). Standards used for identification and quantification purposes were as follows: caffeic acid, caftaric acid, vanillic acid, p-coumaric acid, ferulic acid, gallic acid, (−)-epicatechin, (+)-catechin, epicatechin gallate, quercetin-3-O-glucoside, trans-resveratrol-3-O-glucoside, kaempferol-3-O-glucoside, isorhamnetin-3-O-glucoside, and syringic acid were purchased from Sigma-Aldrich (St. Louis, MO, USA); epigallocatechin, procyanidin B1, procyanidin B2, quercetin-3-O-rutinoside, quercetin-3-O-galactoside, and myricetin-3-O-glucoside were purchased from Extrasynthese (Geney, France).
Grapevine leaves from the Vitis vinifera variety of Chardonnay were taken from a vineyard located at the Jazbina Experimental Station, Faculty of Agriculture, University of Zagreb. Immediately after sampling, leaves were frozen at −25 °C and freeze-dried (Alpha 1–2 LDPlus, Martin Christ Gefriertrocknungaslangen GmbH, Osterode am Harz, Germany). The dry material was milled (MiniG Mill, SPEX SamplePrep, Metuchen, NJ, USA) and the obtained powder was stored (2 °C) in a glass container evacuated in a desiccator.
2.2. Extraction Procedure
All experiments were conducted on a magnetic stirrer (RTC basic, IKA, Staufen, Germany) at 650 rpm. The appropriate weight of the sample was put in the vial and 10 mL of extraction solvent was added. The obtained extraction mixture was placed at the magnetic stirrer and left for the specified time (
Table 1). After extractions were finished, supernatants were filtrated through a Phenex-PTFE 0.20 µm syringe filter (Phenomenex, Torrence, USA) and analysed by the HPLC method.
The extraction solvents were composed from 20% (
v/
v/
v) of appropriate organic solvent (ACN or EtOH), 1% formic acid (
v/
v/
v) and 79% water (
v/
v/
v). The optimization of the extraction procedure was done applying the Box–Behnken experimental design according to the variables depicted in
Table 1. Sample weight, extraction temperature, and extraction time were numeric variables, while solvent type was a categoric variable.
2.3. LC Analysis
HPLC analysis of phenolic compounds was performed according to the method described by Tomaz and Maslov (2016) [
18] on an Agilent 1100 Series system (Agilent, Waldbronn, Germany), equipped with DAD and FLD. In brief, the grapevine leaves extracts were injected on a reversed-phase column Luna Phenyl-Hexyl (4.6 × 250 mm; 5 µm particle (Phenomenex, Torrance, CA, USA)), thermostated at 50 °C. The solvents were water/phosphoric acid (99.5:0.5,
v/
v, solvent A) and acetonitrile/water/phosphoric acid; 50:49.5:0.5,
v/
v/
v, solvent B), and the flow rate was 0.9 mL min
−1. Flavonols were detected at 360 nm, hydroxycinnamic acids at 320 nm, stilbenes at 308 nm, and hydroxybenzoic acids at 280 nm. Flavan-3-ols were detected at
λex = 225 nm and
λem = 320 nm. Phenolic compounds in obtained extracts were identified by matching the retention time of each chromatographic peak with external standards and the DAD spectrum. Quantification of individual phenolic peaks was done by the external standard method. The results are expressed in mg kg
−1 of dry weight (dw) of grapevine leaves.
As dependent variables, the sums of resulting contents of the individual flavonols (FG), resveratrol-3-O-glucoside (RG), flavan-3-ols (FOL), hydroxycinnamic (HC), and hydroxybenzoic acids (HB) were used.
2.4. Experimental Design and Statistical Analysis
The BBD experiments results were analysed by nonlinear multiple regression with backward elimination to fit the second-order equation to the dependent variable [
19]. The study of the experimental design and calculation of the predicted data were completed using Design Expert 9 software (Stat-Ease Inc., Minneapolis, MN, USA). The parameters were interpreted using an
F-test. To establish the optimal conditions analysis of variance (ANOVA), a regression analysis and plotting of the response surface plot were conducted. For obtaining optimal extraction conditions Derringer’s function was applied.
The mean values and relative standard deviations were calculated and reported using SAS 9.3 software (SAS Institute Inc., Cary, NC, USA, 2012).
3. Results and Discussion
Independent variables (sample weight, temperature and time of extraction, type of organic solvent) and their levels were chosen based on our previous research conducted on grape skins [
19]. As dependent variables, the total content of flavonol-glycosides (expressed as a sum of the contents of myricetin-3-
O-glucuronide, myricetin-3-
O-glucoside, myricetin-3-
O-glucuronide, rutin, quercetin-3-
O-glucuronide, quercetin-3-
O-glucoside, kaempferol-3-
O-glucuronide, kaempferol-3-
O-glucoside, kaempferol-3-
O-galactoside, and isorhamnetin-3-
O-glucoside), stilbene (resveratrol-3-
O-glucoside), flavan-3-ols (expressed as a sum of the contents of gallocatechin, procyanidins B1, B2, B3, B4, epigallocatechin, catechin, and epicatechin), hydroxycinnamic acids (expressed as a sum of the contents of caftaric acid, caffeic acid, coutaric acid, coumaric acid, ferulic acid, and sinapic acid) and hydroxybenzoic acids (expressed as a sum of the contents of gallic acid, protocatechuic acid, vanillic acid, and syringic acid) were used. The parameters of the analysis of the variance (ANOVA) for all obtained models are presented in
Table 2. The models’
p-values were in the range from <0.0001 up to 0.0021, while the lack of fit values was from 0.4930 to 0.0639, which means that the obtained models were accurate. Adequacy precision is an indicator of the signal-to-noise ratio. In general, a ratio greater than 4 is desirable. For the studied models, these ratios were greater than 12.
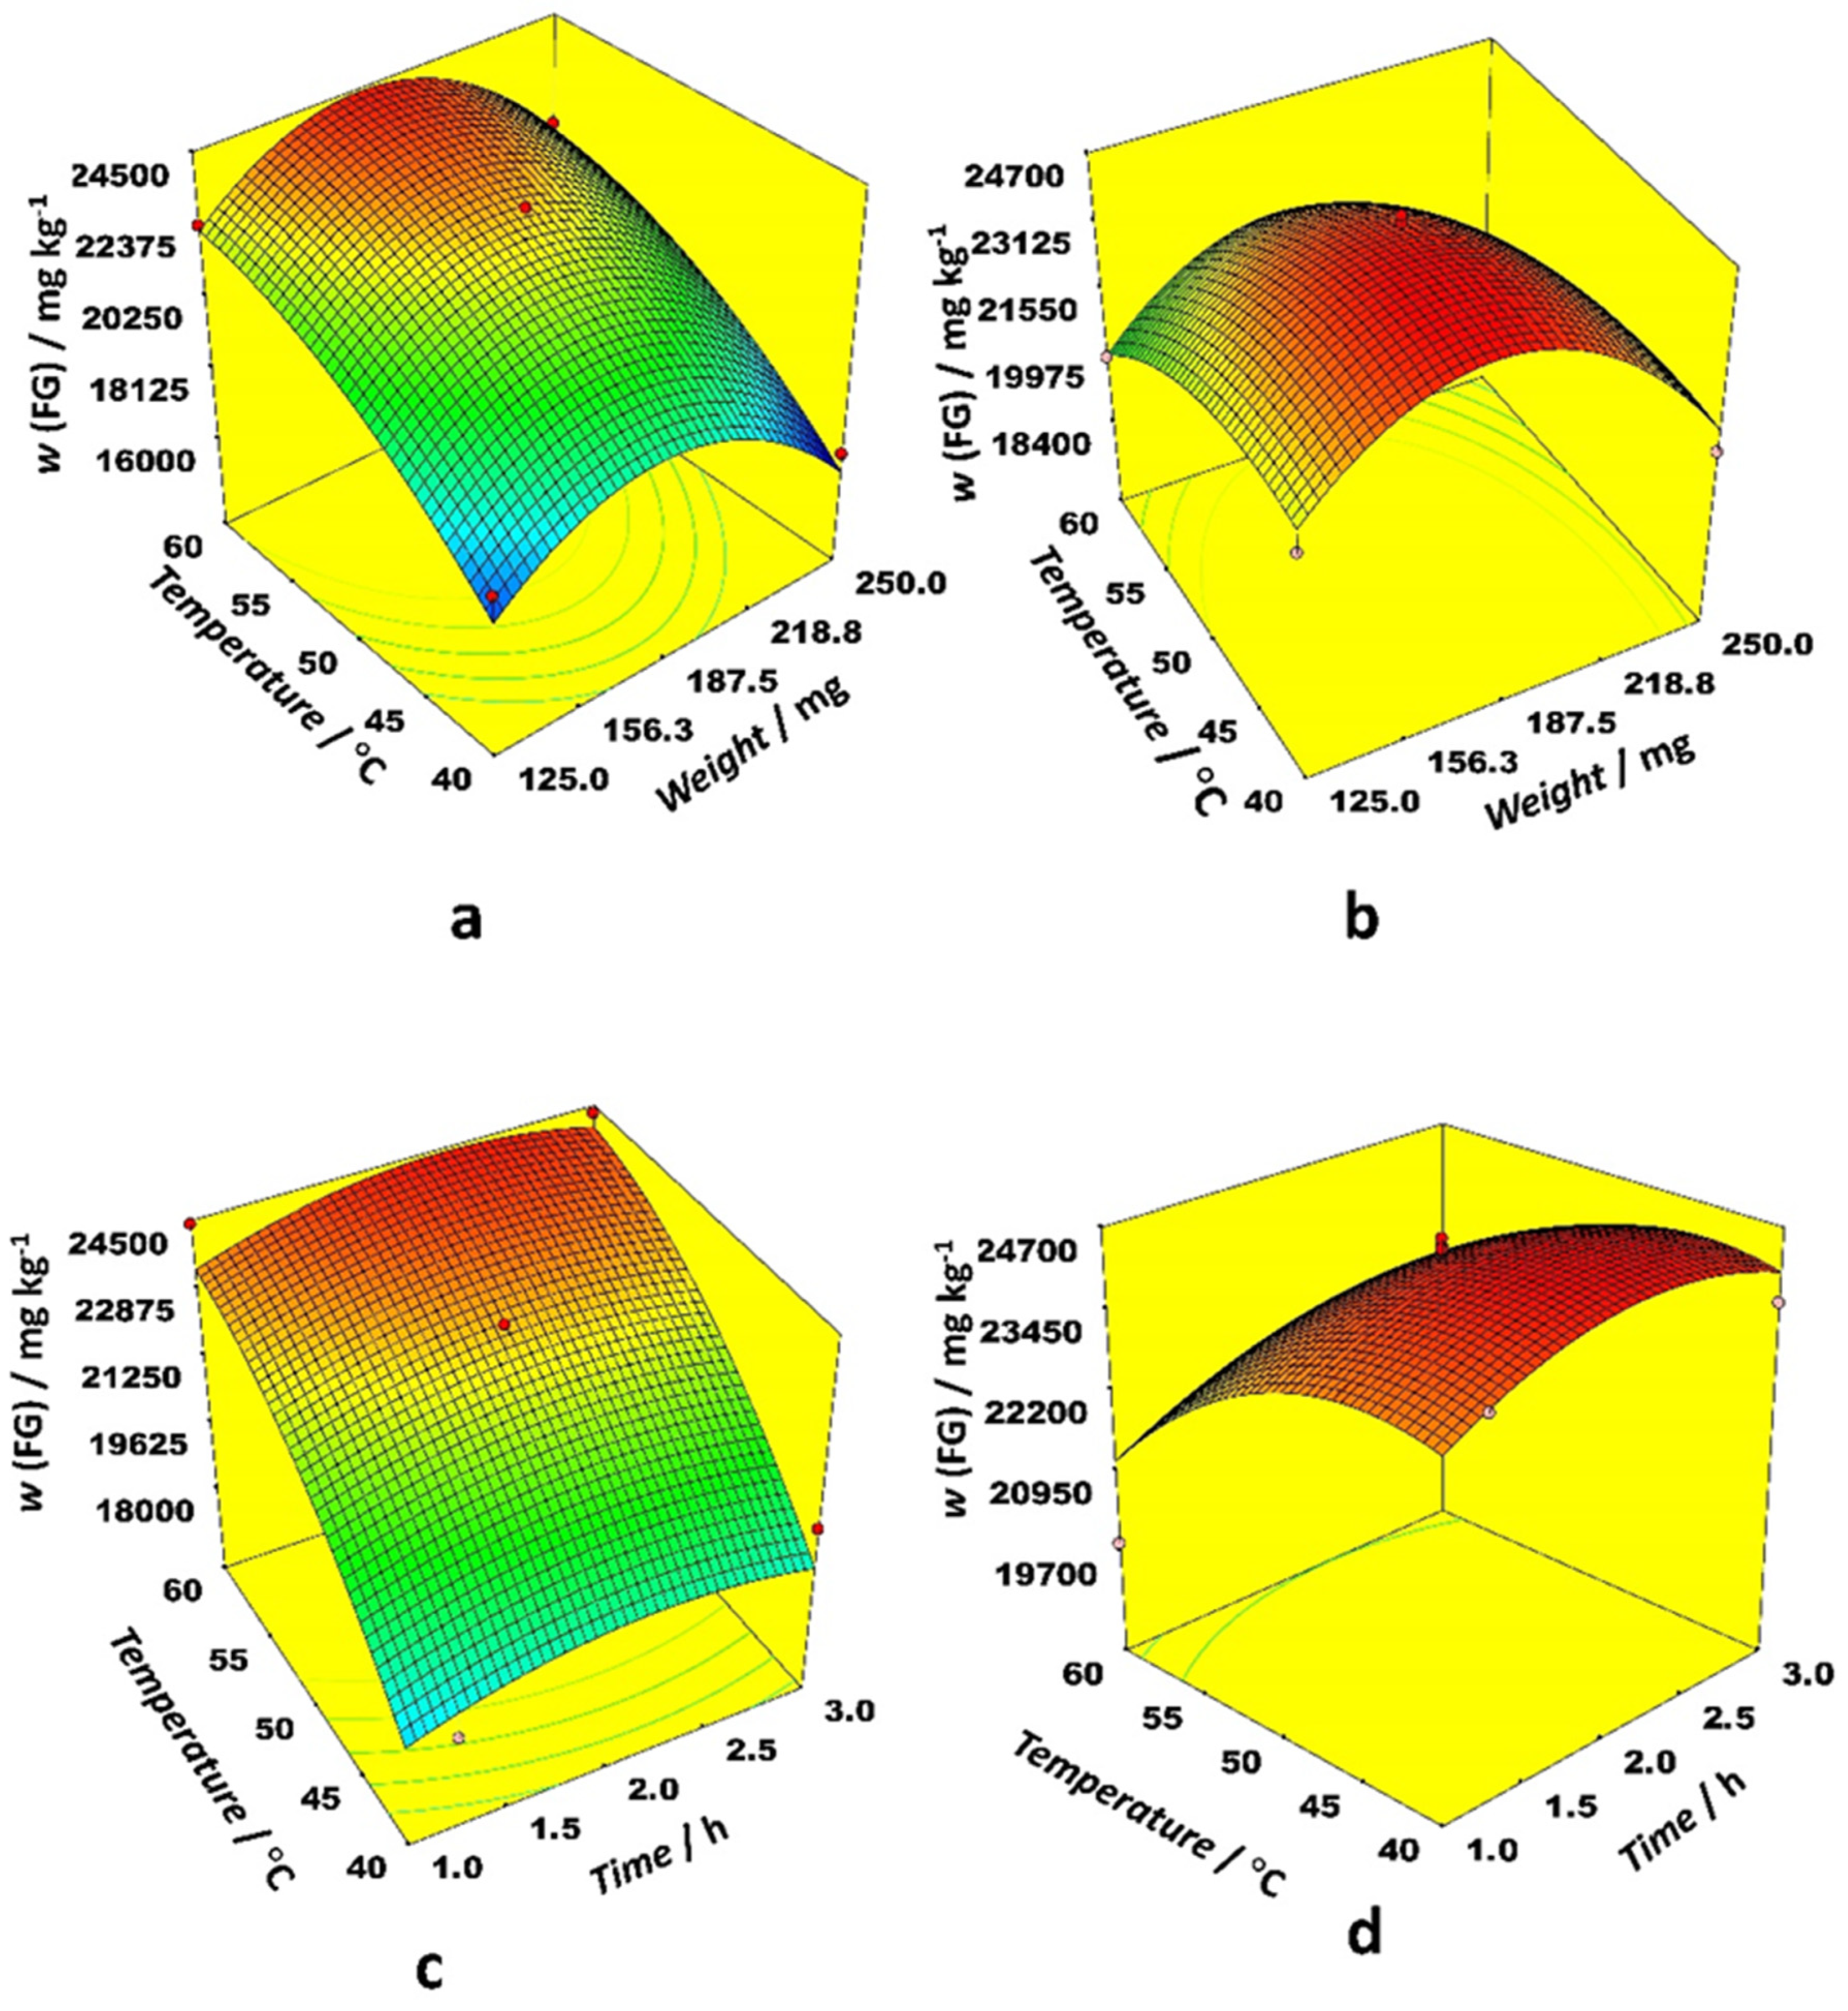
In the case of FG contents, as linear effects, the most significant variable was the type of organic solvent followed by the extraction temperature and sample weight (
Table 2). Despite the level of other variables, the highest contents of FG were observed in the case of ACN. Only the interaction between the type of solvent and extraction temperature was statistically significant. Among quadratic terms, the sample weight, extraction temperature, and time were significant.
Figure 1 depicts 3D response surface plots generated by the model for the most prominent interactions. The effect of the interaction between weight and time on FG content was similar for ethanol and acetonitrile as an organic modifier, while the interaction between time and temperature for both examined solvents was quite different. Weights between 156 and 188 mg gave the highest FG content while time was a less important variable. Higher temperatures were preferable with ethanol, but lower ones with acetonitrile. The effect of interaction between weight and temperature on FG content is quite different for ethanol and acetonitrile as the organic modifier. The same trend is observed for the interaction between time and temperature. Higher temperatures were preferable with ethanol, while modest temperatures were better for acetonitrile. The highest FG content for both organic modifiers was observed at modest sample weights.
Solvent type, temperature, and sample weight were the most prominent linear effects that affected the FOL content (
Table 2). For both types of organic modifiers, the highest FOL contents were observed in the temperature range between 50 and 55 °C and a weight around 188 mg. Prolongated extraction positively affected the extraction efficiency of FOL (
Figure 2). Interactions between sample weight and time, and temperature and time as well, had the most prominent effects.
The 3D response surface plots in
Figure 2 illustrate optimal conditions for FOL extraction. Starting with 200 mg of dry sample, it is possible to extract around 2300 mg kg
−1 of FOL with both solvents, although a slightly lower temperature (50 °C) is needed when acetonitrile is used compared to ethanol (60 °C). Similarly for the RG extraction, acetonitrile requires a longer extraction time (between 2.5 and 3 h) while a duration of 2 h is optimal for the ethanol-aided extraction of flavan-3-ols.
Figure 3 depicts the optimal conditions for RG and HC extraction. For both solvent types in the case of RG and HC, it is optimal to use around 180 mg of the sample with the only difference that ethanol requires higher temperatures (60 °C) while the temperature between 40 and 45 °C gives the highest level of RG and HC content when acetonitrile is used as a solvent. On the other hand, acetonitrile requires one hour longer extraction time in comparison with ethanol. Based on the p-value, the only variable with high statistical significance was a solvent type for both RG and HC. Other significant variables were the temperature of extraction and the weight of the sample. The interaction between extraction temperature and solvent type was significant. Among quadratic terms, the sample weight and the extraction temperature were significant (
Table 2).
Among linear effects in the case of the HB, only the sample weight was statistically significant, while the other ones had a negligible effect. The effect of interaction between time and temperature on HB content was different for ethanol and acetonitrile as the organic modifier. When ethanol was applied as a modifier, the highest HB content was obtained at low temperatures and longer extraction times. The modest temperatures and long extraction time positively affected extraction efficiency with acetonitrile as a modifier (
Figure 4).
To obtain the maximum content of FG (2457 mg kg−1), it is necessary to use 180.70 mg of the sample weight. The extraction should be performed with acetonitrile and should last 2 h and 4 min at 43 °C. Similar conditions are needed for obtaining the maximum content of HC (7014 mg kg−1)—it is also better to use acetonitrile as a solvent, the sample weight should be 178.6 mg, and the extraction should last 2 h and 11 min at 46 °C. Moreover, acetonitrile is required for the extraction of RG for 2 h and 13 min at 45 °C. In these conditions, the dried sample weight should be 111.1 mg to get 178.6 mg kg−1 of RG content. With a sample weight of 170.4 mg, it is possible to extract 442.9 mg kg−1 of HB. However, different conditions are required compared to the abovementioned ones. In this case, ethanol serves more efficiently. The extraction time should be 3 h at 46 °C. Ethanol was also a more adequate solvent for FOL extraction. With a 2 h and 12 min long extraction at a temperature of 59 °C and 176.3 mg of sample weight, it is possible to recover the maximum content of FOL content (2370 mg kg−1). Since all examined phenolic groups require different extraction conditions, it is preferable to find a compromise solution for the most efficient extraction method.
By applying the Derringer function, optimal conditions were determined (
Table 3). The optimal extraction condition was determined based on the maximum content of FG, FOL, HB, HC, and RG, together. By comparing the predicted value for phenolics content with the experimental one, it can be concluded that the RSM model was accurate and satisfactory.
A similar type of research was conducted on another grapevine tissue—berry skin. Tomaz et al. [
19] developed a solid–liquid extraction of phenolics from red grape skins. For both experiments optimal extraction solvent was acetonitrile, and an almost equal temperature was required. However, a higher sample weight and a longer extraction time are needed to obtain the maximum phenolic content from leaf tissue (
Table 3) in comparison with berry skin tissue (125 mg and 1 h). It can be explained by their mostly different anatomical-morphological structures. The main part of a leaf is mesophyll, which represents the photosynthesis machinery of a plant. It is mostly chlorophyll-rich tissue, although it does not contain phenolic compounds. The mesophyll is protected by the upper and lower epidermis which are covered with a cuticle—a very thin but important and phenolics-rich (especially hydroxycinnamic acids and flavonoids) layer. Moreover, the epidermis can have various types of hairs called trichomes, particularly along the veins on the abaxial (bottom) side. In addition to their other roles, the trichomes provide protection from damaging ultraviolet radiation (due to their phenolic compounds absorbing and scattering radiation). In comparison with the leaf anatomy and its chemical background, berry skin is a slightly different type of tissue. It is called exocarp and makes up between 5% and 18% of the fresh weight of mature berries. The exocarp is composed of the outer epidermis covered with a waxy cuticle and the underlying outer hypodermis. In this case, phenolic-rich cells are part of the epidermis and hypodermis, while the cuticle does not contain phenolic compounds [
2]. Therefore, a possible explanation for the higher sample weight of leaves is their mostly unusable tissue (mesophyll), while only the thin cuticle and trichomes contain phenolic compounds. On the other hand, the cuticle is the only wasted tissue from berry skin when the extraction of phenolics is conducted.
The most abundant polyphenolic compound determined in “Chardonnay” leaves were quercetin-3-
O-glucoside followed by caftaric acid, procyanidin B1, and quercetin-3-
O-glucuronide (
Table 4). Their high content can be explained by extremely warm and dry weather conditions coupled with numerous hours of insolation with high UV intensity during the grapevine vegetation period in 2017 in the continental part of Croatia. RSD was in the range from 0.31 up to 4.52% which means that the optimized method is accurate and precise (
Table 4).


 ,
, 


