Article

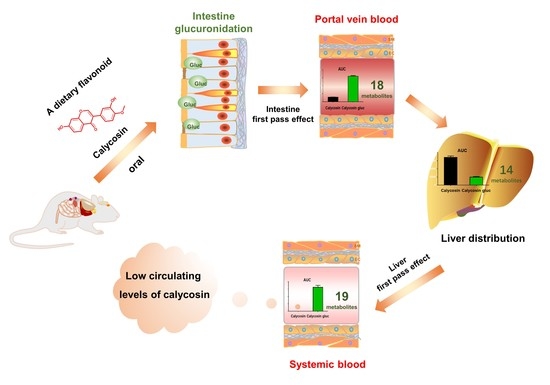
Intestinal Glucuronidation, Prior to Hepatic Glucuronidation, Plays an Important Role in the Low Circulating Levels of Calycosin

1
School of Chinese Materia Medica, Nanjing University of Chinese Medicine, Nanjing 210023, China
2
Shanghai Institute of Materia Medica, Chinese Academy of Sciences, Shanghai 201203, China
3
Guangxi Key Laboratory of Translational Medicine for Treating High-Incidence Infectious Diseases with Integrative Medicine, Guangxi University of Chinese Medicine, Nanning 530200, China
*
Authors to whom correspondence should be addressed.
These authors contributed equally to this work.
Separations 2022, 9(5), 115; https://doi.org/10.3390/separations9050115
Submission received: 9 April 2022 / Revised: 25 April 2022 / Accepted: 5 May 2022 / Published: 8 May 2022

Abstract

:
Calycosin is a dietary flavonoid with favorable activities, which seems to be inconsistent with its low circulating levels in vivo. To address this issue, we developed a strategy to understand calycosin distribution by integrating qualitative and quantitative analyses of calycosin and its metabolites in portal vein plasma, the liver, and systemic plasma after oral administration to rats. Consequently, 21 metabolites were characterized in total, including the first report of a reductive biotransformation and 14 new metabolites. Compared with the low levels of calycosin, calycosin glucuronides were predominant in circulation, and both the hepatic and intestinal regions contributed to the high exposure of these calycosin glucuronides. However, intestinal glucuronidation, prior to hepatic glucuronidation, plays a key role in the low circulating levels of calycosin.

Graphical Abstract

1. Introduction

Botanical dietary supplements have been widely utilized in the United States and Europe for health maintenance since the United States Dietary Supplement and Health Education Act was enacted in 1994 [1]. Astragali Radix has been widely used as a fundamental herbal medicine in China, Japan, and other countries. Moreover, it has been listed as a dietary supplement by the U.S. Food and Drug Administration since 1994 and as “medicine-food homology” species by the National Health Commission of the People’s Republic of China since 2018 [1,2]. Calycosin, one of the main dietary flavonoids found in Astragali Radix [3], has various therapeutic effects, including hepatoprotection, anti-inflammation, anti-hepatic injury, antitumor, antiviral, anti-diabetic nephropathy, and cardioprotection [4,5,6,7,8,9,10]. To date, the health benefits of calycosin have been practically validated in various animal models, such as liver injury induced by CCl4 in mice [7], nonalcoholic steatohepatitis (NASH) in mice [11], and hepatic fibrosis [8].
Even though calycosin has been widely used in food and medicine, it has long been acknowledged that its circulation levels are exceedingly low. Calycosin could easily diffuse across the membrane, but only a very small amount of has been detected in plasma, but not bile, after oral administration [12]. Previously, studies have focused on calycosin metabolism by applying in vitro tools, including rat intestinal microsomes (RIMs) and rat liver microsomes (RLMs), in which calycosin glucuronidation and sulfation were observed [12,13,14,15]. In addition, our previous study demonstrated that calycosin, as a major metabolite, displayed extensive and substantial biodistribution in tissues after oral administration of calycosin-7-β-D-glucopyranoside. Other studies have revealed that calycosin-3′-glucuronide is the primary circulating form of calycosin-7-β-D-glucopyranoside in plasma [12,15,16]. Therefore, we assumed that phase II metabolism could be the main reason for the low exposure of calycosin in systemic circulation. However, to date, no studies have focused on the metabolic patterns of orally administered calycosin in rats. Thus, the cause of the low circulating calycosin levels is far from being understood by applying only in vitro tools.
In this study, to determine what caused the low circulating levels of calycosin, the intestinal and liver first-pass effects were evaluated by qualitative and quantitative analyses in rats according to the drug delivery process in vivo. With the aid of high-performance liquid chromatography quadrupole time-of-flight tandem mass spectrometry (HPLC-Q-TOF-MS/MS), the structures of the calycosin metabolites were unambiguously or tentatively identified from portal vein plasma, the liver, and systemic plasma following calycosin oral administration. Calycosin and its glucuronides, which were determined to be the primary metabolites based on the Q-TOF peak areas, were quantified in the above-mentioned biosamples by a high-performance liquid chromatography method coupled with triple quadrupole tandem mass spectrometry (HPLC-QQQ-MS/MS).

2. Materials and Methods

2.1. Chemicals and Reagents

The calycosin, daidzein, formononetin, 7,3′,4′-trihydroxyisoflavone, and propranolol (internal standard, I.S.; purity > 98%) reference samples were purchased from Shanghai Standard Technology Co., Ltd. (Shanghai, China). Calycosin for dosing (purity > 95%) was obtained from Shanghai Yihe Biological & Technological Co., Ltd. (Shanghai, China). β-Glucuronidase from Helix pomatia (type H-2, aqueous solution ≥ 85,000 units/mL) was provided by Sigma-Aldrich Co., Ltd. (St. Louis, MO, USA). Ultrapure water was prepared using a Milli-Q System (Millipore, Billerica, MA, USA). High-performance liquid chromatography (HPLC) grade acetonitrile, methanol, and formic acid were procured from Thermo Fisher Scientific Co., Ltd. (Waltham, MA, USA). All other analytical-grade reagents were acquired from Sinopharm Chemical Reagent Co., Ltd. (Shanghai, China).

2.2. Instrumentation

Qualitative analysis of calycosin and its metabolites in various biological samples was performed by using an Agilent 6530 Q-TOF mass spectrometer equipped with a Dual Agilent Jet Stream electrospray ionization source in positive mode (Agilent Technologies, Palo Alto, CA, USA) that was connected to a 1260 Series HPLC system (Agilent Technologies). The operating parameters were optimized as follows: nebulizer at 45 psi; capillary at 4000 V; nozzle voltage at 1500 V; gas temperature of 300 °C; gas flow rate of 6 L/min; sheath gas temperature of 300 °C; sheath gas flow rate of 12 L/min; fragmentor at 100 V; and collision energy of 30 V. Separation was performed on an ACE Excel 3 C18 column (100 mm × 2.1 mm, 3.0 µm, Advanced Chromatography Technologies Ltd., Aberdeen, Scotland). Gradient elution with solvent A (0.1% formic acid in water) and solvent B (acetonitrile containing 0.1% formic acid) was conducted as follows: 0 min, 95% A; 1.5–3.0 min then 90% A; 3.0–10.0 min, 87% A; 10.0–20.0 min, 82% A; 20.0–23.0 min, 75% A; 23.0–25.0 min, 55% A; 25.0–27.0 min, 5% A; and 27.0–32.0 min, 95% A. The flow rate and the column temperature were set to 0.35 mL/min and 40 °C, respectively. System operations and data processing were performed using MassHunter Workstation (Agilent Technologies, Palo Alto, CA, USA).
Calycosin was quantitatively analyzed in the biological samples as previously described with a 1260 Series HPLC system (Agilent Technologies) coupled to an Agilent 6460 triple quadrupole mass spectrometer stocked with a Dual Agilent Jet Stream electrospray ionization source (Agilent Technologies) [16]. The LC–MS/MS method was validated to be appropriate to accurately determine calycosin in the plasma and liver samples within the concentration ranges of 1–1000 ng/mL and 3–3000 ng/mL, respectively [16].

2.3. Animal Experiment

Male Sprague Dawley (S.D.) rats (220 ± 20 g) were obtained from Shanghai SLAC Laboratory Animal Co., Ltd. (Shanghai, China). Rats were fed a standard diet and water and kept in a controlled air-conditioned environment at 22 ± 2 °C with a relative humidity of 50% ± 10% on a 12 h/12 h light/dark cycle. The experiments were performed according to the guidelines outlined by the Institutional Animal Care and Use Committee of the Shanghai Institute of Materia Medica, Chinese Academic Science (Shanghai, China) (IACUC: 2018-01-HCG-27).
After acclimating for 7 days, fifty rats fasted overnight with free access to water. Then, these rats were orally administered calycosin at a dose of 76.4 mg/kg (suspended in an aqueous solution containing 0.5% carboxymethylcellulose sodium). Then, at 0.167, 0.5, 1, 2, 4, 6, 8, 12, 24, and 48 h postdose (n = 5), the rats were anesthetized with urethane (0.7 g/kg). First, hepatic portal vein blood (2 mL) was collected. Then, as much systemic blood as possible (6–8 mL) was collected from the aortaventralis until no further blood could be drawn. Finally, liver samples were harvested, washed three times with normal saline and dried with filter paper. The blood samples were centrifuged at 12,000× g for 5 min to obtain plasma. All of the abovementioned biosamples were stored at −80 °C for subsequent analysis.

2.4. Sample Preparation

Considering the different sensitivities and resolutions of Q-TOF and MS/MS, we applied various sample treatment methods for qualitative and quantitative analysis. To identify as many metabolites as possible, we obtained the samples for qualitative HPLC-Q-TOF analysis by mixing all of the biosamples from the 50 rats at the 10 time points. To quantitatively analyze the samples with HPLC–MS/MS, each time point was evaluated individually after protein precipitation. The detailed sample preparation processes are as follows.

2.4.1. Sample Preparation for HPLC-Q-TOF Analysis

First, the liver tissue samples were homogenized with a threefold volume of normal saline to obtain tissue homogenates. Then, a total of 400 μL of plasma or tissue homogenate from five rats at each time point were mixed and precipitated with 1.2 mL of acetonitrile. After the samples were centrifuged at 13,680× g for 10 min, 1 mL of the supernatant was obtained and evaporated to dryness at 40 °C under vacuum. The residue was then dissolved in 100 μL of methanol–water (50:50, v/v). After each sample was centrifuged again at 13,680× g for 10 min, a total of 80 μL of the supernatant from each of the ten time points was combined and dried at 40 °C under vacuum. The final residue was reconstituted in 100 μL of methanol–water (50:50, v/v). After centrifugation at 13,680× g for 10 min, 70 μL of the supernatant was acquired for HPLC-Q-TOF analysis.

2.4.2. Sample Preparation for HPLC-MS/MS Analysis

The samples for quantitative analysis were prepared in accordance with our published method, which has been validated in various matrices [16].
To quantify calycosin glucuronides, hydrolysis was performed with β-glucuronidase, in accordance with a previous report [17]. In brief, the β-glucuronidase from H. pomatia was diluted to 50 units/μL by using ammonium acetate buffer (pH 5.0; 1.0 M). Then, 10 μL of β-glucuronidase (50 units/μL), 10 μL of ascorbic acid (125 mg/mL), and 100 μL of plasma were mixed and incubated at 37 °C for 1 h. The samples were treated according to the method described in our previous study [16]. After the biological samples were hydrolyzed by β-glucuronidase, the calycosin glucuronide peaks disappeared, and a notable increase in the peak area of calycosin was observed. This finding verified that the calycosin glucuronides were completely converted into calycosin in the presence of β-glucuronidase (Figure 1).

2.5. Data Analysis

A noncompartmental model with a sparse algorithm was applied to calculate the pharmacokinetic parameters by using WinNonlin (Pharsight 6.2, Delaware, NC, USA). The liver extraction ratio (ERLiver) was calculated in the following manner to determine the hepatic first-pass effect [18,19,20]:
ERLiver = (AUCpor − AUCsys)/AUCpor
where AUCpor and AUCsys are the areas of the compounds beneath the concentration-time curves in the portal vein and systemic plasma, respectively.

3. Results

3.1. Qualitative Analysis of Calycosin and Its Metabolites In Vivo

A total of 21 metabolites identified, including 4 phase I and 17 phase II metabolites, involving 6 metabolic pathways: dehydroxylation, demethylation, reduction, methylation, sulfation, and glucuronidation. Fourteen new metabolites (M2–M4, M6, M7, M9–M11, and M15–M20) and a reductive biotransformation were first reported. 7,3′,4′-Trihydroxyisoflavone (M12), daidzein (M15), and formononetin (M21) were unambiguously identified with the presence of the standard compounds. The mass information and biodistribution of these metabolites are summarized in Table 1. The extracted ion chromatograms (EICs), MS/MS spectra and deduced fragmentation pathways of the four standard compounds are presented in Figure 2 and Figure 3. The biotransformation of calycosin after oral administration to rats is illustrated in Figure 4, and the total ion chromatograms are shown in Figure S1.

3.1.1. M0 and Its Characteristic Fragmentation Patterns

As shown in Figure 2a, the parent drug calycosin (M0) showed a precursor ion at m/z 285.0754 (C16H13O5+, −1.05 ppm) at 24.93 min. As the base peaks, the fragment ion at m/z 270.0519 (C15H10O5•+) was generated via the loss of a CH3• (15 Da) moiety from the precursor ion. The fragment ion at m/z 253.0493 (C15H9O4+) was subsequently produced via the loss of an OH• (17 Da) unit. The product ions at m/z 225.0543 (C14H9O3+) and 197.0591 (C13H9O2+) were formed by the continuous loss of CO (28 Da) groups. The precursor ion also underwent a retro-Diels-Alder (RDA) reaction due to the cleavage of two chemical bonds between O-C2 and C3-C4, thereby yielding the characteristic fragment ion at m/z 137.0231 (C7H5O3+). The RDA reaction is widely recognized as the characteristic fragmentation pattern of an isoflavone skeleton [21].

3.1.2. M12 and Its Characteristic Fragmentation Patterns

As the demethylated product of calycosin, 7,3′,4′-trihydroxyisoflavone (M12) displayed a protonated molecule at m/z 271.0597 (C15H11O5+, −1.48 ppm) at 16.07 min. M12 exhibited fragmentation pathways similar to those of calycosin. As shown in Figure 3b, the product ion at m/z 253.0495 (C15H9O4+) was generated via the neutral loss of H2O (18 Da) from the precursor ion. The product ions at m/z 225.0542 (C14H9O3+) and 197.0592 (C13H9O2+) were subsequently produced through the continuous elimination of CO (28 Da) groups. The characteristic ion at m/z 137.0231 (C7H5O3+) was also determined to be the product of the classical RDA reaction of the M12 molecular ion.

3.1.3. M15 and Its Characteristic Fragmentation Patterns

Daidzein (M15), which displayed an [M+H]+ peak at m/z 255.0646 (C15H11O4+, −2.35 ppm) at 21.91 min, was identified as the demethylated and dehydroxylated metabolite of calycosin. As exhibited in Figure 3c, the typical product ions at m/z 227.0696 (C14H11O3+) and 199.0748 (C13H11O2+) were produced via consecutive neutral losses of CO (28 Da) from the precursor ion. Additionally, H2O (18 Da) was eliminated from the product ion at m/z 199.0748 (C13H11O2+), thereby generating the fragment ion at m/z 181.0641 (C13H9O+). Likewise, the classical fragment ion at m/z 137.0230 (C7H5O3+) was also formed as a result of the RDA reaction.

3.1.4. M21 and Its Characteristic Fragmentation Patterns

As the dehydroxylated metabolite of calycosin, formononetin (M21) showed a protonated molecule at m/z 269.0805 (C16H13O4+, −1.11 ppm) at 27.74 min. As displayed in Figure 3d, the protonated molecule of M21 underwent three competitive fragmentation pathways. In the first route, one neutral CH4 (16 Da) group and two CO (28 Da) units were eliminated, thereby producing fragment ions at m/z 253.0487 (C15H9O4+), 225.0541 (C14H9O3+) and 197.0589 (C13H9O2+), respectively. In the second route, a fragment ion at m/z 254.0569 (C15H10O4•+) was obtained after a CH3• (15 Da) moiety was eliminated. The fragment ion at m/z 118.0409 (C8H6O•+) was also generated via the RDA reaction. In the third route, the characteristic fragment ion at m/z 137.0229 (C7H5O3) was formed via the RDA reaction.
The structures of the metabolites can be revealed by comparing their fragmentation mechanisms with those of their parent drugs, which share similar skeletal structures. Therefore, the characteristic fragmentation patterns of four standard compounds provided a solid basis for predicting the structures of other metabolites in the absence of standard compounds. The RDA reaction and the continuous loss of CO groups have been recognized as the classical cleavage pathway for calycosin. The differences in the substituents on the B and C rings led to differences in the fragment ions, which helped us to identify the metabolites of calycosin. We identified the reductive metabolites of M0 (M7, M11, and M16), the phase II metabolites of M0 (M1, M4, M5, M8, M13, M14, M17, M18, and M20), the phase II metabolites of M12 (M2, M6, M9, M10, and M19) and the phase II metabolite of M15 (M3). The details of the mass spectral analysis are elaborated in the supporting information.

3.2. Quantitative Analysis of Calycosin and Its Metabolites In Vivo

3.2.1. Semi-Quantitative Analysis of Calycosin and Its Metabolites In Vivo

According to the peak areas of the compounds in the HPLC-Q-TOF MS spectrum, semi-quantitative analysis of calycosin and its metabolites was carried out to provide a reference for the following quantitative analysis (Figure S1). M14 (calycosin-3’-glucuronide) had the highest peak area in the portal vein plasma and systemic plasma, followed by M13 (calycosin-3’-sulfate); both of their peak areas were much higher than that of the parent drug. The peak areas of M14 (calycosin-3’-glucuronide) were approximately 30- and 80-fold those of its isomer M5 (calycosin-7-glucuronide) in portal vein plasma and systemic plasma, respectively. As phase II metabolites, the peak areas of the sulfated metabolites of calycosin, including M13 (calycosin-3’-sulfate) and M4 (calycosin-7,3’-disulfate), were much lower than that of M14.
In contrast to the results found in plasma, calycosin had a much higher peak area than its metabolites in the liver. Among the metabolites, M13 and M14 showed the greatest peak areas in the liver.

3.2.2. Quantitative Analysis of Calycosin and Calycosin Glucuronides In Vivo

After calycosin was orally administered to rats, calycosin and calycosin glucuronides were successfully analyzed in portal vein plasma, the liver, and systemic plasma by HPLC–MS/MS. The concentrations of the calycosin glucuronides were determined by subtracting the concentration of the free form of calycosin from the concentration of calycosin in the samples pretreated with β-glucuronidase. The relevant pharmacokinetic parameters and concentration–time curves of calycosin and the calycosin glucuronides from the biological samples are presented in Table 2 and Figure 5, respectively.
As shown in Figure 5a–c, the concentration–time curves of calycosin and the calycosin glucuronides displayed obscure double peaks, and the levels of the calycosin glucuronides were notably higher than those of calycosin in portal vein plasma and systemic plasma. In portal vein plasma, the maximum concentration (Cmax) and AUC of calycosin were 12.6 ± 0.8 μmol/L and 40.0 ± 1.9 h μmol/L, respectively, while these values for the calycosin glucuronides were 2.7- and 3.4-fold higher.
In systemic plasma, the calycosin levels were extremely low, with Cmax and AUC values of only 0.06 ± 0.01 μmol/L and 0.15 ± 0.02 h μmol/L, respectively. Conversely, those of the calycosin glucuronides were very high: 736.7- and 934.7-fold higher than those of calycosin, respectively. By comparing these values from the portal vein plasma, the exposure of calycosin accounted for only 0.4% in the systemic plasma. This result corresponded to a value of ERLiver as high as 99.6%, while the exposure of the calycosin glucuronides was much more similar to those in portal vein plasma.
According to the time to reach peak concentration (Tmax), which appeared at 1.0 h or 2.0 h, the absorption rates of calycosin and the calycosin glucuronides were similar and quick in both the portal vein and systemic plasma. Nevertheless, the calycosin glucuronides displayed elimination rates much lower than those of calycosin, as evidenced by the half-life (T1/2) values of the calycosin glucuronides at 13.0 h and 14.2 h; notably, those of calycosin were 1.4 h and 1.9 h in portal vein plasma and systemic plasma, respectively.
Different from the plasma results, the concentrations of the calycosin glucuronides were much lower those that of calycosin in the liver. The Cmax and AUC of calycosin were 31.1 ± 1.3 μmol/kg and 119.6 ± 6.2 h μmol/kg, respectively, which are approximately 3.7-fold and 5.6-fold greater than those of the calycosin glucuronides. Incredibly, the exposure of calycosin in the liver was 797.3-fold that in the systemic plasma. In contrast, the hepatic exposure of the calycosin glucuronides was much lower than their plasmatic exposure.

4. Discussion

There has been growing interest in determining the potential functions of dietary flavonoids with respect to disease prevention and health promotion. However, the great disparity between the low circulation amounts of dietary flavonoids and their diverse biological functions continues to hinder investigations on their underlying mechanism of action as well as their further applications [22]. To tackle these issues, we proposed a strategy that combined qualitative and quantitative analysis at the whole-animal level based on in vivo compound delivery to comprehensively understand the intracorporal process after oral administration.
The metabolic profiles revealed that calycosin underwent widespread intestinal metabolism prior to hepatic metabolism, since 19 and 18 metabolites were observed in the portal vein plasma and systemic plasma, respectively, showing high overlap with only three differential metabolites. According to the semi-quantitative results of the calycosin metabolites, glucuronide conjugation of calycosin was predominant in the plasma and liver, followed by sulfate conjugation. M14 was detected in all biosamples, and its peak area was the highest among all identified metabolites. This is consistent with the in vitro findings that calycosin underwent extensive glucuronidation, which is preferred at the C3′-OH position than the C7-OH position [23]. This can be explained by the fact that glucuronidation of flavonoids is regiospecific, according to the structure of the flavonoids [24]. Compared to the C3′-OH position, the C7-OH of flavonoids found it easier to form a quinol structure by resonance, which caused the delocalization of the electron density on the oxygen of OH, resulting in reduced nucleophilicity and glucuronidation activities. A similar phenomenon was also observed in the glucuronidation of other flavonoids in vivo. For example, (-)-epicatechin-3′-O-glucuronide was of the highest exposure among the metabolites in the human plasma [25].
It has been suggested that flavonoid metabolites may contribute to the therapeutic effects of flavonoids in vivo because the circulating levels of flavonoids are too low to reach pharmacologically relevant levels [26]. For example, M14 (calycosin-3′-glucuronide) could display potency comparable to or greater than that of calycosin in vitro and in vivo [27]. Considering its high concentration in vivo, calycosin glucuronides may be key to understanding the therapeutic effects of orally administered calycosin.
To accurately evaluate the glucuronidation of calycosin, the determination of calycosin and its glucuronides, with the aid of β-glucuronidase, was conducted in the biosamples. In systemic plasma, the concentration of calycosin was extremely low, which is consistent with the results of a previous study [28]. Correspondingly, glucuronidated calycosin was found in much higher concentrations in circulation. Other flavonoids have also exhibited a similar phenomenon. For instance, after oral administration of hesperidin to rats, hesperetin glucuronides accounted for 66.4% of all conjugated metabolites [29]. In comparison with the low circulating levels of icaritin, icaritin glucuronides showed higher exposure in the plasma of icaritin-administered rats [30].
It should be noted that a considerable amount of calycosin glucuronides were detected in portal vein plasma, similar to systemic plasma, where calycosin had passed liver disposition. Glucuronide conjugation often occurs in the liver, which is the major metabolic organ. However, an in vitro metabolism study proved that calycosin can be conjugated with glucuronides at a higher rate in RIMs than in RLMs [15]. Additionally, calycosin glucuronides reached Cmax earlier in portal vein plasma than in systemic plasma. Both of these results indicated that intestinal glucuronidation occurred on calycosin before hepatic glucuronidation. Thus, glucuronidation in the intestine played a predominant role in the biotransformation of calycosin in rats.
In contrast to the high contents of calycosin glucuronides in the portal vein and systemic plasma, calycosin was clearly more abundant than its glucuronides in the liver. On the one hand, compared with hydrophilic calycosin glucuronides, a considerable amount of calycosin in portal vein plasma more easily entered the liver because of its high lipophilicity and membrane permeability. On the other hand, the presence of β-glucuronidase, a phase I metabolizing enzyme that is widely distributed in the liver, can hydrolyze glucuronidated flavonoid conjugates, yielding an aglycon with relatively high lipophilicity in tissues. A similar phenomenon has been observed after the oral administration of quercetin, where quercetin glucuronides predominantly circulated in the human bloodstream, re-forming quercetin aglycone in the tissues by the action of β-glucuronidase [31]. Thus, the coexistence of β-glucuronidase and UDP-glucuronosyltransferases (UGTs) in the liver probably resulted in a balance between the dissociation and generation of calycosin glucuronides, which caused no significant increase in calycosin after hepatic metabolism.
Calycosin has been confirmed to have excellent potential to fight against liver injury, NASH, and hepatic fibrosis by activating the liver’s farnesoid X receptor and the signal transducers and activators of the transcription 3 pathway [7]. Therefore, instead of focusing on the extremely low levels of calycosin in circulation, the substantial collection of calycosin in the target organ of the liver should be stronger and more favorable evidence to explain the hepatoprotection observed after oral administration of calycosin in vivo. Compared to orally administered calycosin, our previous study indicated that calycosin had higher plasma and liver exposure following oral administration of equimolar quantities of calycosin-7-O-β-D-glucopyranoside, as this compound was extensively metabolized into calycosin through deglycosylation. This result reminded us that calycosin-7-O-β-D-glucopyranoside could serve as a calycosin prodrug for oral administration. However, further studies should be conducted to verify this hypothesis.

5. Conclusions

By integrating the qualitative and quantitative results of this study, it was concluded that glucuronidation played an important role in the biotransformation of calycosin, which occurred in the intestine before calycosin entered the liver. To the best of our knowledge, this is the first attempt to systemically investigate the contributions of the intestine and the liver first-pass effect to the low circulating levels of calycosin in rats with respect to the delivery process of its metabolites in vivo. This strategy can also be applied to other flavonoids that display low circulating levels but substantial pharmacological activities.

Supplementary Materials

The following supporting information can be downloaded at: https://www.mdpi.com/article/10.3390/separations9050115/s1, Figure S1: total ion chromatograms of portal vein plasma (a), the liver (b), and systemic plasma (c) of rats after the oral administration of calycosin, Figure S2: the peak areas of calycosin and its metabolites in portal vein plasma (a), the liver (b) and systemic plasma (c) after the oral administration of 76.4 mg/kg calycosin as detected by HPLC-Q-TOF.

Author Contributions

Conceptualization, C.H. and X.T.; Data curation, H.J. and H.L.; Formal analysis, H.J.; Funding acquisition, C.H.; Investigation, P.H. and Y.Y.; Methodology, H.J. and H.L.; Project administration, C.H. and X.T.; Resources, H.J. and H.L.; Supervision, C.H. and X.T.; Validation, H.L. and S.C.; Visualization, H.J.; Writing—original draft, H.J. and H.L.; Writing—review and editing, H.J., H.L. and X.T. All authors have read and agreed to the published version of the manuscript.

Funding

This work was supported by the National Natural Science Foundation of China (No. 81973456), the Youth Innovation Promotion Association of the Chinese Academy of Sciences (No. 2019280), the Shanghai Municipal Science and Technology Major Project (TM202101H007), and the Open Project Program Foundation of Key Laboratory of Liver and Kidney Diseases (Shanghai University of Traditional Chinese Medicine), Ministry of Education (No. GS20200601).

Institutional Review Board Statement

The animal study protocol was approved by the Institutional Review Board of Institutional Animal Care and Use Committee of the Shanghai Institute of Materia Medica, Chinese Academic Science (protocol code: 2018-01-HCG-27 and date of approval: 2018-01-25).

Informed Consent Statement

Not applicable.

Data Availability Statement

The data presented in this study are available.

Conflicts of Interest

The authors declare no conflict of interest.

Abbreviations

AUC: area under concentration versus time curve; Cmax, maximum concentration; EICs, extracted ion chromatograms; ERLiver, liver extraction ratio; HPLC-Q-TOF-MS/MS, high-performance liquid chromatography quadrupole time-of-flight tandem mass spectrometry; HPLC-QQQ-MS/MS, high-performance liquid chromatography coupled with triple quadrupole tandem mass spectrometry; NASH, nonalcoholic steatohepatitis; RDA, retro-Diels-Alder; RIMs, rat intestinal microsomes; RLMs, rat liver microsomes; SULTs, sulfotransferases; T1/2, the half-life; Tmax, time to reach peak concentration; UGTs, UDP-glucuronosyltransferases.

References

  1. Zhang, L.J.; Liu, H.K.; Hsiao, P.C.; Kuo, L.M.; Lee, I.J.; Wu, T.S.; Chiou, W.F.; Kuo, Y.H. New isoflavonoid glycosides and related constituents from astragali radix (Astragalus membranaceus) and their inhibitory activity on nitric oxide production. J. Agric. Food Chem. 2011, 59, 1131–1137. [Google Scholar] [CrossRef] [PubMed]
  2. Available online: www.nhc.gov.cn/cms-search/xxgk/getManuscriptXxgk.htm?id=3bcf8b4d12e34b11bfc6e5404b6e74a (accessed on 7 August 2021).
  3. Yu, Q.T.; Qi, L.W.; Li, P.; Yi, L.; Zhao, J.; Bi, Z. Determination of seventeen main flavonoids and saponins in the medicinal plant Huang-qi (Radix astragali) by HPLC-DAD-ELSD. J. Sep. Sci. 2007, 30, 1292–1299. [Google Scholar] [CrossRef] [PubMed]
  4. Zhang, D.Q.; Zhuang, Y.; Pan, J.C.; Wang, H.B.; Li, H.; Yu, Y.; Wang, D.Q. Investigation of effects and mechanisms of total flavonoids of Astragalus and calycosin on human erythroleukemia cells. Oxid. Med. Cell Longev. 2012, 2012, 209843. [Google Scholar] [CrossRef] [PubMed] [Green Version]
  5. Jiang, Z.P.; Wei, G.M.; Li, Z.; Liu, Y.H.; Wang, Z.D. Flavonoids from the Roots of Astragalus membranaceus (Fisch.) Bge. Prevent Development of Diabetic Nephropathy In Vitro. Lat. Am. J. Pharm. 2014, 33, 339–343. [Google Scholar]
  6. Chen, L.Y.; Li, Z.X.; Tang, Y.H.; Cui, X.L.; Luo, R.H.; Guo, S.S.; Zheng, Y.T.; Huang, C.G. Isolation, identification and antiviral activities of metabolites of calycosin-7-O-beta-D-glucopyranoside. J. Pharm. Biomed. Anal. 2011, 56, 382–389. [Google Scholar] [CrossRef] [PubMed]
  7. Chen, X.L.; Meng, Q.; Wang, C.Y.; Liu, Q.; Sun, H.J.; Huo, X.K.; Sun, P.Y.; Yang, X.B.; Peng, J.Y.; Liu, K. Protective effects of calycosin against CCl4-induced liver injury with activation of FXR and STAT3 in mice. Pharm. Res. 2015, 32, 538–548. [Google Scholar] [CrossRef]
  8. Deng, T.; Liu, J.; Zhang, M.M.; Wang, Y.X.; Zhu, G.N.; Wang, J.J. Inhibition effect of phytoestrogen calycosin on TGF-beta1-induced hepatic stellate cell activation, proliferation, and migration via estrogen receptor beta. Can. J. Physiol. Pharmacol. 2018, 96, 1268–1275. [Google Scholar] [CrossRef]
  9. Liu, B.; Zhang, J.Z.; Liu, W.H.; Liu, N.N.; Fu, X.Q.; Kwan, H.Y.; Liu, S.J.; Liu, B.R.; Zhang, S.W.; Yu, Z.L.; et al. Calycosin inhibits oxidative stress-induced cardiomyocyte apoptosis via activating estrogen receptor-alpha/beta. Bioorg. Med. Chem. Lett. 2016, 26, 181–185. [Google Scholar] [CrossRef]
  10. Su, X.H.; Huang, Q.C.; Chen, J.Y.; Wang, M.J.; Pan, H.D.; Wang, R.; Zhou, H.; Zhou, Z.Q.; Liu, J.; Yang, F.; et al. Calycosin suppresses expression of pro-inflammatory cytokines via the activation of p62/Nrf2-linked heme oxygenase 1 in rheumatoid arthritis synovial fibroblasts. Pharmacol. Res. 2016, 113, 695–704. [Google Scholar] [CrossRef]
  11. Duan, X.P.; Meng, Q.; Wang, C.Y.; Liu, Z.H.; Sun, H.J.; Huo, X.K.; Sun, P.Y.; Ma, X.D.; Peng, J.Y.; Liu, K.X. Effects of calycosin against high-fat diet-induced nonalcoholic fatty liver disease in mice. J. Gastroenterol. Hepatol. 2018, 33, 533–542. [Google Scholar] [CrossRef]
  12. Yu, J.; Zhu, L.J.; Zheng, H.H.; Gong, X.; Jiang, H.Y.; Chen, J.M.; Li, Y.H.; Zheng, H.M.; Qi, X.X.; Wang, Y.; et al. Sulfotransferases and Breast Cancer Resistance Protein Determine the Disposition of Calycosin in Vitro and in Vivo. Mol. Pharm. 2017, 14, 2917–2929. [Google Scholar] [CrossRef] [PubMed]
  13. Zhang, Y.Z.; Xu, F.; Dong, J.; Liang, J.; Hashi, Y.; Shang, M.Y.; Yang, D.H.; Wang, X.; Cai, S.Q. Profiling and identification of the metabolites of calycosin in rat hepatic 9000xg supernatant incubation system and the metabolites of calycosin-7-O-beta-D-glucoside in rat urine by HPLC-DAD-ESI-IT-TOF-MS(n) technique. J. Pharm. Biomed. Anal. 2012, 70, 425–439. [Google Scholar] [CrossRef] [PubMed]
  14. Ruan, J.Q.; Yan, R. Regioselective glucuronidation of the isoflavone calycosin by human liver microsomes and recombinant human UDP-glucuronosyltransferases. Chem. Biol. Interact. 2014, 220, 231–240. [Google Scholar] [CrossRef] [PubMed]
  15. Shi, J.; Zheng, H.H.; Yu, J.; Zhu, L.J.; Yan, T.M.; Wu, P.; Lu, L.L.; Wang, Y.; Hu, M.; Liu, Z.Q. SGLT-1 Transport and Deglycosylation inside Intestinal Cells Are Key Steps in the Absorption and Disposition of Calycosin-7-O-beta-d-Glucoside in Rats. Drug Metab. Dispos. 2016, 44, 283–296. [Google Scholar] [CrossRef] [Green Version]
  16. Tian, X.T.; Chen, S.J.; Zhang, Y.Y.; Chen, L.Y.; Guo, X.Z.; Xu, Z.; Liu, H.; Hu, P.; Chen, Z.Y.; Li, Z.X.; et al. Erratum to "Absorption, liver first-pass effect, pharmacokinetics and tissue distribution of calycosin-7-O-ß-d-glucopyranoside (C7G) and its major active metabolite, calycosin, following oral administration of C7G in rats by LC-MS/MS". J.Pharm. Biomed. Anal. 2018, 148, 350–354. [Google Scholar] [CrossRef]
  17. Hou, Y.C.; Lin, S.P.; Tsai, S.Y.; Ko, M.H.; Chang, Y.C.; Chao, P.D. Flavonoid pharmacokinetics and tissue distribution after repeated dosing of the roots of Scutellaria baicalensis in rats. Planta. Med. 2011, 77, 455–460. [Google Scholar] [CrossRef]
  18. Tian, X.T.; Xu, Z.; Chen, M.C.; Hu, P.; Liu, F.; Sun, Z.L.; Liu, H.; Guo, X.Z.; Li, Z.X.; Huang, C.G. Simultaneous determination of eight bioactive compounds by LC-MS/MS and its application to the pharmacokinetics, liver first-pass effect, liver and brain distribution of orally administrated Gouteng-Baitouweng (G.B.) in rats. J. Chromatogr. B Analyt. Technol. Biomed. Life Sci. 2018, 1084, 122–131. [Google Scholar] [CrossRef]
  19. Liu, H.; Chen, M.C.; Yin, H.; Hu, P.; Wang, Y.Y.; Liu, F.; Tian, X.T.; Huang, C.G. Exploration of the hepatoprotective chemical base of an orally administered herbal formulation (YCHT) in normal and CCl4-intoxicated liver injury rats. Part 1: Metabolic profiles from the liver-centric perspective. J. Ethnopharmacol. 2019, 237, 81–91. [Google Scholar] [CrossRef]
  20. Tian, X.T.; Xu, Z.; Hu, P.; Yu, Y.Y.; Li, Z.X.; Ma, Y.; Chen, M.C.; Sun, Z.L.; Liu, F.; Li, J.Y.; et al. Determination of the antidiabetic chemical basis of Phellodendri Chinensis Cortex by integrating hepatic disposition in vivo and hepatic gluconeogenese inhibition in vitro. J. Ethnopharmacol. 2020, 263, 113215. [Google Scholar] [CrossRef]
  21. Wang, Q.; Zou, Z.Y.; Zhang, Y.Z.; Lin, P.; Lan, T.H.; Qin, Z.F.; Xu, D.P.; Wu, H.L.; Yao, Z.H. Characterization of chemical profile and quantification of major representative components of Wendan decoction, a classical traditional Chinese medicine formula. J. Sep. Sci. 2021, 44, 1036–1061. [Google Scholar] [CrossRef]
  22. Zhang, L.; Zuo, Z.; Lin, G. Intestinal and hepatic glucuronidation of flavonoids. Mol. Pharm. 2007, 4, 833–845. [Google Scholar] [CrossRef] [PubMed]
  23. Zhang, L.; Lin, G.; Zuo, Z. Position preference on glucuronidation of mono-hydroxylflavones in human intestine. Life Sci. 2006, 78, 2772–2780. [Google Scholar] [CrossRef] [PubMed]
  24. Yin, H.; Bennett, G.; Jones, J.P. Mechanistic studies of uridine diphosphate glucuronosyltransferase. Chem. Biol. Interact. 1994, 90, 47–58. [Google Scholar] [CrossRef]
  25. Natsume, M.; Osakabe, N.; Oyama, M.; Sasaki, M.; Baba, S.; Nakamura, Y.; Osawa, T.; Terao, J. Structures of (-)-epicatechin glucuronide identified from plasma and urine after oral ingestion of (-)-epicatechin: Differences between human and rat. Free Radic. Biol. Med. 2003, 34, 840–849. [Google Scholar] [CrossRef]
  26. Prior, R.L.; Wu, X.L.; Gu, L.W. Flavonoid metabolism and challenges to understanding mechanisms of health effects. J. Sci. Food Agr. 2006, 86, 2487–2491. [Google Scholar] [CrossRef]
  27. Ruan, J.Q.; Li, S.; Li, Y.P.; Wu, W.J.; Lee, S.M.; Yan, R. The Presystemic Interplay between Gut Microbiota and Orally Administered Calycosin-7-O-beta-D-Glucoside. Drug Metab. Dispos. 2015, 43, 1601–1611. [Google Scholar] [CrossRef] [PubMed] [Green Version]
  28. Gonzales, G.B.; Smagghe, G.; Grootaert, C.; Zotti, M.; Raes, K.; Van Camp, J. Flavonoid interactions during digestion, absorption, distribution and metabolism: A sequential structure-activity/property relationship-based approach in the study of bioavailability and bioactivity. Drug Metab. Rev. 2015, 47, 175–190. [Google Scholar] [CrossRef] [PubMed]
  29. Matsumoto, H.; Ikoma, Y.; Sugiura, M.; Yano, M.; Hasegawa, Y. Identification and quantification of the conjugated metabolites derived from orally administered hesperidin in rat plasma. J. Agric. Food Chem. 2004, 52, 6653–6659. [Google Scholar] [CrossRef]
  30. Rong, Y.; Tu, Y.F.; Yin, T.J.; Meng, Z.Y.; Dou, G.F.; Hu, M. Rapid intestinal glucuronidation and hepatic glucuronide recycling contributes significantly to the enterohepatic circulation of icaritin and its glucuronides in vivo. Arch. Toxicol. 2020, 94, 3737–3749. [Google Scholar] [CrossRef]
  31. Terao, J.; Murota, K.; Kawai, Y. Conjugated quercetin glucuronides as bioactive metabolites and precursors of aglycone in vivo. Food Funct. 2011, 2, 11–17. [Google Scholar] [CrossRef]
Figure 1. HPLC-Q-TOF-extracted ion chromatograms (EICs) and peak areas of calycosin glucuronides and calycosin in plasma samples before (a) and after (b) β-glucuronidase treatment.
Separations 09 00115 g001
Figure 2. EICs and representative MS/MS spectra of calycosin (a), 7,3′,4′-trihydroxyisoflavon (b), daidzein (c), and formononetin (d).
Separations 09 00115 g002
Figure 3. Proposed fragmentation pathways of calycosin (a), 7,3′,4′-trihydroxyisoflavone (b), daidzein (c), and formononetin (d).
Separations 09 00115 g003
Figure 4. Proposed transformation pathways of orally administrated calycosin in rats.
Separations 09 00115 g004
Figure 5. Mean concentration-time curves of calycosin and calycosin glucuronides in portal vein plasma (a), the liver (b), and systemic plasma (c) after oral administration of 76.4 mg/kg calycosin to rats (n = 5, mean ± SEM).
Separations 09 00115 g005
Table 1. Summary of the mass spectral data of calycosin and its metabolites detected in the biological samples of rats.
NOtR (min)NameFormula
(Neutral)
aPLSObserved m/zCalculated m/zFragment IonsDiff (ppm)
M024.93CalycosinC16H12O5+++285.0754285.0757270.0519 (100%), 253.0493 (42%),
225.0543 (50%), 197.0591 (18%), 137.0231 (56%)
−1.05
M18.55Calycosin-7-sulfate-3′-glucuronideC22H2 O14S++541.0643541.0647365.0324 (14%), 285.0752 (100%), 270.0522 (2%), 225.0539 (0.7%)−0.74
M2 *8.837,3′,4′-Trihydroxyisoflavone-disulfateC15H10O11S2++430.9738430.9737351.0175 (13%), 271.0601 (100%), 137.0238 (5%)0.23
M3 *9.30Daidzein-7-glucuronideC21H18O10++431.0972431.0973255.0650 (100%), 199.0745 (13%), 137.0226 (22%)−0.23
M4 *10.28Calycosin-7,3′-disulfateC16H12O11S2++444.9891444.9894365.0322 (9%), 285.0756 (100%), 270.0524 (4%), 253.0499 (2%), 137.0233 (1%)−0.67
M510.77Calycosin-7-glucuronideC22H20O11++461.1077461.1078285.0752 (100%), 270.0516 (6%), 253.0491 (2%), 137.0228 (1%)−0.22
M6 *11.317,3′,4′-Trihydroxyisoflavone-glucuronideC21H18O11++447.0920447.0922271.0594 (100%), 253.0492 (7%), 225.0538 (10%), 137.0236 (11%)−0.45
M7 *12.047,3′,4′-trihydroxyisoflavanone-glucuronideC21H20O11+++449.1076449.1078273.0752 (100%), 163.0388 (29%), 123.0448 (5%)−0.45
M813.79Calycosin-7-glucuronide-3′-sulfateC22H20O14S+++541.0644541.0647365.0324 (46%), 285.0756 (100%), 270.0515 (2%)−0.55
M9 *14.387,3′,4′-Trihydroxyisoflavone-glucuronideC21H18O11+++447.0921447.0922271.0593 (100%), 253.0494 (4%), 225.0540 (4%), 137.0223 (4%)−0.22
M10 *14.637,3′,4′-Trihydroxyisoflavone-sulfateC15H10O8S+++351.0161351.0169271.0590 (100%), 225.0542 (26%), 137.0237 (15%)−2.28
M11 *14.672,3-Dihydrocalycosin-glucuronideC22H22O11++463.1224463.1235287.0914 (100%), 163.0386 (57%), 137.0588 (12%)−2.38
M1216.077,3′,4′-TrihydroxyisoflavoneC15H10O5+271.0597271.0601253.0495 (34%), 225.0542 (100%), 197.0592 (64%), 137.0231 (93%)−1.48
M1316.14Calycosin-3′-sulfateC16H12O8S+++365.0323365.0326285.0755 (100%), 270.0518 (43%), 253.0488 (16%), 225.0542 (23%), 137.0228 (11%)−0.82
M1416.76Calycosin-3′-glucuronideC22H20O11+++461.1069461.1078285.0753 (100%), 270.0515 (6%), 253.0489 (2%), 137.0226 (1%)−1.95
M15*21.91DaidzeinC15H10O4+++255.0646255.0652227.0696 (47%), 199.0748 (100%), 181.0641 (64%), 137.0230 (94%)−2.35
M16*22.197,3′-dihydroxy-4′-methoxyisoflavanoneC16H14O5+++287.0905287.0914163.0386 (100%), 137.0589 (79%)−3.13
M17*22.59Calycosin-7-sulfate-3′-methyl etherC17H14O8S++379.0481379.0482299.0907 (100%), 271.0606 (14%), 253.0495 (3%), 225.0553 (4%) −0.26
M18*23.08Calycosin-7-glucuronide-3′-methyl etherC23H22O11+++475.1230475.1235299.0914 (100%), 271.0592 (7%), 253.0488 (3%), 225.0548 (2%)−1.05
M19*23.717,3′,4′-Trihydroxyisoflavone-3′-methyl etherC16H12O5+++285.0755285.0757270.0511 (100%), 253.0487 (45%), 225.0539 (54%), 137.0229 (62%)−0.70
M20*27.20Calycosin-3′-methyl etherC17H14O5++299.0914299.0914271.0604 (100%), 253.0488 (38%), 137.0236 (89%)0.00
M2127.74FormononetinC16H12O4+269.0805269.0808253.0487 (41%), 225.0541 (40%), 197.0589 (100%), 137.0229 (19%), 118.0409 (35%)−1.11
“*” was firstly reported on calycosin treatments; aP, portal vein plasma; L, liver; S, systemic plasma; +, detected; −, not detected.
Table 2. PK parameters of calycosin and calycosin glucuronides in the portal vein plasma, systemic plasma, and liver after oral administration of calycosin at 76.4 mg/kg in rats (n = 5).
PK ParametersT1/2 (h)Tmax (h)Cmax ± SEM (μmol/L)AUC0-t ± SEM
(h μmol/L)
AUC (Calycosin Glucuronides)
/ AUC (Calycosin)
Portal vein plasmaCalycosin1.41.012.6 ± 0.840.0 ± 1.93.5
Calycosin glucuronides13.01.033.9±1.1138.3 ± 3.4
Systemic plasmaCalycosin1.91.00.06 ± 0.010.15 ± 0.02934.7
Calycosin glucuronides14.22.044.2 ± 6.3140.2 ± 11.3
LiverCalycosin0.81.031.1 ± 1.3119.6 ± 6.20.2
Calycosin glucuronides0.72.08.5 ± 1.021.2 ± 1.7
Publisher’s Note: MDPI stays neutral with regard to jurisdictional claims in published maps and institutional affiliations.

