Abstract
The main branch of vitamin D3 metabolism involves several hydroxylation reactions to obtain mono-, di- and trihydroxylated metabolites, including the circulating and active forms—25(OH)D3 and 1,25(OH)2D3, respectively. However, most clinical trials strictly target the determination of 25(OH)D3 to offer a view of the metabolic status of vitamin D3. Due to the growing interest in expanding this restricted view, we have developed a method for measuring vitamin D3 metabolism by determination of vitamin D3, 25(OH)D3, 24,25(OH)2D3, 1,25(OH)2D3 and 1,24,25(OH)3D3 in human plasma. The method was based on SPE–LC–MS/MS with a large volume injection of human plasma (240 µL). Detection of di- and trihydroxymetabolites, found at the picogram per milliliter level, was attained by the combined action of high preconcentration and clean-up effects. The method allows obtaining information about ratios such as the known vitamin D metabolite ratio (24,25(OH)2D3/25(OH)D3), which can provide complementary views of vitamin D3 metabolic status. The method was applied to a cohort of obese patients and a reference cohort of healthy volunteers to find metabolic correlations between target analytes as well as differences as a function of vitamin D levels within and between cohorts.
1. Introduction
Vitamin D status is a worldwide issue assessed in detail by several research studies due to its association with human health conditions [1]. This parameter is estimated by the quantitation of 25-hydroxyvitamin D3 (25(OH)D3) since it is the most abundant vitamin D circulating form in the human body and is mainly produced by hepatic CYP2R1 [2]. Nevertheless, the reliability of this indicator for vitamin D status has been questioned as it may not reflect the complex vitamin D metabolism. Several external factors influence serum and plasma 25(OH)D3 levels, such as the sampling period of the year, geographical location where individuals live, ethnicity and exposure to sunlight [3]. Moreover, endogenous factors such as obesity, starvation, diabetes and glucocorticoids have a major influence on CYP2R1 activity [4]. Consequently, several studies have suggested that the strong relation between the primary product of 25(OH)D3 catabolism, 24,25-dihydroxyvitamin D3 (24,25(OH)2D3), and 25(OH)D3 per se represents a more realistic marker for vitamin D status, which is generally named the vitamin D metabolite ratio (VMR) [5,6,7,8]. This recommendation arose from the fact that this parameter overcomes the significant differences induced by factors such as those mentioned earlier and allows an improved description of vitamin D status compared to just the measurement of 25(OH)D3 [6]. Since 24,25(OH)2D3 is the conversion product of 25(OH)D3 upon CYP24A1 expression, VMR is frequently used for studies of chronic kidney disease, idiopathic infantile hypercalcemia and cancer, among others, which are associated with this particular enzyme activity and vitamin D deficiency [6,7,9,10]. It is worth noting that, apart from implying the inactivation of 25(OH)D3, some biological functions of 24,25(OH)2D3 such as its important contribution to bone fracture healing have been elucidated [11,12].
Analogously, the activation of 25(OH)D3 through C1-hydroxylation by CYP27B1 produces the most active form of vitamin D3, 1,25-dihydroxyvitamin D3 (1,25(OH)2D3). This metabolite is also further metabolized by CYP24A1, generating 1,24,25-trihydroxyvitamin D3 (1,24,25(OH)3D3). CYP24A1 is strongly regulated by 1,25(OH)2D3 and is thus an important regulator of the activity of the vitamin D endocrine system [2,9,13,14]. Although the CYP24 enzyme catalyzes C24- and C23-hydroxylation reactions, it has been demonstrated that the ratio of C23- and C24-hydroxylation products for 25(OH)D3 and 1,25(OH)2D3 is 1:4, allowing the conclusion that C24-hydroxylation is the predominant catabolic pathway occurring in vitamin D metabolism [15]. In addition, Kaufmann et al., reported a continuous formation of 1,24,25(OH)3D3 in absence of the CYP24A1 enzyme in 24,25(OH)2D-treated mice, suggesting a C1-hydroxylation of 24,25(OH)2D3 due to the contribution of CYP27B1 [14]. In vitro, 1,24,25(OH)3D3 is a poor VDR agonist, and in vivo, no biological functions of 1,24,25(OH)3D3 have been found other than its participation as an intermediate in the inactivation pathway of 1,25(OH)2D3 ending in its primary excretory catabolite, calcitroic acid. Nevertheless, it could be interesting to study this metabolite in greater detail as a potential indicator of overall vitamin D metabolism and its correlation with its precursors, 24,25(OH)2D3 and 1,25(OH)2D3 [14]. The determination of 1,24,25(OH)3D3 would indeed allow providing more details about the catabolism of the most relevant forms of vitamin D, the major circulating and active forms.
Due to the fact that these metabolites are found at low concentration levels (nanograms per milliliter or picograms per milliliter), liquid chromatography coupled to tandem mass spectrometry (LC–MS/MS) is the most important analytical platform employed in their determination by virtue of its high sensitivity and precision [16]. However, it usually comes along with a previous sample preparation step, allowing analyte preconcentration and clean-up of potential interferences. The aim of this study is to propose an analytical method based on online solid-phase extraction (SPE) coupled to LC–MS/MS for evaluation of vitamin D3 metabolic status by combined measurements of vitamin D3 (substrate), 25(OH)D3 (circulating metabolite), 1,25(OH)2D3 (active metabolite), 24,25(OH)2D3 (metabolic regulator) and 1,24,25(OH)3D3 (inactive metabolite). Hence, metabolite ratios may be estimated to enhance our knowledge of physiological and metabolic changes in vitamin D deficient patients as well as healthy control individuals, and this method allows defining levels of vitamin D status more accurately.
2. Materials and Methods
2.1. Chemicals and Reagents
Mass spectrometry grade ammonium formate and formic acid (FA) were acquired from Sigma (Sigma–Aldrich, St. Louis, MO, USA) as ionization and sorbent activation agents; methanol (MeOH) and acetonitrile (ACN) from Scharlab (Barcelona, Spain) and deionized water (18 mΩ cm) from a Millipore Milli-Q water purification system were employed for the preparation of chromatographic mobile phases and SPE solutions.
Analytical standards of vitamin D3, 25-hydroxyvitamin D3 (25(OH)D3), 1,25-dihydroxyvitamin D3 (1,25(OH)2D3) and 24,25-dihydroxyvitamin D3 (24,25(OH)2D3) and their deuterated internal standards (ISs), vitamin D3-d3, 25(OH)D3-d3, 1,25(OH)2D3-d3 and 24,25(OH)2D3-d6, were purchased from Sigma–Aldrich. 1,24,25-Trihydroxyvitamin D3 (1,24,25(OH)3D3) analytical standard was obtained from Quimigen S.L. (Madrid, Spain) but no IS for this analyte was available. According to endogenous concentration ranges of these metabolites found in plasma samples, a multistandard working solution was prepared, vitamin D3 at 1.5 µg mL−1, 25(OH)D3 at 15 μg mL−1, 24,25(OH)2D3 at 0.5 μg mL−1, 1,25(OH)2D3 at 25 ng mL−1 and 1,24,25(OH)3D3 at 50 ng mL−1. Since the presence of matrix effects has been proven in LC–MS/MS analyses of vitamin D3 and its metabolites in plasma samples [2,17], a working solution of ISs was used, in order to correct variations in results due to this phenomenon, at the following concentrations: vitamin D3-d3 and 25(OH)D3-d3 at 625 ng mL−1, 24,25(OH)2D3-d6 at 125 ng mL−1 and 1,25(OH)2D3-d3 at 7.5 ng mL−1.
2.2. Instruments and Apparatus
Plasma separation from whole blood was conducted by centrifugation in a Digtor 21 centrifuge (Orto Alresa, Madrid, Spain). Homogenization, centrifugation and filtration of common plasma pools were carried out with a vortex shaker from IKA (Wilmington, NC, USA), a Sorvall Legend Micro 21R microcentrifuge from Thermo Fisher Scientific (Waltham, MA, USA) and 0.2 µm nylon syringe filters (Agilent Technologies, Palo Alto, CA, USA), respectively.
SPE sample processing was conducted using a Symbiosis system (Spark Holland, Emmen, the Netherlands), which incorporates three modules: (i) an autosampler (Reliance) including a sample loop of 0.2 mL, (ii) two high-pressure syringe dispensers (HPDs) for solvent delivery and (iii) an automatic cartridge exchange unit (ACE) in which Hysphere C8 packed cartridges (8 µm, 10 × 2 mm) were employed as a sorbent (SIA Enginyers, Barcelona, Spain). A stainless steel tube (1.0 mm i.d.) of 1 mL volume capacity was used to connect Reliance and ACE units allowing appropriate mixing efficiency of the sample and the loading solvent. Symbiosis modules and the LC–MS/MS system were linked by PEEK tubing of 0.25 mm i.d. (VICI, Houston, TX, USA).
Separation of analytes was performed through reversed-phase liquid chromatography (RP-LC) with an Agilent 1200 Series LC system (Palo Alto, CA, USA) equipped with a Poroshell 120 EC-C18 analytical column (2.7 µm particle size, 50.0 × 4.6 mm i.d.) preceded by a C18 guard column (2.7 µm particle size, 5.0 × 4.6 mm i.d.), both maintained at 15 °C during analysis and acquired from Agilent Technologies (Palo Alto, CA, USA).
Mass spectrometric detection was executed in multiple reaction monitoring (MRM) mode using an Agilent (Palo Alto, CA, USA) 6410 triple quadrupole (QqQ) mass spectrometer with electrospray ionization in positive polarity mode (ESI+).
2.3. Plasma Sampling and Storage
Blood samples from 40 patients with obesity and 90 healthy volunteers were extracted into adequate plastic plasma Vacutainer tubes (Becton Dickinson, East Rutherford, NJ, USA) in compliance with the World Medical Association Declaration of Helsinki (2004) guidelines. The general and clinical characteristics of the two cohorts are summarized in Table 1. The Ethics Committee of the Reina Sofia University Hospital (Cordoba, Spain) approved the study, and written informed consent was signed by every individual before inclusion in the study. Blood tubes were centrifugated at 4000× g for 20 min. Then, plasma samples were stored at −80 °C until analysis. A plasma pool prepared from nine volunteer donors was used for the development of the method.

Table 1.
Characteristics of the evaluated individuals.
2.4. Online SPE–LC–MS/MS Determination
The sample preparation step consisted of thawing plasma samples at room temperature, centrifuging (4 °C) at 20,000× g for 10 min and sterilizing the resulting supernatant fraction by filtration. Then, aliquots of 240 µL were pretreated by adding 10 µL of IS working solution to each one followed by SPE after shaking in a vortex shaker for 2 min. Regarding the SPE stage, activation of sorbent was achieved by adding 6 mL of MeOH, and conditioning and equilibration of cartridges was achieved by adding 8 mL of the loading sample solvent mix as recommended by the manufacturer. However, different loading sample and interferent clean-up volumes and solvent mixes were evaluated for appropriate process performance. Finally, elution of retained metabolites was achieved with LC mobile phases for 5 min.
The composition of LC mobile phases was 5 mM of ammonium formate in water (phase A) and 5 mM of ammonium formate in MeOH (phase B). The chromatographic gradient was programmed with a constant flow rate of 0.5 mL min−1, from 85% of phase B, maintained during the initial 2 min, up to 100% of phase B in the next 5 min, conditions that were kept constant for the final 7 min of the chromatography. Furthermore, a post-run of 10 additional min was set to re-establish and equilibrate the initial conditions for the consequent run.
Chromatograph–detector interface parameters were set to 350 °C and 9 L min−1 of drying gas (N2), a nebulizer pressure of 50 psi and 4500 V of capillary voltage. All metabolite detection parameters were studied by direct infusion of individual standard solutions at a concentration of 1 µg mL−1.
2.5. Method Validation
The assessment of the analytical features of the proposed method was performed according to the Center for Drug Evaluation and Research (CDER) guidelines [18]. Thus, linearity, sensitivity, accuracy, precision and extraction efficiency were characterized. The applicability of the proposed method was also determined for further use in clinical studies.
2.6. Data Treatment
Acquisition and processing of data were performed with MassHunter software (V-B.05, Agilent Technologies, Palo Alto, CA, USA). For data treatment and statistical analysis (e.g., calibration curves and box and whisker plots), Microsoft Excel V 16.30 (Microsoft, Redmond, WA, USA), R V 3.0 (R Core Team, Vienna, Austria) with RStudio V 1.3.959 (RStudio Team, Boston, MA, USA) and Metaboanalyst 5.0 online software were employed (https://www.metaboanalyst.ca/docs/About.xhtml (accessed on 1 March 2022)).
3. Results
3.1. Optimization of MS/MS Detection of Target Metabolites
Since ionization efficiency and fragmentation of metabolites mainly depend on their chemical structures, an evaluation of the optimum parameters for target metabolite detection was accomplished by direct infusion of standard solutions. A study of the most sensitive precursor ions, with the analysis conditions described previously (Section 2.4), was performed in scan mode. As a result, Table S1 shows the most sensitive adducts for analytes and ISs. Thus, [M + H − H2O]+ was the preferred precursor ion for hydroxylated and dihydroxylated metabolites while [M + H]+ was the most intense ion for vitamin D3. For the particular case of 1,24,25(OH)3D3, 397.3 m/z was the precursor ion providing the highest analytical signal, which corresponds to its [M + H − 2H2O]+ adduct. Fragmentation patterns were assessed to elucidate the most abundant fragments for the selection of transitions. In the case of the trihydroxylated metabolite, preferred product ions were detected at 121.1, 107.1 and 71.1 m/z when applying collision energies of 20, 30 and 40 eV, respectively. Chromatograms obtained by analysis of standard solutions in MRM mode proved that the quantitation transitions providing the highest signal intensity were those shown in Table S1. Optimum separation was attained in 12 min and 1,24,25(OH)3D3 eluted at 2.8 min.
3.2. Evaluation of Adequate SPE Conditions
SPE sample preparation was studied by testing two critical steps, namely sample loading and interferent clean-up. The evaluated parameters were the volume and composition of the solutions used in both steps. Particularly, the solution composition was varied from 10 to 25% ACN in water (v/v), acidified with 0.7% of FA, for sample loading, and from 0 to 30% ACN in water (v/v) for interferent clean-up. The concentration of ACN was slightly higher in the washing step since proteins were partially eluted in the loading step and, therefore, the risk of precipitation in the cartridge and connection tubes is reduced. On the other hand, volumes in both steps were tested from 0 to 3.5 mL. Considering that 1,24,25(OH)3D3 and 1,25(OH)2D3 are the target metabolites normally found at the lowest concentration levels (picogram per milliliter) in plasma samples, we based SPE evaluation on results obtained for these two analytes. As Figure 1 shows, globally optimum analytical responses were found using 3 mL 25% ACN in water acidified with 0.7% of FA for sample loading and 2 mL 30% ACN in water for interferent clean-up.
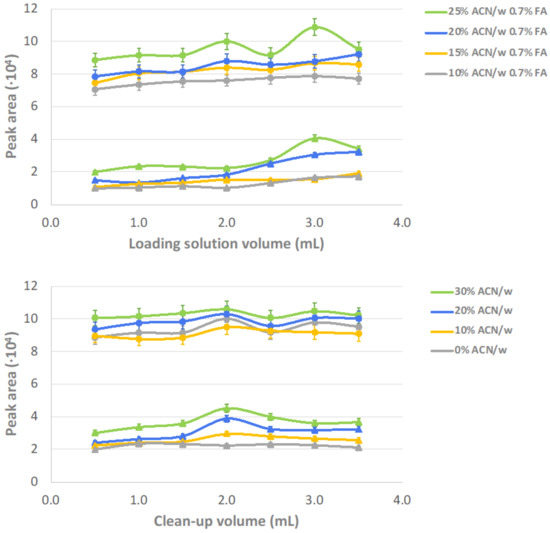
Figure 1.
Effect of the composition and volume of the solutions used for sample loading and clean-up in SPE. The evaluation is based on the response of the two metabolites found at lowest concentration in plasma, (▲) 1,24,25(OH)3D3 and (●) 1,25(OH)2D3.
3.3. Analytical Features of the Proposed Method
3.3.1. Best-Matched IS (B-MIS) Evaluation, Linearity, and Sensitivity
Since isotope-labeled ISs were not available for 1,24,25(OH)3D3, the two ISs having the most similar structures, 1,25(OH)2D3-d3 and 24,25(OH)2D3-d6, were compared to select the most convenient for quantitation of the trihydroxylated metabolite. The fit of calibration models was considered to select the B-MIS providing the most suited correction of variability sources due to matrix effects and possible interferents [19]. Calibration curves were constructed by analysis of plasma pool aliquots spiked at variable concentrations with target analytes. Table S2 shows a satisfactory linearity since all coefficients of determination (R2) were above 0.99. In the case of 1,24,25(OH)3D3, Figure 2 shows the calibration models considering both IS candidates. Thus, linearity was better with the application of 1,25(OH)2D3-d3 (R2 = 0.9964), as compared to 24,25(OH)2D3-d6 (R2 = 0.9537). Furthermore, mean variability (expressed as %RSD) considering all calibration levels was 9.0 and 16.2% when utilizing 1,25(OH)2D3-d3 and 24,25(OH)2D3-d6, respectively. With these premises, 1,25(OH)2D3-d3 was considered the B-MIS for quantitation of 1,24,25(OH)3D3 in plasma samples. This result can be explained since 1,25(OH)2D3 is the main structural precursor for the production of 1,24,25(OH)3D3 [15].
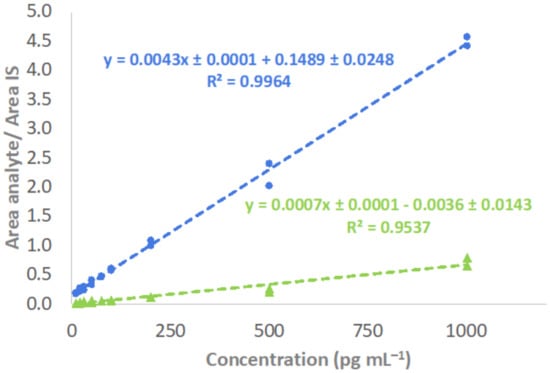
Figure 2.
Calibration curves and linearity for determination of 1,24,25(OH)3D3 employing 1,25(OH)2D3-d3 (●) and 24,25(OH)2D3-d6 (▲) as ISs.
Limits of detection (LODs) and quantitation (LOQs) were evaluated as parameters representing the sensitivity of the method. These were estimated for each analyte by spreading calibration ranges down to low concentration levels. Prediction of LODs and LOQs was achieved by 3- and 10-times signal above background noise, respectively. However, confirmation of LOD and LOQ estimation was made by analyzing plasma aliquots spiked at the lowest concentration levels of each calibration range. LODs and LOQs reached for vitamin D3 metabolites were below 3 and 10 pg mL−1 (Supplementary Materials Table S2), respectively, which are comparable to previous studies [16,20,21]. Particularly, it is worth noting that scant information is available in the literature about the trihydroxylated metabolite of vitamin D3. Kaufmann et al., determined 1,24,25(OH)3D3 in mouse serum and found an LOD of 4 pg mL−1 [14], which is above the LOD presented in our research.
3.3.2. Extraction Efficiency
Extraction efficiency (%EE) was assessed by a partial modification of the SPE configuration by on-line insertion of a second cartridge. Thereby, the loaded sample flowed through both cartridges and the fraction independently eluted from each cartridge was sequentially analyzed by LC–MS/MS to estimate the retention/elution capability of the sorbent. The following equation was used:
%EE = (concentration retained in cartridge 1)/((concentration retained in cartridge 1 + concentration retained in cartridge 2)) × 100
This equation was calculated by measuring the concentration of four quality control samples (QCs) that were analyzed in triplicate. The set of QCb consisted of non-spiked aliquots of the pool, whereas QCl, QCm and QCh were pool aliquots spiked with the target analytes at low, medium and high concentration levels. Particularly, QCl were pool aliquots spiked at 0.3 ng mL−1 for vitamin D3, 3 ng mL−1 for 25(OH)D3, 0.1 ng mL−1 for 24,25(OH)2D3, 5 pg mL−1 for 1,25(OH)2D3 and 10 pg mL−1 for 1,24,25(OH)3D3. QCm and QCh were spiked at concentrations 10 and 60 times higher than those used for QCl, respectively. Results of extraction efficiency, listed in Table 2, revealed a quantitative extraction of all metabolites in the first cartridge from 90.3 to 100.0% with the same performance at different concentration levels. On the other hand, residual retention was found in the second cartridge.
Table 2.
Extraction efficiency, accuracy and precision assessment of the method proposed for quantitation of vitamin D3 and metabolites.
3.3.3. Accuracy and Precision Assessment
The accuracy was evaluated with the set of QCs. Each QC was analyzed in triplicate and results were expressed as percentages. The acceptance cut-off was set at 15% RSD of nominal concentration values for each QC, although this cut-off can be increased up to 20% RSD at levels close to LOQs (QCl) [18]. Table 2 shows accuracy mean results per analyte for each concentration level. Mean results were in a range between 90.0 and 111.4%, which perfectly fits the adopted criteria [18].
Method precision was also defined with QCs at the four concentration levels, which were analyzed for five consecutive days. Each day, samples were analyzed in triplicate. Within-day variability and between-days variability were estimated by calculating % RSD mean values of results obtained on each day (n = 3) and after the full experiment (n = 5), respectively. Within-day variability ranged from 3.7 to 10.7%, while this range was slightly increased for between-days variability, from 5.1 to 11.7%. Considering the guidelines for methods validation used as a reference [18], precision estimated with the applied experimental plan was acceptable.
3.4. Application of the Proposed Method
Analysis of the selected cohorts was performed with the proposed method to show its applicability. Previous studies have defined vitamin D metabolic levels according to 25(OH)D3 concentration. Thus, severe vitamin D deficiency is pointed out for 25(OH)D3 concentrations below 12 ng mL−1, deficiency is related to levels of this circulating metabolite between 12 and 20 ng mL−1 and sufficiency is considered above 20 ng mL−1 [4,22,23]. Table 3 shows concentration levels in the two cohorts and the distribution of cases according to this categorization.
Table 3.
Concentration of target metabolites detected in the studied cohorts.
In the cohort of obese patients, 40% of individuals presented severe vitamin D deficiency. This percentage was lower for the control cohort since only 22.2% of individuals reported severe vitamin D deficiency. Complementarily, 44.4% of control individuals were classified as vitamin D deficient individuals, and a third of the total cohort provided sufficient vitamin D levels. Comparison between the two cohorts was carried out with a non-parametric Mann–Whitney U test for independent samples (95% confidence level). Consequently, significant differences (p-value < 0.01) were revealed in the levels of all hydroxylated metabolites, whereas no differences were found for vitamin D3 (Figure 3). As expected, 25(OH)D3 levels were higher in the control cohort as compared to the obese cohort. The cohort of obese patients was characterized by a predominance of metabolic or mechanic comorbidities since 70% of obese individuals were diagnosed with hypertension, type 2 diabetes, dyslipidemia and sleep-obstructive apnea. 1,25(OH)2D3 concentration was also significantly higher in the control group, as was the concentration of 1,24,25(OH)3D3. On the other hand, the other dihydroxylated metabolite, 24,25(OH)2D3, was found at a higher concentration in obese patients as compared to control individuals. This result was also evident for ratios between the concentrations of the dihydroxylated metabolites and the concentration of 25(OH)D3. The activation of 25(OH)D3, through the 1,25(OH)2D3/25(OH)D3 ratio, is clearly favored in control individuals, while the conversion to 24,25(OH)2D3 is enhanced in obese individuals. This fact could support an increased vitamin D catabolism in obese patients, as has been proposed by other authors [24].
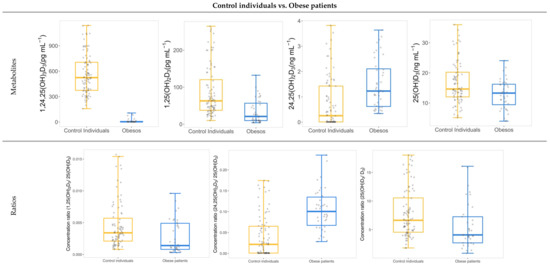
Figure 3.
Box and whisker plots showing significant differences in concentration levels and ratios between obese patients and control individuals.
Concerning the groups defined by vitamin D levels in the two cohorts, no significant differences were found in the groups as a function of age, sex or body mass index (BMI) (Table 1). No significant differences for comorbidities in the obese cohort were detected in the severe deficiency versus deficiency groups. According to the categorization, significant differences found in 25(OH)D3 levels were evident. As expected, significance for 24,25(OH)2D3 supports its modulation role in vitamin D3 metabolism and a formation strictly dependent on 25(OH)D3 levels (Figure 4). In both cohorts, levels were lower for the severe vitamin D deficiency group. Furthermore, this was supported by two statistically significant correlations (p-value = 0.0004, ρ > 0.5 and p-value < 0.0001, ρ = 0.82; Table S3 and Figure S1) in the two cohorts corresponding to 25(OH)D3 versus 24,25(OH)2D3 and 24,25(OH)2D3 versus 24,25(OH)2D3/25(OH)D3 ratio, respectively. From a clinical perspective, interpretation of these values suggests a moderate association between 24,25(OH)2D3 and the major circulating form of vitamin D3 [25], which confirms the strength of VMR as a parameter to describe vitamin D status [5,6]. Contrarily, no significant differences were obtained when comparing 1,24,25(OH)3D3 and 1,25(OH)2D3 concentration levels in the two cohorts according to vitamin D metabolic status. The concentration of 1,25(OH)2D3 seems not to be influenced by 25(OH)D3 concentration when compared among the groups defined by vitamin D metabolic status. However, we found a strong significant correlation of 1,25(OH)2D3 levels with the 1,25(OH)2D3/25(OH)D3 ratio (p-value < 0.05, ρ = 0.89) that represents the CYP27B1 activity regulating the formation of the active form. The 1,25(OH)2D3/25(OH)D3 ratio was also significantly different in the two cohorts when comparing groups organized by vitamin D levels, being higher for individuals with severe vitamin D deficiency.
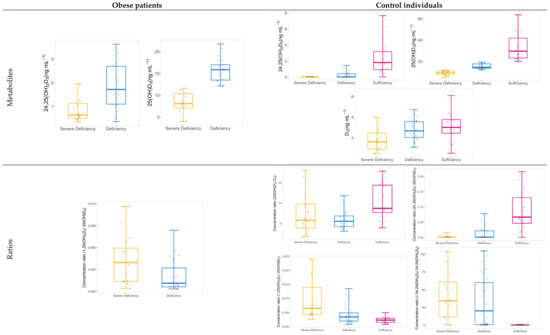
Figure 4.
Box and whisker plots showing significant differences in concentration levels and ratios between vitamin D groups within both studied cohorts.
Furthermore, no significant differences in the levels of the trihydroxylated metabolite between groups suggest that 1,24,25(OH)3D3 is not associated with 25(OH)D3 concentration levels. Nevertheless, a negative correlation between 1,25(OH)2D3 and the 1,24,25(OH)3D3/1,25(OH)2D3 ratio (p-value < 0.0001, ρ = −0.63) determines its inactivation due to the contribution of CYP24A1. The absence of significance can be explained by the involvement of other parameters such as calcium and phosphate levels as well as parathyroid hormone (PTH) and fibroblast growth factor 23 (FGF23) activity [4,26].
For the control cohort, significant differences in the concentration of vitamin D3 among the three groups were also found for the vitamin D level (Figure 4), and the highest content was found in vitamin D sufficient individuals. This does not occur in the obese cohorts, where vitamin D3 levels do not contribute to explaining vitamin D metabolic status.
In the control cohort, metabolic differences were also detected in the three groups when comparing the values for ratios 25(OH)D3/D3, 1,24,25(OH)3D3/24,25(OH)2D3 and 24,25(OH)2D3/25(OH)D3. The 24,25(OH)2D3/25(OH)D3 ratio reflects the formation of 24,25(OH)2D3, which seems to be a direct indicator of the vitamin D level. On the other hand, the 1,24,25(OH)3D3/24,25(OH)2D3 ratio was higher for severe vitamin D deficiency individuals as compared to deficiency and sufficiency controls. Therefore, there seem to be clear differences in the second hydroxylation step for activation of the circulating form, 25(OH)D3, as a function of vitamin D status. Conversion to 1,25(OH)2D3 or 24,25(OH)2D3 seems to be influenced by vitamin D status. Additionally, the correlation between 1,25(OH)2D3/25(OH)D3 and 1,24,25(OH)3D3/1,25(OH)2D3 (p-value < 0.0001, ρ = −0.70) was also negative, which represents that an increase or decrease in the formation of the active form would be associated with the contrary effect on its conversion to 1,24,25(OH)3D3.
4. Conclusions
Determination of vitamin D metabolic status is a current worldwide challenge since many controversies exist regarding its clinical assessment. Addressing vitamin D status as a function of 25(OH)D3 concentration levels in plasma is being questioned because several factors have been proven to influence this physiological condition. Therefore, a method was proposed in this study to gather more information about vitamin D metabolism by online SPE–LC–MS/MS quantitation of vitamin D3, 25OHD3, 24,25(OH)2D3, 1,25(OH)2D3 and 1,24,25(OH)3D3 in human plasma. Results demonstrated that the proposed analytical method was successfully developed and validated according to elected guidelines as reference. Application of the method to the selected cohorts resulted in significant differences in 25(OH)D3, 24,25(OH)2D3 and vitamin D3 concentration levels, according to a categorization of individuals based on severe vitamin D deficient, deficient, and sufficient groups. Furthermore, significant differences were found for all vitamin D hydroxylated metabolites when comparing both cohorts, which could help to elucidate vitamin D metabolism in obese patients. Additionally, this study revealed intense correlations among vitamin D3 metabolites and metabolic ratios, which may lead to a better understanding of vitamin D status.
Supplementary Materials
The following supporting information can be downloaded at, https://www.mdpi.com/article/10.3390/separations9060141/s1, Figure S1. Plots of significant correlations between metabolites and ratios involved in vitamin D3 metabolism; Table S1. MRM parameters for detection of target metabolites and ISs; Table S2. Calibration models for determination of target metabolites in plasma; Table S3. Spearman correlation results between metabolites and ratios involved in vitamin D3 metabolism.
Author Contributions
Conceptualization, L.d.l.S.C.-P., R.B., J.M.Q.-G. and F.P.-C.; methodology, L.d.l.S.C.-P., M.C.-S. and F.P.-C.; validation, L.d.l.S.C.-P., M.C.-S., J.M.Q.-G. and F.P.-C.; formal analysis, L.d.l.S.C.-P., M.C.-S., J.M.Q.-G. and F.P.-C.; investigation, L.d.l.S.C.-P., M.C.-S. and F.P.-C.; resources, A.D.H.-M., S.L.-I., M.Á.G.-M. and R.L.S.-C.; writing—original draft preparation, L.d.l.S.C.-P., M.C.-S., R.B., J.M.Q.-G. and F.P.-C.; writing—review and editing, L.d.l.S.C.-P., M.C.-S., A.D.H.-M., S.L.-I., M.Á.G.-M., R.L.S.-C., R.B., J.M.Q.-G. and F.P.-C.; funding acquisition, F.P.-C. All authors have read and agreed to the published version of the manuscript.
Funding
This research was funded jointly by the Spanish Ministerio de Ciencia e Innovación (PID2019-111373RB-I00 project), Junta de Andalucía (PI-0038/2019, bio-0139 project) and European Regional Development Fund/European Social Fund (“Investing in your future”). Consortium for Biomedical Research in Frailty and Healthy Ageing (CIBERFES) is an initiative of Carlos III Institute of Health.
Institutional Review Board Statement
The study was conducted in accordance with Declaration of Helsinki and, national and international guidelines. It was also approved by Ethics Committee of Reina Sofia University Hospital from Cordoba, Spain.
Informed Consent Statement
Informed consent was obtained from all subjects involved in this study.
Data Availability Statement
Not applicable.
Conflicts of Interest
The authors declare no conflict of interest.
Abbreviations
ACE, automatic cartridge exchange; BMI, body mass index; EE, extraction efficiency; ESI, electrospray ionization; FGF23, fibroblast growth factor 23; HPD, high-pressure syringe dispenser; IS, internal standard; LC–MS/MS, liquid chromatography coupled to tandem mass spectrometry; LOD, limit of detection; LOQ, limit of quantitation; MRM, multiple reaction monitoring; PTH, parathyroid hormone; QC, quality control; QqQ, triple quadrupole mass spectrometer; ρ, Spearman’s correlation coefficient rho; R2, coefficient of determination; RSD, relative standard deviation; SPE, solid-phase extraction; VMR, vitamin D metabolite ratio.
References
- Van Schoor, N.; Lips, P. Global Overview of Vitamin D Status. Endocrinol. Metab. Clin. N. Am. 2017, 46, 845–870. [Google Scholar] [CrossRef] [PubMed]
- Tuckey, R.C.; Cheng, C.Y.S.; Slominski, A.T. The serum vitamin d metabolome: What we know and what is still to discover. J. Steroid Biochem. Mol. Biol. 2019, 186, 4–21. [Google Scholar] [CrossRef] [PubMed]
- Makris, K.; Sempos, C.; Cavalier, E. The measurement of vitamin D metabolites part II—the measurement of the various vitamin D metabolites. Hormones 2020, 19, 97–107. [Google Scholar] [CrossRef] [PubMed]
- Bouillon, R.; Bikle, D. Vitamin D metabolism revised: Fall of dogmas. J. Bone Miner. Res. 2019, 34, 1985–1992. [Google Scholar] [CrossRef]
- Berg, A.H.; Powe, C.E.; Evans, M.K.; Wenger, J.; Ortiz, G.; Zonderman, A.B.; Suntharalingam, P.; Lucchesi, K.; Powe, N.R.; Karumanchi, S.A.; et al. 24,25-dihydroxyvitamin D3 and vitamin D status of community-dwelling black and white americans. Clin. Chem. 2015, 61, 877–884. [Google Scholar] [CrossRef] [Green Version]
- Fabregat-Cabello, N.; Farre-Segura, J.; Huyghebaert, L.; Peeters, S.; Le Goff, C.; Souberbielle, J.C.; Cavalier, É. A fast and simple method for simultaneous measurements of 25(OH)D, 24,25(OH)2D and the vitamin d metabolite ratio (VMR) in serum samples by LC-MS/MS. Clin. Chim. Acta 2017, 473, 116–123. [Google Scholar] [CrossRef]
- Park, H.; Brannon, P.M.; West, A.A.; Yan, J.; Jiang, X.; Perry, C.A.; Malysheva, O.V.; Mehta, S.; Caudill, M.A. Vitamin D metabolism varies among women in different reproductive states consuming the same intakes of vitamin D and related nutrients. J. Nutr. 2016, 146, 1537–1545. [Google Scholar] [CrossRef] [Green Version]
- Tang, J.C.Y.; Nicholls, H.; Piec, I.; Washbourne, C.J.; Dutton, J.J.; Jackson, S.; Greeves, J.; Fraser, W.D. Reference intervals for serum 24,25-dihydroxyvitamin D and the ratio with 25-hydroxyvitamin D established using a newly developed LC–MS/MS Method. J. Nutr. Biochem. 2017, 46, 21–29. [Google Scholar] [CrossRef] [Green Version]
- Jones, G.; Prosser, D.E.; Kaufmann, M. 25-Hydroxyvitamin D-24-Hydroxylase (CYP24A1): Its important role in the degradation of vitamin D. Arch. Biochem. Biophys. 2012, 523, 9–18. [Google Scholar] [CrossRef]
- Pludowski, P.; Holick, M.F.; Pilz, S.; Wagner, C.L.; Hollis, B.W.; Grant, W.B.; Shoenfeld, Y.; Lerchbaum, E.; Llewellyn, D.J.; Kienreich, K.; et al. Autoimmunity reviews vitamin d effects on musculoskeletal health, immunity, autoimmunity, cardiovascular disease, cancer, fertility, pregnancy, dementia and mortality—A review of recent evidence. Autoimmun. Rev. 2013, 12, 976–989. [Google Scholar] [CrossRef]
- St-Arnaud, R.; Naja, R.P. Molecular and cellular endocrinology vitamin D metabolism, cartilage and bone fracture repair. Mol. Cell. Endocrinol. 2011, 347, 48–54. [Google Scholar] [CrossRef]
- Martineau, C.; Jones, G.; St-Arnaud, R.; Martineau, C.; Naja, R.P.; Husseini, A.; Hamade, B.; Kaufmann, M.; Akhouayri, O.; Arabian, A.; et al. Optimal bone fracture repair requires 24R,25-dihydroxyvitamin D3 and its effector molecule FAM57B2. J. Clin. Investig. 2018, 128, 3546–3557. [Google Scholar] [CrossRef] [Green Version]
- Dirks, N.F.; Ackermans, M.T.; Lips, P.; De Jongh, R.T.; Vervloet, M.G.; De Jonge, R.; Heijboer, A.C. The when, what & how of measuring vitamin D metabolism in clinical medicine. Nutrients 2018, 10, 482. [Google Scholar] [CrossRef] [Green Version]
- Kaufmann, M.; Martineau, C.; Arabian, A.; Traynor, M.; St-arnaud, R. Calcioic acid: In vivo detection and quantification of the terminal C24-oxidation product of 25-hydroxyvitamin D3 and related intermediates in serum of mice treated with 24,25-dihydroxyvitamin D3. J. Steroid Biochem. Mol. Biol. 2019, 188, 23–28. [Google Scholar] [CrossRef]
- Sakaki, T.; Sawada, N.; Komai, K.; Shiozawa, S.; Yamada, S.; Yamamoto, K. Dual Metabolic pathway of 25-hydroxyvitamin D3 catalyzed by human. Eur. J. Biochem. 2000, 267, 6158–6165. [Google Scholar] [CrossRef] [Green Version]
- Yin, S.; Yang, Y.; Wu, L.; Li, Y.; Sun, C. Recent advances in sample preparation and analysis methods for vitamin D and its analogues in different matrices. Trends Anal. Chem. 2019, 110, 204–220. [Google Scholar] [CrossRef]
- Kassim, N.S.A.; Shaw, P.N.; Hewavitharana, A.K. Simultaneous determination of 12 vitamin D compounds in human serum using online sample preparation and liquid chromatography-tandem mass spectrometry. J. Chromatogr. A 2018, 1533, 57–65. [Google Scholar] [CrossRef]
- U.S. Food & Drug Administration. Available online: https://www.fda.gov/files/drugs/published/Bioanalytical-Method-Validation-Guidance-for-Industry.pdf (accessed on 15 March 2021).
- Boysen, A.K.; Heal, K.R.; Carlson, L.T.; Ingalls, A.E. Best-Matched Internal Standard Normalization in liquid chromatography−mass spectrometry metabolomics applied to environmental samples. Anal. Chem. 2018, 90, 1363–1369. [Google Scholar] [CrossRef]
- Mena-Bravo, A.; Ferreiro-Vera, C.; Priego-Capote, F.; Maestro, M.A.; Mouriño, A.; Quesada-Gómez, J.M.; Luque de Castro, M.D. Quantitative analytical method to evaluate the metabolism of vitamin D. Clin. Chim. Acta 2015, 442, 6–12. [Google Scholar] [CrossRef]
- Okabe, H.; Shimizu, C.; Yamamoto, M.; Kikuchi, R.; Minami, A.; Chen, Y.F.; Imai, H.; Mizuta, M.; Chen, Z.; Chiba, H.; et al. Determination of serum 25-hydroxyvitamin D3 by LC/MS/MS and its monthly variation in Sapporo indoor workers. Anal. Sci. 2018, 34, 1043–1047. [Google Scholar] [CrossRef] [Green Version]
- Dominguez, L.J.; Farruggia, M.; Veronese, N.; Barbagallo, M. Vitamin D sources, metabolism, and Deficiency: Available compounds and guidelines for its treatment. Metabolites 2021, 11, 255. [Google Scholar] [CrossRef]
- Bouillon, R. Comparative analysis of nutritional guidelines for vitamin D. Nat. Rev. Endocrinol. 2017, 13, 466–479. [Google Scholar] [CrossRef] [PubMed]
- Wamberg, L.; Christiansen, T.; Paulsen, S.K.; Fisker, S.; Rask, P.; Rejnmark, L.; Richelsen, B.; Pedersen, S.B. Expression of vitamin D-metabolizing enzymes in human adipose tissue—The effect of obesity and diet-induced weight loss. Int. J. Obes. 2013, 37, 651–657. [Google Scholar] [CrossRef] [Green Version]
- Akoglu, H. User’s guide to correlation coefficients. Turk. J. Emerg. Med. 2018, 18, 91–93. [Google Scholar] [CrossRef]
- Gil, Á.; Plaza-diaz, J.; Mesa, M.D. Vitamin D: Classic and novel actions. Ann. Nutr. Metab. 2018, 72, 87–95. [Google Scholar] [CrossRef]
Publisher’s Note: MDPI stays neutral with regard to jurisdictional claims in published maps and institutional affiliations. |
© 2022 by the authors. Licensee MDPI, Basel, Switzerland. This article is an open access article distributed under the terms and conditions of the Creative Commons Attribution (CC BY) license (https://creativecommons.org/licenses/by/4.0/).