
Separation of Monosaccharide Anomers on Photo-Click Cysteine-Based Stationary Phase: The α/β Interconversion Process Studied by Dynamic Hydrophilic Liquid Chromatography

 , , , and
Abstract
:
1. Introduction
2. Experimental Section
2.1. Materials and Methods
2.1.1. Materials
2.1.2. Instruments
2.1.3. Columns
2.1.4. Sample Preparation
- (a)
- Standard solution preparation
- (b)
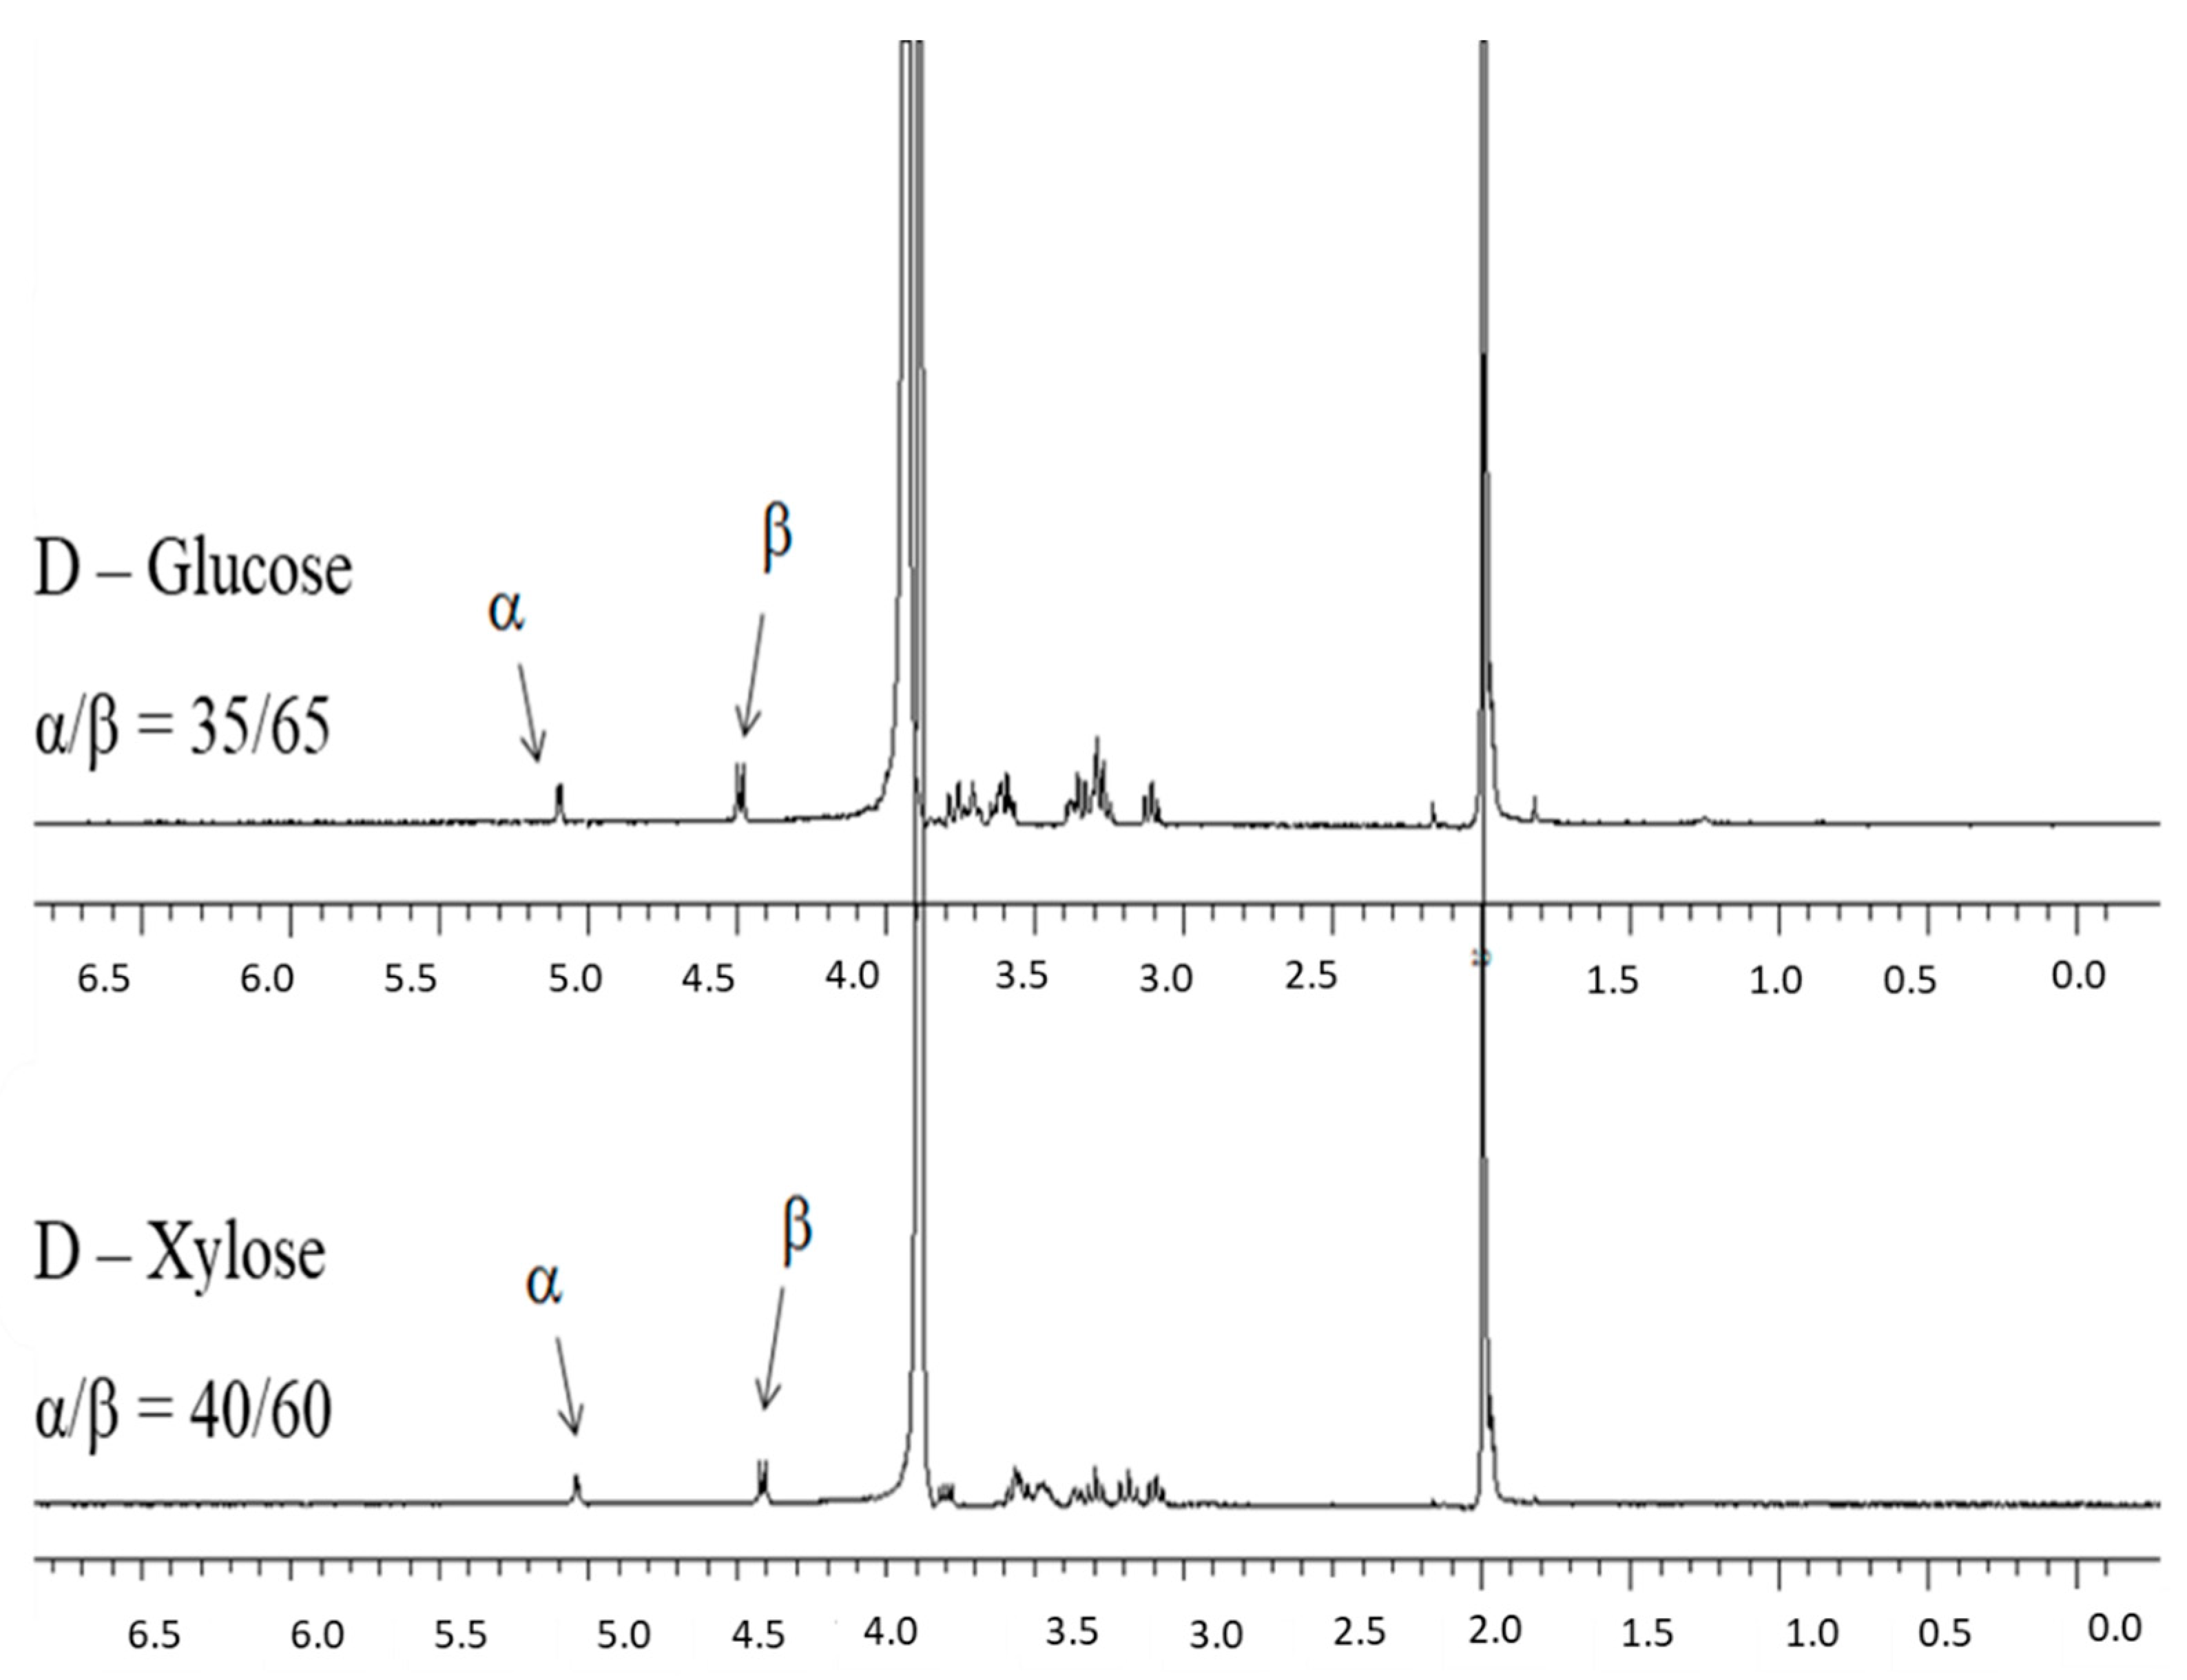
- Determination of the ratio between the two α/β anomers in equilibrium by 1H-NMR
3. Results and Discussion
3.1. Stationary Phase and HILIC Performances
3.2. Sugar Retention
3.3. Dynamic HPLC Experiments: A Brief Overview
- (a)
- The dynamic profile of case I is associated with experimental conditions in which all molecules of both species A and B have undergone at least one cycle of interconversion during their discrimination inside the chromatographic column. As a result, a single peak of A and B in the mixture is eluted, characterized by a retention time intermediate between those of the single isomers. This dynamic chromatogram is not suitable for obtaining kinetic information.
- (b)
- The dynamic profile reported in case II refers to a good chromatographic resolution of isomers A and B concomitant with an active, although only partial, interconversion between the same species during the discrimination process. In practice, only a fraction of the injected molecules underwent interconversion during the separation process. This dynamic chromatogram is the only one suitable for obtaining kinetic information by comparison with computational simulation.
- (c)
- Profile of case III is obtained if, during the chromatographic run, the injected isomers A and B are effectively discriminated in two well baseline-separated peaks, without any concomitant, interconversion process occurred during the run. This kind of chromatograms could be employed in off-column batch-wise determinations but, obviously, not in DC measurements.
3.4. Dynamic HILIC for Interconverting α/β Anomers
4. Conclusions
Supplementary Materials
Author Contributions
Funding
Conflicts of Interest
References
- Yan, J.; Shi, S.; Wang, H.; Liu, R.; Li, N.; Chen, Y.; Wang, S. Neutral monosaccharide composition analysis of plant-derived oligo- and polysaccharides by high performance liquid chromatography. Carbohydr. Polym. 2016, 136, 1273–1280. [Google Scholar] [CrossRef] [PubMed]
- Afshari, K.; Samavati, V.; Shahidi, S.-A. Ultrasonic-assisted extraction and in-vitro antioxidant activity of polysaccharide from Hibiscus leaf. Int. J. Biol. Macromol. 2015, 74, 558–567. [Google Scholar] [CrossRef] [PubMed]
- Courtois, J. Oligosaccharides from land plants and algae: Production and applications in therapeutics and biotechnology. Curr. Opin. Microbiol. 2009, 12, 261–273. [Google Scholar] [CrossRef] [PubMed]
- Pazourek, J. Monitoring of mutarotation of monosaccharides by hydrophilic interaction chromatography. J. Sep. Sci. 2010, 33, 974–981. [Google Scholar] [CrossRef]
- El Khadem, H. (Ed.) Carbohydrate Chemistry: Monosaccharides and Their Oligomers; Elsevier: Amsterdam, The Netherlands, 2012. [Google Scholar]
- Ikegami, T.; Horie, K.; Saad, N.; Hosoya, K.; Fiehn, O.; Tanaka, N. Highly efficient analysis of underivatized carbohydrates using monolithic-silica-based capillary hydrophilic interaction (HILIC) HPLC. Anal. Bioanal. Chem. 2008, 391, 2533–2542. [Google Scholar] [CrossRef]
- Li, S.P.; Wu, D.T.; Lv, G.P.; Zhao, J. Carbohydrates analysis in herbal glycomics. TrAC Trends Anal. Chem. 2013, 52, 155–169. [Google Scholar] [CrossRef]
- Dai, J.; Wu, Y.; Chen, S.-W.; Zhu, S.; Yin, H.-P.; Wang, M.; Tang, J. Sugar compositional determination of polysaccharides from Dunaliella salina by modified RP-HPLC method of precolumn derivatization with. Carbohydr. Polym. 2010, 82, 629–635. [Google Scholar] [CrossRef]
- Jandera, P.; Janás, P. Recent advances in stationary phases and understanding of retention in hydrophilic interaction chromatography. A review. Anal. Chim. Acta 2017, 967, 12–32. [Google Scholar] [CrossRef]
- Zhang, S.; Li, C.; Zhou, G.; Che, G.; You, J.; Suo, Y. Determination of the carbohydrates from Notopterygium forbesii Boiss by HPLC with fluorescence detection. Carbohydr. Polym. 2013, 97, 794–799. [Google Scholar] [CrossRef]
- Bean, S.R.; Ioerger, B.P.; Blackwell, D.L. Separation of kafirins on surface porous reversed-phase high-performance liquid chromatography columns. J. Agric. Food Chem. 2011, 59, 85–91. [Google Scholar] [CrossRef]
- Jandera, P. Stationary and mobile phases in hydrophilic interaction chromatography: A review. Anal. Chim. Acta 2011, 692, 1–25. [Google Scholar] [CrossRef] [PubMed]
- Martín-Ortiz, A.; Carrero-Carralero, C.; Hernández-Hernández, O.; Lebrón-Aguilar, R.; Moreno, F.; Sanz, M.; Ruiz-Matute, A. Advances in structure elucidation of low molecular weight carbohydrates by liquid chromatography-multiple-stage mass spectrometry analysis. J. Chromatogr. A 2019, 1612, 460664. [Google Scholar] [CrossRef] [PubMed]
- Montesano, D.; Cossignani, L.; Giua, L.; Urbani, E.; Simonetti, M.S.; Blasi, F. A Simple HPLC-ELSD Method for Sugar Analysis in Goji Berry. J. Chem. 2016, 2016, 1–5. [Google Scholar] [CrossRef] [Green Version]
- Soyseven, M.; Sezgin, B.; Arli, G. A novel, rapid and robust HPLC-ELSD method for simultaneous determination of fructose, glucose and sucrose in various food samples: Method development and validation. J. Food Compos. Anal. 2022, 107, 104400. [Google Scholar] [CrossRef]
- Fu, X.; Cebo, M.; Ikegami, T.; Lämmerhofer, M. Separation of carbohydrate isomers and anomers on poly-N-(1H-tetrazole-5-yl)-methacrylamide-bonded stationary phase by hydrophilic interaction chromatography as well as determination of anomer interconversion energy barriers. J. Chromatogr. A 2020, 1620, 460981. [Google Scholar] [CrossRef]
- Bennett, R.; Olesik, S.V. Gradient separation of oligosaccharides and suppressing anomeric mutarotation with enhanced-fluidity liquid hydrophilic interaction chromatography. Anal. Chim. Acta 2017, 960, 151–159. [Google Scholar] [CrossRef]
- Kouzounis, D.; Sun, P.; Bakx, E.J.; Schols, H.A.; Kabel, M.A. Strategy to identify reduced arabinoxylo-oligosaccharides by HILIC-MSn. Carbohydr. Polym. 2022, 289, 119415. [Google Scholar] [CrossRef]
- Moni, L.; Ciogli, A.; D’Acquarica, I.; Dondoni, A.; Gasparrini, F.; Marra, A. Synthesis of Sugar-Based Silica Gels by Copper-Catalysed Azide-Alkyne Cycloaddition via a Single-Step Azido-Activated Silica Intermediate and the Use of the Gels in Hydrophilic Interaction Chromatography. Chem.-A Eur. J. 2010, 16, 5712–5722. [Google Scholar] [CrossRef]
- Pazourek, J. Determination of glucosamine and monitoring of its mutarotation by hydrophilic interaction liquid chromatography with evaporative light scattering detector. Biomed. Chromatogr. 2018, 32, e4368. [Google Scholar] [CrossRef]
- Galant, A.L.; Kaufman, R.C.; Wilson, J.D. Glucose: Detection and analysis. Food Chem. 2015, 188, 149–160. [Google Scholar] [CrossRef]
- Lopes, E.; Gaspar, J.F. Simultaneous chromatographic separation of enantiomers, anomers and structural isomers of some biologically relevant monosaccharides. J. Chromatogr. A 2008, 1188, 34–42. [Google Scholar] [CrossRef] [PubMed]
- Gangola, M.P.; Jaiswal, S.; Khedikar, Y.P.; Chibbar, R.N. A reliable and rapid method for soluble sugars and RFO analysis in chickpea using HPAEC–PAD and its comparison with HPLC–RI. Food Chem. 2014, 154, 127–133. [Google Scholar] [CrossRef] [PubMed]
- Rohrer, J.S.; Basumallick, L.; Hurum, D. High-performance anion-exchange chromatography with pulsed amperometric detection for carbohydrate analysis of glycoproteins. Biochemistry 2013, 78, 697–709. [Google Scholar] [CrossRef] [PubMed]
- Ortner, F.; Wiemeyer, H.; Mazzotti, M. Interconversion and chromatographic separation of carbohydrate stereoisomers on polystyrene-divinylbenzene resins. J. Chromatogr. A 2017, 1517, 54–65. [Google Scholar] [CrossRef]
- Gasparrini, F.; D’Acquarica, I.; Pierini, M.; Villani, C.; Ismail, O.H.; Ciogli, A.; Cavazzini, A. Chapter 3—Chiral Separations. Chiral Dynamic Chromatography in the Study of Stereolabile Compounds; Elsevier: Amsterdam, The Netherlands, 2017. [Google Scholar] [CrossRef]
- Cabri, W.; Ciogli, A.; Dacquarica, I.; DiMattia, M.; Galletti, B.; Gasparrini, F.; Giorgi, F.; Lalli, S.; Pierini, M.; Simone, P. On-column epimerization of dihydroartemisinin: An effective analytical approach to overcome the shortcomings of the International Pharmacopoeia monograph. J. Chromatogr. B Anal. Technol. Biomed. Life Sci. 2008, 875, 180–191. [Google Scholar] [CrossRef] [PubMed]
- Trapp, O.; Schurig, V. ChromWin—A computer program for the determination of enantiomerization barriers in dynamic chromatography. Comput. Chem. 2001, 25, 187–195. [Google Scholar] [CrossRef]
- Trapp, O. A novel software tool for high throughput measurements of interconversion barriers: DCXplorer. J. Chromatogr. B Anal. Technol. Biomed. Life Sci. 2008, 875, 42–47. [Google Scholar] [CrossRef] [PubMed]
- Ciogli, A.; Buonsenso, F.; Proietti, N.; Mazzoccanti, G.; Manetto, S.; Calcaterra, A.; De Angelis, M.; Gasparrini, F. Preparation of a high-density vinyl silica gel to anchor cysteine via photo-click reaction and its applications in hydrophilic interaction chromatography. J. Chromatogr. A 2022, 1675, 463173. [Google Scholar] [CrossRef]
- Shen, A.; Guo, Z.; Yu, L.; Cao, L.; Liang, X. A novel zwitterionic HILIC stationary phase based on “thiol-ene” click chemistry between cysteine and vinyl silica. Chem. Commun. 2011, 47, 4550–4552. [Google Scholar] [CrossRef]
- Mojsiewicz-Pieńkowska, K. On the Issue of Characteristic Evaporative Light Scattering Detector Response. Crit. Rev. Anal. Chem. 2009, 39, 89–94. [Google Scholar] [CrossRef]
- Bubb, W.A. NMR spectroscopy in the study of carbohydrates: Characterizing the structural complexity. Concepts Magn. Reson. Part A Bridg. Educ. Res. 2003, 19, 1–19. [Google Scholar] [CrossRef]
- Lemieux, J.D.; Stevens, R.U. The Proton Magnetic Resonance Spectra and Tautomeric Equilibria of Aldoses in Deuterium Oxide. Can. J. Chem. 1966, 44, 249–262. [Google Scholar] [CrossRef]
- Angyal, S.J. The Composition of Reducing Sugars in Solution: Current Aspects. Adv. Carbohydr. Chem. Biochem. 1991, 49, 19–35. [Google Scholar] [CrossRef]
- Le Barc’H, N.; Grossel, J.M.; Looten, P.; Mathlouthi, M. Kinetic study of the mutarotation of D-glucose in concentrated aqueous solution by gas-liquid chromatography. Food Chem. 2001, 74, 119–124. [Google Scholar] [CrossRef]
- Kabayama, M.A.; Patterson, D. The thermodynamics of mutarotation of some sugars: II. Theoretical considerations. Can. J. Chem. 1958, 36, 563–573. [Google Scholar] [CrossRef]
- Hoog, C.; Widmalm, G. Free Energy Simulations of D-Xylose in Water and Methyl D-Xylopyranoside in Methanol Christer. J. Phys. Chem. B 2001, 105, 6375–6379. [Google Scholar] [CrossRef]
- Drew, K.N.; Zajicek, J.; Bondo, G.; Bose, B.; Serianni, A.S. 13C-labeled aldopentoses: Detection and quantitation of cyclic and acyclic forms by heteronuclear 1D and 2D NMR spectroscopy. Carbohydr. Res. 1998, 307, 199–209. [Google Scholar] [CrossRef]
- Lewis, B.E.; Choytun, N.; Schramm, V.L.; Bennet, A.J. Transition States for Glucopyranose Interconversion. J. Am. Chem. Soc. 2006, 128, 5049–5058. [Google Scholar] [CrossRef] [Green Version]


| Classification | Analyte | T (°C) | Ret. Time (min) | Mobile Phases |
|---|---|---|---|---|
| Monosaccharide | Fructose | 25 | 8.66 | ACN/H2O 80:20 |
| Ribose | 25 | 5.01 | ACN/H2O 80:20 | |
| Disaccharide | Sucrose | 25 | 3.62 | ACN/H2O 60:40 |
| Maltose | 25 | 4.00 | ACN/H2O 60:40 | |
| Lactose | 25 | 4.04 | ACN/H2O 60:40 | |
| Lactulose | 25 | 3.92 | ACN/H2O 60:40 | |
| Sugar Alcohol | Mannitol | 25 | 11.22 | ACN/H2O 80:20 |
| Inositol | 25 | 4.56 | ACN/H2O 60:40 |
| D-Glucose | ||||||||
|---|---|---|---|---|---|---|---|---|
| α→β | β→α | |||||||
| Column Temp. (K) | ΔG#α→β (kcal mol−1) | kvappα→β (min−1) | ΔG#β→α (kcal mol−1) | kvappβ→α (min−1) | ||||
| Auto-DHPLC-Y2K | DCXplorer | Auto-DHPLC-Y2K | DCXplorer | Auto-DHPLC-Y2K | DCXplorer | Auto-DHPLC-Y2K | DCXplorer | |
| 298.15 | 21.774 | 21.799 | 0.4080 × 10⁻¹ | 0.3816 × 10⁻¹ | 22.211 | 22.165 | 0.1951 × 10⁻¹ | 0.2058 × 10⁻¹ |
| 288.15 | 21.376 | 21.484 | 0.2373 × 10⁻¹ | 0.2282 × 10⁻¹ | 21.875 | 21.838 | 0.1164 × 10⁻¹ | 0.1322 × 10⁻¹ |
| 278.15 | 21.056 | 21.063 | 0.9931 × 10⁻² | 0.9534 × 10⁻² | 21.451 | 21.401 | 0.4862 × 10⁻² | 0.5148 × 10⁻² |
| D-Xylose | ||||||||
|---|---|---|---|---|---|---|---|---|
| α→β | β→α | |||||||
| Column Temp. (K) | ΔG#α→β (kcal mol−1) | kvappα→β (min−1) | ΔG#β→α (kcal mol−1) | kvappβ→α (min−1) | ||||
| Auto-DHPLC-Y2K | DCXplorer | Auto-DHPLC-Y2K | DCXplorer | Auto-DHPLC-Y2K | DCXplorer | Auto-DHPLC-Y2K | DCXplorer | |
| 298.15 | 21.213 | 21.360 | 0.1051 | 0.0801 × 10⁻¹ | 21.542 | 21.596 | 0.6030 × 10⁻¹ | 0.5367 × 10⁻¹ |
| 288.15 | 20.906 | 21.124 | 0.5179 × 10⁻¹ | 0.4243 × 10⁻¹ | 21.298 | 21.353 | 0.2985 × 10⁻¹ | 0.2739 × 10⁻¹ |
| 278.15 | 20.717 | 20.854 | 0.1830 × 10⁻¹ | 0.1398 × 10⁻¹ | 21.031 | 21.073 | 0.1038 × 10⁻¹ | 0.0936 × 10⁻¹ |
| D-Glucose | D-Xylose | |||||||
|---|---|---|---|---|---|---|---|---|
| α→β | β→α | α→β | β→α | |||||
| Auto DHPLC Y2K | DCXplorer | Auto DHPLC Y2K | DCXplorer | Auto DHPLC Y2K | DCXplorer | Auto DHPLC Y2K | DCXplorer | |
| ΔS# (e.u.) | −35.8 | −36.9 | −38.10 | −38.30 | −24.70 | −25.30 | −25.60 | −26.20 |
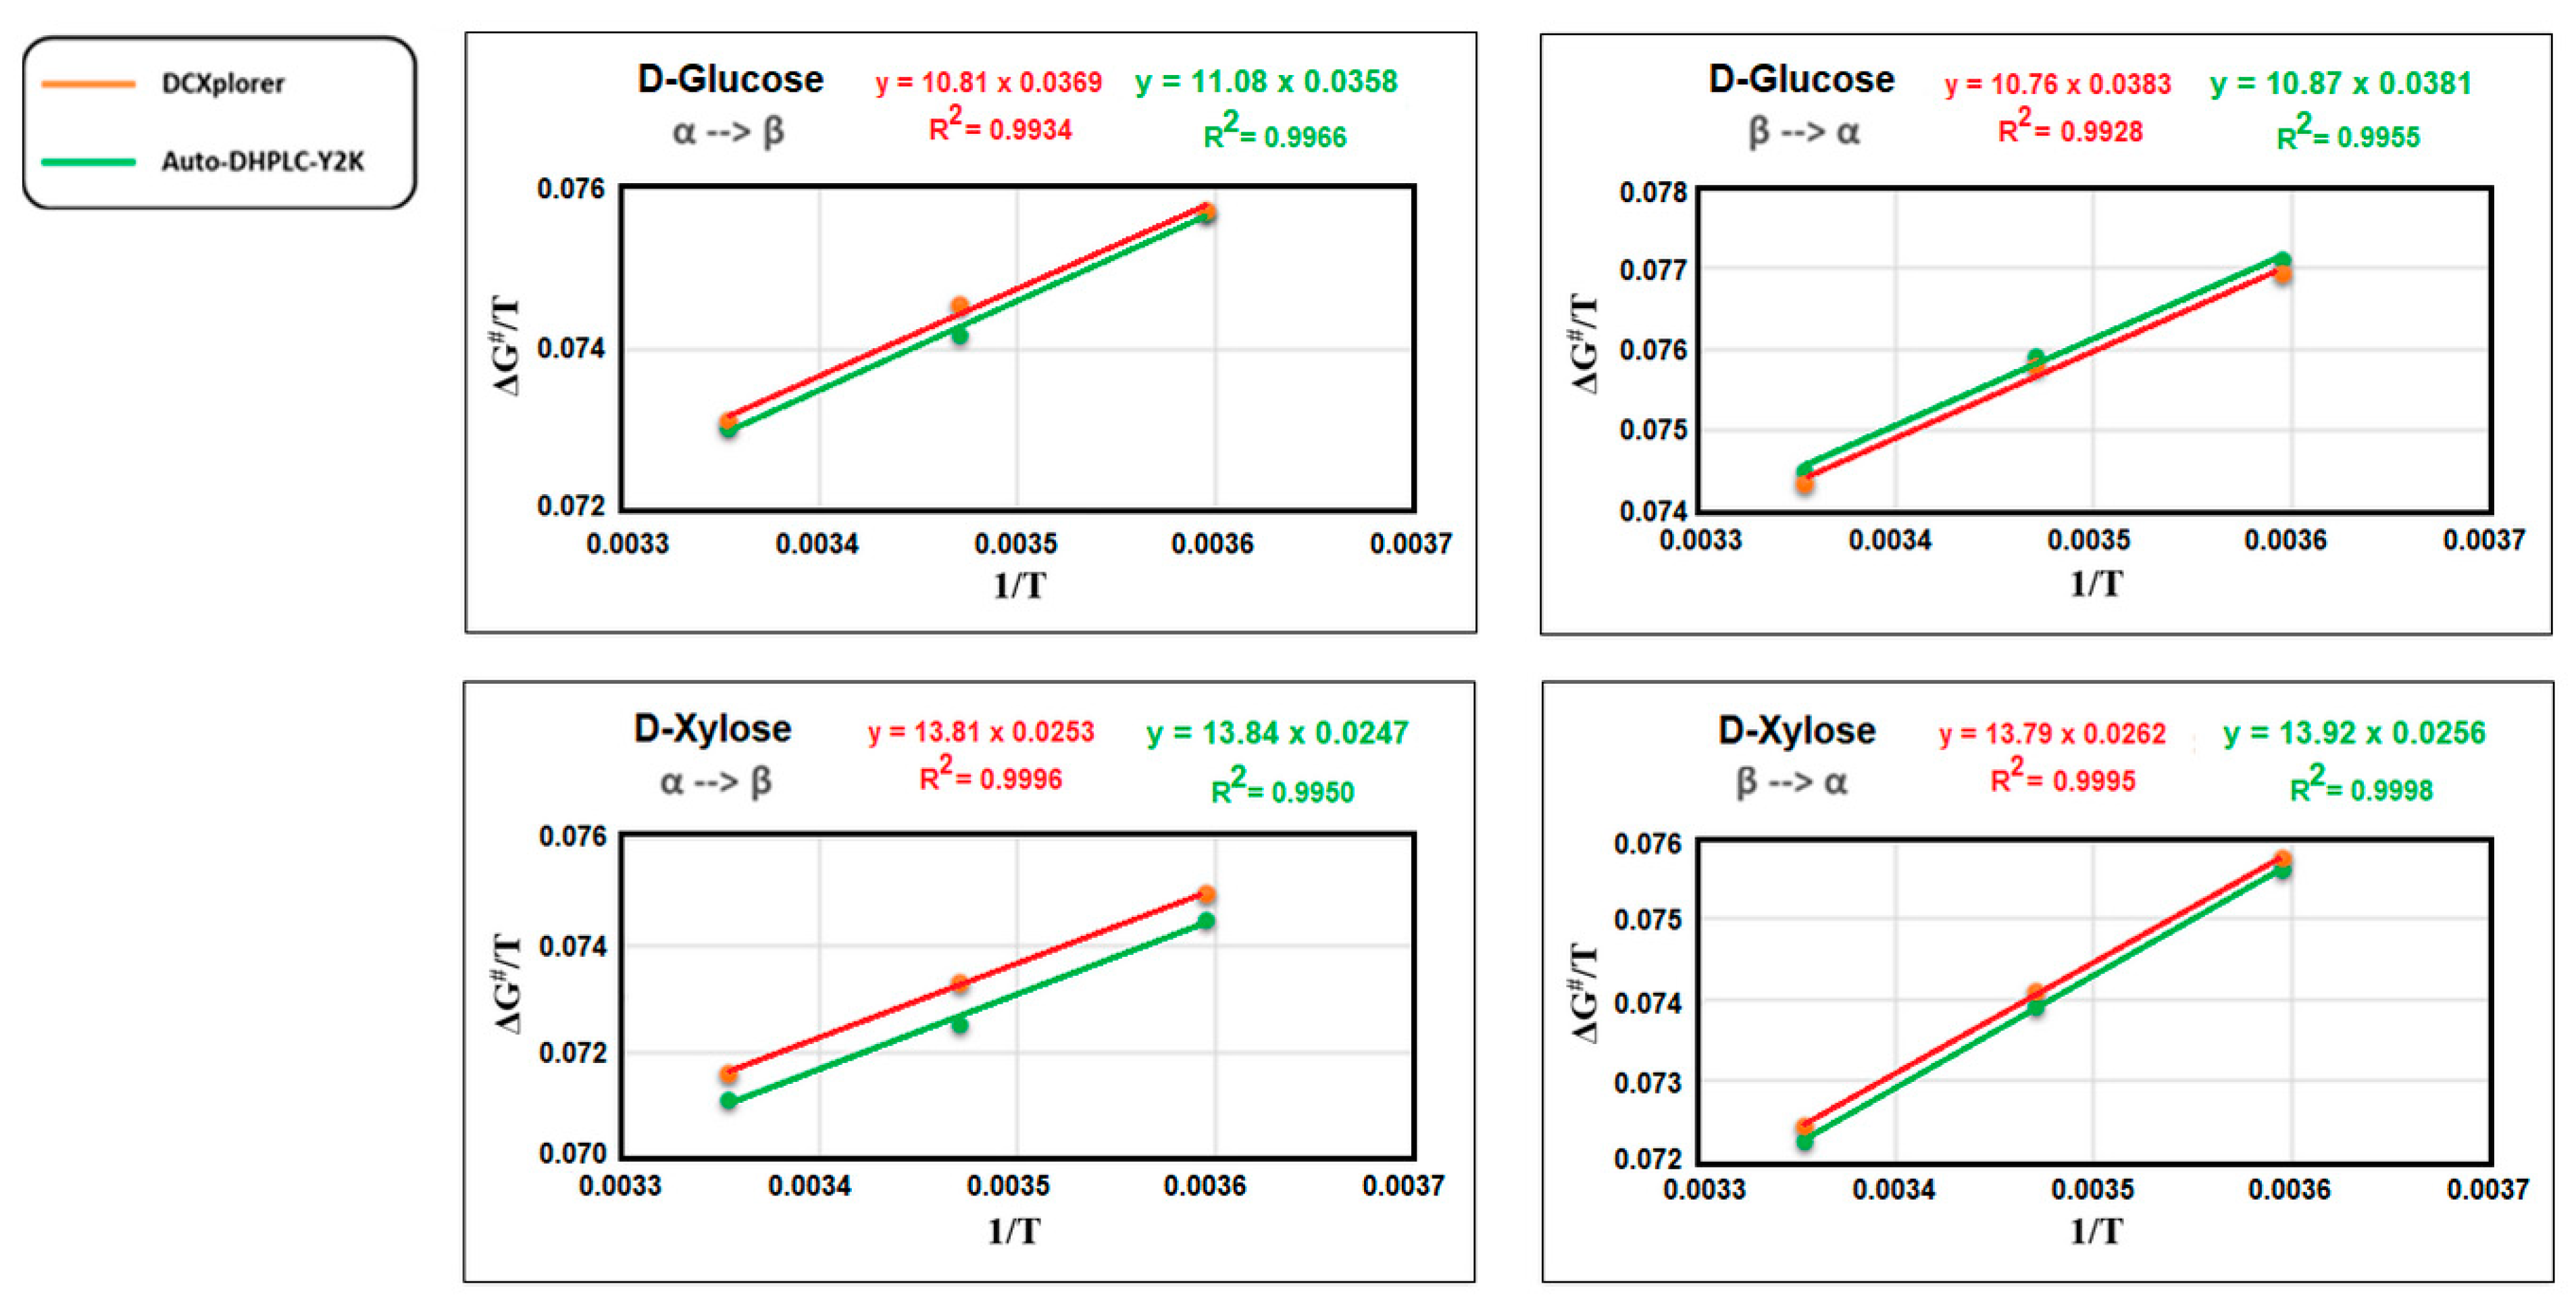
| ΔH# (kcal mol−1) | 11.08 | 10.81 | 10.87 | 10.76 | 13.84 | 13.81 | 13.92 | 13.79 |
Publisher’s Note: MDPI stays neutral with regard to jurisdictional claims in published maps and institutional affiliations. |
© 2022 by the authors. Licensee MDPI, Basel, Switzerland. This article is an open access article distributed under the terms and conditions of the Creative Commons Attribution (CC BY) license (https://creativecommons.org/licenses/by/4.0/).
Share and Cite
Calcaterra, A.; Manetto, S.; Buonsenso, F.; Francioso, A.; Pierini, M.; Villani, C. Separation of Monosaccharide Anomers on Photo-Click Cysteine-Based Stationary Phase: The α/β Interconversion Process Studied by Dynamic Hydrophilic Liquid Chromatography. Separations 2022, 9, 203. https://doi.org/10.3390/separations9080203
Calcaterra A, Manetto S, Buonsenso F, Francioso A, Pierini M, Villani C. Separation of Monosaccharide Anomers on Photo-Click Cysteine-Based Stationary Phase: The α/β Interconversion Process Studied by Dynamic Hydrophilic Liquid Chromatography. Separations. 2022; 9(8):203. https://doi.org/10.3390/separations9080203
Chicago/Turabian StyleCalcaterra, Andrea, Simone Manetto, Fabio Buonsenso, Antonio Francioso, Marco Pierini, and Claudio Villani. 2022. "Separation of Monosaccharide Anomers on Photo-Click Cysteine-Based Stationary Phase: The α/β Interconversion Process Studied by Dynamic Hydrophilic Liquid Chromatography" Separations 9, no. 8: 203. https://doi.org/10.3390/separations9080203