Article

Two New HPLC Methods, Assessed by GAPI, for Simultaneous Determination of Four Antipsychotics in Pharmaceutical Formulations: A Comparative Study

1
Department of Pharmaceutical Analytical Chemistry, Faculty of Pharmacy, Port Said University, Port Fouad 42526, Egypt
2
Department of Pharmaceutical Analytical Chemistry, Faculty of Pharmacy, Suez Canal University, Ismailia 41522, Egypt
3
Department of Pharmacology and Toxicology, Faculty of Pharmacy, Suez Canal University, Ismailia 41522, Egypt
4
Department of Pharmacology and Toxicology, Faculty of Pharmacy, University of Tabuk, Tabuk 71491, Saudi Arabia
5
Department of Chemistry, Faculty of Science, Suez Canal University, Ismailia 41522, Egypt
*
Author to whom correspondence should be addressed.
Separations 2022, 9(8), 220; https://doi.org/10.3390/separations9080220
Submission received: 26 July 2022 / Revised: 5 August 2022 / Accepted: 12 August 2022 / Published: 15 August 2022
(This article belongs to the Special Issue Application of Chromatography in Analytical Chemistry)

Abstract

:
Antipsychotics are widely used to treat various mental disorders. Combination therapies were approved by the FDA to treat manic states. Quetiapine fumarate, aripiprazole, asenapine maleate, and chlorpromazine HCl are frequently used for treatment of these disorders. Green analytical chemistry is primarily concerned with reducing waste generated during sample preparation or analysis. Green solvents, such as ethanol, are being used in HPLC as an alternative to acetonitrile. To this purpose, two new chromatographic methods were developed to determine these four drugs simultaneously in their bulk and pharmaceutical formulations. The greenness of both methods was assessed by the green analytical procedure index (GAPI)—one of them was found to be green ecofriendly, and the other had some environmental hazards (conventional)—and this helps laboratories to choose a method that suits their capabilities. The chromatographic separation for both methods was carried out on a Thermo® C18 column. The total separation times were about 11 min and 9 min for the green and the conventional methods, respectively. Using the Student’s t-test and the F-ratio, there was no significant difference between the results of the two methods. These methods have been validated and successfully applied to the analysis of commercial pharmaceutical formulations. Our study could successfully be used in central quality control laboratories, which need a single analytical method to separate more than one compound with similar pharmacological action.

Graphical Abstract

1. Introduction

For different psychiatric illnesses, antipsychotics are commonly used to find a cure. For schizophrenia, hallucinations, mania, sleep disturbances, dementia, and bipolar disorders, these medications are most commonly administered. It is difficult to find the appropriate treatment in such pathologies, and a large percentage of psychiatric patients who are given antipsychotics require more than one antipsychotic drug at the same time. The Food and Drug Administration of the United States approved combination therapies to treat acute manic states, including the use of quetiapine and aripiprazole as second-generation antipsychotics in combination with lithium to treat acute bipolar depression [1,2]. For that, it is essential to have fast and ecofriendly assays to determine multiple antipsychotic drugs and to screen these drugs in laboratories routinely. The drugs chosen are among the most commonly prescribed antipsychotics for the treatment of schizophrenia and bipolar disorders; consequently, they are widely produced by factories [3,4]. Therefore, it is really meaningful for pharmaceutical factories and central quality control laboratories to have methods to determine these drugs simultaneously, and these methods could also be used to detect counterfeiting. Quetiapine fumarate (QU) is an atypical antipsychotic of the second generation that is used to treat schizophrenia, bipolar disorder, and major depression [5]. During long-term therapy, QU shows a high degree of clinical effectiveness and a low risk of adverse effects. It is well-tolerated and an effective option for certain patients who have a high sensitivity to medications such as clozapine and olanzapine [6].
Many analytical methods have been proposed to analyze QU found in bulk form, as well as in various pharmaceutical dosage forms and biological fluids, using HPLC [7,8,9]. QU was separated from its degradation products using acetonitrile and dipotassium hydrogen phosphate as a mobile phase, which had a long run time of 53.9 min [7]; QU was eluted in 5 min using an internal standard (lamotrigine) and a mixture of acetonitrile and 0.1% orthophosphoric acid as a mobile phase [8]; and QU was also analyzed in plasma using a complicated mobile phase consisting of acetonitrile, methanol, and 0.025 M phosphate buffer (containing triethylamine)), and the method suffered from a narrow linearity range [9]. Meanwhile, aripiprazole (AR) is recommended to treat bipolar disorder associated with manic and mixed episodes, schizophrenia, and as an adjunctive treatment for major depressive disorder [5]. AR has been analyzed in pure form and different pharmaceutical formulations by HPLC [10,11,12,13,14]. AR was separated from its impurities using a methanol-based mobile phase: water:orthophosphoric acid [10]; AR was also eluted using a mixture of acetonitrile and triethanolamine buffer at 3.8 min but with poor sensitivity [11]; AR was separated from its impurities at 28.2.min using acetonitrile and phosphate buffer [12]; AR was separated at 8 min from its degradation products using a mixture of acetonitrile and 0.2% trifluoroacetic acid [13]; and AR was analyzed using a complicated mobile phase (acetonitrile-methanol-20 mM sodium sulfate-acetic acid) [14]. Asenapine maleate (AS) is an atypical antipsychotic used to treat schizophrenia and acute mania associated with bipolar disorder. It is also used to treat nightmares caused by severe post-traumatic stress disorder [15]. AS found in various pharmaceutical formulations has been determined by using HPLC [16,17,18,19]. AS was separated from its degradation products using potassium dihydrogen phosphate and acetonitrile as mobile phase [16]; AS was also separated with poor sensitivity using acetonitrile and 0.05 M potassium dihydrogen phosphate [18]; and an ion pair LC method was used to analyze AS in dosage forms with a mobile phase consisting of acetonitrile and 10 mM 1-heptane sulfonic acid [19]. Chlorpromazine hydrochloride (CH) is also used to treat schizophrenia. Moreover, it is used to decrease nausea and vomiting, alleviate preoperative restlessness and anxiety, treat acute recurrent porphyria, and to control the symptoms of the psychotic form of manic-depressive disorder [5]. CH found in various pharmaceutical preparations has been determined and quantified using HPLC [20,21,22,23]. A mobile phase composed of acetonitrile:deionized water was used to separate CH from carvedilol but with poor sensitivity [20]; CH was separated from trihexyphenidyl hydrochloride using a complicated mobile phase (methanol:acetonitrile:water:triethylamine) and poor sensitivity [21]; CH was also analyzed in plasma using sodium acetate buffer and acetonitrile [23]. From those reported methods, it was clear that all of them have used acetonitrile in the mobile phase composition, and some of these methods suffered from poor sensitivity or long elution time. Moreover, by reviewing the literature, the selected antipsychotics were determined with a combination of other drugs in dosage forms by LC [24,25,26], but the simultaneous HPLC determination of these four selected drugs was not reported.
HPLC is considered a traditional analytical separation process used for qualitative and quantitative purposes, but sadly, most of these conventional methods either ingest or make hazardous organic solvents. These organic solvents may become health hazards, being an irritant or toxic and/or environmental hazards resulting in more pollution and more waste generation [27]. Therefore, by eliminating unwanted hazardous compounds used or created by a certain method, it becomes safer for nature. The greening of RP-HPLC methods has gained the analytical community’s interest, who are looking for novel solutions to substitute polluted analytical methods. Green analytical chemistry (GAC) evolved from green chemistry in the 2000s and stimulated the interest of researchers [27,28,29]. Its theory can be summarized as removing dangerous chemicals from the methods of analysis to enhance health and environmental familiarity while maintaining the performance of the method. Some strategies are widely applied to make greener liquid chromatography methods, regarding the 12 principles of green chemistry, by decreasing solvent use, reducing the column’s inner diameter, length, and/or column particle size, and replacing poisonous solvents, such as acetonitrile and methanol, with more friendly ones [30].
This study aims to develop two LC methods to identify and quantify simultaneously these antipsychotics in pharmaceutical formulations and compare the two methods with each other regarding accuracy and precision. Both of these methods were assessed by the GAPI tool: one was found to be green, and the other had some environmental hazards (conventional), and that could help pharmaceutical factories save time and effort by choosing a method that suits their capabilities and laboratory reagents. Both HPLC methods were optimized separately, and they acquired good precision, accuracy, reproducibility, and low limits of detection and quantification. Both methods could be used in central quality control laboratories in which a single analytical method analyzes more than one compound to save time and effort.

2. Experimental

2.1. Instrumentation

An Agilent 1220 Infinity LC system (G4294B configuration; Agilent Technologies, Santa Clara, CA, USA), which consisted of a dual solvent deliver system, an auto sampler, and a diode array detector (DAD), was used.

2.2. Chemicals and Reagents

Utopia Pharmaceuticals, Cairo, Egypt, kindly supplied AR and QU pharmaceutical grades, which were certified to have 99.9% and 99.8%, respectively. Meanwhile, we brought CH and AS from Sigma-Aldrich (St. Louis, MO, USA), which were certified to have 98% and 99.5%, respectively. Ethanol, methanol, and acetonitrile for HPLC were from Sigma-Aldrich. Sodium dihydrogen orthophosphate dihydrate, phosphoric acid, and sodium hydroxide used were analytical grade.

2.3. Pharmaceutical Samples

Asenapine® tablets were used (batch no. 042) (Egyptian Group for Pharmaceutical Industries E.G.P.I., El Obour City, Egypt) and were labeled as having 10 mg of asenapine maleate. Aripiprazole® tablets were used (batch no. 121129) (Multi Apex Pharmaceutical Company, Badr City, Egypt) and were labeled as having 10 mg of aripiprazole. Neurazine® tablets were used (batch no. 147070) (Misr Co. for the Pharmaceutical Industry, El Obour City, Egypt) and were labeled as having 100 mg of chlorpromazine hydrochloride. Quitapex® tablets were used (batch no. AT07130820) (Inspire Pharma, Cairo, Egypt) and were labeled as having 25 mg of quetiapine fumarate.

2.4. Chromatographic Conditions

2.4.1. Ecofriendly Green Method

The HPLC separation was achieved on Thermo C18 column (4.6 mm × 250 mm, 5 µm). The mobile phase was made through mixing ethanol and 20 mM sodium dihydrogen phosphate dihydrate (pH was adjusted to 5.0 by NaOH) in ratio of 35:65 v/v. The mobile phase flow rate was 1 mL min−1. The detector was set at 230 nm, and the injection volume was 20 μL. All determinations were carried out at 25 °C.

2.4.2. Conventional Method

The HPLC separation was achieved on Thermo C18 column (4.6 mm × 250 mm, 5 µm). The mobile phase was made through mixing acetonitrile (ACN) and 20 mM sodium dihydrogen phosphate dihydrate, pH was kept at 3.0 using 1 M phosphoric acid, and the gradient elution program was 0–5 min 40% ACN, 5–10 min 60% ACN. After 10 min, the gradient was back to the initial condition, and the column was then reconditioned for 5 min. The mobile phase flow rate was 1 mL min−1. The detector was set at 240 nm, and the injection volume was 20 μL. All determinations were carried out at 25 °C.

2.5. Standard Solutions

The analytes’ stock solutions were made separately by dissolving QU, AR, and CH in ethanol and AS in methanol to achieve concentration of 0.2 mg mL−1 for each compound, and they were stored at 4 °C for further preparation of the working solutions. The working solutions were made by further diluting the standard stock solutions with ethanol for the green method or acetonitrile for the conventional method to achieve 0.1–20 µg mL−1 concentration range of for each drug separately.

2.6. Sample Preparation

For preparing the samples, 20 tablets of each brand of product were separately weighed and powdered. A certain amount of the powder, equivalent to 20 mg for each drug, was accurately weighed and then placed in 100 mL volumetric flask and dissolved in ethanol for each drug except AS, which was dissolved in methanol. The dissolution was confirmed using the ultrasonic bath for 20 min and then cooled to room temperature. The solution was then diluted to volume with the same solvent and then filtered through 0.45 μm membrane filters. We rejected the first amount of the filtrate, and the remainder was used as a stock sample solution. Further dilution was made with ethanol for green method or acetonitrile for conventional method to achieve a 0.1–20 µg mL−1 concentration range for each drug. The techniques of both methods previously defined were made to analyze these samples, and the concentrations of the drugs found were determined.

3. Results and Discussion

3.1. Method Optimization

This study intended to establish precise, sensitive, and time-saving LC methods for the simultaneous quantification of antipsychotic drugs in their bulk form and pharmaceutical formulations. The parameters of the methods that affect the peak areas and the separation of the four drugs were examined. For wavelength selection, the DAD response was studied in the range of 210 nm to 250 nm based on the compounds’ UV spectra. The wavelengths 230 nm and 240 nm were chosen for the green method and the conventional method, respectively, as they permit good detection with reasonable sensitivity for the studied drugs. To improve the chromatographic methods’ performance, many alterations in the mobile phase composition were studied. Different concentrations of the buffer (10 mM, 20 mM, and 50 mM) were tested for both methods. It was observed that upon increasing the concentration of the buffer, the elution time extends, and AR and CH peak areas decrease. In addition, using a high buffer concentration of the solution may lead to serious damage to the column. On the other hand, using a buffer in a concentration below 20 mM resulted in a serious decrease in AS peak area. A 20 mM buffer was the most appropriate concentration. The pH values of the buffer used have a critical role in separating the studied drugs, so the pH value must be optimized to reach to peak sharpness and efficient separation. For that, in order to optimize the pH of the buffer solution used, the 20 mM phosphate buffer was examined with altered pH values. For the green method and the conventional method, pH 5.0 and pH 3.0, respectively, were found to be the most suitable pH values leading to well-resolved peaks and the highest plate count. For the green method, a different percentage of the mobile phase composition was studied. Increasing ethanol percentage to greater than 35% resulted in broad peaks of AS and AR at 45–55% ethanol and co-elution of the selected drugs at 65% ethanol. Therefore, satisfactory separation of the four compounds within 11 min was obtained by simply mixing ethanol −20 mM sodium dihydrogen phosphate dihydrate in a ratio of 35:65, v/v, the pH adjusted to 5.0 and the flow rate being 1 mL min−1. For the conventional method, gradient elution is recommended where the analysis time decreased, and the quality of the separation is improved. An acetonitrile concentration increase greater than 40% after the first 5 min led to inadequate separation of QU and AS peaks, while an acetonitrile concentration decrease (<40%) after the first 5 min resulted in separation, but extreme tailing for AR and CH was observed. Satisfactory separation of the four compounds within 9 min was obtained using acetonitrile (can) and 20 mM sodium dihydrogen phosphate dihydrate, pH was adjusted to 3.0, and a gradient elution program was followed: 0–5 min 40% ACN, 5–10 min 60% ACN. After 10 min, the gradient was back to the first condition, and after that, the column was reconditioned for 5 min, and the mobile phase flow rate was 1 mL min−1.
The chromatograms of both methods are demonstrated in Figure 1. In this figure, the complete separation of the studied drugs was remarked with sharp peaks and clear baseline separation. Table 1 mentions the system suitability results.

3.2. The Validation of the Methods

International Conference on Harmonisation (ICH) Q2R1 Guidelines [31] were followed for validation of the proposed methods with regard to linearity, selectivity, the limit of detection (LOD), limit of quantification (LOQ), and precision and accuracy.

3.2.1. Linearity

The linearities of both methods for the determination of QU, AS, AR, and CH were assessed through analyzing a series of different concentrations of each drug. Seven concentrations were selected for both methods, ranging from 0.1–20 µg mL−1 for the studied drugs, and each concentration was repeated three times in order to know the variation in peak area values between samples of the same concentration. Calibration graphs’ linearity were confirmed by the correlation coefficient high values (0.9999 or 0.9998 for all compounds), and the standard calibration curves are shown in Figures S1 and S2. The regression equations’ parameters of both methods were obtained by least-squares treatment of the results and are presented in Table 2.
Upon AMC (analytical methods committee), the lack of fit test has to be checked [32] (Table S1). It assesses the variance of the residual values [33]. It was found that the F-ratio calculated ranged from 1.35 to 2.99, which was lower than the tabulated one (3.57) at α = 0.05, and that confirmed linearity.

3.2.2. Precision

To evaluate the precision assessments, repeatability and intermediate precision were checked by using three concentration levels of each drug. One-way ANOVA evaluated the data for each concentration level. A design of 8 days × 2 replicates was constructed (Table S2). The p-value of the F-test was used to compare the results statistically. Three univariate analyses of variance for each concentration level were constructed. The p-values of the F-test ranged from 0.14 to 0.99 for the two proposed HPLC methods, and they were all greater than 0.05. Moreover, no significant difference between the mean results obtained from one level of day to another at the 95% confidence level was found.

3.2.3. Range

By considering the practical range necessary for each compound concentration present in the pharmaceutical product, the calibration ranges were constructed to achieve linear and accurate results. The linearity range for all of the selected drugs was 0.1–20 µg mL−1 for the two proposed HPLC methods.

3.2.4. Detection and Quantitation Limits

Detection and quantitation limits were calculated based on standard deviation of the response and the slope of the calibration curve. According to the formulas, LOD equals 3.3 × σ/S, where S is the slope of the calibration curve, σ is the standard deviation of the response, and LOQ equals 10 × σ/S. The detection limits ranged from 0.02 to 0.03 µg mL−1 and 0.03 to 0.04 µg mL−1 for the green and conventional methods, respectively. The values are shown in Table 2.

3.2.5. Selectivity

Through making eight mixtures of the studied drugs at different concentrations within the linearity range (0.1–20 µg mL−1), the selectivity of both methods was carried out. These mixtures were analyzed by following the previous procedures represented under the proposed methods. The recoveries were acceptable, ranging from 99.03% to 100.29% (Table S3) and declaring the high selectivity of both methods to determine the studied analytes.

3.2.6. Accuracy

Commercial pharmaceutical formulations containing these antipsychotics were exposed to the standard addition method. Each compound, mean percentage recovery, and its standard deviations was determined for six replicates using the two proposed methods (Table S4). The mean percentage recoveries ranged from 98.90% to 101.00%. From the results calculated, good accuracy was achieved.

3.2.7. Stability

The stabilities of QU, AS, AR, and CH were tested in pure solutions by only leaving their standard solutions in volumetric flasks, which are tightly capped, on both a laboratory bench at room temperature at 25 °C and in the refrigerator at 4 °C. The stock solutions of QU, AS, AR, and CH showed no changes in the peak area values when kept at room temperature for 18 h and for 7 days in the refrigerator at 4 °C.

3.2.8. Analysis of Pharmaceutical Formulations

QU, AS, AR, and CH were analyzed using the proposed methods in Quitapex®, Asenapine®, Aripiprazole®, and Neurazine® tablets, respectively. The determinations were prepared for seven replicates. For each compound, acceptable results were achieved in good agreement with label statements (Table 3). The typical chromatograms for the studied compounds in tablets using the two methods are shown in Figures S3 and S4. No methods were reported previously for the simultaneous determination of the studied compounds using HPLC. For that, the proposed green HPLC method results were compared with those of the conventional proposed method. Comparison between the results was performed statistically regarding accuracy and precision using Student’s t-test and F-ratio at a 95% confidence level (Table 3), and no significant difference was observed. Additionally, a figures of merit comparison between the green HPLC method and the previously reported HPLC methods for the single estimation of the studied compounds was prepared for Table S5, in which our method achieved acceptable limits of detection, wide linearity range, and it was the first to determine these drugs simultaneously.

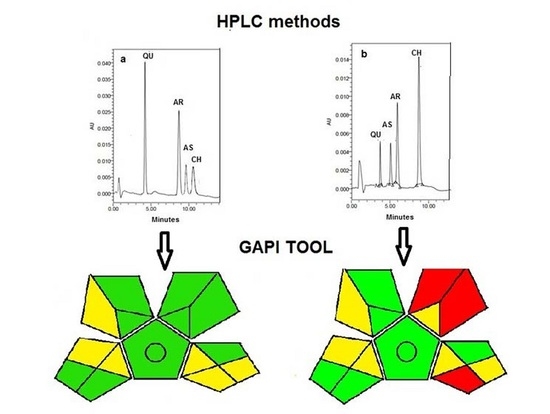
3.3. Evaluation of the Greenness of the Proposed Analytical Methods

For greenness, several tools are now available to evaluate different analytical methods. The new GAPI index [34] has the advantage of covering the whole analytical procedure when compared to the analytical eco-scale [29]. Five pentagrams are present; each one represents a step of the analytical methodology including sample collection, sample preparation, reagents and solvents used in instrumentation, and the purpose of the analytical method. GAPI has three color codes, where red color represents a high danger to the environment, while yellow and green symbolize represent lower danger and better greenness. The HPLC methods proposed were compared to four other previously reported analytical methods [9,14,17,23]. Figure 2 shows the GAPI index evaluating the proposed methods and four reported analytical methods for the analysis of the four studied drugs. the four previously published methods used acetonitrile as an organic solvent. In addition to that, each of these methods can determine only one drug of the studied drugs, while our two methods can determine the four studied drugs simultaneously. As shown from (Figure 2a), the proposed green HPLC method has nine green and six yellow pentagrams, and no red-colored pentagrams appear in its GAPI index. Meanwhile, the conventional HPLC proposed method (Figure 2b) has six green and six yellow pentagrams and three red pentagrams. Meanwhile, the reported methods (Figure 2c–f) have eight, five, four, and five red-colored pentagrams, respectively. From the GAPI pentagrams, the proposed green method is a green, eco-friendly method since it depended on a greener solvent that resulted in diminished waste production.

4. Conclusions

Our present study actually represents the first comparative study between two newly developed HPLC methods for the separation and determination of the four antipsychotic drugs (quetiapine fumarate, aripiprazole, asenapine maleate, and chlorpromazine HCl) in their bulk and pharmaceutical formulations. One method is green ecofriendly, and the other is conventional, which aids pharmaceutical laboratories to save time and effort by allowing them to choose either of these methods that suits their capabilities and laboratory reagents. It was observed that there was no significant difference between the results of the two proposed methods using Student’s t-test and F-ratio. Analytical methods’ conditions and the mobile phase solvents provided good resolution for the antipsychotic drugs. The developed methods could simultaneously determine them with a wide range of linearity, accuracy, and reasonable retention time, while the green method is more preferable because it is less harmful to the environment. The methods were validated under the ICH guidelines. Moreover, they can be easily applied for routine analysis in central quality control laboratories.

Supplementary Materials

The following supporting information can be downloaded at: https://www.mdpi.com/article/10.3390/separations9080220/s1, Figure S1: The standard calibration curves for the selected antipsychotics using the green proposed method; Figure S2: The standard calibration curves for the selected antipsychotics using the conventional proposed method; Figure S3: Typical HPLC chromatogram of 20 μL injection of (a) quitapex® tablets sample containing 1 µg mL−1 of QU, (b) aripiprazole® tablets sample containing 5 µg mL−1 of AR, (c) Asenapine® tablets sample containing 5 µg mL−1 of AS, and (d) Neurazine® tablets sample containing 5 µg mL−1 of CH using the green HPLC method; Figure S4: Typical HPLC chromatogram of 20 μL injection of (a) quitapex® tablets sample containing 1 µg mL−1 of QU, (b) Asenapine® tablets sample containing 1 µg mL−1 of AS, (c) aripiprazole® tablets sample containing 5 µg mL−1 of AR, and (d) Neurazine® tablets sample containing 10 µg mL−1 of CH using the conventional HPLC method; Table S1: ANOVA (showing lack of fit calculation) for mixture using the proposed conventional and green HPLC methods; Table S2: Analysis of variance for repeatability and intermediate precision of the studied drugs by the proposed green and conventional HPLC methods; Table S3: The mean percentage recoveries and standard deviation for determination of QU, AR, AS, and CH in laboratory-prepared mixtures using the proposed green and conventional HPLC methods; Table S4: Application of standard addition technique to the analysis of QU, AR, AS, and CH using the proposed green and conventional HPLC methods; Table S5: A comparison of figures of merit between proposed green HPLC and the previously reported HPLC methods for the single determination of the selected drugs.

Author Contributions

Conceptualization, A.E.G. and E.A.A.H.; methodology, A.E.G., E.A.A.H. and G.M.K.; software, R.E.S. and Z.A.A.E.-N.; validation, E.A.A.H., A.E.G. and R.E.S.; formal analysis, Z.A.A.E.-N., G.M.K. and E.A.A.H.; investigation, G.M.K., Z.A.A.E.-N. and R.E.S.; resources, S.A.Z., Z.A.A.E.-N. and R.A.; data curation, R.E.S., S.A.Z. and R.A.; writing—original draft preparation, E.A.A.H., Z.A.A.E.-N. and G.M.K.; writing—review and editing, S.A.Z. and R.A.; visualization, R.A. and S.A.Z.; supervision, A.E.G., E.A.A.H. and G.M.K. All authors have read and agreed to the published version of the manuscript.

Funding

The research received no external funding.

Institutional Review Board Statement

Not applicable.

Informed Consent Statement

Not applicable.

Data Availability Statement

All data are available from the corresponding author upon request.

Conflicts of Interest

The authors declare no conflict of interest.

References

  1. Ketter, T.A. Monotherapy versus combined treatment with second-generation antipsychotics in bipolar disorder. J. Clin. Psychiatry 2008, 69, 9–15. [Google Scholar] [CrossRef] [PubMed]
  2. Cipriani, A. Comparative efficacy and acceptability of antimanic drugs in acute mania: A multiple-treatments meta-analysis. Lancet 2011, 378, 1306–1315. [Google Scholar] [CrossRef]
  3. Roberts, R.; Neasham, A.; Lambrinudi, C. A quantitative analysis of antipsychotic prescribing trends for the treatment of schizophrenia in England and Wales. JRSM Open 2018, 9, 2054270418758570. [Google Scholar] [CrossRef] [PubMed]
  4. Bjornestad, J.; Lavik, K.O.; Davidson, L.; Hjeltnes, A. Antipsychotic treatment—A systematic literature review and meta-analysis of qualitative studies. J. Ment. Health 2020, 29, 513–523. [Google Scholar] [CrossRef] [PubMed]
  5. Wishart, D.S. DrugBank 5.0: A major update to the DrugBank database for 2018. Nucleic Acids Res. 2018, 46, D1074–D1082. [Google Scholar] [CrossRef] [PubMed]
  6. Dev, V.; Raniwalla, J. Quetiapine: A review of its safety in the management of schizophrenia. Drug Saf. 2000, 23, 295–307. [Google Scholar] [CrossRef] [PubMed]
  7. Kumar, N.; Sangeetha, D.; Goyal, R.; Reddy, P. A validated stability-indicating RP-LC method for the estimation of process-related impurities and degradation products of quetiapine fumarate in solid oral dosage form. Acta Chromatogr. 2013, 25, 393–409. [Google Scholar] [CrossRef]
  8. Venkata, K.B.; Battula, S.R.; Dubey, S. Validation of quetiapine fumarate in pharmaceutical dosage by reverse-phase HPLC with internal standard method. J. Chem. 2013, 2013, 578537. [Google Scholar] [CrossRef]
  9. Youssef, R.M.; Abdine, H.H.; Barary, M.A.; Wagih, M.M. Selective RP-HPLC method for determination of quetiapine in presence of coadministered drugs: Application for long-term stability study of quetiapine in whole blood. Acta Chromatogr. 2016, 28, 263–279. [Google Scholar] [CrossRef]
  10. Soponar, F.; Sandru, M.; David, V. Quantitative evaluation of Aripiprazole and its five related chemical impurities from pharmaceuticals using a HPLC-DAD method. Rev. Roum. Chim. 2014, 59, 1037–1046. [Google Scholar]
  11. Kalaichelvi, R.; Thangabalan, B.; Srinivasa Rao, D. Validated RP-HPLC method for analysis of Aripiprazole in a formulation. E-J. Chem. 2010, 7, 827–832. [Google Scholar] [CrossRef]
  12. Djordjević Filijović, N.; Pavlović, A.; Nikolić, K.; Agbaba, D. Validation of an HPLC method for determination of Aripiprazole and its impurities in pharmaceuticals. Acta Chromatogr. 2014, 26, 13–28. [Google Scholar] [CrossRef]
  13. Srinivas, K.S.V.; Buchireddy, R.; Madhusudhan, G. Stress degradation studies on Aripiprazole and development of a validated stability indicating LC method. Chromatographia 2008, 68, 635–640. [Google Scholar] [CrossRef]
  14. Shimokawa, Y. High performance liquid chromatographic methods for the determination of aripiprazole with ultraviolet detection in rat plasma and brain: Application to the pharmacokinetic study. J. Chromatogr. B 2005, 821, 8–14. [Google Scholar] [CrossRef] [PubMed]
  15. Shahid, M.; Walker, G.B.; Zorn, S.H. Asenapine: A novel psychopharmacologic agent with a unique human receptor signature. J. Psychopharmacol. 2009, 23, 65–73. [Google Scholar] [CrossRef]
  16. Chhalotiya, U.K.; Bhatt, K.K.; Shah, D.A.; Patel, J.R. Stability-indicating liquid chromatographic method for the quantification of the new antipsychotic agent Asenapine in bulk and in pharmaceutical formulation. Sci. Pharm. 2012, 80, 407–417. [Google Scholar] [CrossRef]
  17. Managuli, R.S. Development and validation of a stability-indicating RP-HPLC method by a statistical optimization process for the quantification of asenapine maleate in lipidic nanoformulations. J. Chromatogr. Sci. 2016, 54, 1290–1300. [Google Scholar] [CrossRef]
  18. Govindarajan, N.R.; Koulagari, S.; Methuku, A.; Podhuturi, S. Method development and validation of RP-HPLC method for determination of new antipsychotic agent Asenapine maleate in bulk and pharmaceutical formulation. Eur. J. Anal. Chem. 2014, 9, 58–65. [Google Scholar]
  19. Karaca, S.A.; Uǧur, D.Y. A stability indicating ion-pair lc method for the determination of Asenapine in pharmaceuticals. J. Chil. Chem. Soc. 2017, 62, 3325–3329. [Google Scholar] [CrossRef]
  20. Fadhel, S.R.; Khalil, S.I. Simultaneous estimation of chlorpromazine hydrochloride and carvedilol in bulk and pharmaceutical dosage forms using HPLC. J. Biochem. Technol. 2018, 9, 5–9. [Google Scholar]
  21. Mahadik, K.R.; Aggarwal, H.; Kaul, N. Development and validation of HPLC method for simultaneous estimation of trihexyphenidyl hydrochloride and chlorpromazine hydrochloride from tablet dosage form. Indian Drugs 2002, 39, 441–445. [Google Scholar]
  22. Rani, N.U.; Divya, K.; Sahithi, G. New validated RP-HPLC method for simultaneous estimation of chlorpromazine and Trihexyphenidyl HCl in tablets. Int. J. Adv. Pharm. Anal. 2014, 4, 134–137. [Google Scholar]
  23. Midha, K. High performance liquid chromatographic assay for nanogram determination of chlorpromazine and its comparison with a radioimmunoassay. J. Pharm. Sci. 1981, 70, 1043–1046. [Google Scholar] [CrossRef] [PubMed]
  24. Khelfi, A.; Azzouz, M.; Abtroun, R.; Reggabi, M.; Alamir, B. Determination of chlorpromazine, haloperidol, levomepromazine, olanzapine, risperidone, and sulpiride in human plasma by liquid chromatography/tandem mass spectrometry (LC-MS/MS). Int. J. Anal. Chem. 2018, 2018, 5807218. [Google Scholar] [CrossRef] [PubMed]
  25. Sistik, P.; Urinovska, R.; Brozmanova, H. Fast simultaneous LC/MS/MS determination of 10 active compounds in human serum for therapeutic drug monitoring in psychiatric medication. Biomed. Chromatogr. 2016, 30, 217–224. [Google Scholar] [CrossRef] [PubMed]
  26. Wróblewski, K. Optimization of chromatographic systems for analysis of selected psychotropic drugs and their metabolites in serum and saliva by HPLC in order to monitor therapeutic drugs. Open Chem. 2019, 17, 1361–1373. [Google Scholar] [CrossRef]
  27. Kannaiah, K.P.; Sugumaran, A.; Chanduluru, H.K. Environmental impact of greeness assessment tools in liquid chromatography, A review. Microchem. J. 2021, 170, 106685. [Google Scholar] [CrossRef]
  28. Anastas, P.T.; Kirchhoff, M.M. Origins, current status, and future challenges of green chemistry. Acc. Chem. Res. 2002, 35, 686–694. [Google Scholar] [CrossRef]
  29. Gałuszka, A.; Migaszewski, Z.; Namieśnik, J. The 12 principles of green analytical chemistry and the Significance mnemonic of green analytical practices. TrAC-Trends Anal. Chem. 2013, 50, 78–84. [Google Scholar] [CrossRef]
  30. Yabré, M. Green analytical methods of antimalarial artemether-lumefantrine analysis for falsification detection using a low-cost handled NIR spectrometer with DD-SIMCA and drug quantification by HPLC. Molecules 2020, 25, 3397. [Google Scholar] [CrossRef]
  31. ICH, Q8(R2): Pharmaceutical development. In Proceedings of the International Conference on Harmonization, August 2009; Available online: https://www.ema.europa.eu/en/ich-q8-r2-pharmaceutical-development (accessed on 25 July 2022).
  32. Juan, J.B.N.; Carmen, G.C.; Maria, J.V.L. Enantiomeric determination, validation and robustness studies of racemic citalopram in pharmaceutical formulations by capillary electrophoresis. J. Chromatogr. A 2005, 1072, 249–257. [Google Scholar]
  33. Sprent, P.; Draper, N.R.; Smith, H. Applied regression analysis. Biometrics 1981, 37, 863. [Google Scholar] [CrossRef]
  34. Płotka-Wasylka, J. A new tool for the evaluation of the analytical procedure: Green Analytical Procedure Index. Talanta 2018, 181, 204–209. [Google Scholar] [CrossRef] [PubMed]
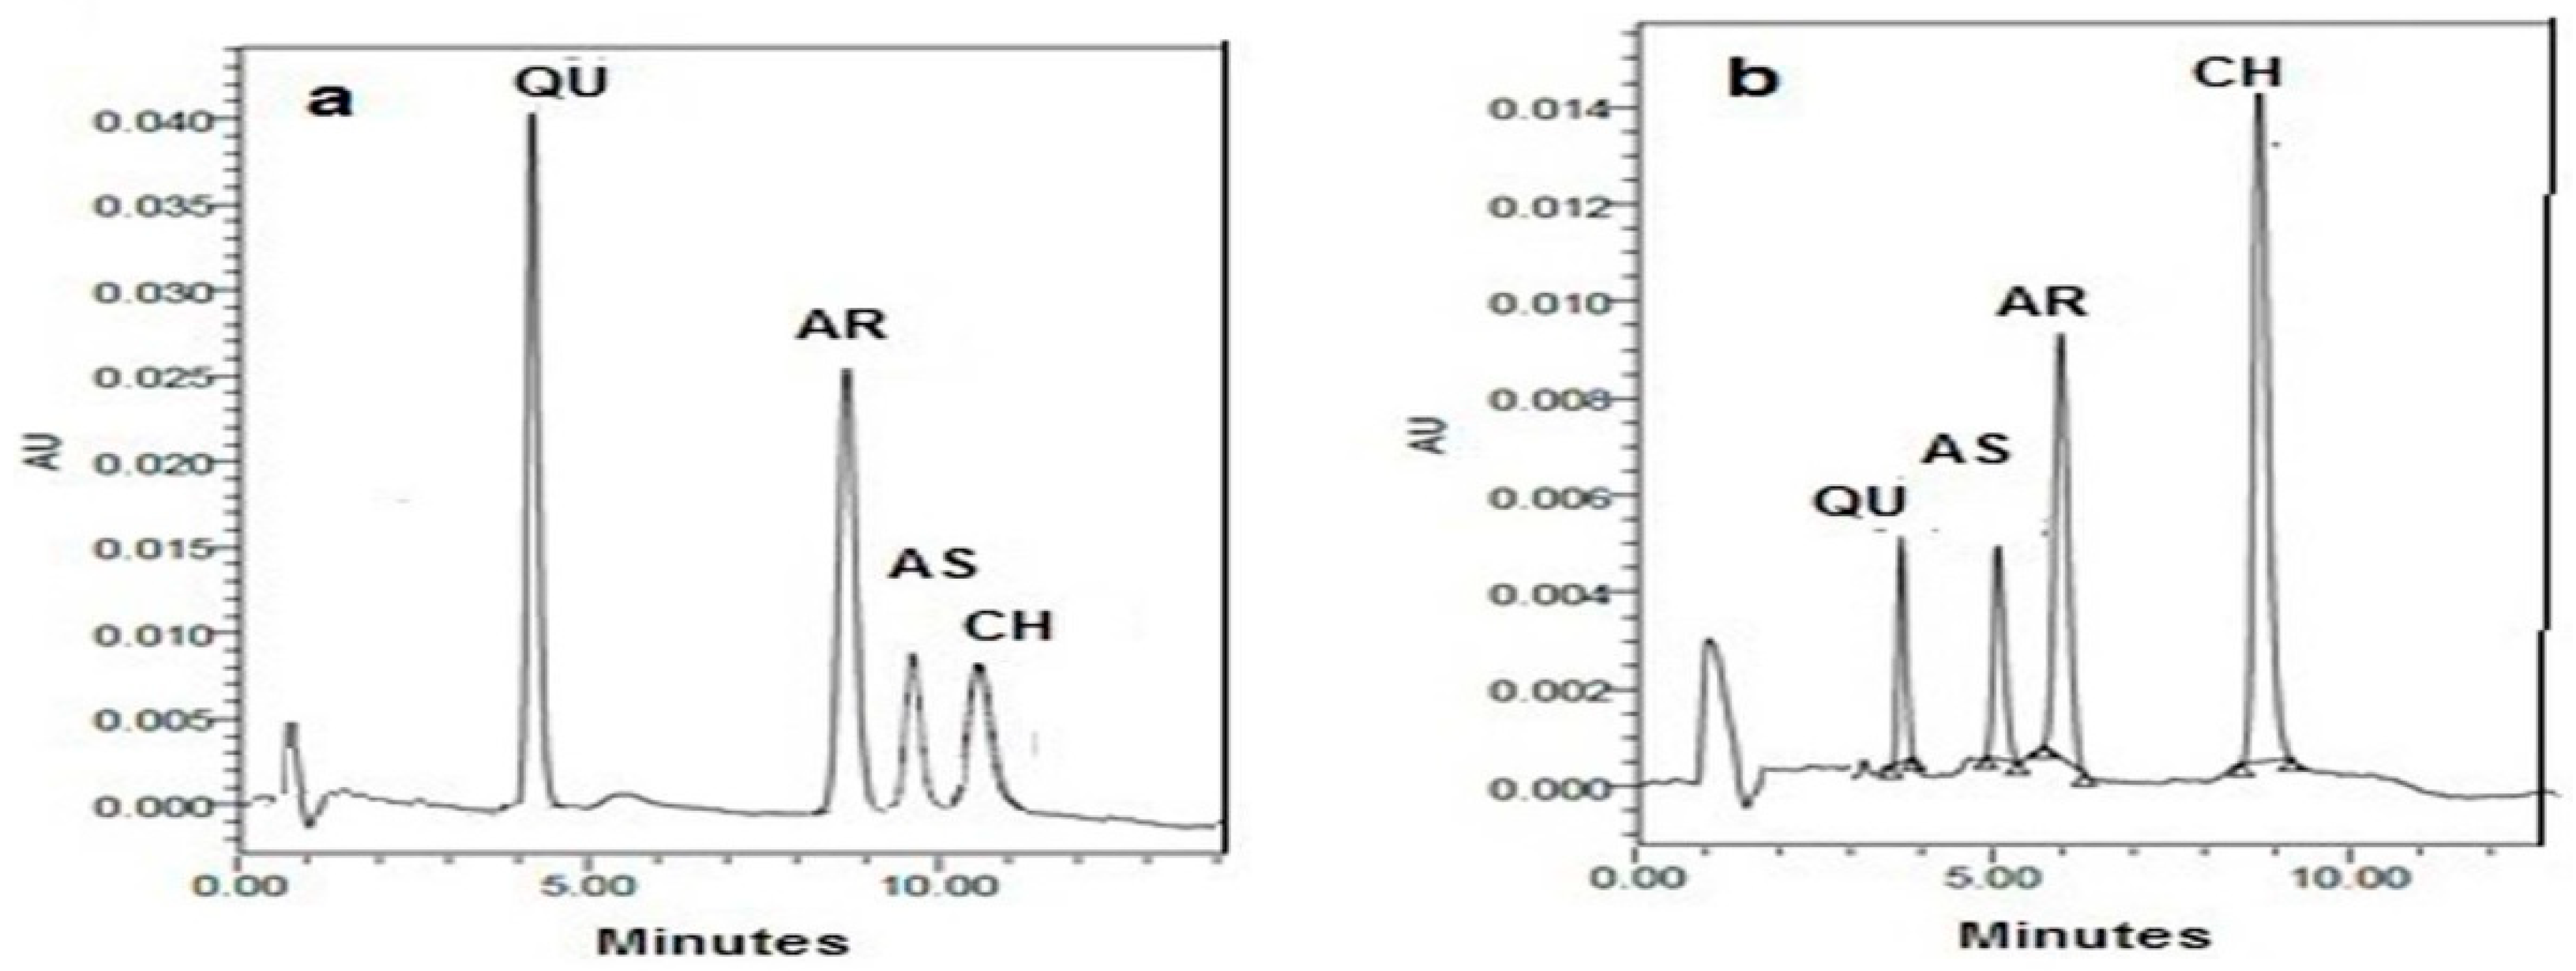
Figure 1. (a) HPLC chromatogram of 20 μL injection of synthetic mixture having 10.0 µg mL−1 of QU, 7.0 µg mL−1 of AR, 10.0 µg mL−1 of AS, and 10.0 µg mL−1 of CH using the green HPLC method and (b) HPLC chromatogram of 20 μL injection of synthetic mixture having 5.0 µg mL−1 of QU, 10.0 µg mL−1 of AS, 5.0 µg mL−1 of AR, and 10.0 µg mL−1 of CH using the conventional HPLC method.
Separations 09 00220 g001
Figure 2. The GAPI pictograms for (a) the proposed green HPLC method, (b) the conventional HPLC proposed method and previously reported methods, (c) for method [9], (d) for method [14], (e) for method [17], and (f) for method [23]. The red zones reveal high ecological impact, yellow zones reveal lower impact, and green zones reveal safe effect to environment.
Separations 09 00220 g002
Table 1. The system suitability test results of the developed green and conventional HPLC methods for determination of QU, AS, AR, and CH.
MethodCompoundRetention Time
(min) a
%RSD b of Retention TimeCapacity Factor
(K)
Selectivity
(α) c
Resolution
(Rs) c
Tailing FactorPlate Count
GreenQU4.211.243.632.36 (a1)10.59 (b1)1.243799.56
AR8.711.118.571.11 (a2)1.69 (b2)1.116111.079
AS9.571.299.521.10 (a3)3.41 (b3)1.245976.887
CH10.441.3710.47 1.374273.030
ConventionalQU3.701.443.351.36 (a4)4.54 (b4)1.445925.405
AS5.051.294.551.21 (a5)1.75 (b5)1.295477.001
AR5.941.185.531.55 (a6)8.21 (b6)1.184868.921
CH8.781.378.59 1.3710,244.90
a: The unretained peak retention times are 0.91 min and 0.86 min. b: Relative standard deviation. c: a1 and b1 are α and Rs calculated for AR-QU. a2 and b2 are α and Rs calculated for AS-AR. a3 and b3 are α and Rs calculated for CH-AS. a4 and b4 are α and Rs calculated for AS-QU. a5 and b5 are α and Rs calculated for AR-AS. a6 and b6 are α and Rs calculated for CH-AR.
Table 2. Characteristic parameters of the calibration equations for the developed green and conventional HPLC methods for analysis of QU, AS, AR, and CH.
MethodGreen
ParametersQUARASCH
Calibration range (µg mL−1)0.1–200.1–200.1–200.1–20
Detection limit (µg mL−1)0.030.020.030.02
Quantitation limit (µg mL−1)0.100.070.090.07
Regression equation (Y) a:
Slope (b)
43,961.7343,627.128968.817272.07
Standard deviation of the slope (Sb)802.48387.8799.4962.08
Relative standard deviation of slope (%)1.80.891.10.85
Intercept (a)2161.03116.7360.1761.59
Correlation coefficient (r)0.99980.99990.99990.9999
MethodConventional
ParametersQUASARCH
Calibration range (µg mL−1)0.1–200.1–200.1–200.1–20
Detection limit (µg mL−1)0.030.030.040.03
Quantitation limit (µg mL−1)0.110.110.120.11
Regression equation (Y) a:
Slope (b)
26,543.814002.525,633.313,094.44
Standard deviation of the slope (Sb)380.9557.96418.84190.77
Relative standard deviation slope (%)1.441.451.631.46
Intercept (a)1745.39189.482234.691104.77
Correlation coefficient (r)0.99990.99990.99980.9998
a Y = a + bC, where C is the concentration in μg mL−1, and Y is the peak area.
Table 3. Determination of QU, AR, AS, and CH in tablet dosage forms by the proposed green HPLC method in comparison with the conventional method.
Green HPLC MethodConventional HPLC Method
Comp. % RecoveryComp. % Recovery
QUMean a100.39QUMean a99.03
± S.D. a1.89± S.D. a1.86
t    (2.18) b0.17
F   (4.28) b1.00
ARMean a99.59ARMean a98.93
± S.D. a1.40± S.D. a1.39
t    (2.18) b1.74
F   (4.28) b0.98
ASMeana98.16ASMean a98.14
± S.D.a2.00± S.D. a2.09
t    (2.18) b1.74
F   (4.28) b0.97
CHMeana 99.57CHMean a99.56
± S.D.a 2.23± S.D. a2.19
t    (2.18) b0.09
F   (4.28) b1.00
a Mean percentage found ± S.D. for seven determinations. b Theoretical values for t and F at p = 0.05.
Publisher’s Note: MDPI stays neutral with regard to jurisdictional claims in published maps and institutional affiliations.

