Article

FutureCite: Predicting Research Articles’ Impact Using Machine Learning and Text and Graph Mining Techniques

by
Maha A. Thafar
1,*,
Mashael M. Alsulami
2 and
Somayah Albaradei
3
1
Computer Science Department, College of Computers and Information Technology, Taif University, Taif 21944, Saudi Arabia
2
Information Technology Department, College of Computers and Information Technology, Taif University, Taif 21944, Saudi Arabia
3
Computer Science Department, Faculty of Computing and Information Technology, King Abdulaziz University, Jeddah 21589, Saudi Arabia
*
Author to whom correspondence should be addressed.
Math. Comput. Appl. 2024, 29(4), 59; https://doi.org/10.3390/mca29040059 (registering DOI)
Submission received: 25 March 2024 / Revised: 5 June 2024 / Accepted: 14 June 2024 / Published: 21 July 2024
(This article belongs to the Topic New Advances in Granular Computing and Data Mining)

Abstract

:
The growth in academic and scientific publications has increased very rapidly. Researchers must choose a representative and significant literature for their research, which has become challenging worldwide. Usually, the paper citation number indicates this paper’s potential influence and importance. However, this standard metric of citation numbers is not suitable to assess the popularity and significance of recently published papers. To address this challenge, this study presents an effective prediction method called FutureCite to predict the future citation level of research articles. FutureCite integrates machine learning with text and graph mining techniques, leveraging their abilities in classification, datasets in-depth analysis, and feature extraction. FutureCite aims to predict future citation levels of research articles applying a multilabel classification approach. FutureCite can extract significant semantic features and capture the interconnection relationships found in scientific articles during feature extraction using textual content, citation networks, and metadata as feature resources. This study’s objective is to contribute to the advancement of effective approaches impacting the citation counts in scientific publications by enhancing the precision of future citations. We conducted several experiments using a comprehensive publication dataset to evaluate our method and determine the impact of using a variety of machine learning algorithms. FutureCite demonstrated its robustness and efficiency and showed promising results based on different evaluation metrics. Using the FutureCite model has significant implications for improving the researchers’ ability to determine targeted literature for their research and better understand the potential impact of research publications.

Graphical Abstract

1. Introduction

There has been a great emphasis on the data mining fields of computer science that can be applied in different fields. Specifically, text and graph mining have been extensively used to extract hidden interesting findings, insights, and features from vast amounts of data in various domains [1,2,3,4,5]. The exponential growth in academic publications in recent years has made it increasingly difficult for researchers to identify significant literature for their work. Citation numbers that were obtained from different databases such as Google Scholar, SCOPUS, ORCID, and Web of Science (WOS), are often used to measure a research paper’s popularity, quality, and significance [6]. However, citation numbers cannot be a reliable indicator of the recent paper’s importance. As a result, more attention has been given to the problem of predicting future citation levels for publications across different domains [7] Machine learning (ML) and deep learning (DL) have been utilized by incorporating text and graph features to solve such problems [8].
Previous studies have emphasized the importance of text-based features using text mining and text embedding techniques in different domains [9,10,11], including our problem of citation level prediction [12,13]. These text-based features have been obtained through feature extraction, a critical step in ML, as it involves transforming raw data into a set of features used to train the ML model. For instance, West and coauthors [14] designed a citation recommendation system based on scientific papers’ content and citation relationships. They employed text-based features such as titles, abstracts, and keywords to capture the scope and topics of publications and enhance the citation recommendation’s accuracy.
Although the above and other studies focused on employing text-based features to predict the future research article impact and citation counts, they should have considered crucial features derived from complex networks formed with citations, articles, and authors. Therefore, recent studies utilized graph-based features to predict the importance of the publications [8,15,16]. For example, CiteRivers [17] relies on visualization capabilities, including graph visualization analysis. Thus, they extended the capability of the previous methods, which were dependent only on visualization, and represented a new visual interactive analysis system for investigating and analyzing the citation patterns as well as contents of scientific documents and then spotting the trends they obtained. Another method [18] developed an enhanced recommendation system based on the Author Community Topic Time Model (ACTTM) and bilayer citation network. They created an author–article citation network model consisting of author citation layers and paper citation layers. After that, they proposed a topic modeling method for recommending authors/papers to researchers. The third study utilized graph-based attributes, formulating the problem as a supervised link prediction in directed, weighted, and temporal networks [19]. They developed a method to predict the links and their weights and then evaluated it by conducting two experiments that demonstrated the effectiveness of their approach. The last study to mention is a graph centrality base [20] that applied graph mining techniques to find papers’ importance by computing the centrality measures such as PageRank, Degree, and Betweenness Closeness. They demonstrated their finding that topologically based similarity using the Jaccard and Cosine similarity algorithms outperforms the same similarity algorithms applied to textual data. Moreover, a few recent studies have taken advantage of graph-based and text-based features to predict future research paper citations and proved their efficiency [21]. One of these studies, ExCiteSearch [22], is a framework developed to enable researchers to choose relevant and important research papers. ExCiteSearch implemented a novel research paper recommendation system that utilizes both abstract textual similarity and citation network information by conducting unsupervised clustering on sets of scientific papers.
Recent studies take advantage of graph embedding techniques to encode nodes or edges into low-dimensional space and generate feature representation through unsupervised learning methods, successfully enhancing the performance of different downstream tasks such as node classification and link prediction [23,24,25]. For instance, the Paper2Vec method utilized text and graph data to generate a scientific paper representation [26]. Unlike methods that rely on traditional graph mining for feature extraction, Paper2Vec employs a graph embedding technique to generate a paper representation that can be used for different tasks, including node classification and link prediction related to predicting the paper’s significance. Paper2Vec leveraged the power of unsupervised feature learning from graphs and text documents by utilizing a neural network to generate paper embedding. This method demonstrated the robustness of paper embeddings using three real-world academic datasets. The significance of the research paper embeddings generated by the Paper2Vec method has been validated via different experiments on three real-world academic datasets, indicating Paper2Vec’s capability to generate strong and rich representations.
Even though several approaches have been proposed to predict future citation levels using different feature models, there are still some limitations and more room to improve the prediction performance. Most existing methods that predict the importance of a research paper depend either on graph data or text data, and a few studies have integrated both text and graph sources to extract features. Using only one source of the features often results in incomplete representations of a paper’s potential impact. Additionally, current feature selection and extraction techniques are limited, often relying on metadata that does not fully capture a paper’s significance. Additionally, contextual content analysis is not utilized enough, causing less accurate predictions for recently published articles. Moreover, the problem of citation level prediction remains challenging due to the imbalance in citation distribution. This leads to biased predictions, and thus the need for effective feature selection and extraction techniques. In this regard, we contribute to the existing literature by presenting an effective method called FutureCite for predicting citation levels by integrating text and graph mining techniques using both text and graph information. A novel aspect of our approach is formulating the problem as a multilabel classification task, where we use a range of citation levels as current indicators of a paper’s importance. FutureCite is designed to provide researchers with a tool to identify promising research papers that are influential in their field and better understand the research impact. We utilized various feature extraction techniques and a dataset of thousands of publications from the data mining field to develop our method. This study contributes to the field of citation analysis by addressing the challenge of predicting future citation levels.
The overall structure of this paper is as follows. Section 1 introduces the motivation for predicting future citation problems, conducts a literature review of recent research that has been published contributing to this topic, and finally presents the fundamentals of some important graph and text mining concepts used in this work. Section 2 describes the datasets that have been utilized in this project. Section 3 presents the FutureCite model’s methodology phases and introduces the problem formulation. Section 4 discusses the results and performance of our proposed approach. Finally, we conclude our work, highlight some limitations, and outline potential future directions for research in this area.

2. Materials

To develop the FutureCite model, we utilized a popular scholar dataset [27], which has been collected from scientific research articles that have been published in different venues (i.e., conferences and journals) such as ICDE, KDD, TKDE, VLDB, CIKM, NIPS, ICML, ICDM, PKDD, SDM, WSDM, AAAI, IJCAI, DMKD, WWW, KAIS and TKDD. This dataset was extended by adding the references for all documents (i.e., research articles).
In this study, we utilized part of this scholarly dataset that focuses on data mining publications provided by the Delve system’s authors [27]. Thus, the dataset we used to develop the FutureCite model is the data mining publications dataset. Each research article in the dataset has several attributes: paper ID, venue name, authors’ names, publication year, paper title, index keys (i.e., keywords), the paper abstract, and references. We divided our input dataset into four types based on the feature categories we will extract.
  • First, the research paper data we utilized to extract text and metadata features in our dataset consists of 11,941 papers. However, after applying different filters to the dataset (described in the cleaning and preprocessing phase), we obtained 6560 research papers. Thus, the size of our dataset is moderate.
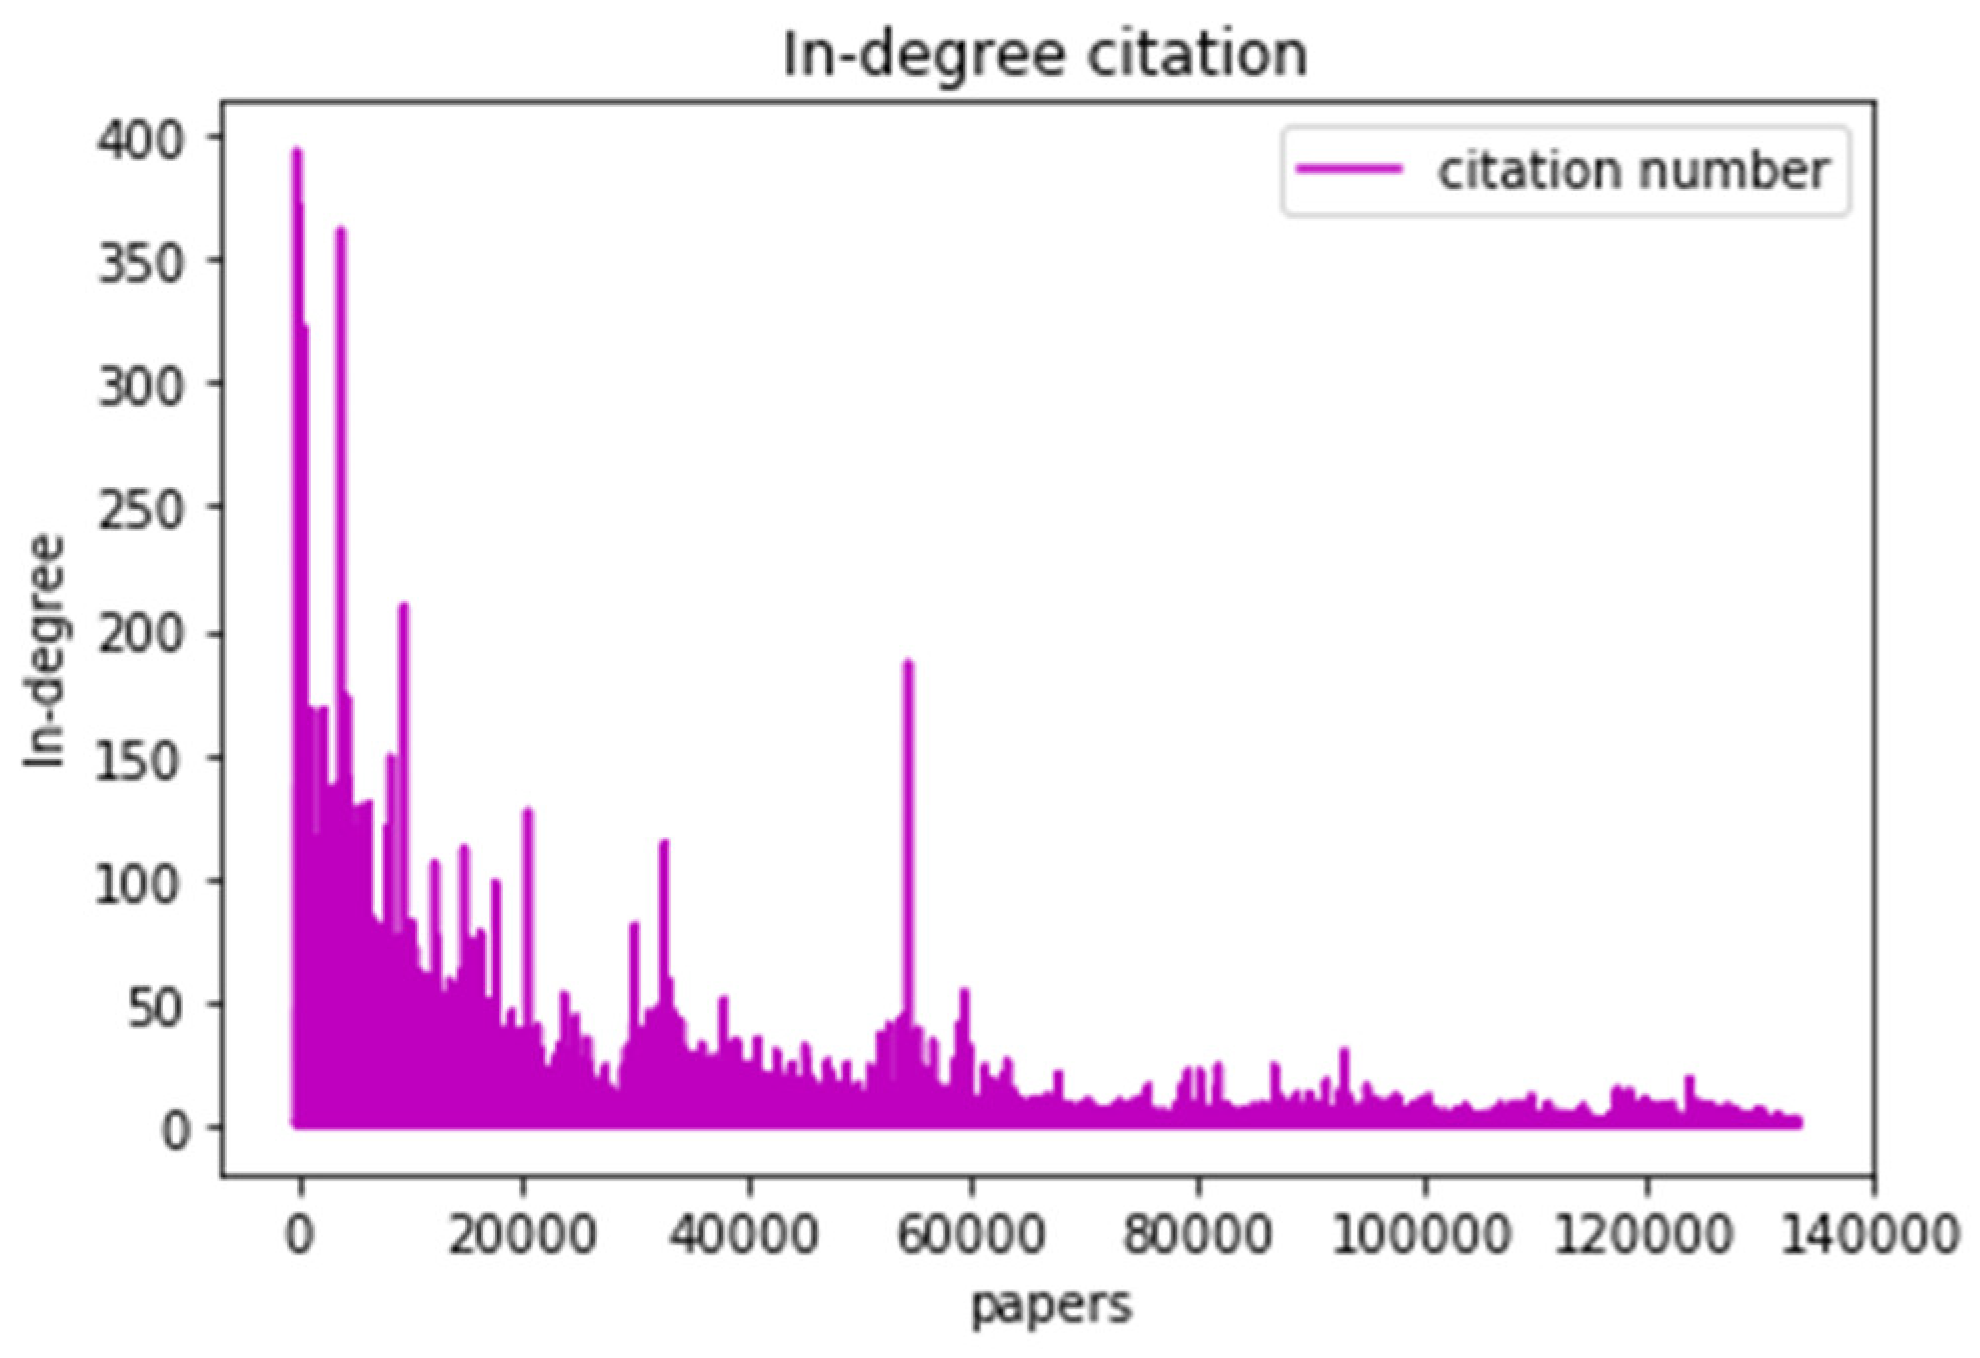
  • Second, the citation graph data, where all papers and their corresponding references are provided, formulate citation edge lists consisting of 133,482 papers and 335,531 relationships (i.e., citations). This citation graph is utilized to define the class labels using different thresholds for each label. These thresholds were selected based on the distribution of citation counts in the dataset, as will be explained later.
  • The third type is the Author–Coauthor Graph, comprising 10,270 authors and 26,963 author–coauthor relationships.
  • The fourth and last data type, the Author–Research graph, consists of 10,270 authors and 6560 publications and the relations between them.
The details of each type, with its descriptions, are discussed later in the feature extraction section.

3. Methods

3.1. Problem Formulation

This study describes the objective of predicting the research paper’s future citation level as supervised learning, specifically multilabel classification. Thus, given a dataset of data mining publications, we are aiming to predict each paper citation level based on predefined class labels. As mentioned in Section 2, all data samples (i.e., published research papers) in our dataset have their features and can be represented as vector X = {x1, x2, …, xn} where n is the number of all data samples. In addition to the data samples, we also provided all data samples with their class labels Y = {y1, y2, …, yn} since our problem is supervised learning. We prepared the class labels based on the citation numbers of the paper in our dataset. The process of creating the class labels is explained in Section 3.3.
We extracted several features from different perspectives for each data sample (research paper), explained later. The classification model goal is to find the hidden patterns and associations between research papers and their class labels based on the features we extracted and then predict the actual class labels.

3.2. FutureCite Model Workflow

Figure 1 provides the workflow to develop the FutureCite model, which involves five main steps. These steps are summarized as follows:
  • Data preparation and preprocessing;
  • Feature extraction and integration. These features are grouped based on three categories: graph-based, text-based, and metadata-based.
  • Data normalization and sampling;
  • Class label preparation;
  • ML classification, where several classifiers are built for class prediction.
A detailed explanation of each step is provided in the following subsections.

3.3. Class Label Creation

Since our model is supervised learning, as explained earlier, we must provide the class labels along with the data samples. Therefore, each research paper in the dataset should have a class label. All class labels were created using the citation graph based on the in-degree measurement. Thus, we began by utilizing a specific part of the dataset, including the research papers and their references, to build the citation graph. A graph G = (V, E) consists of a set of vertices (i.e., nodes) V and a set of edges E. In our study, each node in the citation graph represents the research paper, and each edge between two nodes represents the citation relationship (i.e., paper 1 is a reference for paper 2, or paper 2 cites paper 1). Consequently, we obtained a directed unweighted graph consisting of 133,482 nodes (including papers and references) and 335,531 edges (links). Next, we applied a graph mining technique to calculate each node’s in-degree feature that reflects the citation number of each paper. Table 1 shows an example of a top-5 paper in-degree.
Next, we applied a graph mining technique to calculate each node’s in-degree feature, a key metric that reflects the citation number of each research paper. After that, we obtained the in-degree distribution of all research papers, as shown in Figure 2. Also, we provide an illustrative example of a top-5 research paper in-degree measurement as shown in Table 1. As illustrated in Figure 2, we observed extremely low values for in-degree features across the dataset. We calculated the in-degree average to investigate this metric further, which equals 2.2. This average in-degree provides a baseline for acquiring the class labels in our data.
Despite the average in-degree being 2.2, we made a necessary adjustment to the threshold average to be 5. This procedure was crucial as many references (i.e., research papers) within our dataset have no citations (i.e., in-degree = 0). This choice is of benefit to account for the skew in our data caused by research articles with no citations and to allow for additional meaningful classification. Following this adjustment, we conducted an empirical analysis of the distribution of the in-degree values concerning the new threshold average. Based on this analysis, we determined four class labels for research papers in our dataset. These classes correspond to different ranges of citation counts, as detailed in Table 2. Each paper in the dataset is assigned to one of these classes according to its in-degree value, which measures its citation count. To better understand the complete process for class label creation, we provide a pseudocode for this process, as illustrated in the algorithm representation shown in Figure 3.

3.4. Data Preprocessing and Feature Extraction

In the FutureCite study, since we performed the data preprocessing differently considering the feature category, we will explain each feature group’s data preprocessing and extraction steps together. As a result, the data preprocessing step was applied three times, removing certain data samples from each group.
The feature extraction techniques we employed, based on text and graph mining, are specifically designed to capture various aspects of the data mining publications datasets. Three categories of features were utilized: text-based, graph-based, and metadata-based. The features of each research paper cover various perspectives, including the quality and significance of the publication venue, the collaboration between authors, the individual authors’ expertise and influences, the content of the publications themselves, and other features. These features were then used to develop and train a classification model using multiple ML algorithms to predict paper citation levels based on predefined class labels, ranging from low to highly cited. Each feature category comprises multiple characteristics that have been created based on specific attributes of the dataset. Each category is explained in more detail in the following subsections and illustrated in Figure 1.

3.4.1. Metadata-Based Features

By metadata, we refer to the extra information that we can add to each research paper, which is, in our context, the publication venues and years. Venue-related features are generated based on the venue’s name, known as the impact factor, and the h-index of each publication venue. The h-index is a metric used to evaluate the conference or journal’s quality [28]. To ensure the quality of our publication’s datasets and the relevance of the research papers to the same domain, we implemented a preprocessing procedure on all research papers in our datasets, consisting of 11,941 papers. During this process, we filtered out any research paper unrelated to the data mining conferences or journals and those with a count of fewer than 50 in our datasets. In this step, it is important to have all publications datasets related to the same field to find hidden patterns and associations in the data. Consequently, the number of research papers we utilized was reduced, resulting in our obtaining 7069 research papers published in 23 venues. In addition, we filtered out all research papers that were published before 2001, resulting in 6560 research papers. The data mining venues within our limited datasets and the corresponding number of research papers published in each venue from our datasets are shown in Figure 4. Finally, the h-indices are collected from the Google Scholar website and incorporated as a new feature (venue-h-index) for each research paper. For instance, the Knowledge Discovery and Data Mining (KDD) conference has a good reputation and exhibited an h-index of 42.
Another example is the IEEE Transactions on Knowledge and Data Engineering journal, one of the most popular and strongest data mining conferences, with an h-index of 99. Although only one feature is related to the venue, it indicates the research paper’s significance considering the conference or journal reputation, which, in turn, affects the predictions of paper citation futures.

3.4.2. Text-Based Features

Text-related features have a crucial role in capturing the topics and contents of the research papers. These features include the research paper title and abstract. We started by combining all titles and abstracts for the 6560 documents (i.e., research papers) and then preprocessing them. The data preprocessing steps that we applied involved text tokenization, punctuation elimination, stop and common word removal, and text stemming. After that, a bag-of-words (BOW) feature vector was constructed using the Term Frequency–Inverse Document Frequency (TF–IDF) vectorizer technique [29], which is a popular natural language processing (NLP) technique that is a commonly used technique for determining the importance of a term in a document. TF–IDF reflects the relevance of a term to a document by measuring the frequency of the term in the document and inversely scaling it by the frequency of the term across all documents in the corpus. It is used to build a bag of word feature vectors that have been used extensively for several methods that rely on text-based features for prediction. We optimized several hyperparameters for TF–IDF vectorizers such as max_df, min_df, ngram_range, and max features to obtain the best and most effective bag-of-words FV. For example, if max_df = 0.4, it means, when building the vocabulary, “ignore terms that appear in more than 40% of the documents” (i.e., have a document frequency strictly higher than the given threshold). Likewise, if min_df = 0.01, it means “ignore terms that appear in less than 1% of the documents”.
As a result of this process, we obtained 802 features from the text-based data. However, we considered this number of features a high dimensionality of the feature space. Therefore, dimensionality reduction approaches are employed to mitigate the issue of having many correlated features. This means we need to reduce the number of features into fewer uncorrelated variables by taking advantage of the existing correlations between the input variables in the dataset. We utilized two approaches which are: principal component analysis (PCA) and singular value decomposition (SVD). However, after comparing the performance of those two approaches, we selected the PCA approach since it provides superior results to SVD. PCA effectively reduces the number of features to 420, which captures around 85% of the variance. Consequently, the resulting FV from the text-based category is 420.

3.4.3. Graph-Based Features

In the graph-based features, we focus on extracting the information relevant to the authors of each research paper. Two graphs, the author–coauthor graph, and the author–paper graph, are constructed to extract author-based features. Since we used all author and co-author names in both graphs, we began with the preprocessing step on all authors’ and co-authors’ names before constructing a graph. This preprocessing step comprises converting the names to uppercase, removing all dots (“.”), eliminating middle names, and matching some first names with corresponding initials.
The first graph (G1(V, E)) represents the author–coauthor relationship. This undirected, unweighted graph is built by converting all author–coauthor relationships into an edge list, resulting in 10,270 nodes V (authors) and 26,963 edges E (relation). We visualize the author–coauthor graph to represent the relationships between authors since data visualization (in our case, graph visualization) is an essential tool used frequently in different domains, allowing researchers to explore large and complex datasets more effectively and gain useful insights from the data [30,31]. However, to achieve the best visualization, we applied a filtering procedure by removing all authors that have no connection with other authors or the authors with connections below a specific threshold. This process helps to reduce less important authors and enhance the visualization for more impactful authors. Figure 4 visualizes the author–coauthor graph where the node size indicates the importance of the corresponding authors that appear the most in our dataset. As we can see, the largest node represents Jiawei Han, one of the pioneering scientists in data mining, who has current citation records of more than 250,000. Another insight we can obtain from the visualized graph in Figure 5 is the edge width that represents the connection strength between authors based on their author–coauthor relationship in several publications. Furthermore, the color indicates the community of authors.
After formulating the graph, graph mining techniques then employed three global ranking algorithms to extract three graph properties for each author, which are degree centrality (DC), betweenness centrality (BC), and PageRank [32]. These three features derived by graph mining prove their significance and efficiency in several ML problems across various domains [33,34,35,36,37] and predict future citation problems. The definition and equation for each measurement are as follows:
  • Node Degree—CD(v) [38]: represents the sum of all edges connected to a node v. In a directed graph, the degree can be divided into two categories: in-degree and out-degree.
C D v i = d i = j A i j
  • Page Rank [39], equivalent to the eigenvector centrality CE of node v, measures the node’s importance based on its neighboring nodes’ importance.
C E v i = v j N i A i j   C E v j
  • Betweenness Centrality CB [40] of a node v counts the shortest paths that pass through the node. It is calculated using the following equation:
C B v i = v s v i v t   V , s < t σ s t v j σ s t
where σst is the total number of shortest paths between nodes vs and vt, and σst(vi) is the number of shortest paths between nodes vs and vt that pass along node vi.
After employing the equations above, we obtained three properties of each author, as shown in Table 3, where we list several examples of the Top-5 prominent authors in our datasets. Furthermore, three features for each data sample (i.e., research paper) were calculated. Those features are the average degree, the average page rank, and the average betweenness centrality of all authors associated with each paper.
Additionally, we constructed a second graph known as the author–paper graph. We created an edge list that connects the 10,270 authors to the 6560 publications, resulting in 16,830 nodes. An edge is created if an author’s name appears in the publication authors list. The degree of each author node is computed as a feature for each author. Consequently, the average of all authors’ degrees is calculated as a fourth graph-based feature and assigned to each paper. The resulting FV from the graph-based category is 4, but it is important in citation-level prediction.

3.4.4. Features Integration

Upon completing the feature extraction process, we obtained one venue-related feature, 420 text-related features, and four graph-related features. The order of the documents remained consistent across all feature category extraction processes, facilitating the concatenation process to integrate all features into a single large comprehensive FV. After this, we applied a min-max normalization to all features based on each column, ensuring that all features have the same scale.

3.5. FutureCite Predictive Model

3.5.1. Sampling Techniques for Imbalanced Data

Figure 3 shows that the number of data samples in each class is different. We can see clearly that the numbers of data samples in classes 3 and 4 (i.e., classes with average and above average labels) are much larger than in classes 1 and 2. This issue is called imbalanced data and must be addressed since the ML classifiers face a problem in prediction based on imbalanced data. The imbalanced data affect the ML models’ ability to classify most test samples into the majority class when the minority class lacks information. We addressed this issue by applying random oversampling [41] in the training data to balance the data. This technique is implemented using an imblearn Python package version 0.6.1 [42].

3.5.2. Multilabel Classification Model

In the FutureCite model, after completing the feature extraction process and obtaining a feature vector (FV) for all research papers, we fed the FVs with their class labels into several supervised ML classifiers, which are the support vector machine (SVM) [43], Naïve Bayes (NB) [44], random forests (RF) [45], and eXtreme Gradient Boosting (XGBoost) classifiers [46].
The SVM classifier works by finding the hyperplane that maximally separates the classes in the feature space. SVM uses a kernel function to transform the input features into a higher dimensional space where the classes can be more easily separated. The optimal hyperplane is found by maximizing the margin, which is the distance between the hyperplane and the closest data points from each class. Naïve Bayes is a probabilistic algorithm that is based on Bayes’ theorem. It works by calculating the probability of each class given the input features and selecting the class with the highest probability as the output. Both SVM and NB perform well in many applications, particularly when dealing with high-dimensional data such as text classification, and this is the reason we picked them in our prediction. The third classifier we applied is RF, which demonstrates its effectiveness in prediction because it operates efficiently on extensive datasets and is less prone to the overfitting issue. The last classifier is XGBoost, implemented using an optimized distributed gradient boosting library, called XGBoost [46]. XGBoost utilized classification and regression trees (CART), which use continuous scores assigned to each leaf and then summed them up to provide the final prediction instead of having equal weight as the standard decision trees.
In our study, for each classifier we optimized several critical parameters using the training datasets to improve the classifier’s performance. For example, for the SVM classifier, we optimized the regularization parameter C, the kernel function where we set it to the radial basis function (RBF), and the class weight to be balanced. For the NB classifier, the parameters include fit-prior bool, specified to learn the class’s prior probabilities or not, and class prior, which is the prior probability of the classes. Finally, for the RF classifier, the parameters include the number of trees in the forest (i.e., n estimators), the maximum depth of the trees, and the function to measure the quality of a split (criterion).
To implement our FutureCite method, we utilized the following tools:
  • Python 3.3 [47] is used for implementing all project phases, including preprocessing, feature extraction, training and validation, and classification. We utilized several supported packages, including scikit-learn for ML algorithms, NetworkX for graph mining [48], imblearn package [49] to handle imbalanced class labels, Matplotlib to plot different figures, and Pandas data frame to deal with the data preparation and preprocessing [50].
  • Gephi 0.9.2. [51]: Gephi is used to visualize and analyze graph data, including the author–coauthor and citation graphs. The data are preprocessed and prepared to be in a suitable shape for this tool. Gephi allows us to explore the structure of the citation network and gain valuable insights into the relationships between different research papers, authors, and venues. These tools are essential for developing a comprehensive method for predicting the future citation level of research papers.

4. Results and Discussion

This section describes the evaluation protocols, the experiments conducted, and the results of our FutureCite prediction performance based on several evaluation metrics. We further highlighted several possible characteristics that could boost the FutureCite method prediction performance.

4.1. Evaluation Metrics and Protocols

Several performance metrics are used to evaluate the prediction performance of the multilabel classification models. However, since our datasets are highly imbalanced, typical accuracy is not accurate or meaningful. Therefore, we employed three evaluation metrics derived from the confusion matrix [52], which are precision (also called positive predictive value), recall (also called sensitivity or true positive rate (TPR)), and the F1 score (a combination of precision and recall metrics) [53]. The calculation of these evaluation metrics is based on true positive (TP), and false positive (FP), which represent correctly and incorrectly predicted samples, and the true negative (TN) and false negative (FN), which represent the samples that are correctly and incorrectly predicted, respectively. Equations (4)–(6) illustrate the precision, recall, and F1-score calculations.
Precision = TP/(TP + FP)
Recall = TPR = TP/(TP + FN)
F1-score = 2 × Precision × Recall/(Precision + Recall) = 2TP/(2TP + FP + FN)
For the evaluation setting and protocol, we applied a hold-out validation approach. We split the dataset into 80% for training and 20% for testing in a stratified manner where we ensure the same proportion of each class label in both training and test splits. However, we repeated this process five times for sufficient test samples to generate reliable evaluation metrics. This setup is similar to five-fold cross-validation. We initially shuffled the data and then divided it into 20% and 80% for training and testing, respectively. Subsequently, we selected another 20% for testing and allocated the remaining 80% for training, and so on. In each cycle, we tested each classifier to predict the 20% of hold-out samples (i.e., test set) and calculated the three evaluation metrics identified above. Finally, we averaged the results over the five-test split for each evaluation metric.

4.2. FutureCite Prediction Performance Evaluation

The results of the SVM, NB, RF, and XGBoost classifiers, based on precision, recall, and an F1-score evaluation metric, are presented in Table 4 and reveal interesting findings.
From the results reported in Table 4, it is evident that the XGBoost classifier demonstrates better performance than all other classifiers: Naïve Bayes, SVM, and RF. It achieves a precision of 82.4%, a recall of 80.3%, and an F1-score of 81.3%. XGBoost performs the best since it is a gradient-boosting algorithm, an ensemble-learning technique that combines multiple weak learners’ predictions to create a strong predictive model. Another advantage of XGBoost is that it provides a parallel tree boosting that improves the prediction performance in terms of speed. The second-best performance was achieved by RF, which obtained results close to XGBoost. The reason behind the RF classifier’s efficiency can be attributed to its ensemble-learning approach, which proves its effectiveness in dealing with imbalanced datasets. Another reason that XGBoost and RF performed the best can relate to the extensive optimization of several hyperparameters of XGBoost and RF resulting in improved performance. The third-best performance was achieved by the SVM classifier in all evaluation metrics, obtaining results lower than the RF classifier by 3.6%, 3.2%, and 3.4% in terms of precision, recall, and F1 score, respectively. SVM demonstrates its robustness in dealing with document data. On the other hand, the Naïve Bayes obtained the lowest results, although it approves its efficiency in dealing with document data as reported in the literature. This might be because of the feature combinations we derived, consisting of text and graph data.
Additionally, we conducted an ablation study to examine our method’s performance using different features categories, which highlight the feature set’s importance. We started by investigating our method performance using only the text-based features since the number of these features is much larger than the number of other feature categories. After that, we added the other feature categories to the text-based features to compare the performance of using only text-derived features to using all integrated features (text-based, graph-based, and metadata-based). The results (shown in Table 5) demonstrated that integrating graph- and metadata-based features with text-based features enhanced the performance and increased all evaluation metrics: precision, recall, and F1-score using the RF classifier. Despite the number of graph-based features being small, combining them with text-based features improved the performance for both RF and XGBoost classifiers in terms of all three evaluation metrics, which demonstrates the importance of these graph-based and metadata-based features.
Furthermore, we conducted the last evaluation process to demonstrate the practicality of the FutureCite model’s predictive power by analyzing and validating some results using the literature review. We selected some published research papers from our test data and analyzed the prediction results. For example, we picked a research paper titled “Simrank: a measure of structural-context similarity” [54], which is predicted to be a high-quality paper (i.e., the predicted class label is 1) by our model using the three classifiers, SVM, NB, and RF. We verified this result by examining the research paper details, such as the authors, venues of the paper, and the current citation count. Our examination shows that the current citation for this paper is 2700 and was published in SIG KDD, one of the most important conferences in the data mining and machine learning fields. Furthermore, the authors are popular, have a strong reputation, and have scholarly profiles with impressive citation records. All these factors confirm that this research paper is indeed significant, as predicted by our model.
Overall, the results indicate that the classification model, based on citation graph mining and machine learning, effectively classifies research papers into different classes based on their citation counts. This model can be utilized to identify papers with a high impact and potential significance, as well as papers that fall below average. Such insights can be valuable and useful for researchers and decision-makers across various fields interested in identifying and analyzing research papers with different levels of impact.

5. Conclusions, Remarks, and Recommendations

In this paper, we developed the FutureCite Model, which predicts the future citation of research papers to reveal their importance and significance. We formulated the problem as a multi-label classification task, where each paper was predicted to belong to one of four classes that we derived: ”Highly cited”, ”Well cited”, ”Above/ average cited”, and ”Below average cited”. Four classifiers were used for prediction; two demonstrated their robustness and efficiency in such a problem. The results highlight the effectiveness of our approach. We conducted a results analysis and validation to identify highly cited papers and show evidence for those papers to be predicted as significant. The FutureCite model leverages a combination of graph-based and text-based features, which capture both the structure and content of the data-mining publications dataset, improving the model’s performance in predicting the citation level and demonstrating its effectiveness. The outcomes of our work have implications for diverse stakeholders such as researchers, funding agencies, and academic institutions, as they can make informed decisions based on our models’ predictive capability.
Although our method proves its efficiency and robustness, it also faces some limitations and challenges that must be addressed to ensure its effectiveness and reliability in practice. One of the major limitations of this study is the size of the used dataset, which may not accurately represent the full range of research papers. It also can lead to another challenge of data availability, where our method relies on access to a large dataset of published research papers and their citation information. This information may not be available or may require considerable effort and resources to collect. Another limitation is the prediction performance, which can be greatly improved using massive data, especially the deep learning models we omit due to our dataset size.
Despite the above limitations, the FutureCite model contributes to the research paper citation prediction field as a powerful and useful application that demonstrates its effectiveness using graph and test mining and machine learning techniques. The approach can be applied to various fields, provide insights into the impact and significance of research papers, and aid researchers in their research and literature.
Future work can involve various areas of exploration and improvement. One aspect is to utilize larger datasets, as working with massive amounts of data can allow us to employ deep learning techniques for feature generation and prediction. Deep learning models usually perform better when trained on extensive datasets. Another aspect of future work is refining our model, FutureCite, and improving its performance. This can be achieved by exploring and incorporating additional features into the model. One potential approach to integrating more essential features is to leverage graph-embedding techniques such as node2vec, graph neural networks (GNNs), and others which can automatically generate crucial features based on the underlying graph structure and topology. Furthermore, incorporating recent text-embedding techniques such as bidirectional encoder representations from transformers (BERT) embedding or other large language models (LLMs) techniques can enhance the model’s ability to capture semantic information and relationships. Combining text and graph features from these embeddings can comprehensively represent the research papers.

Author Contributions

M.A.T. conceptualized and designed the study. M.M.A. implemented the code. M.A.T., M.M.A. and S.A. wrote the manuscript and designed the figures. M.A.T., M.M.A. and S.A. validated and analyzed the results. All authors revised/edited the manuscript and approved the final version. All authors have read and agreed to the published version of the manuscript.

Funding

This research received no external funding.

Data Availability Statement

The datasets are given upon request after publication. https://github.com/MahaThafar/FutureCite-, accessed on 24 March 2024.

Conflicts of Interest

The authors have declared that no conflicts of interest exist.

References

  1. Alamro, H.; Thafar, M.A.; Albaradei, S.; Gojobori, T.; Essack, M.; Gao, X. Exploiting machine learning models to identify novel Alzheimer’s disease biomarkers and potential targets. Sci. Rep. 2023, 13, 4979. [Google Scholar] [CrossRef] [PubMed]
  2. Dong, Y.; Chawla, N.V.; Swami, A. Metapath2Vec: Scalable Representation Learning for Heterogeneous Networks. In Proceedings of the 23rd ACM SIGKDD International Conference on Knowledge Discovery and Data Mining, Halifax, NS, Canada, 13–17 August 2017; pp. 135–144. [Google Scholar]
  3. Thafar, M.A.; Albaradie, S.; Olayan, R.S.; Ashoor, H.; Essack, M.; Bajic, V.B. Computational Drug-target Interaction Prediction based on Graph Embedding and Graph Mining. In Proceedings of the 2020 10th International Conference on Bioscience, Biochemistry and Bioinformatics, Kyoto, Japan, 19–22 January 2020; pp. 14–21. [Google Scholar]
  4. Thafar, M.A.; Alshahrani, M.; Albaradei, S.; Gojobori, T.; Essack, M.; Gao, X. Affinity2Vec: Drug-target binding affinity prediction through representation learning, graph mining, and machine learning. Sci. Rep. 2022, 12, 4751. [Google Scholar] [CrossRef] [PubMed]
  5. Thafar, M.A.; Olayan, R.S.; Ashoor, H.; Albaradei, S.; Bajic, V.B.; Gao, X.; Gojobori, T.; Essack, M. DTiGEMS+: Drug–target interaction prediction using graph embedding, graph mining, and similarity-based techniques. J. Cheminformatics 2020, 12, 44. [Google Scholar] [CrossRef] [PubMed]
  6. Frenken, K.; Hoekman, J.; Ding, Y.; Rousseau, R.; Wolfram, D. Measuring Scholarly Impact: Methods and Practice; Springer: Berlin/Heidelberg, Germany, 2014. [Google Scholar]
  7. Butun, E.; Kaya, M. Predicting Citation Count of Scientists as a Link Prediction Problem. IEEE Trans. Cybern. 2020, 50, 4518–4529. [Google Scholar] [CrossRef] [PubMed]
  8. Ali, Z.; Kefalas, P.; Muhammad, K.; Ali, B.; Imran, M. Deep learning in citation recommendation models survey. Expert Syst. Appl. 2020, 162, 113790. [Google Scholar] [CrossRef]
  9. Alshahrani, M.; Almansour, A.; Alkhaldi, A.; Thafar, M.A.; Uludag, M.; Essack, M.; Hoehndorf, R. Combining biomedical knowledge graphs and text to improve predictions for drug-target interactions and drug-indications. PeerJ 2022, 10, e13061. [Google Scholar] [CrossRef] [PubMed]
  10. Gupta, A.; Dengre, V.; Kheruwala, H.A.; Shah, M. Comprehensive review of text-mining applications in finance. Financ. Innov. 2020, 6, 39. [Google Scholar] [CrossRef]
  11. Thafar, M.A.; Albaradei, S.; Uludag, M.; Alshahrani, M.; Gojobori, T.; Essack, M.; Gao, X. OncoRTT: Predicting novel oncology-related therapeutic targets using BERT embeddings and omics features. Front. Genet. 2023, 14, 1139626. [Google Scholar] [CrossRef] [PubMed]
  12. Akujuobi, U.; Sun, K.; Zhang, X. Mining top-k Popular Datasets via a Deep Generative Model. In Proceedings of the 2018 IEEE International Conference on Big Data (Big Data), Seattle, WA, USA, 10–13 December 2018; pp. 584–593. [Google Scholar]
  13. Castano, S.; Ferrara, A.; Montanelli, S. Topic summary views for exploration of large scholarly datasets. J. Data Semant. 2018, 7, 155–170. [Google Scholar] [CrossRef]
  14. West, J.D.; Wesley-Smith, I.; Bergstrom, C.T. A Recommendation System Based on Hierarchical Clustering of an Article-Level Citation Network. IEEE Trans. Big Data 2016, 2, 113–123. [Google Scholar] [CrossRef]
  15. Weis, J.W.; Jacobson, J.M. Learning on knowledge graph dynamics provides an early warning of impactful research. Nat. Biotechnol. 2021, 39, 1300–1307. [Google Scholar] [CrossRef] [PubMed]
  16. Xia, W.; Li, T.; Li, C. A review of scientific impact prediction: Tasks, features and methods. Scientometrics 2023, 128, 543–585. [Google Scholar] [CrossRef]
  17. Heimerl, F.; Han, Q.; Koch, S.; Ertl, T. CiteRivers: Visual Analytics of Citation Patterns. IEEE Trans. Vis. Comput. Graph. 2016, 22, 190–199. [Google Scholar] [CrossRef]
  18. Lu, M.; Qu, Z.; Wang, M.; Qin, Z. Recommending authors and papers based on ACTTM community and bilayer citation network. China Commun. 2018, 15, 111–130. [Google Scholar] [CrossRef]
  19. Pobiedina, N.; Ichise, R. Citation count prediction as a link prediction problem. Appl. Intell. 2016, 44, 252–268. [Google Scholar] [CrossRef]
  20. Samad, A.; Islam, M.A.; Iqbal, M.A.; Aleem, M. Centrality-Based Paper Citation Recommender System. EAI Endorsed Trans. Ind. Netw. Intell. Syst. 2019, 6, e2. [Google Scholar] [CrossRef]
  21. Kanellos, I.; Vergoulis, T.; Sacharidis, D.; Dalamagas, T.; Vassiliou, Y. Impact-based ranking of scientific publications: A survey and experimental evaluation. IEEE Trans. Knowl. Data Eng. 2019, 33, 1567–1584. [Google Scholar] [CrossRef]
  22. Sterling, J.A.; Montemore, M.M. Combining Citation Network Information and Text Similarity for Research Article Recommender Systems. IEEE Access 2022, 10, 16–23. [Google Scholar] [CrossRef]
  23. Jiang, S.; Koch, B.; Sun, Y. HINTS: Citation Time Series Prediction for New Publications via Dynamic Heterogeneous Information Network Embedding. In Proceedings of the Web Conference 2021, Ljubljana, Slovenia, 19–23 April 2021; pp. 3158–3167. [Google Scholar]
  24. Thafar, M.A.; Olayan, R.S.; Albaradei, S.; Bajic, V.B.; Gojobori, T.; Essack, M.; Gao, X. DTi2Vec: Drug-target interaction prediction using network embedding and ensemble learning. J. Cheminformatics 2021, 13, 71. [Google Scholar] [CrossRef]
  25. Alshahrani, M.; Thafar, M.A.; Essack, M. Application and evaluation of knowledge graph embeddings in biomedical data. PeerJ Comput. Sci. 2021, 7, e341. [Google Scholar] [CrossRef]
  26. Ganguly, S.; Pudi, V. Paper2vec: Combining Graph and Text Information for Scientific Paper Representation. In Advances in Information Retrieval; Springer: Berlin/Heidelberg, Germany, 2017; pp. 383–395. [Google Scholar]
  27. Akujuobi, U.; Zhang, X. Delve: A Dataset-Driven Scholarly Search and Analysis System. SIGKDD Explor. Newsl. 2017, 19, 36–46. [Google Scholar] [CrossRef]
  28. Mingers, J.; Macri, F.; Petrovici, D. Using the h-index to measure the quality of journals in the field of business and management. Inf. Process. Manag. 2012, 48, 234–241. [Google Scholar] [CrossRef]
  29. Zhang, W.; Yoshida, T.; Tang, X. A comparative study of TF*IDF, LSI and multi-words for text classification. Expert Syst. Appl. 2011, 38, 2758–2765. [Google Scholar] [CrossRef]
  30. Aljehane, S.; Alshahrani, R.; Thafar, M. Visualizing the Top 400 Universities. 2015. Available online: https://www.researchgate.net/profile/Maha-Thafar/publication/285927843_Visualizing_the_Top_400_Universities/links/5664c6cd08ae192bbf90aa9c/Visualizing-the-Top-400-Universities.pdf (accessed on 1 July 2023).
  31. Shakeel, H.M.; Iram, S.; Al-Aqrabi, H.; Alsboui, T.; Hill, R. A Comprehensive State-of-the-Art Survey on Data Visualization Tools: Research Developments, Challenges and Future Domain Specific Visualization Framework. IEEE Access 2022, 10, 96581–96601. [Google Scholar] [CrossRef]
  32. Opsahl, T.; Agneessens, F.; Skvoretz, J. Node centrality in weighted networks: Generalizing degree and shortest paths. Soc. Netw. 2010, 32, 245–251. [Google Scholar] [CrossRef]
  33. Albaradei, S.; Napolitano, F.; Thafar, M.A.; Gojobori, T.; Essack, M.; Gao, X. MetaCancer: A deep learning-based pan-cancer metastasis prediction model developed using multi-omics data. Comput. Struct. Biotechnol. J. 2021, 19, 4404–4411. [Google Scholar] [CrossRef]
  34. Albaradei, S.; Alganmi, N.; Albaradie, A.; Alharbi, E.; Motwalli, O.; Thafar, M.A.; Gojobori, T.; Essack, M.; Gao, X. A deep learning model predicts the presence of diverse cancer types using circulating tumor cells. Sci. Rep. 2023, 13, 21114. [Google Scholar] [CrossRef]
  35. De, S.S.; Dehuri, S.; Cho, S.-B. Research contributions published on betweenness centrality algorithm: Modelling to analysis in the context of social networking. Int. J. Soc. Netw. Min. 2020, 3, 1–34. [Google Scholar] [CrossRef]
  36. Salavati, C.; Abdollahpouri, A.; Manbari, Z. Ranking nodes in complex networks based on local structure and improving closeness centrality. Neurocomputing 2019, 336, 36–45. [Google Scholar] [CrossRef]
  37. Albaradei, S.; Uludag, M.; Thafar, M.A.; Gojobori, T.; Essack, M.; Gao, X. Predicting bone metastasis using gene expression-based machine learning models. Front. Genet. 2021, 12, 771092. [Google Scholar] [CrossRef]
  38. Evans, T.S.; Chen, B. Linking the network centrality measures closeness and degree. Commun. Phys. 2022, 5, 172. [Google Scholar] [CrossRef]
  39. Zhang, P.; Wang, T.; Yan, J. PageRank centrality and algorithms for weighted, directed networks. Phys. A Stat. Mech. Its Appl. 2022, 586, 126438. [Google Scholar] [CrossRef]
  40. Prountzos, D.; Pingali, K. Betweenness centrality: Algorithms and implementations. In Proceedings of the 18th ACM SIGPLAN Symposium on Principles and Practice of Parallel Programming, Shenzhen, China, 23–27 February 2013; pp. 35–46. [Google Scholar]
  41. Liu, A.; Ghosh, J.; Martin, C.E. Generative Oversampling for Mining Imbalanced Datasets. DMIN 2007, 7, 66–72. [Google Scholar]
  42. Lemaître, G.; Nogueira, F.; Aridas, C.K. Imbalanced-learn: A python toolbox to tackle the curse of imbalanced datasets in machine learning. J. Mach. Learn. Res. JMLR 2017, 18, 559–563. [Google Scholar]
  43. Suthaharan, S. Support Vector Machine. In Machine Learning Models and Algorithms for Big Data Classification: Thinking with Examples for Effective Learning; Suthaharan, S., Ed.; Springer: New York, NY, USA, 2016; pp. 207–235. [Google Scholar]
  44. Ting, S.L.; Ip, W.H.; Tsang, A.H.C. Is Naive Bayes a good classifier for document classification. Int. J. Softw. Eng. Appl. 2011, 5, 37–46. [Google Scholar]
  45. Ho, T.K. Random decision forests. In Proceedings of the 3rd International Conference on Document Analysis and Recognition, Montreal, QC, Canada, 14–16 August 1995; Volume 1, pp. 278–282. [Google Scholar]
  46. Chen, T.; Guestrin, C. XGBoost: A Scalable Tree Boosting System. In Proceedings of the ACM SIGKDD International Conference on Knowledge Discovery and Data Mining, San Francisco, CA, USA, 13–17 August 2016; pp. 785–794. [Google Scholar]
  47. Van Rossum, G. Python Programming Language. USENIX Annual Technical. 2007. Available online: http://kelas-karyawan-bali.kurikulum.org/IT/en/2420-2301/Python_3721_kelas-karyawan-bali-kurikulumngetesumum.html (accessed on 25 March 2024).
  48. Platt, E.L. Network Science with Python and NetworkX Quick Start Guide: Explore and Visualize Network Data Effectively; Packt Publishing Ltd.: Birmingham, UK, 2019. [Google Scholar]
  49. He, H.; Ma, Y. Imbalanced Learning: Foundations, Algorithms, and Applications; John Wiley & Sons: Hoboken, NJ, USA, 2013. [Google Scholar]
  50. Nelli, F. Python Data Analytics: Data Analysis and Science Using Pandas, Matplotlib and the Python Programming Language; Apress: New York, NY, USA, 2015. [Google Scholar]
  51. Yang, J.; Cheng, C.; Shen, S.; Yang, S. Comparison of complex network analysis software: Citespace, SCI 2 and Gephi. In Proceedings of the 2017 IEEE 2nd International Conference on Big Data Analysis (ICBDA), Beijing, China, 10–12 March 2017; pp. 169–172. [Google Scholar]
  52. Maria Navin, J.R.; Pankaja, R. Performance analysis of text classification algorithms using confusion matrix. Int. J. Eng. Tech. Res. IJETR 2016, 6, 75–78. [Google Scholar]
  53. Powers, D.M. Evaluation: From Precision, Recall and F-Measure to ROC, Informedness, Markedness and Correlation. 2011. Available online: https://arxiv.org/abs/2010.16061 (accessed on 25 March 2024).
  54. Jeh, G.; Widom, J. SimRank: A measure of structural-context similarity. In Proceedings of the Eighth ACM SIGKDD International Conference on Knowledge Discovery and Data Mining, Edmonton, AB, Canada, 23–26 July 2002; pp. 538–543. [Google Scholar]
Figure 1. FutureCite Model Workflow.
Mca 29 00059 g001
Figure 2. In-degree distributions for all research articles in the publication’s dataset.
Mca 29 00059 g002
Figure 3. Algorithm pseudocode for class label creation process.
Mca 29 00059 g003
Figure 4. A list of obtained conferences and journals with the research papers count after applying the preprocessing steps.
Mca 29 00059 g004
Figure 5. Author–Coauthor Graph.
Mca 29 00059 g005
Table 1. Top-5 Research Paper In-degree Feature.
Paper IDIn-Degree
085B9585394
812313D9371
70128864362
641D5808337
59C818AC327
Table 2. Class Label Rules and Description.
RuleClass LabelLabel DescriptionNumber of Research Papers in This Class
In-degree > 501Highly cited44
In-degree > 202Well cited180
In-degree > 53Above/ average cited1118
In-degree ≤ 54Below average cited5218
Table 3. The Top-5 authors in our dataset from the author–coauthor graph.
Author NameDegreePageRankBetweenness Centrality
PHLIP YU1650.0021630.068579
CHRISTOS FALOUTSOS1820.0020100.066565
JIAWEI HAN2240.0024680.063534
HEIKKI MANNILA570.0008140.020424
QIANG YANG880.0010450.019324
Table 4. Classification Evaluation Score.
ClassifierPrecisionRecallF1-Score
SVM77.9%75.6%76.73%
NB74.2%64.6%69.08%
RF81.5%78.8%80.13%
XGBoost82.4%80.3%81.30%
The bold font indicates the best and the italic indicates the second best.
Table 5. Prediction performances of the XGBoost and RF classifiers using different sets of FV in terms of three evaluation metrics.
Features CategoryClassifierPrecisionRecallF1-Score
Text-based featuresRF79.7% 77.2% 78.43 %
XGBoost81.3% 78.7% 80.00%
Integrated features:
text-based, graph-based, and metadata-based
RF81.5%78.8%80.13%
XGBoost82.4%80.3%81.30%
Disclaimer/Publisher’s Note: The statements, opinions and data contained in all publications are solely those of the individual author(s) and contributor(s) and not of MDPI and/or the editor(s). MDPI and/or the editor(s) disclaim responsibility for any injury to people or property resulting from any ideas, methods, instructions or products referred to in the content.

