Article

Estimation of Anthocyanins in Heterogeneous and Homogeneous Bean Landraces Using Probabilistic Colorimetric Representation with a Neuroevolutionary Approach

by
José-Luis Morales-Reyes
1,*,
Elia-Nora Aquino-Bolaños
1,
Héctor-Gabriel Acosta-Mesa
2 and
Aldo Márquez-Grajales
3
1
Centre for Food Research and Development, University of Veracruz, Xalapa 91190, Mexico
2
Artificial Intelligence Research Institute, University of Veracruz, Xalapa 91097, Mexico
3
Institute of Basic Sciences and Engineering, Autonomous University of Hidalgo State, Mineral Reforma-Hgo, Pachuca 42184, Mexico
*
Author to whom correspondence should be addressed.
Math. Comput. Appl. 2024, 29(4), 68; https://doi.org/10.3390/mca29040068
Submission received: 3 June 2024 / Revised: 13 August 2024 / Accepted: 17 August 2024 / Published: 19 August 2024
(This article belongs to the Special Issue New Trends in Computational Intelligence and Applications 2023)

Abstract

:
The concentration of anthocyanins in common beans indicates their nutritional value. Understanding this concentration makes it possible to identify the functional compounds present. Previous studies have presented color characterization as two-dimensional histograms, based on the probability mass function. In this work, we proposed a new type of color characterization represented by three two-dimensional histograms that consider chromaticity and luminosity channels in order to verify the robustness of the information. Using a neuroevolutionary approach, we also found a convolutional neural network (CNN) for the regression task. The results demonstrate that using three two-dimensional histograms increases the accuracy compared to the color characterization represented by one two-dimensional histogram. As a result, the precision was 93.00 ± 5.26 for the HSI color space and 94.30 ± 8.61 for CIE L*a*b*. Our procedure is suitable for estimating anthocyanins in homogeneous and heterogeneous colored bean landraces.

1. Introduction

Beans are an important legume cultivated in different parts of the world. They are a food source with multiple nutritional benefits and edible components, such as flowers, green beans, and seeds [1]. Common beans are grown on a large scale; according to the FAO database, the world production of dry bean grain was 27,715,023 tons in 2021. However, in the markets, bean varieties are limited. Their characteristics are defined by consumer preferences, with the seed color, shape, and size set according to criteria, provoking similarities between grains [2,3].
On the other hand, there are domesticated varieties (common bean landraces), which are adaptations of a traditional cultivation system, preserved for generations. Moreover, several ethnic groups grow beans in south-central Mexico, and this region contains the greatest genetic diversity of Phaseolus vulgaris L., including the Mesoamerican, Jalisco, and Durango landraces [4]. Different cultivated bean landraces show remarkable morphological traits, growth, adaptation, yield potential, and coloring variation [5]. Therefore, the colorimetric characteristics of bean landraces are diverse and variable. For example, homogeneous colored landraces consist of seeds of similar coloration, and heterogeneous colored landraces consist of seeds of different or variegated colors [4,6]. Since bean landraces are one of the primary sources of food in rural communities [7], knowing the concentrations of functional compounds and their potential nutraceutical content is a research subject that has been pursued by the scientific community. Polyphenols, flavonoids, and anthocyanins are mainly related to biological antioxidative activities and have preventive effects against degenerative and cardiovascular diseases and cancer [7,8,9,10], as well as conditions related to triglycerides, cholesterol, and metabolic syndrome [11,12]. However, the anthocyanin concentration is variable in seeds with different colorations in heterogeneous bean landraces [4].
The anthocyanin concentration is determined in the laboratory by the pH differential method; using this method, a representative sample of each bean landrace is analyzed by an invasive procedure that requires time, chemical reagents, and laboratory equipment; additionally, specialized personnel are required [6]. Therefore, new non-invasive and less time-consuming techniques were reported to estimate the anthocyanins in grape berries, strawberries, blueberries, purple lettuce, and leaves, which are samples of homogeneous color [13,14,15,16,17,18,19,20,21,22,23]. The average color is used to characterize the color of the purple lettuce; using image processing, the region of interest is given an average value of the color of each channel of the RGB, HSV, and L*a*b* color spaces [17]. The color characterization of strawberry involved the average of the channels L*, a*, and b* [18]. Alternatively, the average color is used to calculate other color indices [23]. Other authors have reported different color characterizations, transforming the original variables into new ones, like using principal component analysis [24]. Other approaches use images that are reduced in size to minimize the computational cost of training and validating algorithms [25,26], using machine learning algorithms, such as statistical regression techniques, traditional artificial neural networks, and deep learning algorithms [15,16,17,18,19,20,21,22,23,24,25,26,27,28].
The estimation of anthocyanins in bean landraces is a difficult task. The work by [29] reports on a comparison between different color characterizations, which demonstrates that the robustness of the characterization color reduces the estimation error; therefore, the use of probability distribution to represent the color distribution is suitable to characterize the color of bean landraces [29,30]. This method transforms the image-space color values into several color characterizations, such as the average, for the purpose of principal component analysis, and two-dimensional histograms [29]. Color characterization using the probability mass function (PMF) considers the color distribution of a set of seeds; so far, chromaticity channels have been explored to characterize the color in homogeneous bean landraces [29,30].
To our knowledge, only anthocyanin estimates have been reported for homogenous colored bean landraces. This work reports on the estimation of anthocyanins in bean landraces with homogeneous and heterogeneous coloring. This paper presents the following:
  • An exploration of color characterization using two color spaces (HSI and CIE L*a*b*) to create two-dimensional histograms, using the probability mass function. Our main contribution is the color characterization represented with three two-dimensional histograms: the first color characterization (a* and b*, L* and a*, L* and b*) and the second color characterization (H and S, H and I, and S and I). We compared our color characterization and the color characterization created using only one two-dimensional histogram (chromaticity channel);
  • It is a challenge to design convolutional neural network architecture for a specific task. Providing an architecture suitable for estimating anthocyanins in common bean landraces with homogeneous and heterogeneous coloring was considered using a neuroevolution approach. For this reason, the framework DeepGA was used to design the convolutional neural network architecture for our problem and to reduce the estimation error.
The structure of this document is as follows: Section 2 describes the methodology for estimating anthocyanins in common bean landraces with heterogeneous and homogeneous coloring. Next, Section 3 displays the results obtained from its implementation. Section 4 describes the discussion based on the results obtained and reported in this work, and finally, in Section 5, the conclusions are presented.

2. Materials and Methods

2.1. Workflow of the Study

To estimate anthocyanins in common bean landraces using digital image processing a series of steps is required:
  • For the production of photographs of bean landraces, it was necessary to have the ideal lighting conditions and shooting settings to standardize the photographic acquisitions;
  • Using a segmentation algorithm is pivotal in separating the background from the regions of interest. In this study, the color of the bean landrace seeds is the primary area of interest;
  • Color characterization: after obtaining the colorimetric characteristics, these were represented as a joint probability distribution model. Histograms are appropriate for the color characterization of common bean landraces;
  • Learning techniques play a significant role. Specifically, this study employed the neuroevolution technique to find the CNN architecture suitable for the estimation of anthocyanin concentrations;
  • For a comparison of the methods, the anthocyanin estimation results were compared with the anthocyanin determination results from the pH differential method.
The methodology for estimating anthocyanins in common bean landraces using digital image processing is exemplified by the overall workflow shown in Figure 1.

2.2. Common Bean Landraces

The bean varieties were collected in several municipalities in Oaxaca, Mexico. A total of 46 different common bean landraces (Phaseolus vulgaris L.) were used in this work. Each sample contained 60 g of healthy and clean seeds. In addition, 40 bean landraces were homogeneous in color and were made up of the following color groups:
  • Eighteen black bean landraces;
  • Nine red bean landraces;
  • Eight yellow bean landraces;
  • Four white bean landraces;
  • One brown bean landrace;
  • Six heterogeneous colored bean landraces.
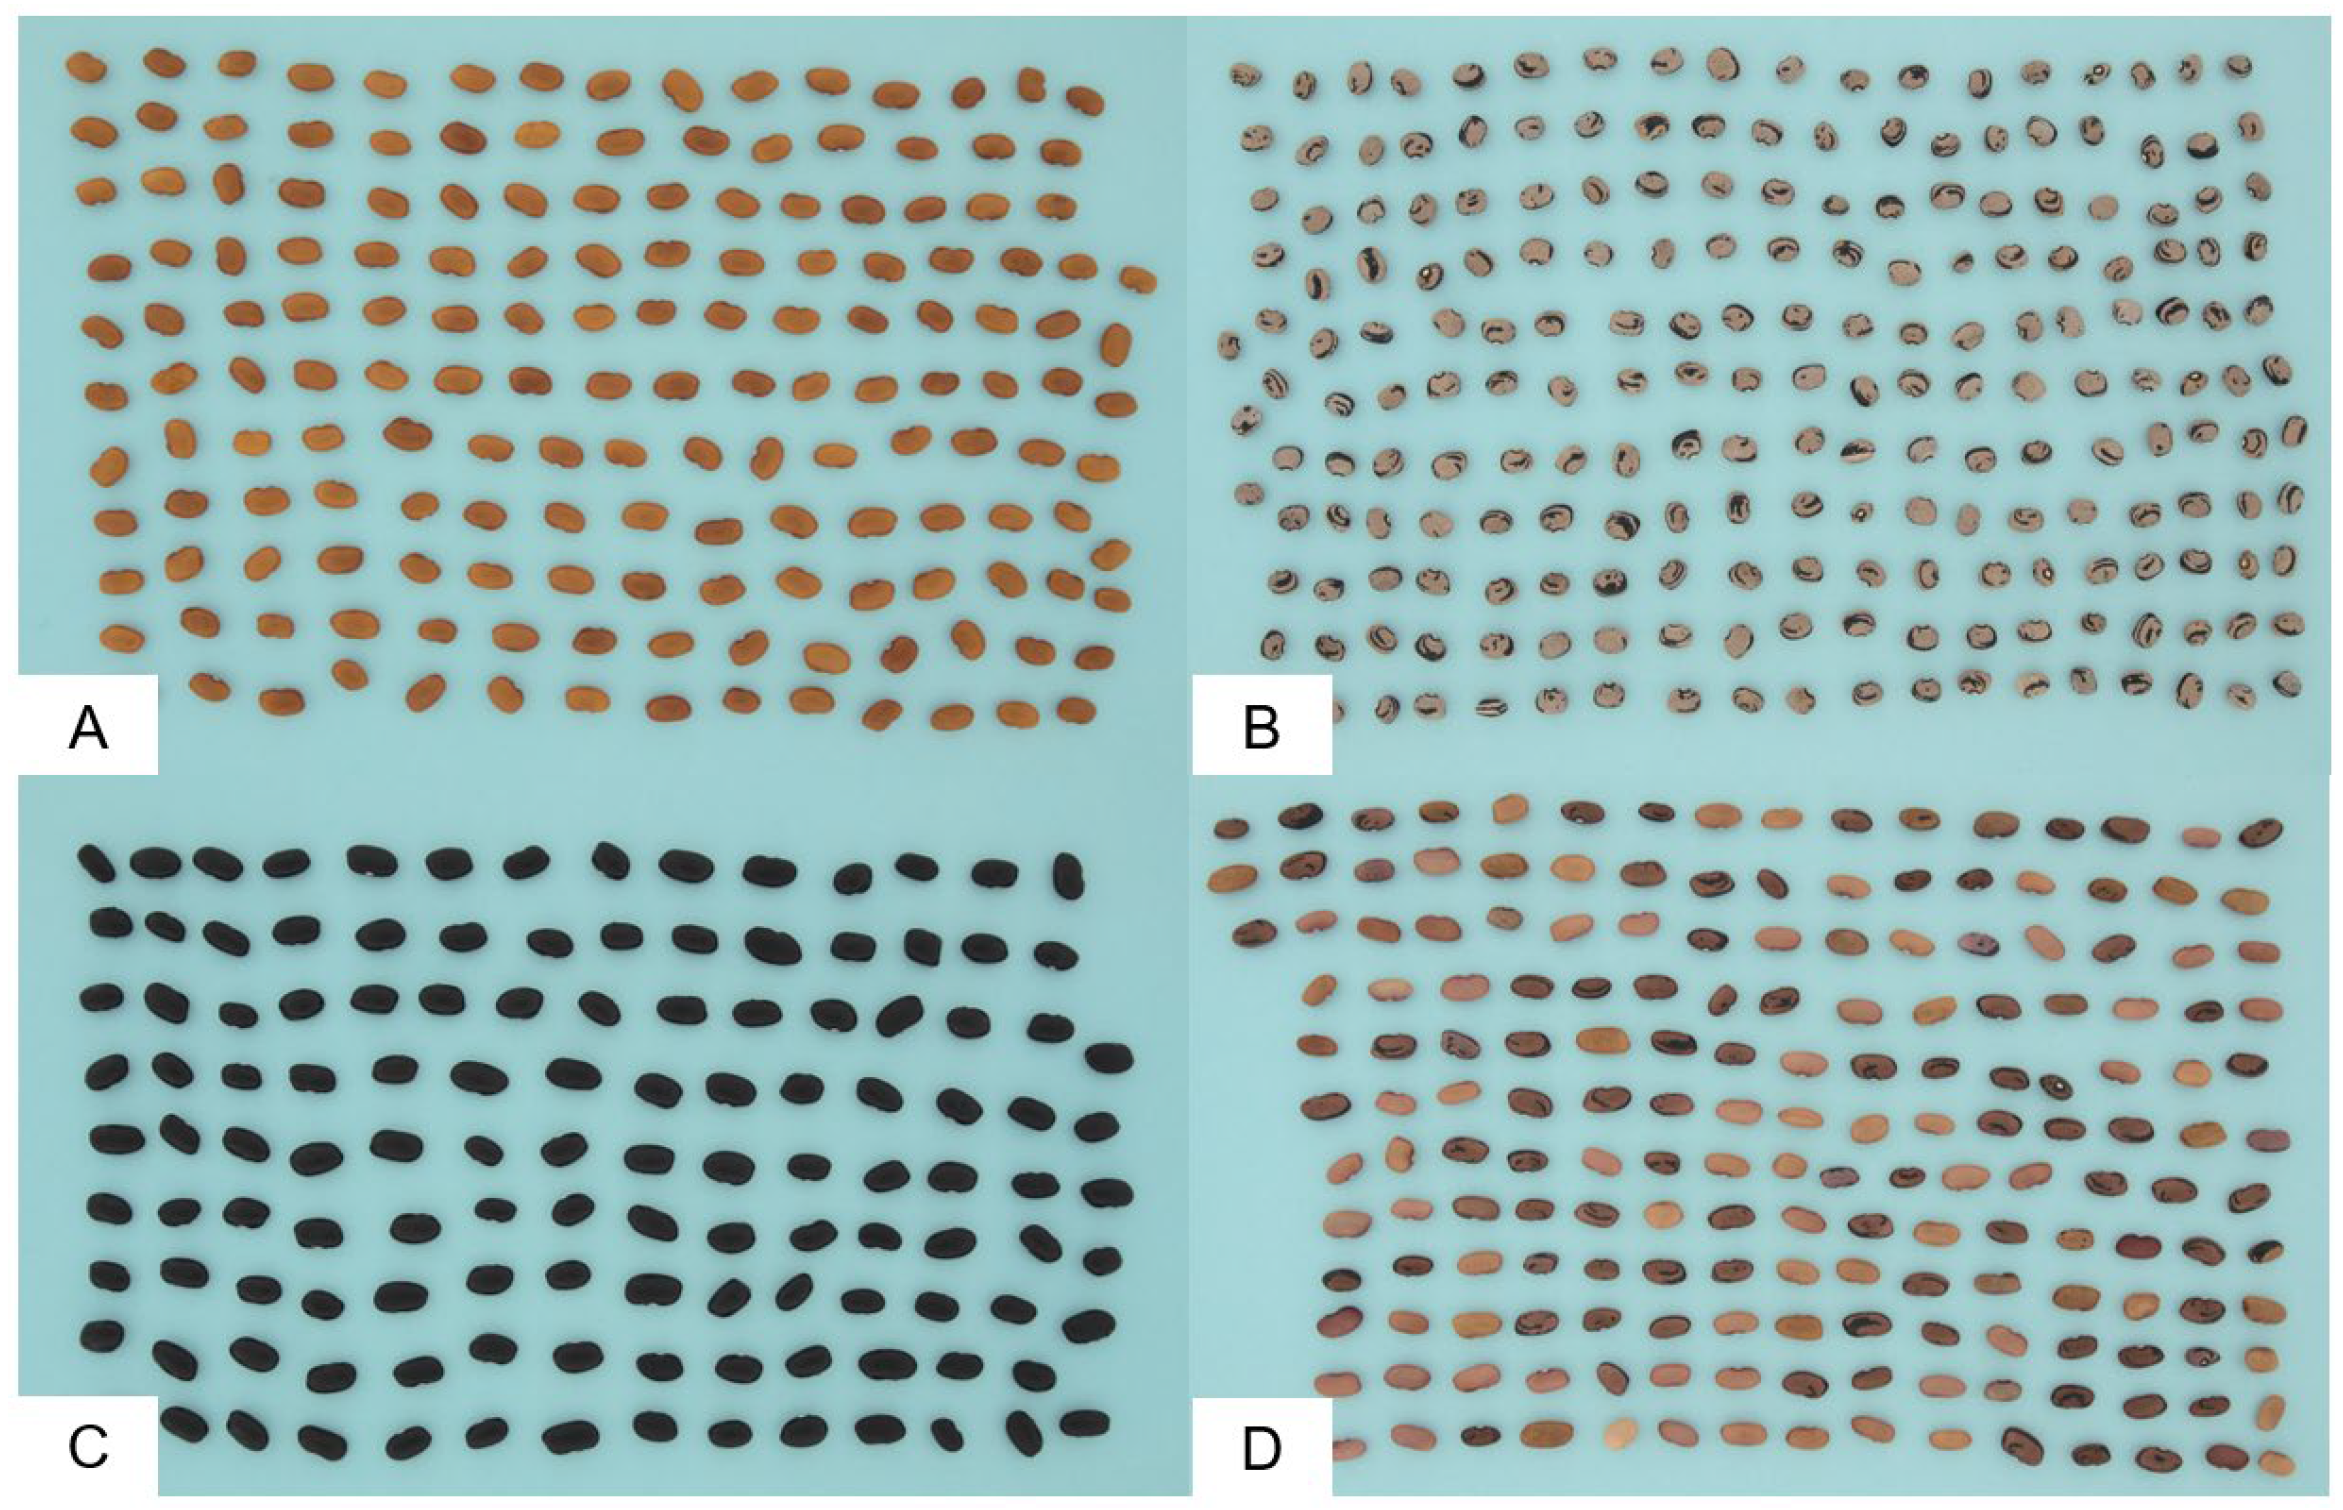
The image acquisition process was carried out before the pH differential method (invasive method) was used to determine the anthocyanin concentration. Figure 2 shows examples of the common bean landraces.

2.3. Quantification of Monomeric Anthocyanins

The procedure carried out for the quantification of anthocyanins in bean landraces was the pH differential method. The seed’s coat was removed after 12 h of immersion in distilled water. Consequently, for 20 min, three grams of the coat was homogenized with 25 mL of a 70:29.5:0.5 v/v/v acetone/water/acetic acid mixture (WiseTis homogenizer, HG-15A, 110 V; DAIHAN brand, Gang-won, Korea), then centrifugation at 4000 rpm took place for 20 min (Hettich centrifuge, Universal 32R, Tuttlingen, Germany), the supernatants were discarded, and the same procedure was repeated with the residues, under identical conditions. Ultimately, the supernatant from each fraction was combined to determine the monomeric anthocyanin content and the concentration of anthocyanins was quantified in the bean seed coat [31].
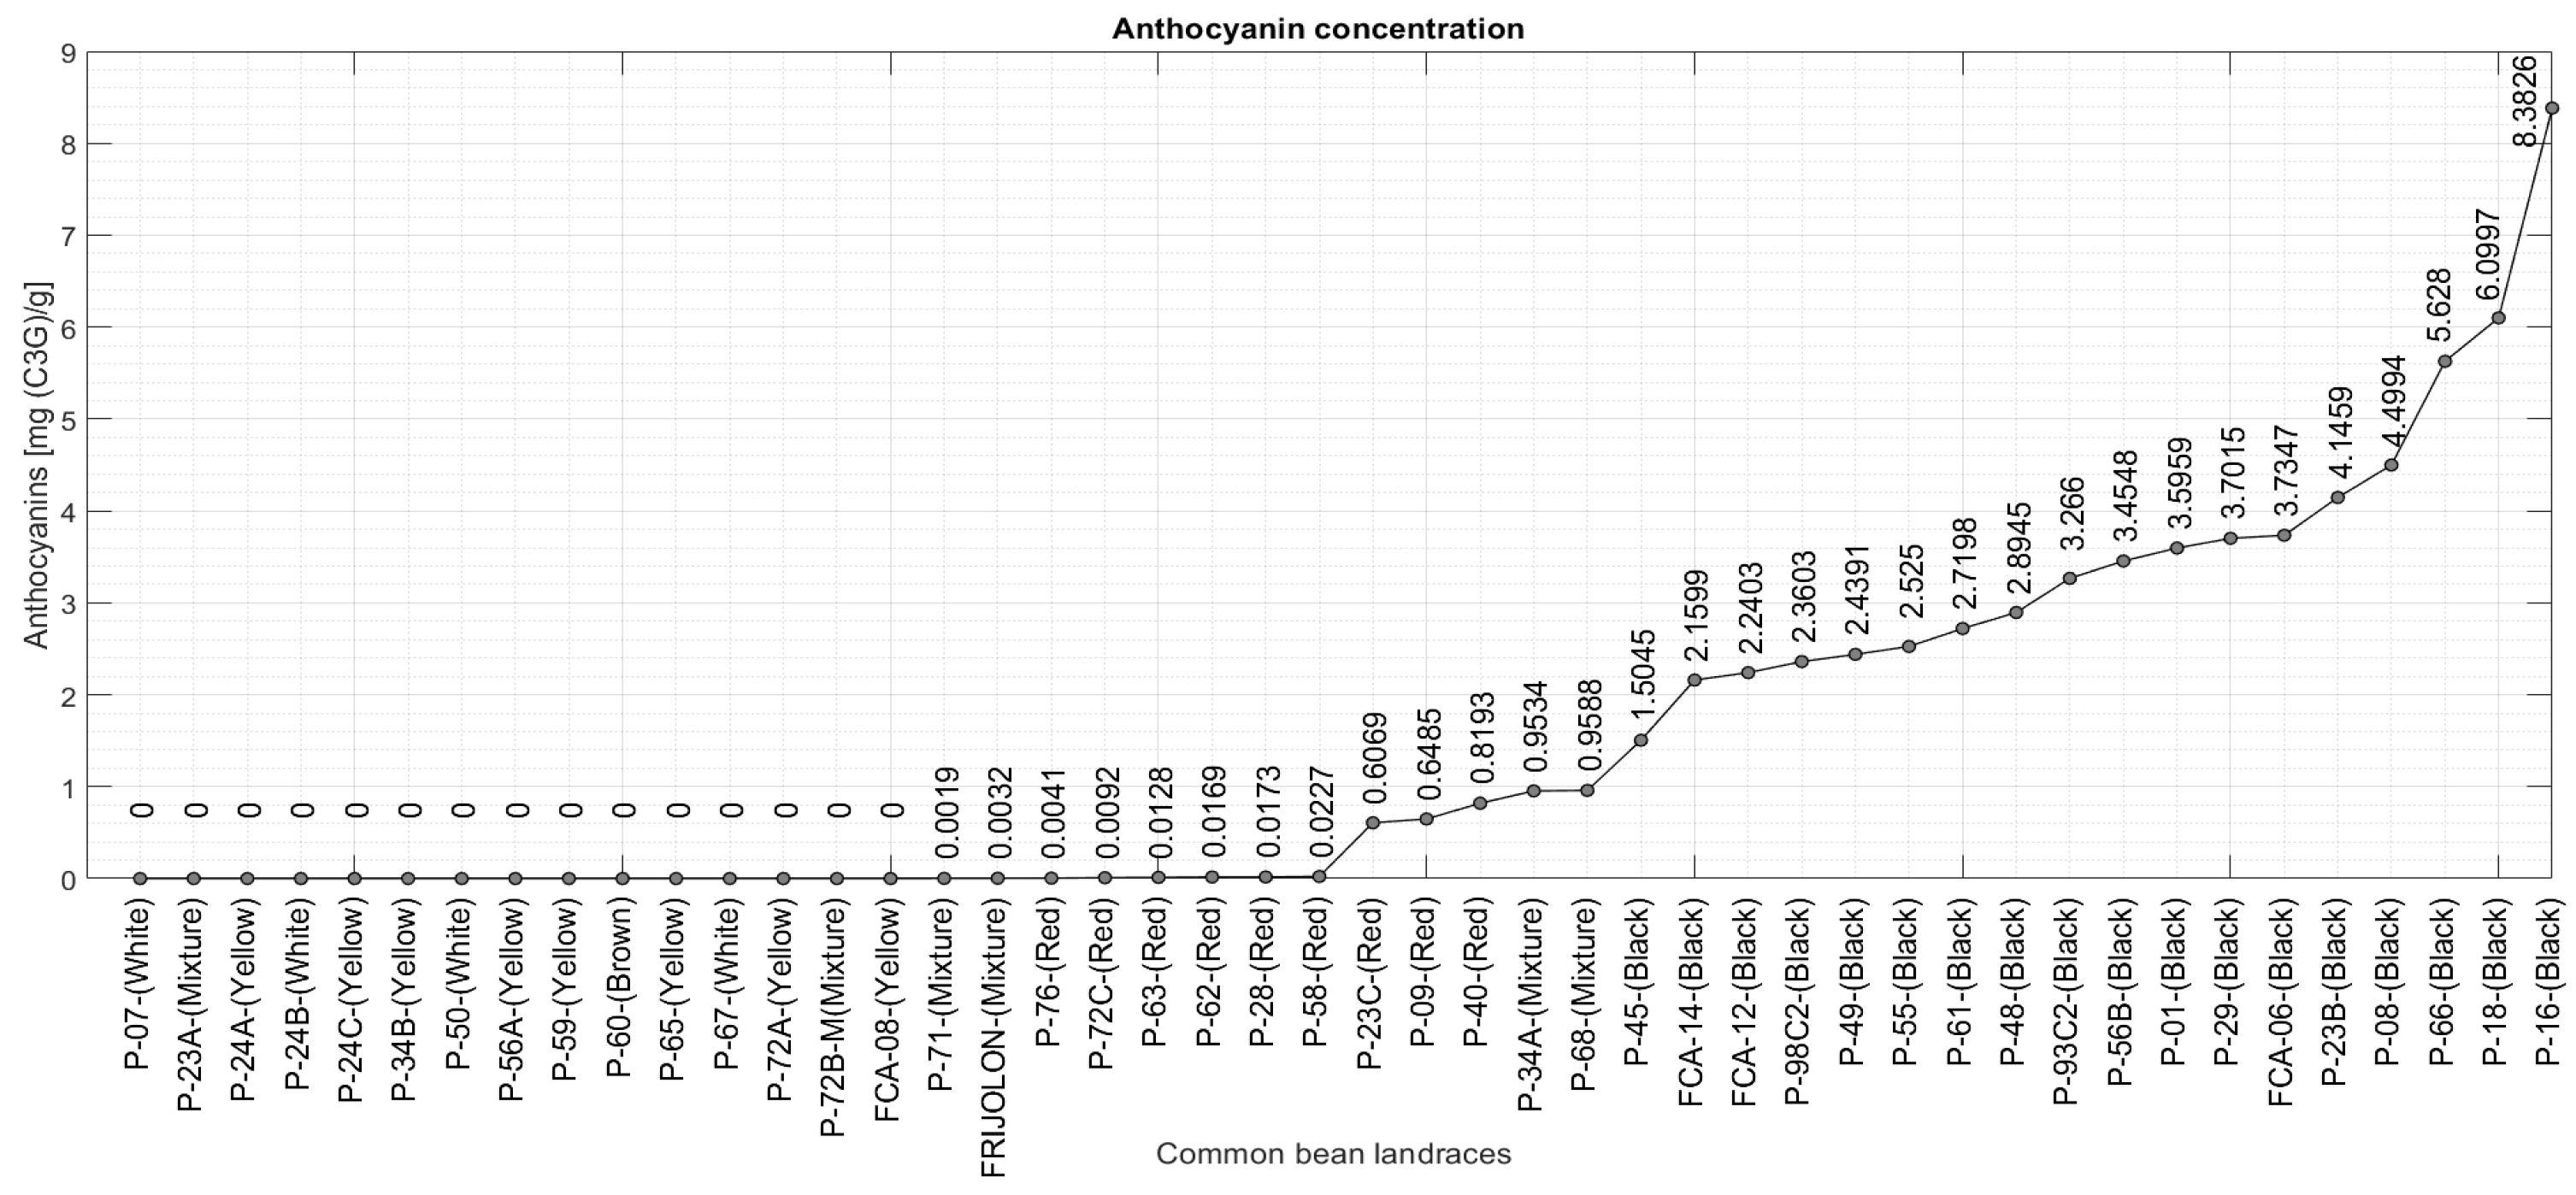
Two extract dilutions were carried out: potassium chloride buffer at pH 1.0 and sodium acetate buffer at pH 4.5. The maximum absorbance was determined by obtaining the absorption spectrum within the 460–710 nm range (Spectrophotometer UV-1800, Shimadzu, Kyoto, Japan). The concentration of monomeric anthocyanins was calculated using the equation described by Giusti and Wrolstad [32]. The results were expressed in mg cyanidin-3-glucoside per gram of dry sample (mg C3G g−1). The results shown in Figure 3 provide a comprehensive overview of the concentration of anthocyanins in each bean landrace, aiding in the comparison and analysis of the data.

2.4. Acquisition System and Image Segmentation

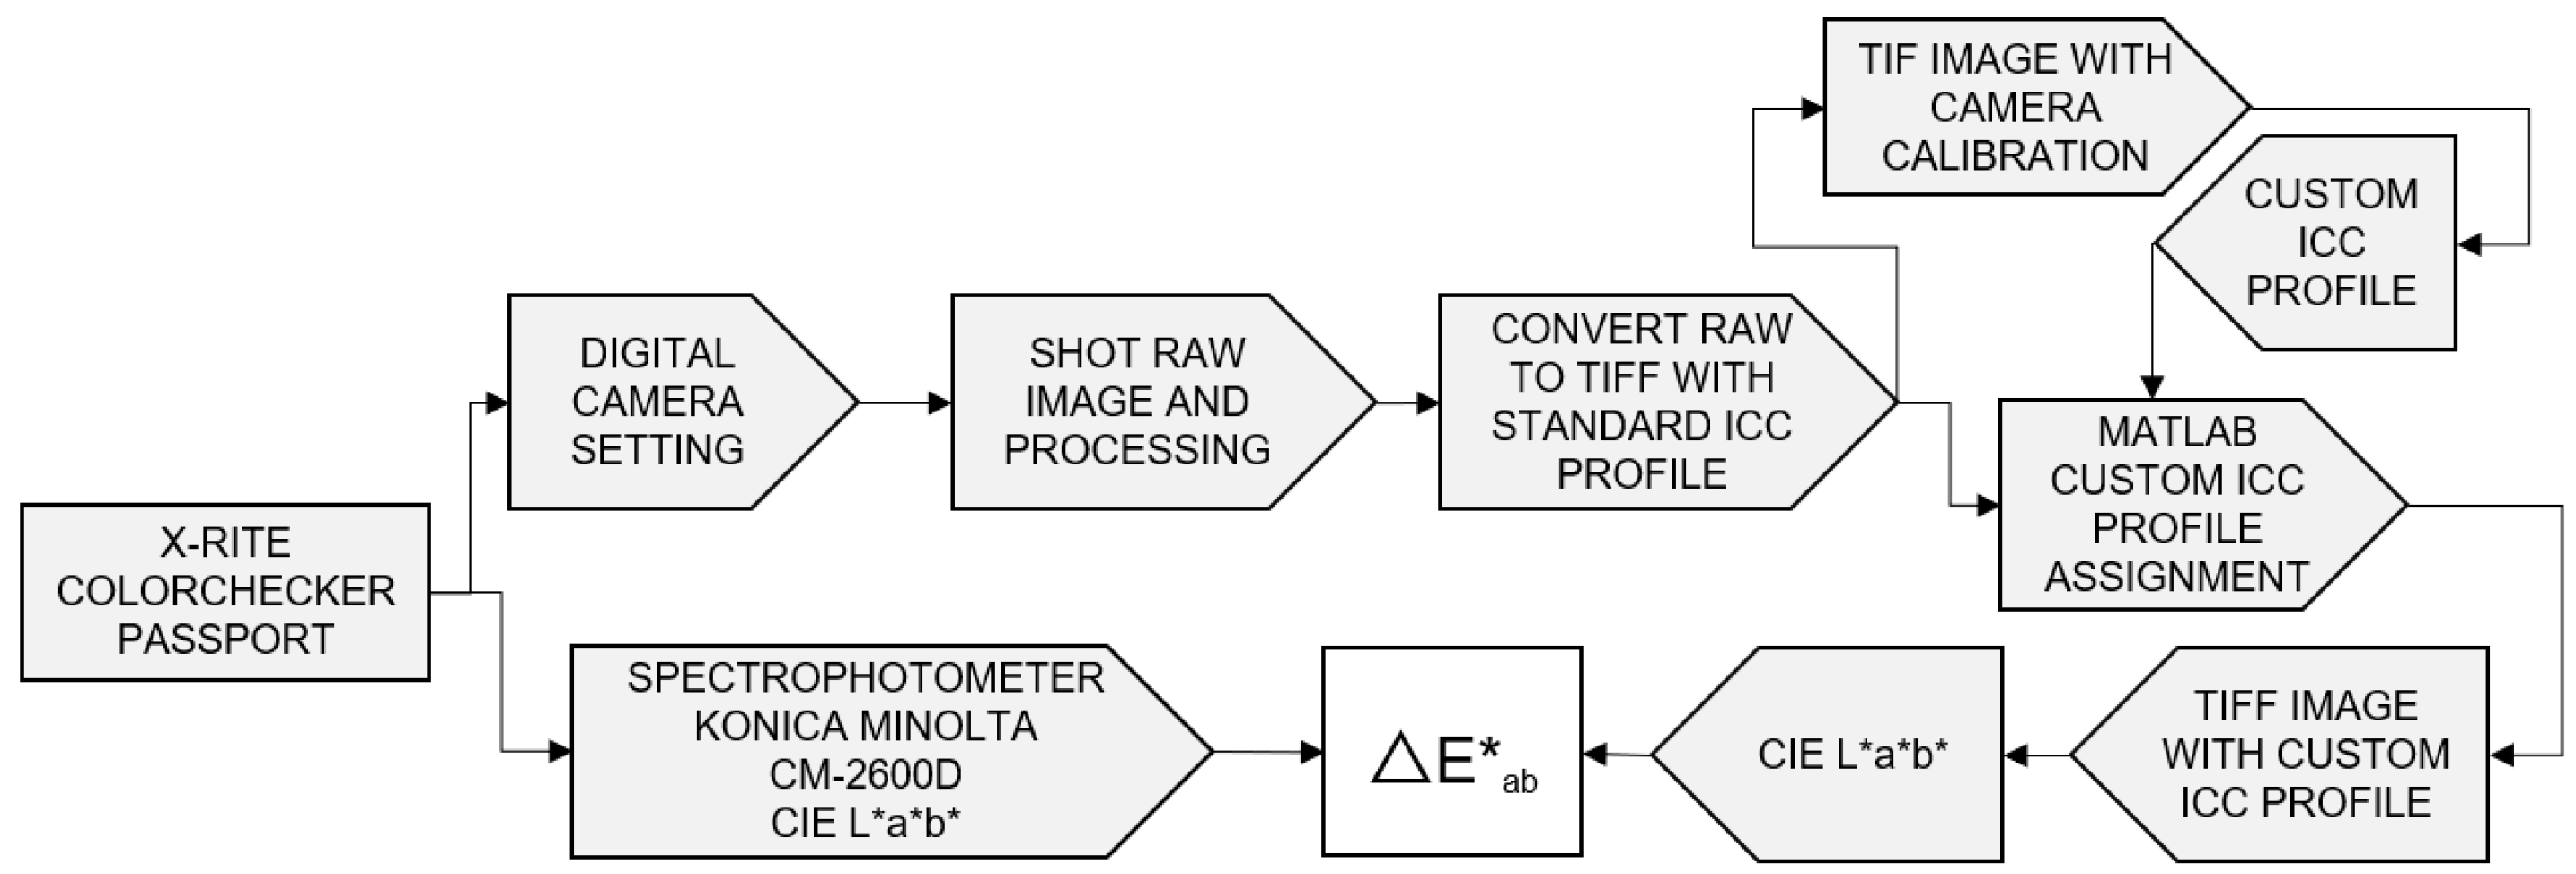
Controlled illumination and a digital camera were required to acquire clear and sharp images for estimating anthocyanins using a computer vision system. An image reproduction workflow, ideally, involving lighting conditions and a shooting configuration were necessary to standardize the photographic acquisitions. The lighting setup was used to maintain uniform illumination and reduce specular glare. The environment contains eight fluorescent light sources, and a diffuser was used to mitigate glare. The configuration involved an aluminum box with the camera lens inserted and installed in the upper section. The chamber configuration used was the one reported by [33]; Figure 4 shows the defined image reproduction workflow, as follows:
  • The color management: First, for the image capture, a SONY ILSE 3500 digital camera was employed, with a focal length of 50 mm, the setting set at ISO 100, a shutter speed of 1/60, an aperture of f/8.0, and a white balance customized to using as a reference the X-Rite ColorChecker Passport’s white inner chart in a controlled environment. Second, the X-Rite ColorChecker Passport’s classic chart with 24 patches, model 2014, was used as a reference for shooting the RAW images; third, to convert the RAW images into TIFF images, the Darktable software 4.4 was used and the color space sRGB without compression and a standard ICC profile was established. Fourth, for the custom ICC profile calculation, X-Rite ColorChecker Camera Calibration v2.0 was utilized to create a custom ICC profile; next, to convert the color space sRGB into CIE L*a*b*, MATLAB software version 2023b and the Image Processing Toolbox were used to replace the standard ICC profile with a custom ICC profile. For a comparison between the laboratory equipment and the image reproduction workflow, a Konica Minolta CM-2600s spectrophotometer was used to measure the 24 patches in the X-Rite ColorChecker Passport’s classic chart; each patch was measured six times and the average of the values of the parameters L*, a*, and b* was determined. Finally, the color accuracy delta E was computed, achieving a maximum value of 11.8 and an average of 5.5.
During the photographic acquisition process of the bean landraces, each landrace was placed on a sliding platform and introduced into the controlled environment to capture the images. Blue paper was used to provide a contrast between the seed color and the background in order to identify the correct seed.
A segmentation algorithm was used to separate the background from the regions of interest. In this case, the seed color of a bean landrace represents the region of interest. For this purpose, a color image segmentation algorithm based on region growing was used [34,35].
The algorithm requires n seeds, which corresponds to the selection of the pixels in the image; such selection is based on user criteria. This algorithm groups the pixels adjacent to the seed based on predetermined similarity measures, so that the region grows in the homogeneous areas of the image. In this work, the alternative adjacent pixel ratio is an 8-connected neighborhood. The similarity metric between the seed and the neighboring pixels is as defined in Equation (1).
E a b = ( L p L s ) 2 + ( a p a s ) 2 + ( b p b s ) 2
where E a b is a CIE color accuracy computed value L*a*b*, (L, a, b) of seed pixel (s) and (L, a, b) of neighboring pixel (p).
The selected seed corresponds to the area of the image’s background color, and the algorithm stops when no pixel meets the similarity criterion. The algorithm was used to segment the background of each bean landrace image (see Figure 5).

2.5. Neuroevolution and DeepGA

Neuroevolution utilizes evolutionary algorithms to create evolved neural networks [36,37]. The process begins by initializing a group of genomes, each representing a neural network that can be decoded.
These genomes are the population; each genome or individual is assigned a fitness score based on the neural network’s ability to complete the classification or regression task.
The parent selection for the best chosen individuals is conducted using the tournament approach during the crossover process. Genetic crossover operators combine two individuals to generate offspring and evaluate their performance. The mutation process generates new information in the inner population to reach uncovered areas in the search space.
The resulting offspring with higher fitness replace the lower fitness genotypes in the population; the process is executed for each generation. The process constitutes a search for better genotypes, until a sufficiently high-fitness network is found [38]. In neuroevolution, a population of genetic neural network encodings evolves to discover a network capable of solving a given task.
DeepGA is a neuroevolution algorithm, an evolutionary framework that uses a genetic algorithm to evolve a convolutional neural network (CNN) [39]. DeepGA defines hybrid coding to represent CNNs using two levels. In the first level, there are convolutional blocks, where each block represents one convolutional layer with a variable number of filters and sizes, a stride of 1 and zero padding, batch normalization, and an ReLU activation function. Additionally, this is followed by a fully connected block for registering the number of neurons. Finally, the second level uses binary coding to describe the connections between layers, with connections represented as one and non-connections as zero. The result is a competitive CNN with fewer convolutional layers [39].
Moreover, DeepGA evolves convolutional neural networks suitable for processing two-dimensional histograms. DeepGA regression allows evolving convolutional neural networks, and this algorithm will seek an efficient architecture for estimating anthocyanins. Its advantage is focused on optimizing the CNN architecture by reducing the number of parameters.

2.6. Data Splitting

In this phase, 46 bean landraces with homogeneous and heterogeneous coloration were used; the homogeneous color landraces were made up of seeds of similar coloration, which allows the possibility of defining several partitions per sample. On the other hand, the heterogeneous color landraces presented a mixture of seeds with different colorations, limiting the exploration of data partitions.
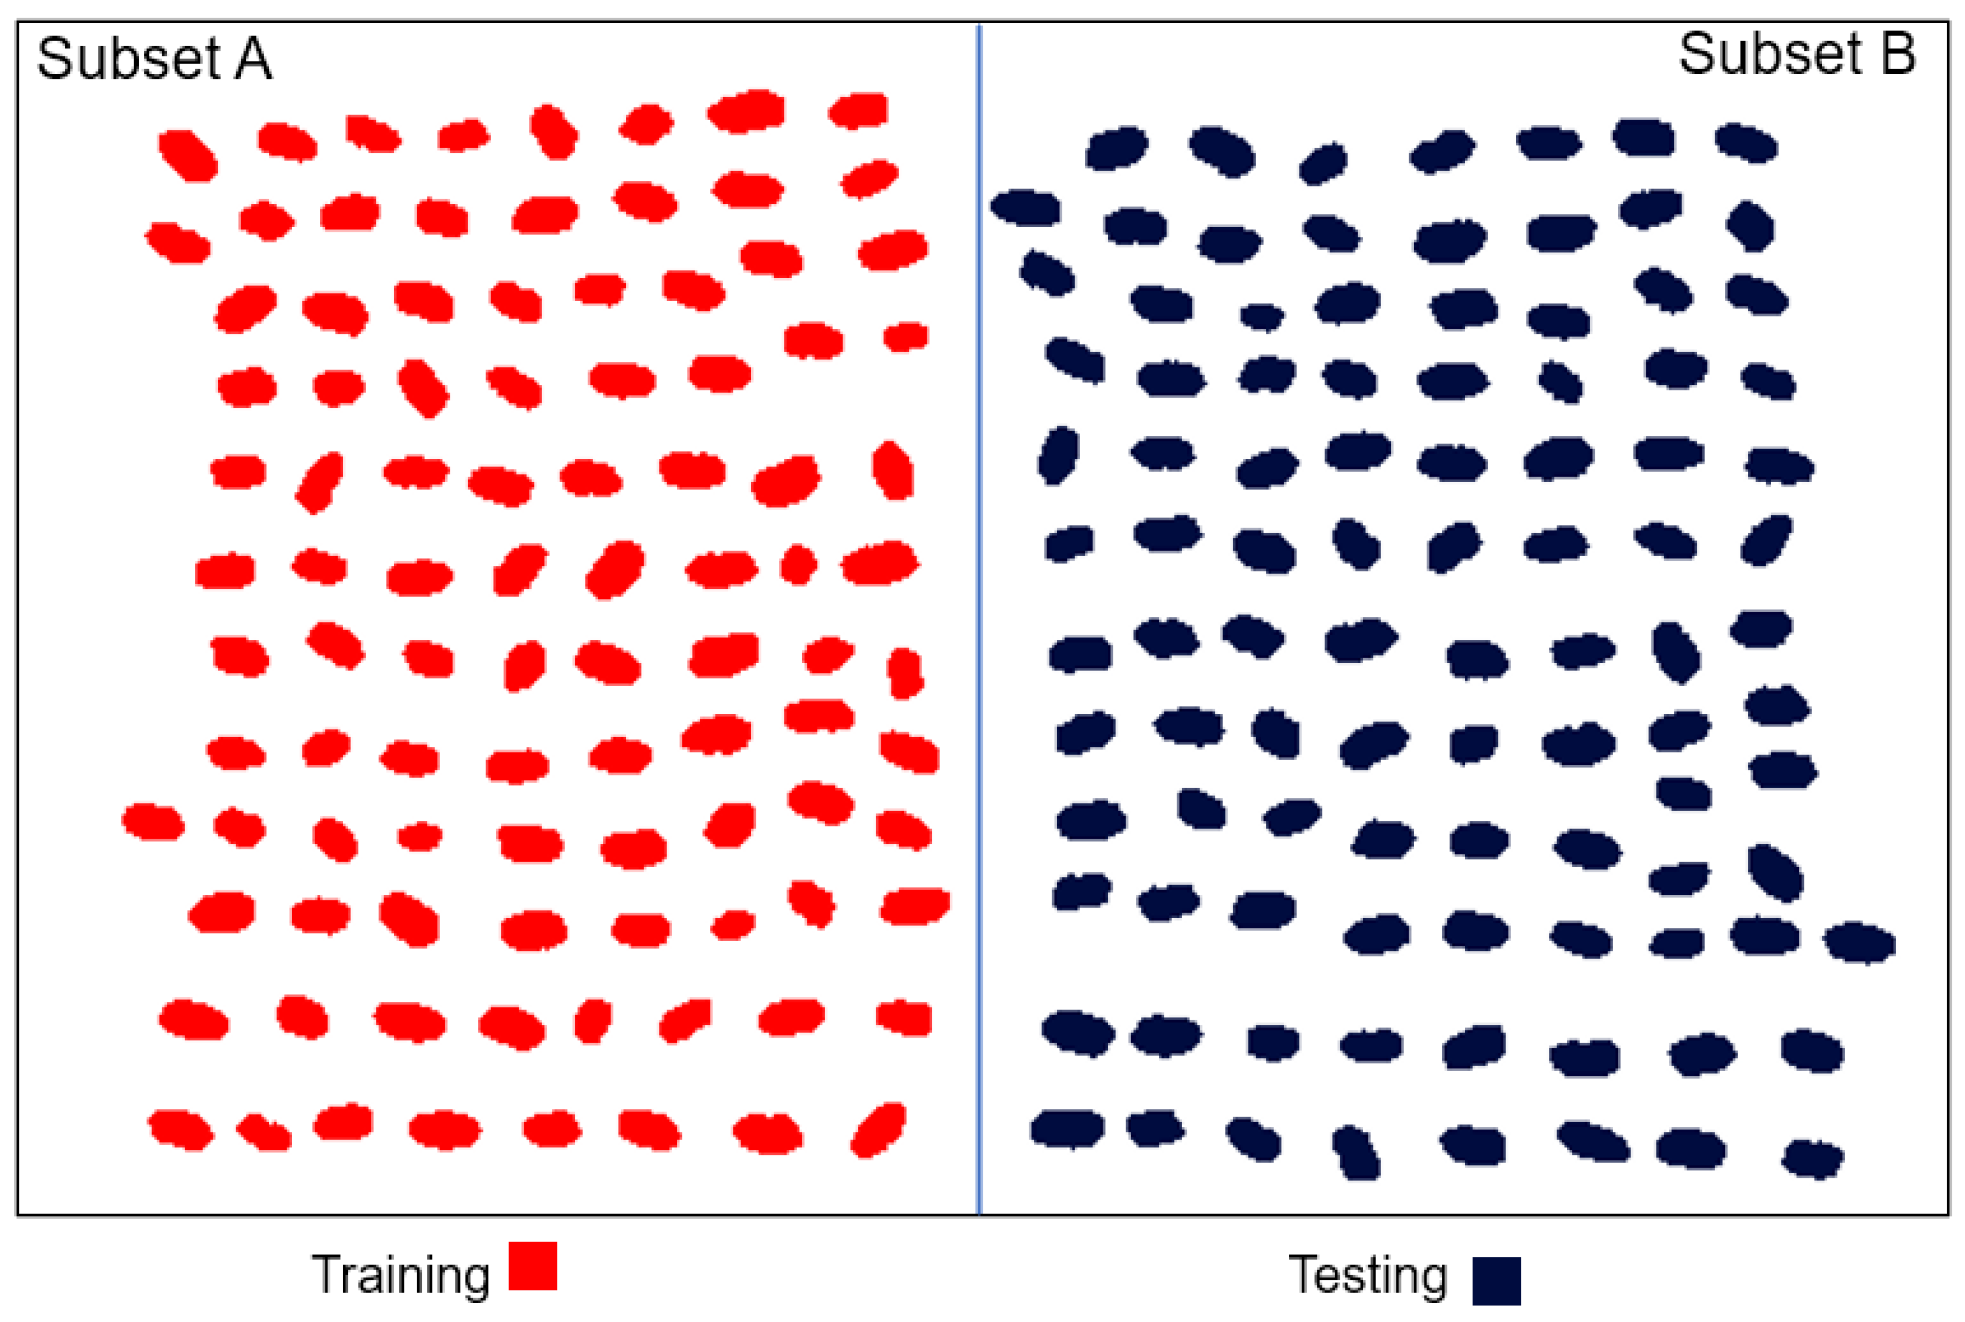
It should be noted that the concentration of anthocyanins in bean landraces with heterogeneous coloration (consisting of seeds with different colorations) is determined by the different colorations of the seeds. If it has more black seeds, this landrace will have a higher concentration of anthocyanins than a bean landrace of other colorations with fewer black seeds. In other words, the concentration of anthocyanins is variable depending on the coloration of the seeds of a given bean landrace. Therefore, given the variability of the anthocyanin concentration due to the different colorations that a heterogeneous bean landrace can present, the separation of 50% of the seeds of each bean landrace into two sets was carried out to maintain homogeneity in the sampling, as shown in Figure 6.
The process consisted of random sampling for each bean landrace and performing a 50% separation using digital image processing. Two two-dimensional histograms were created from each separation to measure the distance between the partitions. The lower the value, the greater the similarity between the partitions. Two hundred iterations were performed, and the partition with the lowest value was recorded.
There is evidence that the Manhattan distance is a suitable metric. It is the similarity metric used to compare two-dimensional histograms and provided the best classification results with the K-nearest neighbors algorithm [33].

2.7. Color Characterization Using a Probability Mass Function

In this work, the HSI and CIE L*a*b* color spaces were used to characterize the color of bean landraces, which are known to be close to human visual color perception. Additionally, the chromaticity channels can be decoupled from the luminosity channel.
A probability mass function allows for characterizing the color of a set of seeds; therefore, this work considered a joint probability mass function (PMF).
Given two discrete random variables, X and Y, a joint probability distribution or probability mass function (PMF) is defined as f ( X , Y ) = P ( X = x , Y = y ) , where f X , Y represents the probability of the occurrence of x and y values, subject to the following conditions:
  • f ( x , y ) 0   f o r   a l l   ( x , y ) ,
  • x y f ( x , y ) = 1
  • P ( X = x , Y = y ) = f ( x , y )
To calculate the joint probability of a pair of channels, each pixel value in two channels is counted position by position, and the frequency of the occurrence of the pixel value is given by Equation (2).
p m f i , j = p i j n  
where p m f i , j is the joint probability of two channels, p i j represents the frequency of the occurrence of the pair of pixel values, and n represents the total number of occurrence frequencies of p i j .
The 8-bit images consist of 256 unique grayscale levels, allowing the creation of a matrix with the dimensions 256 × 256 . In CIE L*a*b*, to account for the dominance of the chromaticity channels a* and b* [−128, 127], the change was computed by adding each pixel’s values and the lower limit’s absolute value. The L* channel represents perceptual lightness, defined as 0 and 100 for black and white colors, respectively. The values in the L* channel were normalized for rescaling to [0–255]. For H, S, and I, the values were scaled to their corresponding values within the interval [0–255].
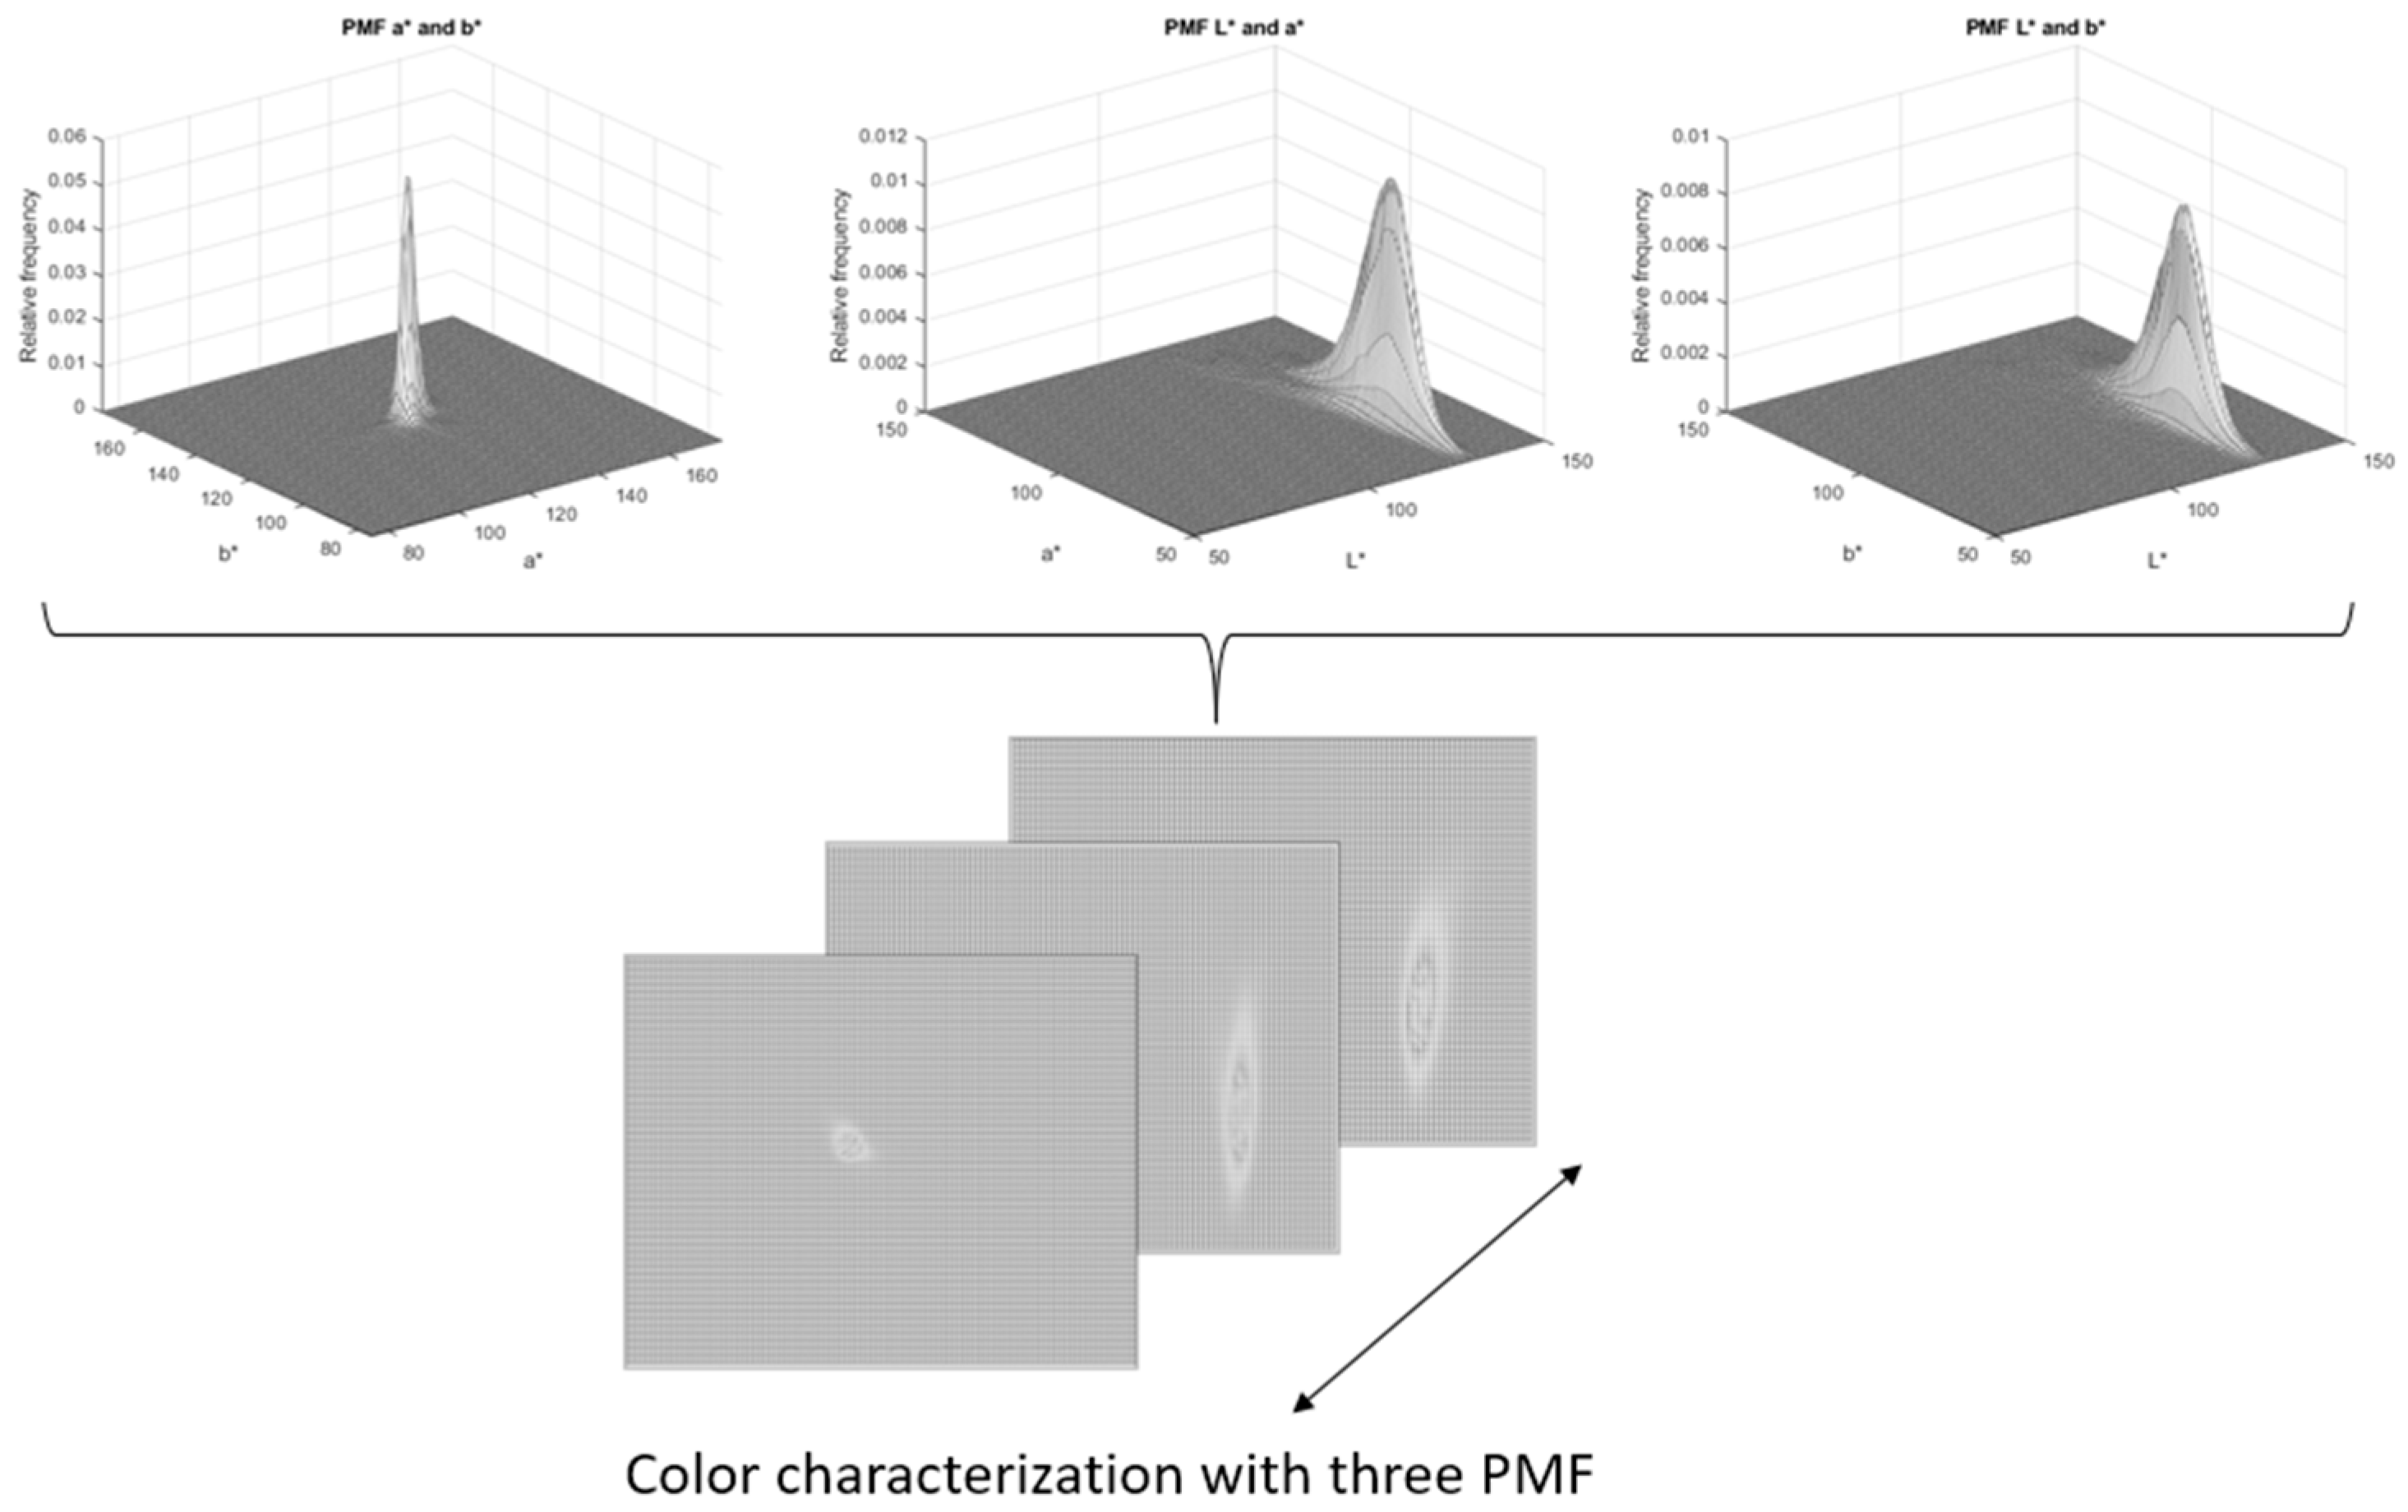
Based on the above information, two-dimensional histograms can be generated utilizing channel data from the CIE L*a*b* and HSI color spaces. The color characterization of each bean landrace was constructed using three two-dimensional histograms, a histogram of a* and b*, a histogram of L* and a*, and a histogram of L* and b*, obtained from the CIE L*a*b* color space. The same procedure was applied to characterize the color in the HSI color space; a histogram of H and S, a histogram of H and I and, finally, a histogram of S and I, were obtained.
This color characterization contribution is a solution with a lower computational cost compared to the generation and management of 3D histograms, which are 256 × 256 × 256 cubes. The final characterization is a 256 × 256 × 3 matrix (see Figure 7).
Two datasets were created: the first using information from the two-dimensional histograms and the second by combining three two-dimensional histograms. Additionally, experiments were conducted using neuroevolution techniques, specifically the DeepGA algorithm.

2.7.1. Metric Performance

For evaluations of the model regression task, several metrics for measuring the estimation performance of continuous values were considered. The root mean square error (RMSE) measures the differences between a model’s predicted and reference values. The determination coefficient R 2 is used to measure the goodness of fit and assess the accuracy of the regression. It represents the proportion of the variance in the dependent variable predicted by the independent variable. Additionally, to understand how the prediction values approximated the reference values in percentage terms, the mean absolute percentage error (MAPE) metric was employed (Equation (3)). With this metric, a lower error value indicates that the predicted value is close to the reference value.
M A P E = i = 1 n y i y ^ i y i 100 n
Equation (4) was included as a complement to the MAPE to determine the precision of the estimation value, where high values are desirable for anthocyanin estimation.
P r e c i s i o n = 100 M A P E

2.7.2. Experiment Design

Four trials were performed with DeepGA to determine the contribution of the CIE L*a*b* luminosity channel and the intensity channel of HSI. Table 1 shows the values assigned to the hyperparameters in the DeepGA configuration for the regression task, especially to maintain the same conditions for all the experiments.

2.7.3. CNN Optimized through DeepGA

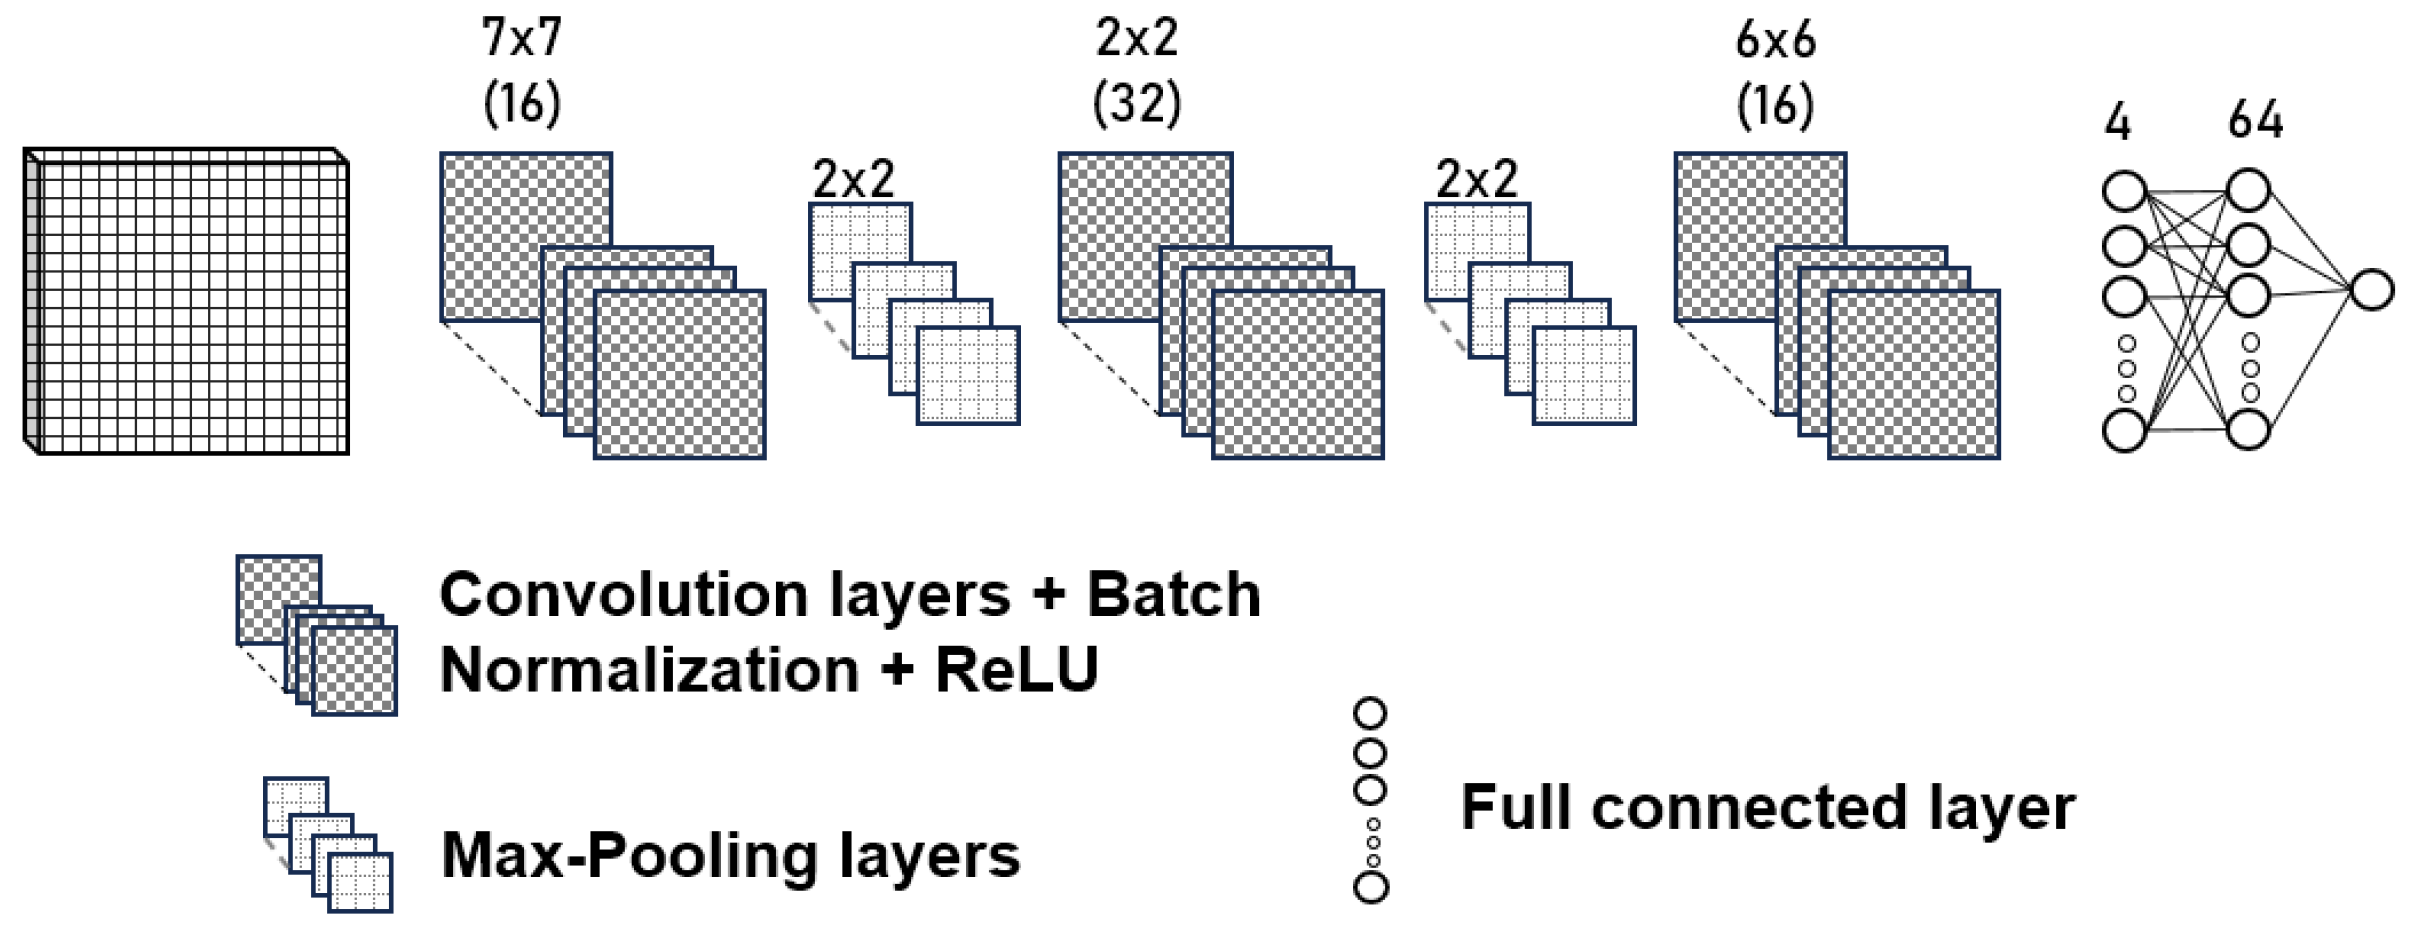
DeepGA, for the regression task, was run four times using four different color characterizations. As a result, the same CNN architecture was generated for all color characterizations in the experiments. Figure 8 shows the resulting network architecture comprising three convolutional layers, with batch normalization and an ReLU function. The first layer contains 16 filters of 7 × 7 and the second layer includes 32 filters of 2 × 2. Both layers have padding and a stride size of 2 for the max pooling. The third layer contains 16 filters of 6 × 6, a max-pooling layer with a padding of 4 and a stride size of 2. Finally, two fully connected layers and a regression layer were found to obtain the estimation value.
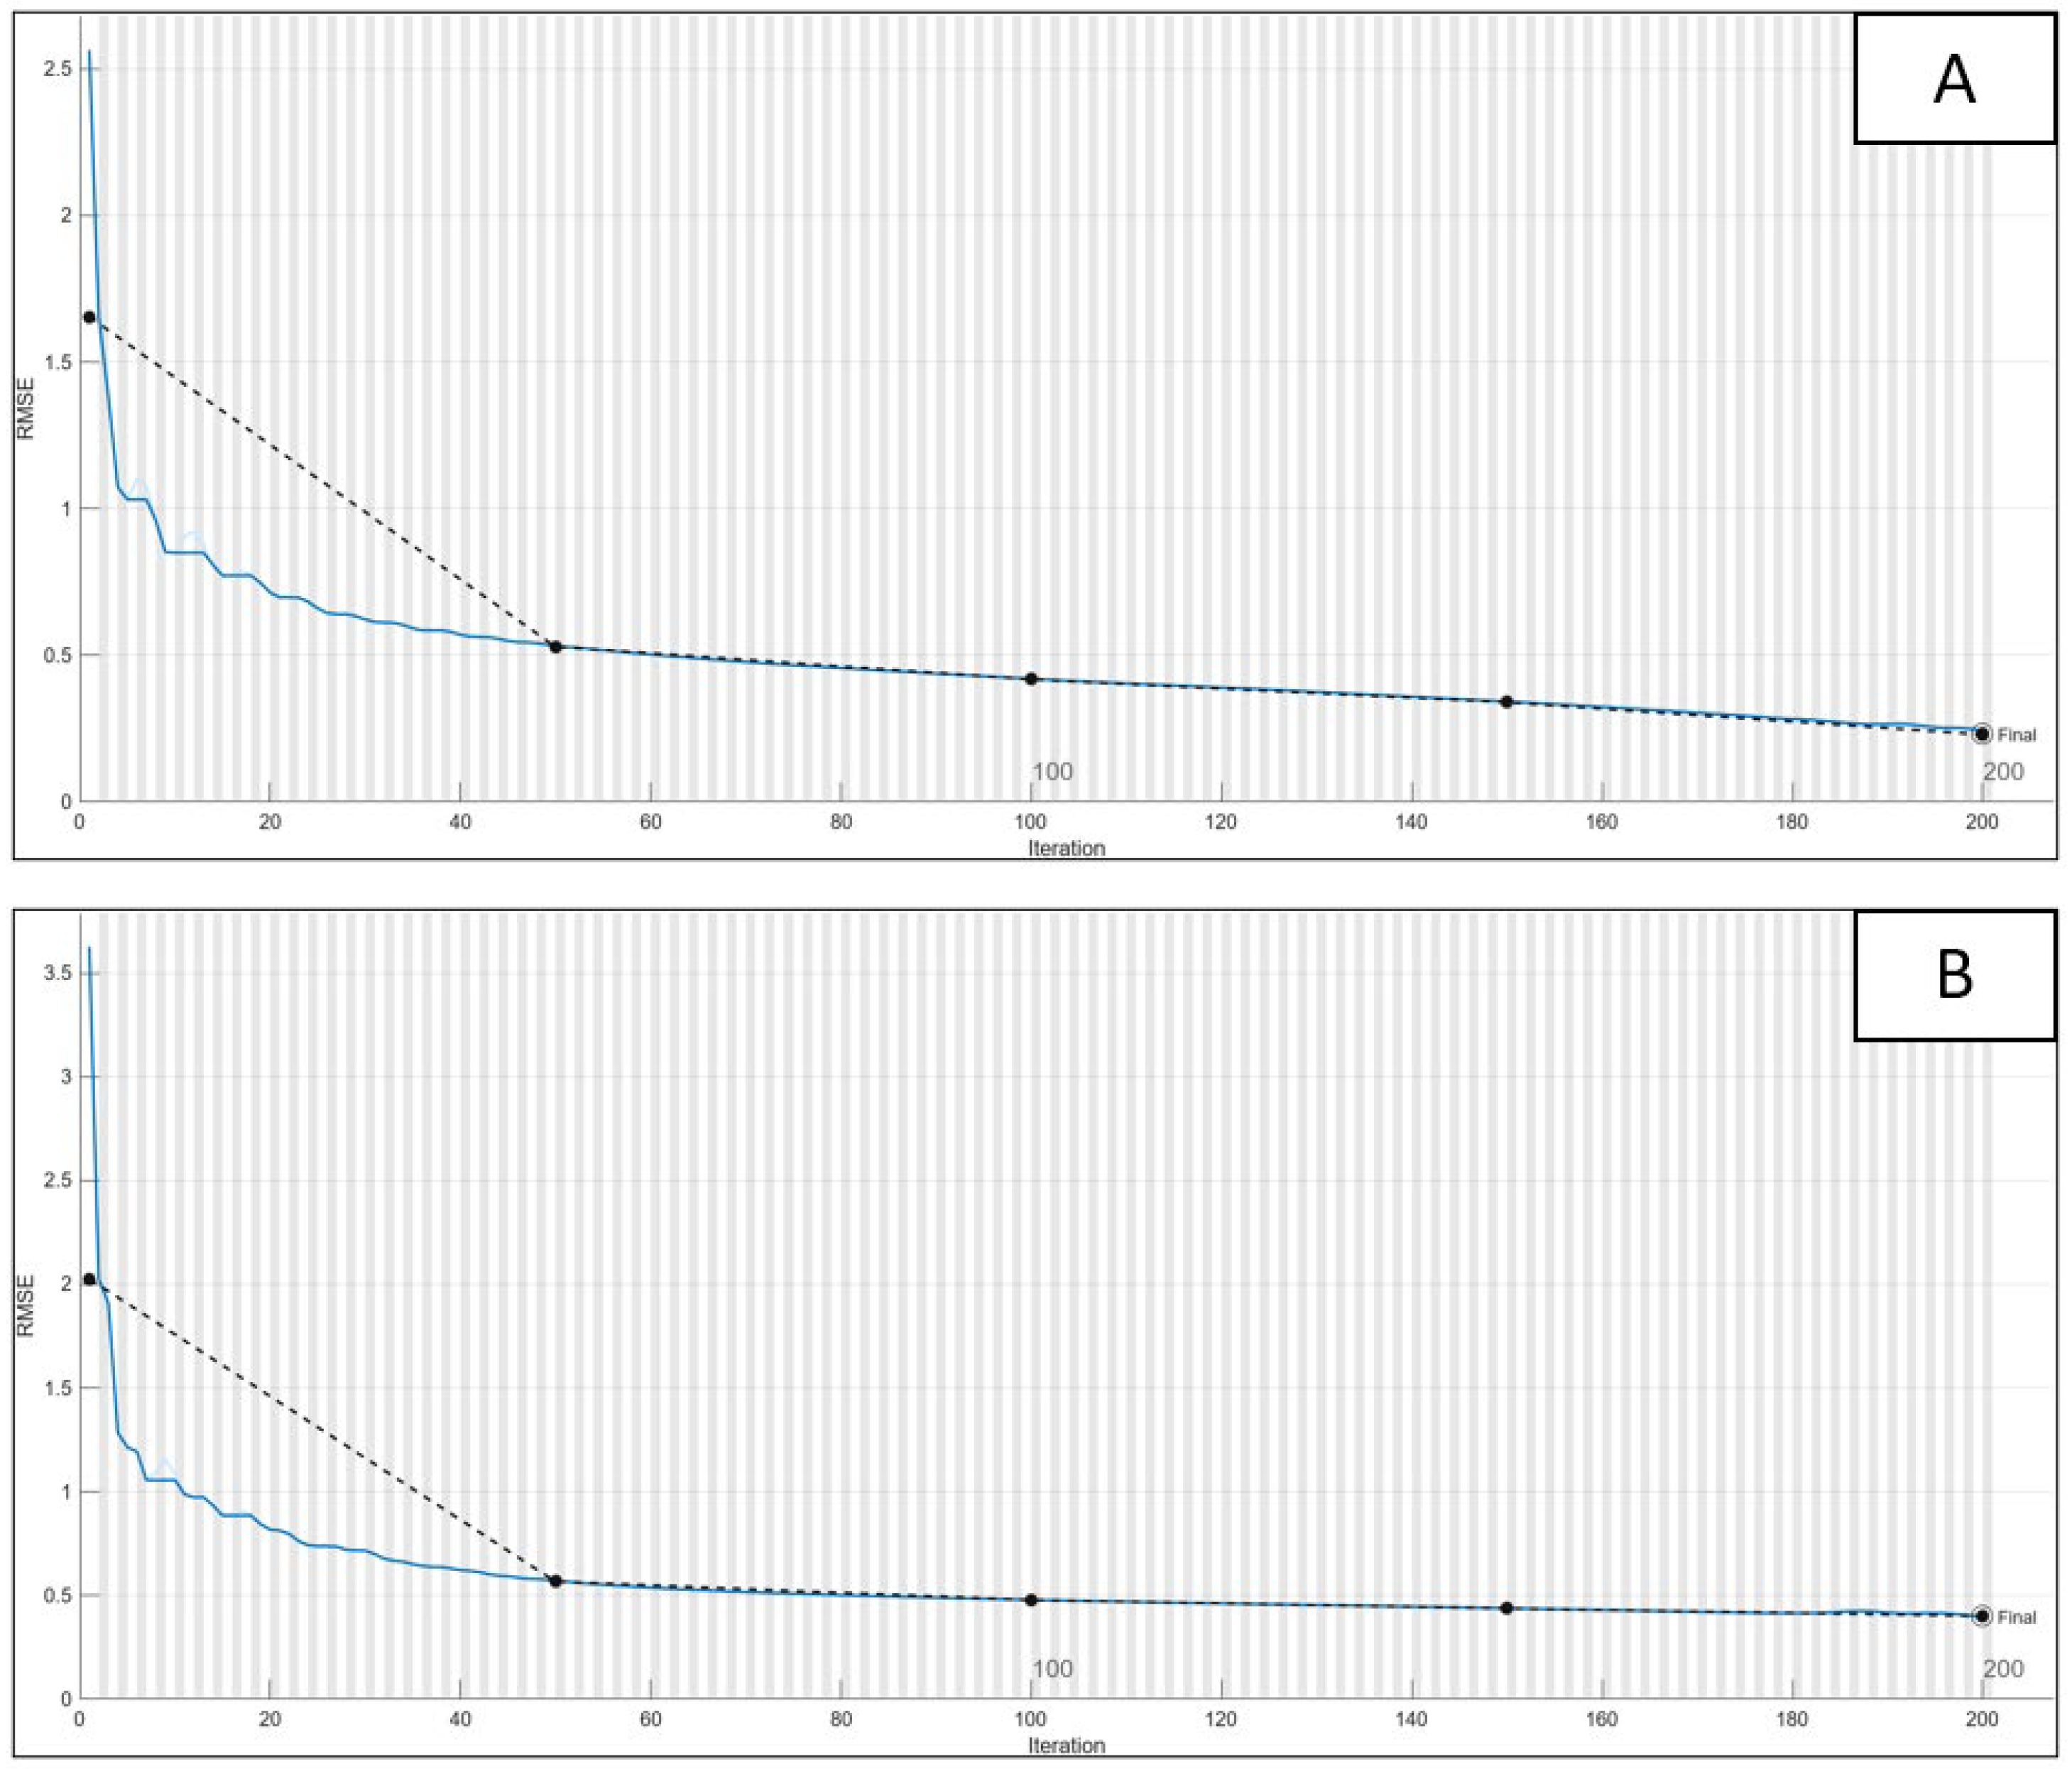
Moreover, the CNN was trained on 200 epochs, with a learning rate of 0.001 and adaptive moment estimation abilities. In Figure 9, we can observe the training curve; due to the type of data partitioning in terms of the training and test set, it should be noted that the validation data were the same as the training data used in the training process.
A normality test (Shapiro–Wilk test) was conducted to analyze the differences between the estimation results using four color characterizations and a suitable statistical test. Then, to accept the null hypothesis of normality that indicates data that follow a normal distribution, a parametric test with a one-way analysis of variance (ANOVA) was applied, setting a 95% confidence level. The validation used was the post hoc test called Tukey’s test.

3. Results

Results of Anthocyanin Estimation Using the Color Characterization Represented by One Two-Dimensional Histogram and Our Contribution on Color Characterization

The evaluation results on the performance of the convolutional neural networks using the histograms of the chromaticity channels are shown in Table 2.
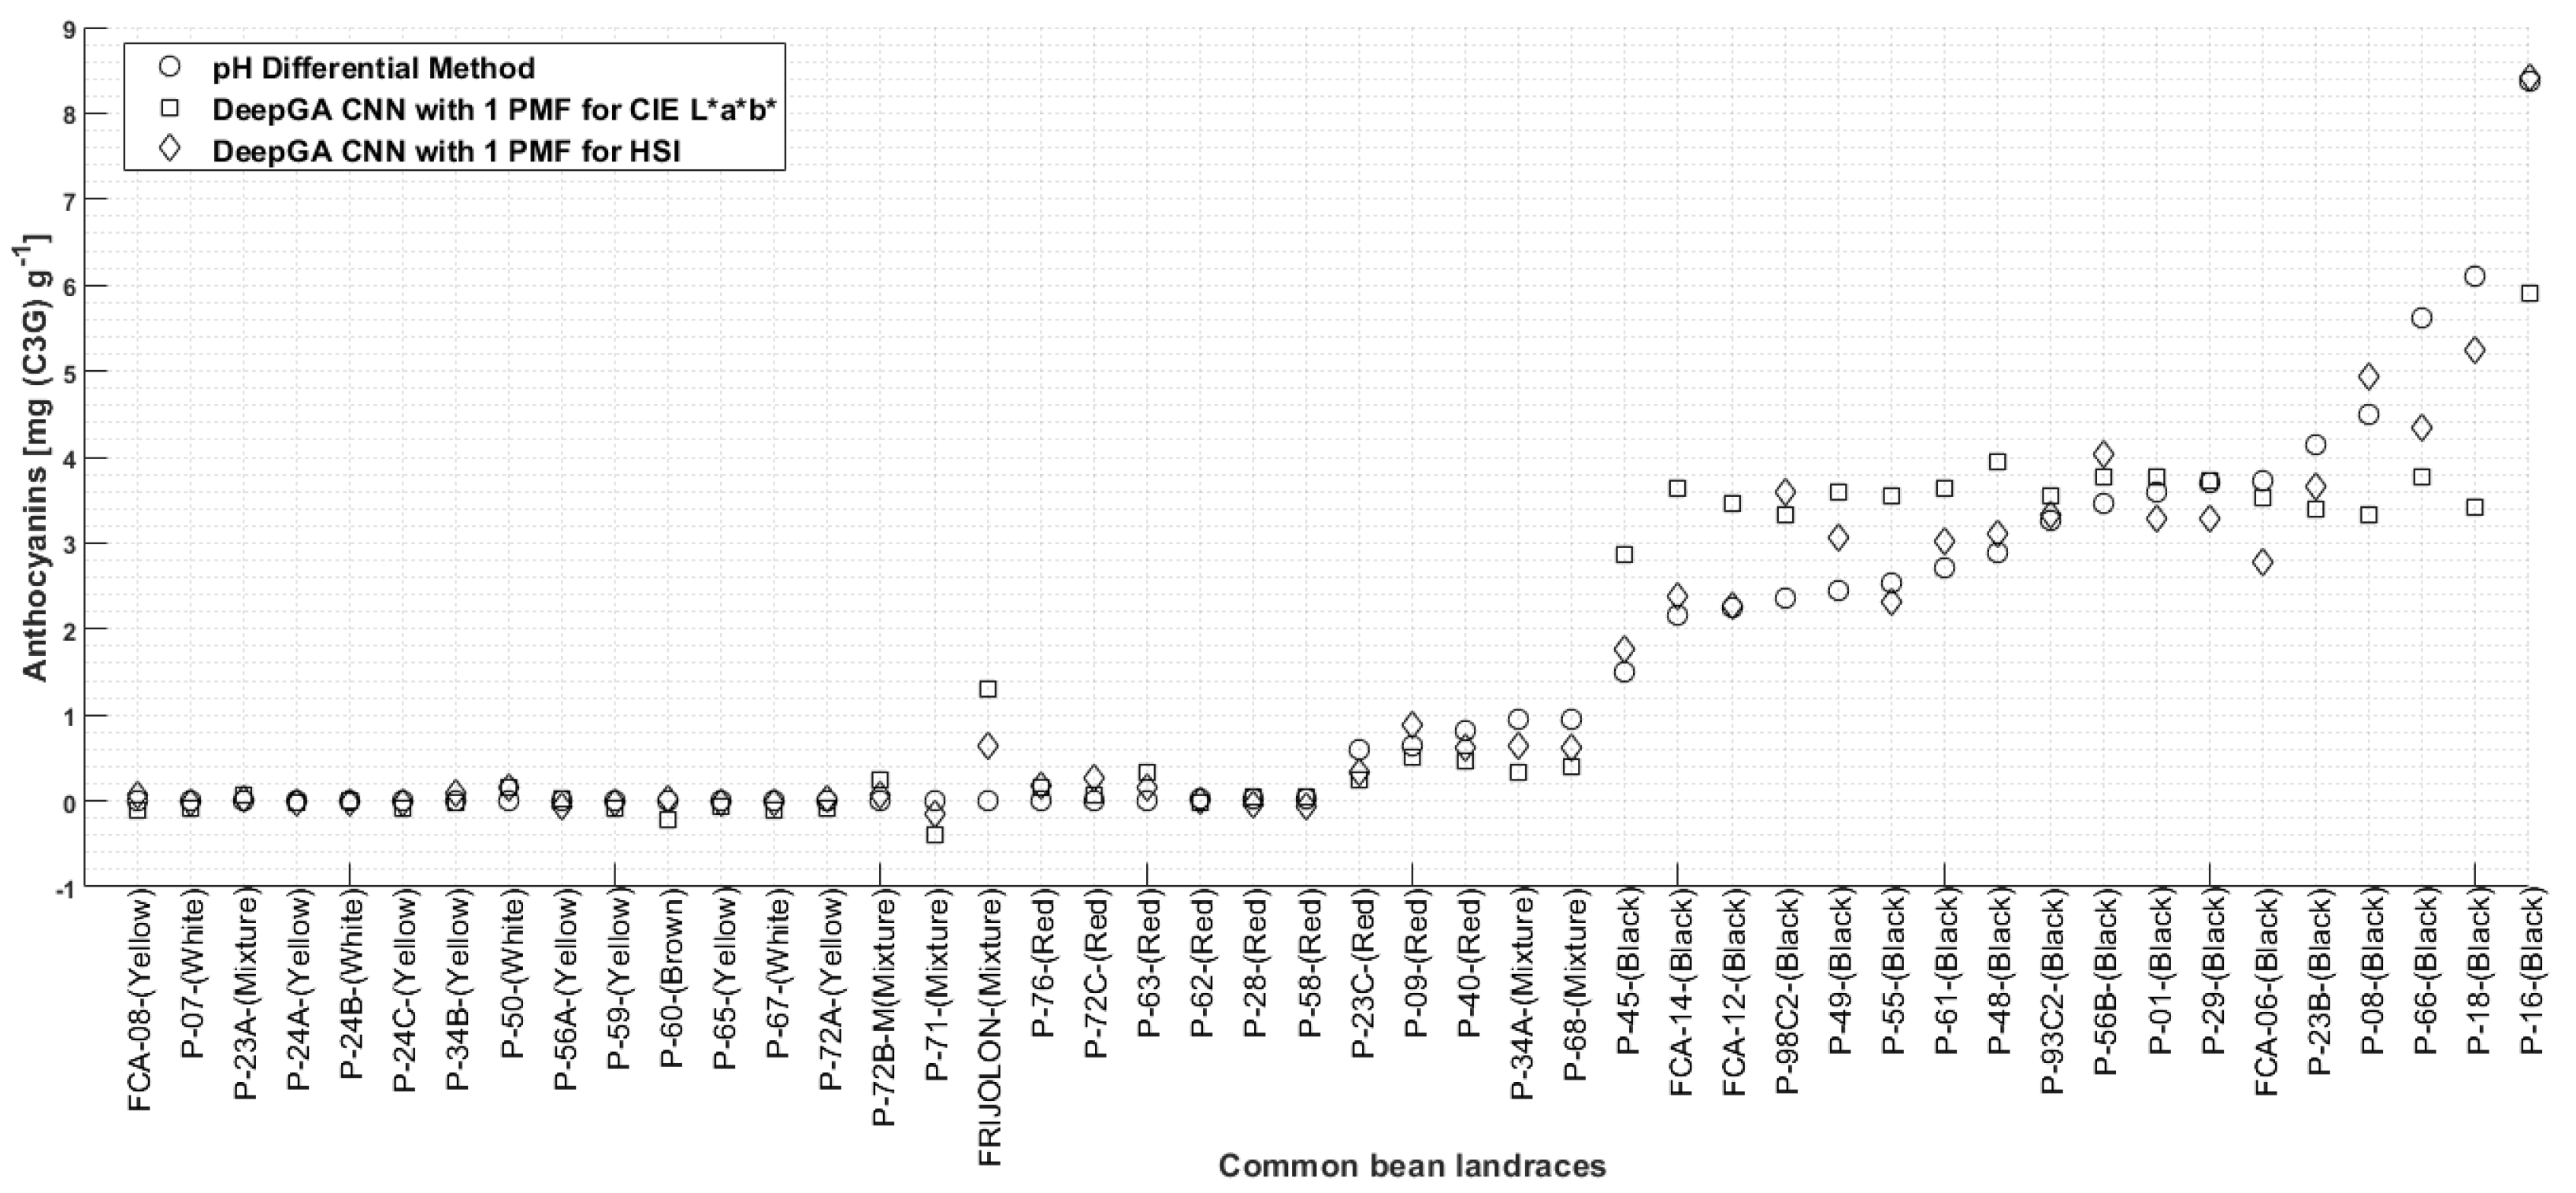
Regarding the pH differential method comparison, Figure 10 shows the precision values of the estimation with color characterization using one two-dimensional histogram (PMF).
Table 3 shows the performance of the CNN model generated by DeepGA using the three two-dimensional histograms.
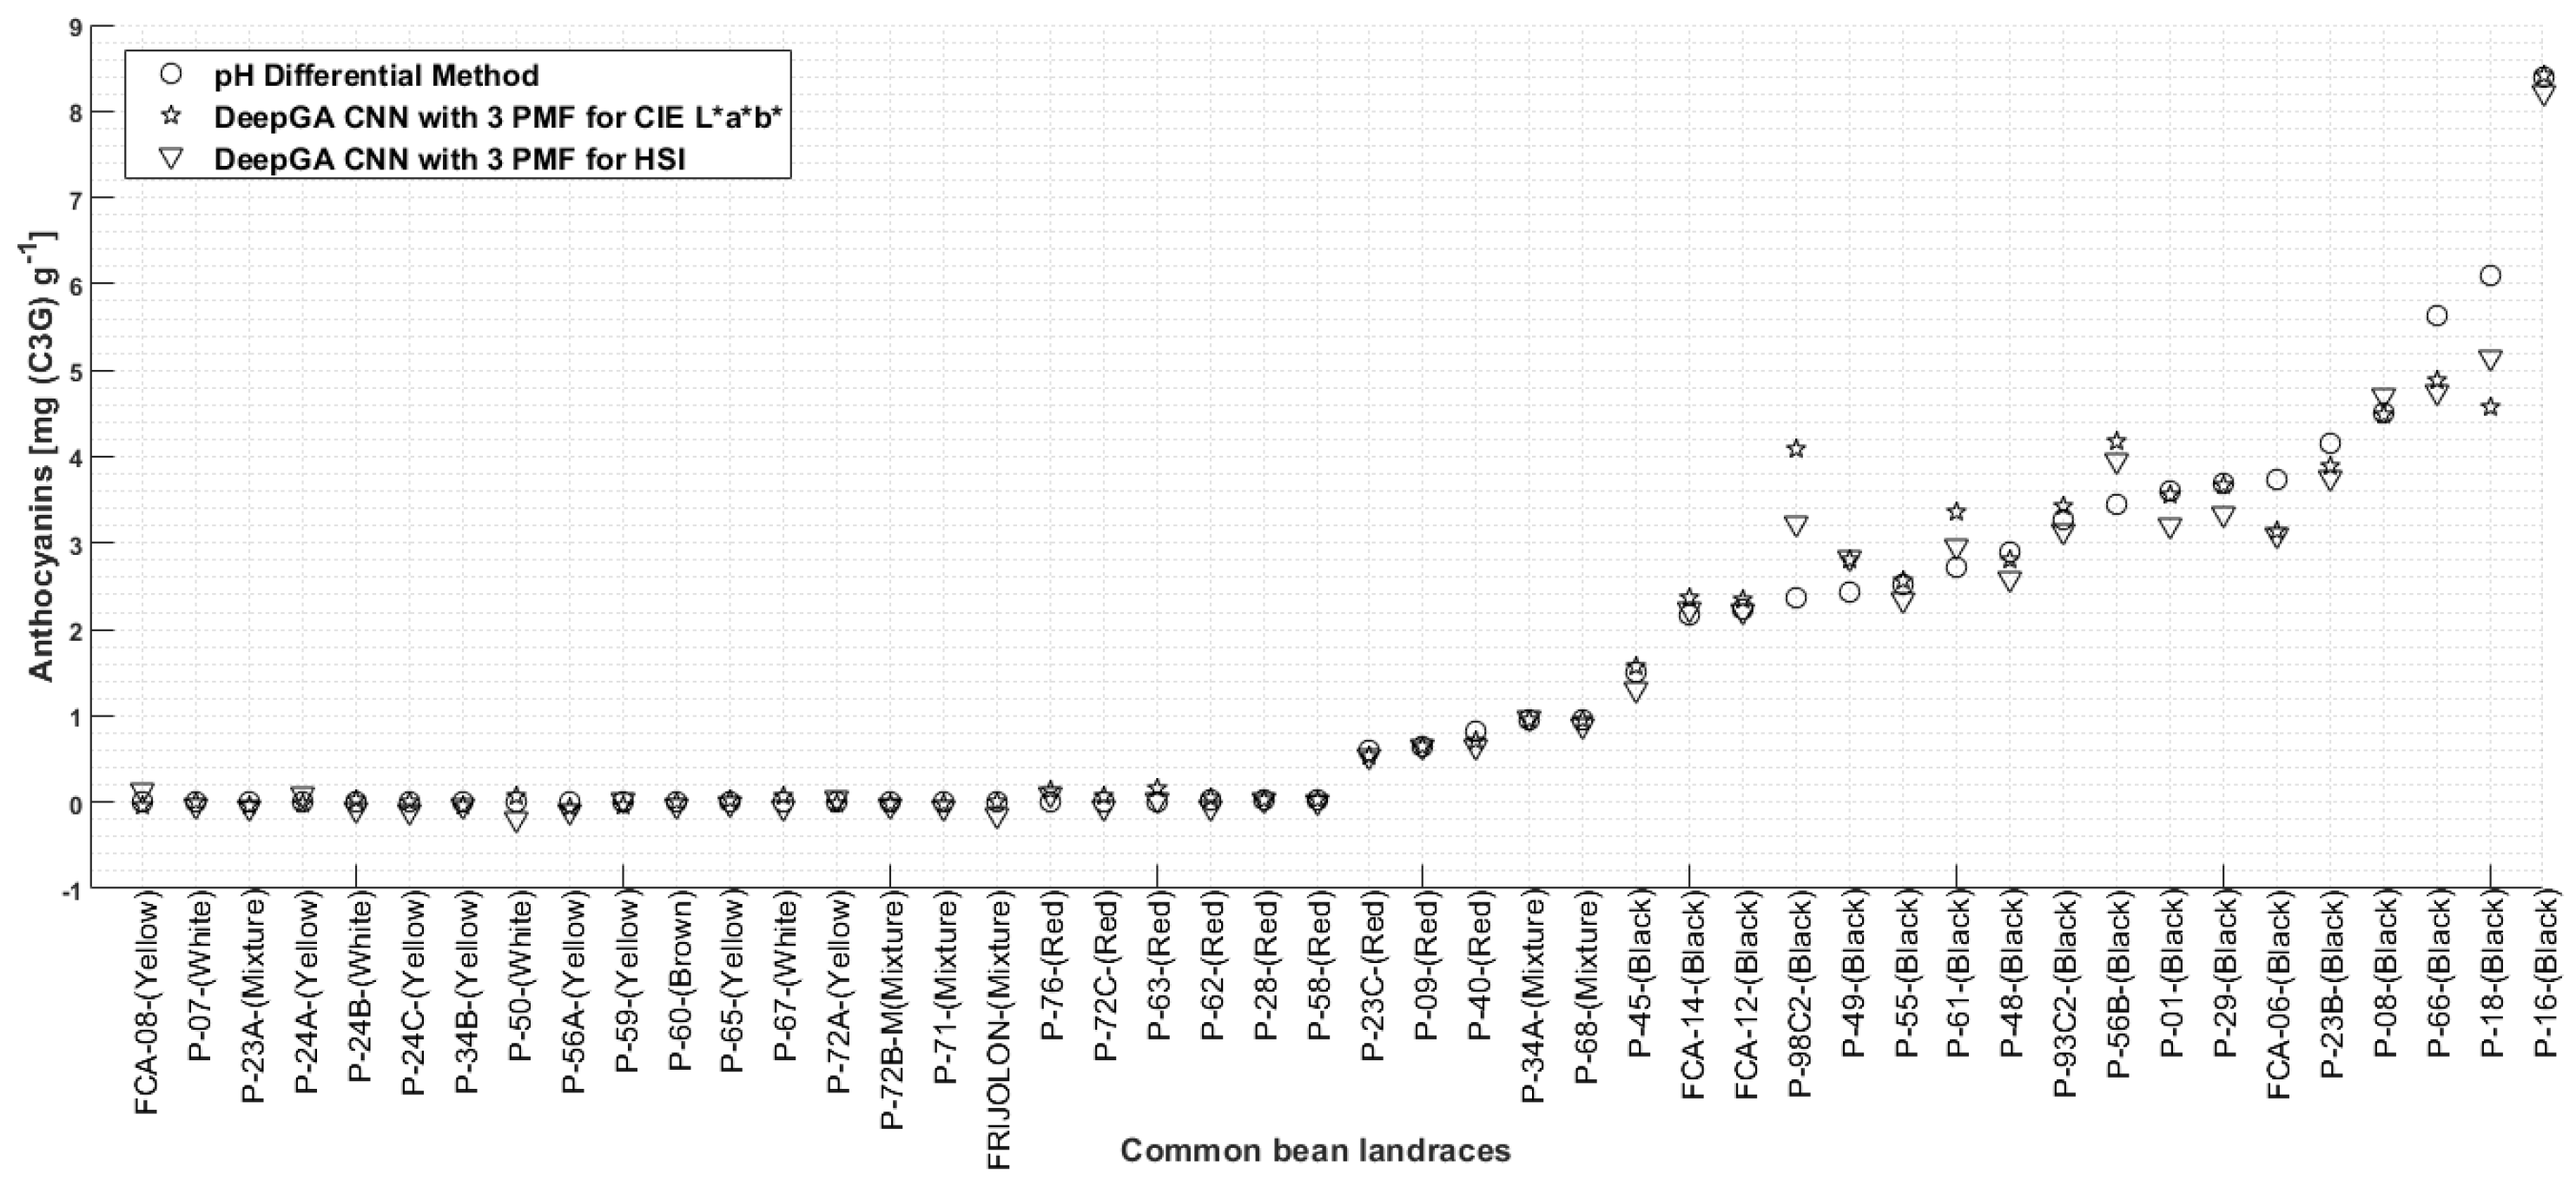
Figure 11 shows the performance of the DeepGA architecture for each bean landrace with different color characterizations.
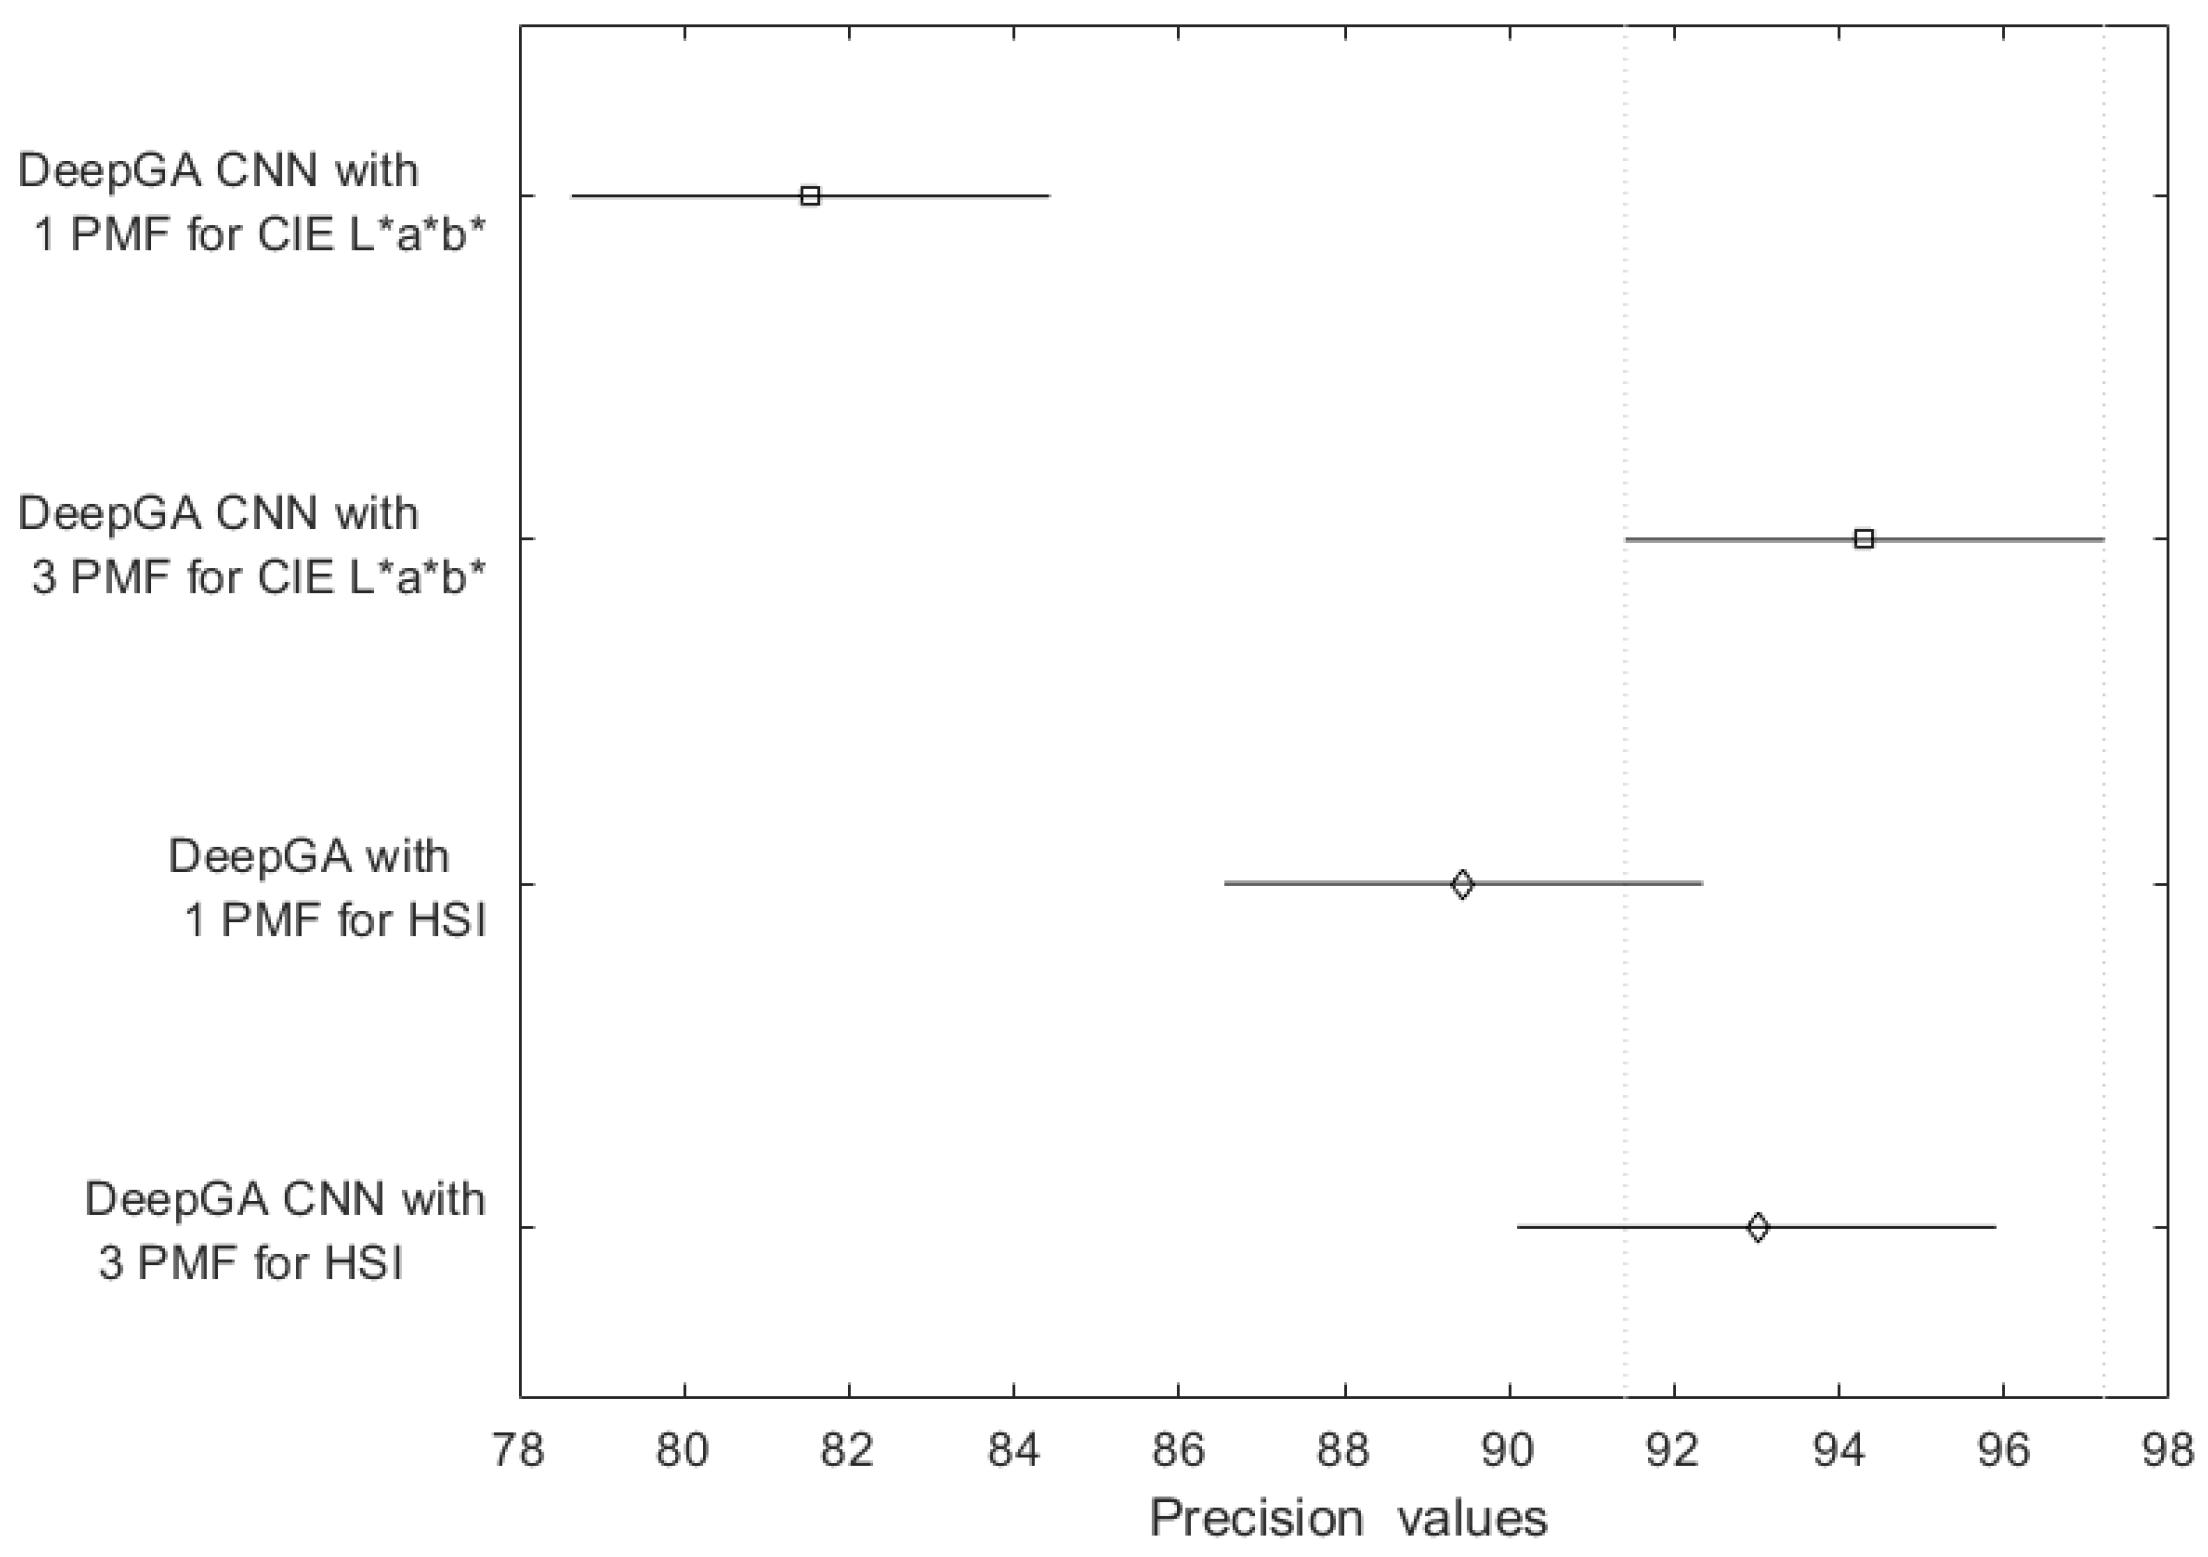
Figure 12 shows the statistical results of the precision values achieved, where three groups of estimations present significant statistical differences compared to the group that corresponds with the color characterization represented by one PMF for CIE L*a*b* with a p-value of 1.1024 × 10⁻⁷.

4. Discussion

Previous works have reported on the color characterization of common bean landraces using two-dimensional histograms, created using chromaticity channels to characterize the color, [29,30]. Our contribution explored the integration of a luminosity and intensity channel for the color spaces CIE L*a*b* and HSI, respectively. The PMF was used to create a two-dimensional histogram; our proposal includes three two-dimensional histograms. For this purpose, the DeepGA algorithm was used to find the optimal structure of convolutional neural networks for the anthocyanin estimation task. Consequently, the values of the same hyperparameters were maintained for the different experiments, and it was notable that the experiments with DeepGA involved the design of the same network architecture.
In CNNs, the first convolutional layer extracts the features, such as the edges, corners, lines, and textures. Depending on the color of the bean landraces, the PMF can be unimodal in the shape of a U or J, bimodal with two peaks, or multimodal with more than three peaks [40]. DeepGA does not observe differences in the edges or lines in the PMF of the different color characterizations in the neuro-evolving CNN process, which can result in the same architecture being developed.
The results obtained for the architecture created by DeepGA, with color characterization represented by a two-dimensional histogram (created only with chromaticity channels) of the test set obtained a precision of 89.44 ± 10.88 and 81.53 ± 15.76 for the HSI and CIE L*a*b* color spaces, respectively. We can observe that the color characterization using the HSI color space obtained a greater level of precision than that obtained with the characterization in the CIE L*a*b* color space, which is significantly different.
Figure 6 shows the values from using the pH differential method and the estimations achieved using the color characterization represented by the two-dimensional histograms created only from the chromaticity channels; in the graph, the landraces were short in terms of the anthocyanin concentration results from the pH differential method. The estimation values achieved with the HSI color space approximate the reference values, which justifies a precision of 89.44. In the case of CIE L*a*b*, the estimation values (square node marker symbol) for bean landraces with black seed coats do not match the reference values in the graph indicated with a circle node marker symbol; it is essential to highlight the color representation considering the chromatic part only. As a result, the model estimates similar values for all the landraces with black seed coats. Also, we can observe that the estimations are not approximated by the model for the bean landraces composed of a mixture of seed colors and are more notable in terms of the estimation values for the bean landrace called frijolon.
It is important to note that the estimation of anthocyanins, a key aspect of our research, proved to be a challenging task. The previous results were compared against the results of a DeepGA convolutional neural network involving three two-dimensional histograms (PMF) to show the contribution of luminosity and intensity channels, which complement color characterization. The precision obtained in terms of the test set was 93.00 ± 5.26 for the HSI color space and 94.30 ± 8.61 for CIE L* a* b*. These results show that incorporating the luminosity channel provides more information that helps the network model estimate the anthocyanin concentration value of each bean landrace with a significant increment in the precision. In Figure 7, we can observe a notable approximation of the estimation values in both color characterizations. The estimation values reported by the model were greater for the bean landrace black seed coat P-98C2, which has a 2.36 anthocyanin concentration. On the other hand, for bean landraces P-18, the estimated values were lower than 6.18. This complexity underscores the importance and challenges of our research. Using the first approach to estimating anthocyanins in bean populations with heterogeneous coloration, in this experiment we observed that the precision of the estimates was greater than 85%.
Finally, it is essential to highlight that in the CIE L*a*b* color space, the L* channel provides more significant information, which can be observed in the increase in precision. The ANOVA statistical test analyzed the differences between the precision values and Tukey’s post hoc test. Regarding the precision values, the statistical tests confirm that they present significant statistical differences, proving that the results of the estimations generated by the DeepGA CNN with 1 PMF for CIE L*a*b* are different to the results of the estimations generated by the DeepGA CNN with 3 PMF for CIE L*a*b*; for the HSI color space, the estimations results show no differences; the maximum contribution observed was for CIE L*a*b*, where the L* channel provided further information and, moreover, has a higher level of precision.
Based on the results, color characterization is essential for reducing anthocyanin concentration estimation error. The methodology proposed here could potentially be used to estimate different compounds related to color in other domains reported in state-of-the-art research [13,14,15,16,17,18,19,20,21,22,23].

5. Conclusions

This work reports on the estimation of anthocyanins in bean landraces with homogeneous and heterogeneous coloration, using four color characterizations represented by histograms (PMF). We explore the novel color characterization represented by three two-dimensional histograms, which is the proposed solution to our problem. The DeepGA algorithm was also used to develop an optimal neural network architecture for such a task.
DeepGA is a framework that evolves an architecture for a particular domain. In this case, the architecture for estimating anthocyanins in bean landraces consists of three convolutional layers, thus providing an architecture specially designed for estimating anthocyanins in homogeneous and heterogeneous colored native bean landraces of lower complexity.
The results show the contribution of the luminosity channel robustness in regard to the information for characterizing the color of common bean landraces. The comparison between the color characterization made up of one two-dimensional histogram created only with chromaticity channels and the characterization made up of three two-dimensional histograms created with chromaticity and luminosity channels shows a difference in precision, observing an increase in the color characterization represented by the three two-dimensional histograms; the precision achieved was 93.00 ± 5.26 for the HSI color space and 94.30 ± 8.61 for CIE L* a* b*.
In this work, we observed that the color characterization represented by three two-dimensional histograms and the use of neuroevolution techniques provides us with an optimal solution for anthocyanin estimation in bean landraces. In the estimation values of anthocyanins in common bean landraces with heterogeneous coloration, we observed that the precision achieved was greater than 85%. Therefore, future work should increase the number of common bean landraces with heterogeneous coloration. Additionally, it is proposed to explore the color characterization with other color attributes, namely the chroma and hue of the CIE L*a*b* color space.

Author Contributions

Conceptualization, J.-L.M.-R., E.-N.A.-B. and H.-G.A.-M.; methodology, J.-L.M.-R., E.-N.A.-B. and H.-G.A.-M.; software, J.-L.M.-R.; validation, A.M.-G., E.-N.A.-B. and H.-G.A.-M.; formal analysis, E.-N.A.-B. and H.-G.A.-M.; investigation, J.-L.M.-R.; resources, J.-L.M.-R.; data curation, J.-L.M.-R.; writing—original draft preparation, J.-L.M.-R.; writing—review and editing, J.-L.M.-R. and A.M.-G.; visualization, J.-L.M.-R.; supervision, E.-N.A.-B. and H.-G.A.-M. All authors have read and agreed to the published version of the manuscript.

Funding

This research received no external funding.

Data Availability Statement

The datasets presented in this article are not readily available because data are part of an ongoing study. Requests to access the datasets should be directed to [email protected] and [email protected].

Acknowledgments

The first author acknowledges the National Council of Humanities, Sciences and Technologies (CONAHCyT) of Mexico for granting support for the realization of this investigation through scholarship 712056, awarded for postdoctoral studies at the Centre for Food Research and Development at the University of Veracruz.

Conflicts of Interest

The authors declare that there are no conflicts of interest.

References

  1. Nadeem, M.A.; Yeken, M.Z.; Shahid, M.Q.; Habyarimana, E.; Yılmaz, H.; Alsaleh, A.; Hatipoğlu, R.; Çilesiz, Y.; Khawar, K.M.; Ludidi, N.; et al. Common Bean as a Potential Crop for Future Food Security: An Overview of Past, Current and Future Contributions in Genomics, Transcriptomics, Transgenics and Proteomics. Biotechnol. Biotechnol. Equip. 2021, 35, 759–787. [Google Scholar] [CrossRef]
  2. Bressani, R. Grain Quality of Common Beans. Food Rev. Int. 1993, 9, 237–297. [Google Scholar] [CrossRef]
  3. Singh, S.P. Broadening the Genetic Base of Common Bean Cultivars: A Review. Crop Sci. 2001, 41, 1659–1675. [Google Scholar] [CrossRef]
  4. Chávez-Servia, J.L.; Heredia-García, E.; Mayek-Pérez, N.; Aquino-Bolaños, E.N.; Hernández-Delgado, S.; Carrillo-Rodríguez, J.C.; Gill-Langarica, H.R.; Vera-Guzmán, A.M. Diversity of Common Bean (Phaseolus vulgaris L.) Landraces and the Nutritional Value of Their Grains. In Grain Legumes; Goyal, A.K., Ed.; InTech: Houston, TX, USA, 2016; ISBN 978-953-51-2720-8. [Google Scholar]
  5. Chacón S, M.I.; Pickersgill, B.; Debouck, D.G. Domestication Patterns in Common Bean (Phaseolus vulgaris L.) and the Origin of the Mesoamerican and Andean Cultivated Races. Theor. Appl. Genet. 2005, 110, 432–444. [Google Scholar] [CrossRef] [PubMed]
  6. Aquino-Bolaños, E.; Garca Daz, Y.; Chavez Servia, J.; Carrillo Rodrguez, J.; Vera Guzman, A.; Heredia Garcia, E. Anthocyanins, Polyphenols, Flavonoids and Antioxidant Activity in Common Bean (Phaseolus vulgaris L.) Landraces. Emir. J. Food Agric. 2016, 28, 581. [Google Scholar] [CrossRef]
  7. Chen, J.; Xu, B.; Sun, J.; Jiang, X.; Bai, W. Anthocyanin Supplement as a Dietary Strategy in Cancer Prevention and Management: A Comprehensive Review. Crit. Rev. Food Sci. Nutr. 2022, 62, 7242–7254. [Google Scholar] [CrossRef] [PubMed]
  8. Guo, H.; Ling, W. The Update of Anthocyanins on Obesity and Type 2 Diabetes: Experimental Evidence and Clinical Perspectives. Rev. Endocr. Metab. Disord. 2015, 16, 1–13. [Google Scholar] [CrossRef] [PubMed]
  9. Li, P.; Feng, D.; Yang, D.; Li, X.; Sun, J.; Wang, G.; Tian, L.; Jiang, X.; Bai, W. Protective Effects of Anthocyanins on Neurodegenerative Diseases. Trends Food Sci. Technol. 2021, 117, 205–217. [Google Scholar] [CrossRef]
  10. Wallace, T.C. Anthocyanins in Cardiovascular Disease. Adv. Nutr. 2011, 2, 1–7. [Google Scholar] [CrossRef] [PubMed]
  11. Tsuda, T. Regulation of Adipocyte Function by Anthocyanins; Possibility of Preventing the Metabolic Syndrome. J. Agric. Food Chem. 2008, 56, 642–646. [Google Scholar] [CrossRef]
  12. Zafra-Stone, S.; Yasmin, T.; Bagchi, M.; Chatterjee, A.; Vinson, J.A.; Bagchi, D. Berry Anthocyanins as Novel Antioxidants in Human Health and Disease Prevention. Mol. Nutr. Food Res. 2007, 51, 675–683. [Google Scholar] [CrossRef] [PubMed]
  13. Menozzi, C.; Calvini, R.; Nigro, G.; Tessarin, P.; Bossio, D.; Calderisi, M.; Ferrari, V.; Foca, G.; Ulrici, A. Design and Application of a Smartphone-Based Device for in Vineyard Determination of Anthocyanins Content in Red Grapes. Microchem. J. 2023, 191, 108811. [Google Scholar] [CrossRef]
  14. Fernandes, A.M.; Franco, C.; Mendes-Ferreira, A.; Mendes-Faia, A.; Costa, P.L.D.; Melo-Pinto, P. Brix, pH and Anthocyanin Content Determination in Whole Port Wine Grape Berries by Hyperspectral Imaging and Neural Networks. Comput. Electron. Agric. 2015, 115, 88–96. [Google Scholar] [CrossRef]
  15. Grimm, E.; Kuhnke, F.; Gajdt, A.; Ostermann, J.; Knoche, M. Accurate Quantification of Anthocyanin in Red Flesh Apples Using Digital Photography and Image Analysis. Horticulturae 2022, 8, 145. [Google Scholar] [CrossRef]
  16. Abdel-Sattar, M.; Al-Obeed, R.S.; Aboukarima, A.M.; Eshra, D.H. Development of an Artificial Neural Network as a Tool for Predicting the Chemical Attributes of Fresh Peach Fruits. PLoS ONE 2021, 16, e0251185. [Google Scholar] [CrossRef] [PubMed]
  17. Chen, Y.; Zheng, L.; Wang, M.; Wu, M.; Gao, W. Prediction of Chlorophyll and Anthocyanin Contents in Purple Lettuce Based on Image Processing; ASABE: St. Joseph, MI, USA, 2020; p. 1. [Google Scholar]
  18. Amoriello, T.; Ciccoritti, R.; Ferrante, P. Prediction of Strawberries’ Quality Parameters Using Artificial Neural Networks. Agronomy 2022, 12, 963. [Google Scholar] [CrossRef]
  19. Yoshioka, Y.; Nakayama, M.; Noguchi, Y.; Horie, H. Use of Image Analysis to Estimate Anthocyanin and UV-Excited Fluorescent Phenolic Compound Levels in Strawberry Fruit. Breed. Sci. 2013, 63, 211–217. [Google Scholar] [CrossRef] [PubMed]
  20. Pusty, K.; Kumar Dash, K.; Giri, S.; Raj, G.V.S.B.; Tiwari, A.; Shaikh, A.M.; Béla, K. Ultrasound Assisted Phytochemical Extraction of Red Cabbage by Using Deep Eutectic Solvent: Modelling Using ANFIS and Optimization by Genetic Algorithms. Ultrason. Sonochemistry 2024, 102, 106762. [Google Scholar] [CrossRef]
  21. Qi, H.; Li, H.; Chen, L.; Chen, F.; Luo, J.; Zhang, C. Hyperspectral Imaging Using a Convolutional Neural Network with Transformer for the Soluble Solid Content and pH Prediction of Cherry Tomatoes. Foods 2024, 13, 251. [Google Scholar] [CrossRef] [PubMed]
  22. Zhang, C.; Wu, W.; Zhou, L.; Cheng, H.; Ye, X.; He, Y. Developing Deep Learning Based Regression Approaches for Determination of Chemical Compositions in Dry Black Goji Berries (Lycium ruthenicum Murr.) Using near-Infrared Hyperspectral Imaging. Food Chem. 2020, 319, 126536. [Google Scholar] [CrossRef] [PubMed]
  23. Del Valle, J.C.; Gallardo-López, A.; Buide, M.L.; Whittall, J.B.; Narbona, E. Digital Photography Provides a Fast, Reliable, and Noninvasive Method to Estimate Anthocyanin Pigment Concentration in Reproductive and Vegetative Plant Tissues. Ecol. Evol. 2018, 8, 3064–3076. [Google Scholar] [CrossRef] [PubMed]
  24. Gomes, V.; Fernandes, A.; Martins-Lopes, P.; Pereira, L.; Mendes Faia, A.; Melo-Pinto, P. Characterization of Neural Network Generalization in the Determination of pH and Anthocyanin Content of Wine Grape in New Vintages and Varieties. Food Chem. 2017, 218, 40–46. [Google Scholar] [CrossRef] [PubMed]
  25. Prilianti, K.R.; Anam, S.; Brotosudarmo, T.H.P.; Suryanto, A. Real-Time Assessment of Plant Photosynthetic Pigment Contents with an Artificial Intelligence Approach in a Mobile Application. J. Agric. Eng. 2020, 51, 220–228. [Google Scholar] [CrossRef]
  26. Mu, C.; Yuan, Z.; Ouyang, X.; Sun, P.; Wang, B. Non-destructive Detection of Blueberry Skin Pigments and Intrinsic Fruit Qualities Based on Deep Learning. J Sci Food Agric 2021, 101, 3165–3175. [Google Scholar] [CrossRef] [PubMed]
  27. Prilianti, K.R.; Setiyono, E.; Kelana, O.H.; Brotosudarmo, T.H.P. Deep Chemometrics for Nondestructive Photosynthetic Pigments Prediction Using Leaf Reflectance Spectra. Inf. Process. Agric. 2021, 8, 194–204. [Google Scholar] [CrossRef]
  28. Nofrizal, A.Y.; Sonobe, R.; Yamashita, H.; Seki, H.; Mihara, H.; Morita, A.; Ikka, T. Evaluation of a One-Dimensional Convolution Neural Network for Chlorophyll Content Estimation Using a Compact Spectrometer. Remote Sens. 2022, 14, 1997. [Google Scholar] [CrossRef]
  29. Morales-Reyes, J.L.; Acosta-Mesa, H.-G.; Aquino-Bolaños, E.-N.; Herrera Meza, S.; Márquez Grajales, A. Anthocyanins Estimation in Homogeneous Bean Landrace (Phaseolus vulgaris L.) Using Probabilistic Representation and Convolutional Neural Networks. J. Agric. Eng. 2023, 54, 1–12. [Google Scholar] [CrossRef]
  30. Morales-Reyes, J.-L.; Aquino-Bolaños, E.-N.; Acosta-Mesa, H.-G.; Márquez-Grajales, A. Estimation of Anthocyanins in Homogeneous Bean Landraces Using Neuroevolution. In Advances in Computational Intelligence. MICAI 2023 International Workshops; Calvo, H., Martínez-Villaseñor, L., Ponce, H., Zatarain Cabada, R., Montes Rivera, M., Mezura-Montes, E., Eds.; Lecture Notes in Computer Science; Springer Nature: Cham, Switzerland, 2024; Volume 14502, pp. 373–384. ISBN 978-3-031-51939-0. [Google Scholar]
  31. Xu, B.J.; Yuan, S.H.; Chang, S.K.C. Comparative Analyses of Phenolic Composition, Antioxidant Capacity, and Color of Cool Season Legumes and Other Selected Food Legumes. J. Food Sci. 2007, 72, S167–S177. [Google Scholar] [CrossRef] [PubMed]
  32. Giusti, M.M.; Wrolstad, R.E. Characterization and Measurement of Anthocyanins by UV-Visible Spectroscopy. Curr. Protoc. Food Anal. Chem. 2001, F1.2.1–F1.2.13. [Google Scholar] [CrossRef]
  33. Reyes, J.L.M.; Mesa, H.G.A.; Bolanos, E.N.A.; Meza, S.H.; Ramirez, N.C.; Servia, J.L.C. Classification of Bean (Phaseolus vulgaris L.) Landraces with Heterogeneous Seed Color Using a Probabilistic Representation. In Proceedings of the 2021 IEEE International Autumn Meeting on Power, Electronics and Computing (ROPEC), Ixtapa, Mexico, 10 November 2021; pp. 1–7. [Google Scholar]
  34. Tang, J. A Color Image Segmentation Algorithm Based on Region Growing. In Proceedings of the 2010 2nd International Conference on Computer Engineering and Technology, Chengdu, China, 16–18 April 2010; pp. V6-634–V6-637. [Google Scholar]
  35. Woods, R.E.; Gonzalez, R.C. Digital Image Processing, 3rd ed.; Pearson Education India: Tamil Nadu, India, 2021. [Google Scholar]
  36. Chandra, R.; Tiwari, A. Distributed Bayesian Optimisation Framework for Deep Neuroevolution. Neurocomputing 2022, 470, 51–65. [Google Scholar] [CrossRef]
  37. Lehman, J.; Miikkulainen, R. Neuroevolution. Scholarpedia 2013, 8, 30977. [Google Scholar] [CrossRef]
  38. Stanley, K.O.; Clune, J.; Lehman, J.; Miikkulainen, R. Designing Neural Networks through Neuroevolution. Nat. Mach. Intell. 2019, 1, 24–35. [Google Scholar] [CrossRef]
  39. Vargas-Hákim, G.-A.; Mezura-Montes, E.; Acosta-Mesa, H.-G. Hybrid Encodings for Neuroevolution of Convolutional Neural Networks: A Case Study. In Proceedings of the Genetic and Evolutionary Computation Conference Companion, Lille, France, 7 July 2021; pp. 1762–1770. [Google Scholar]
  40. Namatēvs, I. Deep Convolutional Neural Networks: Structure, Feature Extraction and Training. Inf. Technol. Manag. Sci. 2017, 20, 40–47. [Google Scholar] [CrossRef]
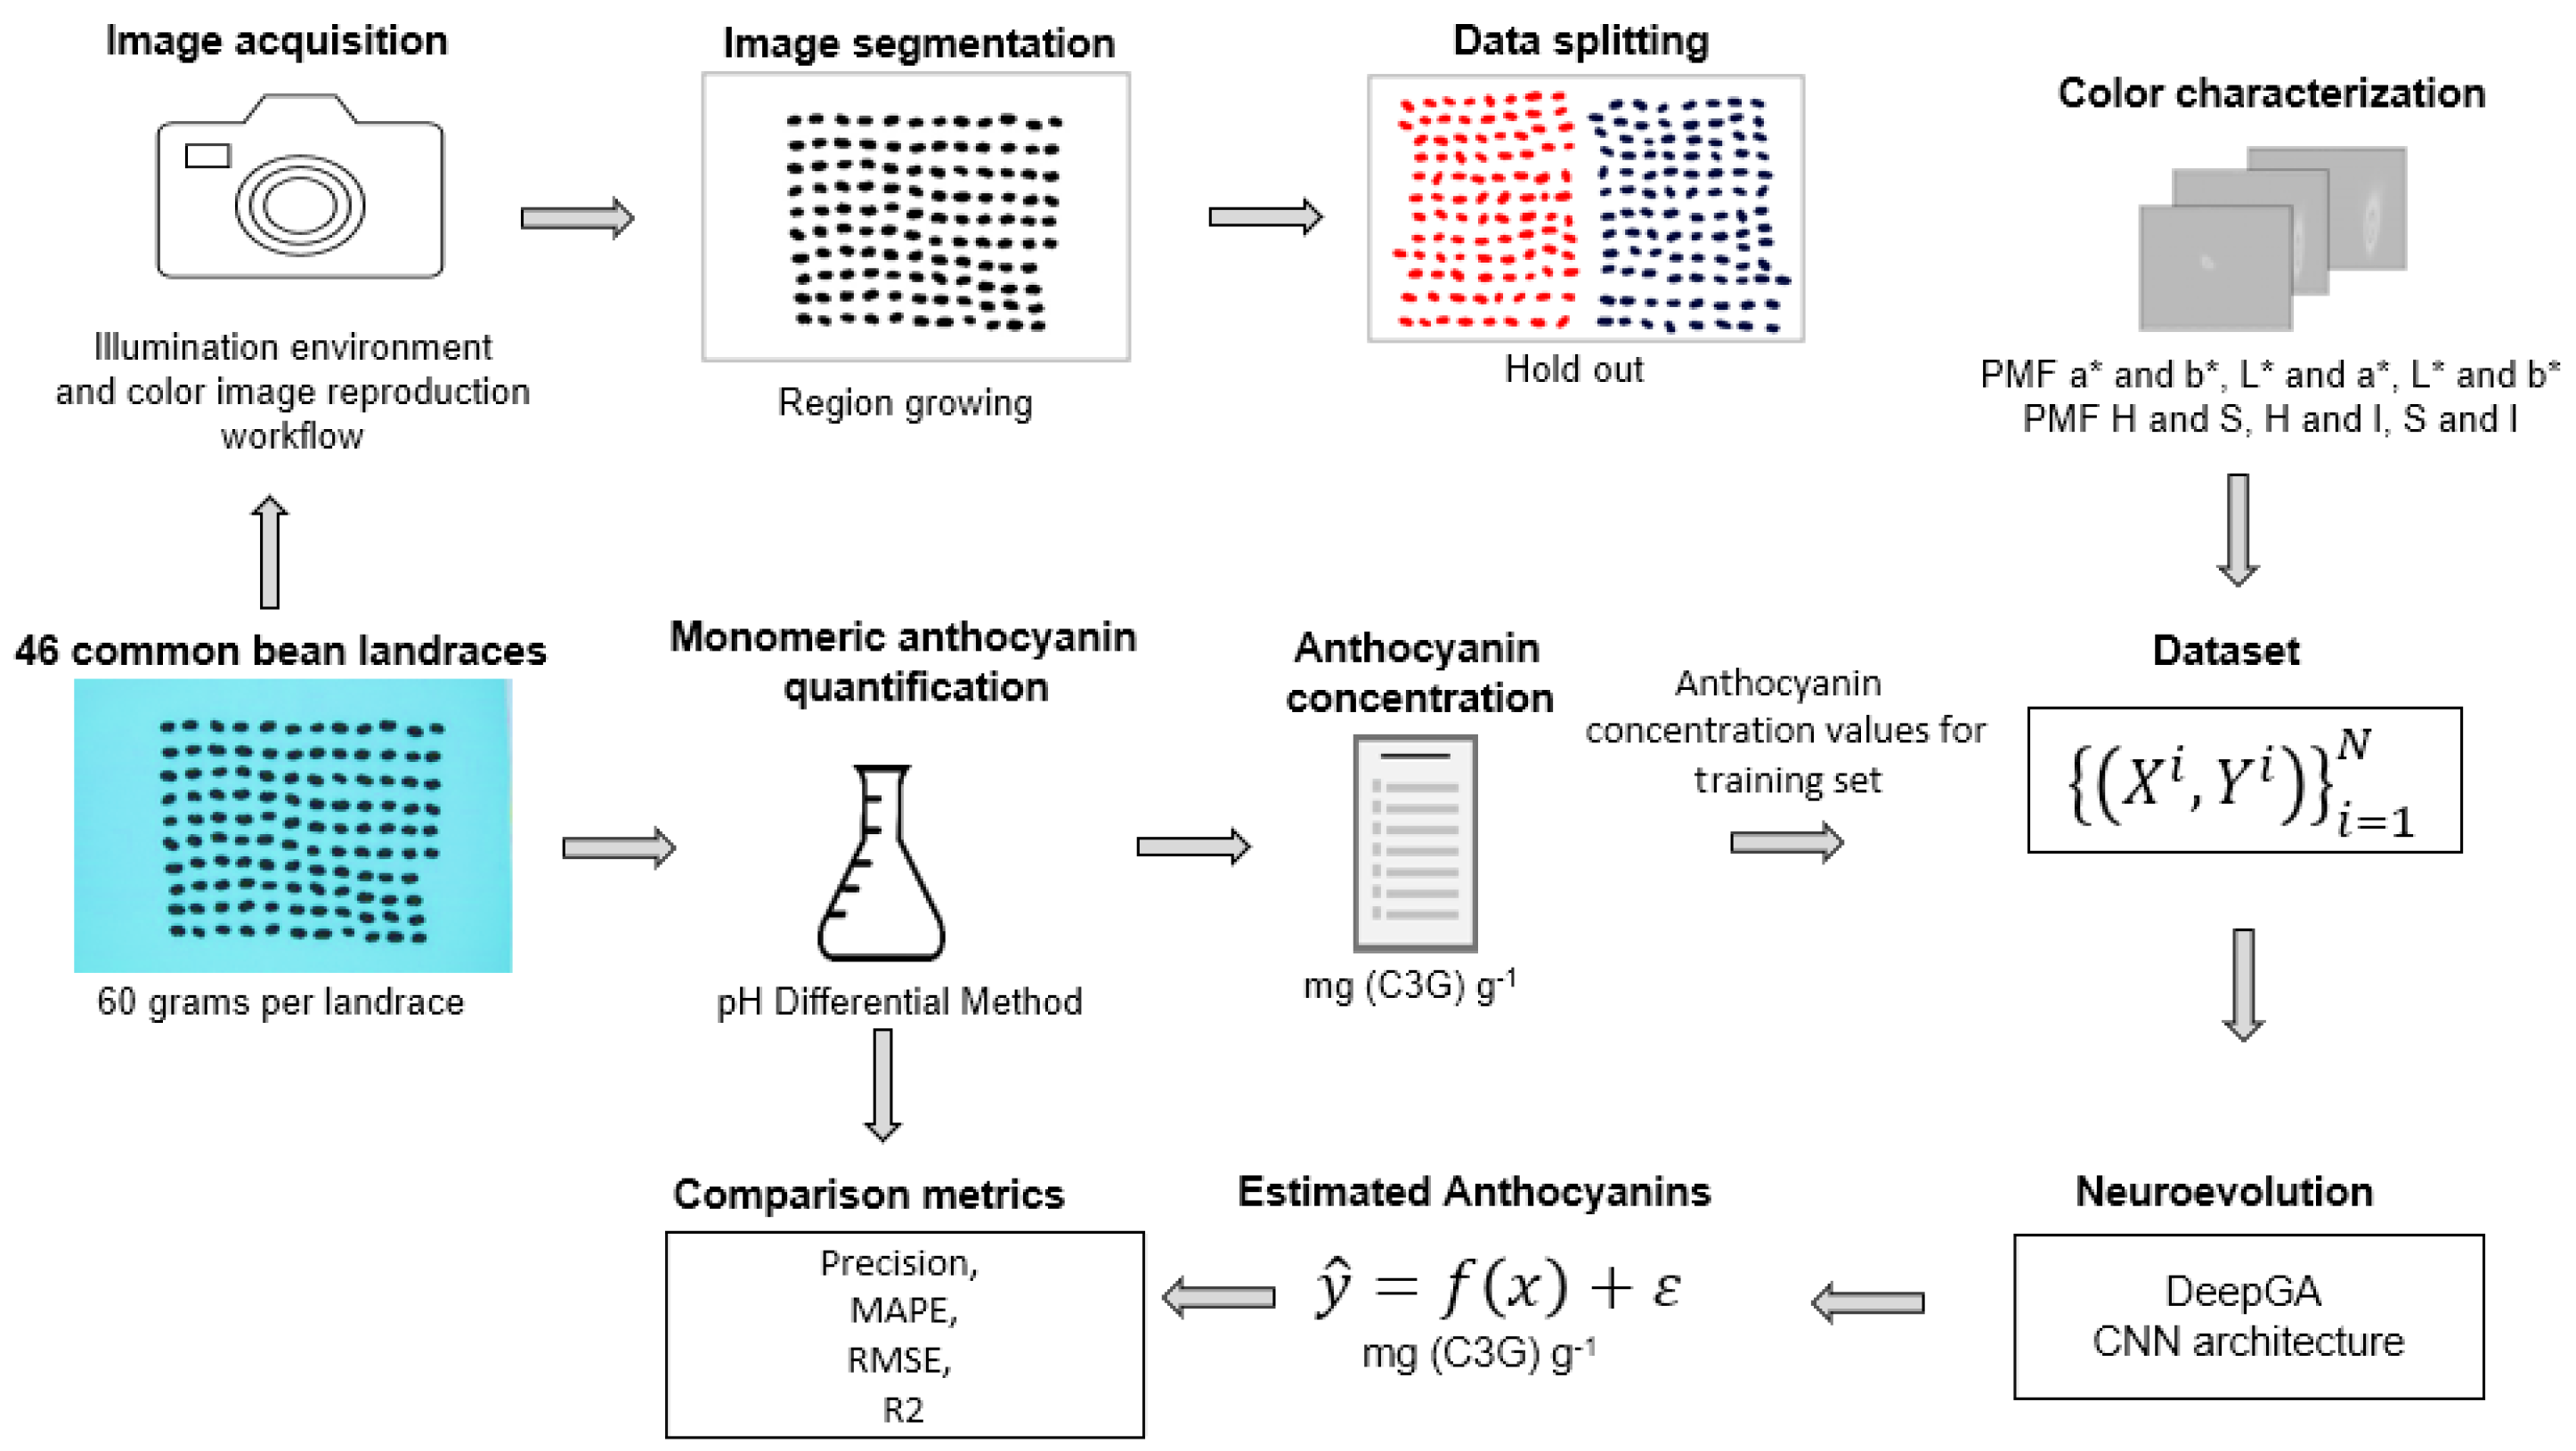
Figure 1. Workflow for estimation of anthocyanins in common bean landraces.
Mca 29 00068 g001
Figure 2. Common bean landraces of homogeneous and heterogeneous coloration: (A) 60 g of yellow bean landrace seeds; (B) 60 g of variegated bean landrace seeds; (C) 60 g of black landrace seeds; (D) 60 g of a mixture of bean landrace seeds.
Mca 29 00068 g002
Figure 3. The pH differential method used to determine the anthocyanin concentration of 46 common bean landraces.
Mca 29 00068 g003
Figure 4. Representation of image reproduction workflow for standardization and color calibration by [33].
Mca 29 00068 g004
Figure 5. During the segmentation process, the region growing algorithm fills in the background area; as a result, a binary image is obtained and the black regions correspond to the region of interest.
Mca 29 00068 g005
Figure 6. Seed sampling for DeepGA architecture regression task.
Mca 29 00068 g006
Figure 7. The proposed color characterization is made up of three grouped histograms to represent the information for each landrace.
Mca 29 00068 g007
Figure 8. CNN architecture created by DeepGA algorithm.
Mca 29 00068 g008
Figure 9. Training curve of the CNN performance optimized through DeepGA. The blue line represents training data and the black line represents validation data. (A) Training curve of the CNN with three PMFs of HSI; (B) training curve of the CNN with three PMFs of CIE L*a*b*.
Mca 29 00068 g009
Figure 10. Comparison of the results of the estimated anthocyanin concentration, using DeepGA with one PMF and pH differential method, in CIE L*a*b* and HSI color spaces.
Mca 29 00068 g010
Figure 11. Comparison of the results of the estimated anthocyanin concentration, using DeepGA with three PMFs and pH differential method, in CIE L*a*b* and HSI color spaces.
Mca 29 00068 g011
Figure 12. ANOVA statistical results for precision values; PMF: probability mass function; CNN: convolutional neural network; HSI: hue, saturation, intensity.
Mca 29 00068 g012
Table 1. Hyperparameter values for DeepGA in the regression task.
Hyperparameters Evolutionary AlgorithmValueHyperparameters CNNValue
Population size20Epoch number30
Generation number50Learning rate0.001
Objective functionMAPEOptimization methodADAM
Loss functionMSE
Table 2. Anthocyanin estimation results with DeepGA architecture and PMF of chromaticity channels. Bold numbers represent the best values, according to the metric used.
Color SpaceHSICIE L*a*b*
ModelsDeepGADeepGA
Color Characterization TechniquePMF of H and SPMF of a* and b*
TrainPrecision 90.71 ± 11.14 81.82 ± 15.28
RMSE 0.39 0.84
R2 0.96 0.82
TestPrecision 89.44 ± 10.88 81.53 ± 15.76
RMSE0.400.84
R20.950.82
Table 3. Anthocyanin estimation accuracy results using the DeepGA architecture and three PMFs. Bold numbers represent the best values, according to the metric used.
Color SpaceHSICIE L*a*b*
ModelsDeepGADeepGA
Color characterization techniquePMF of H and SPMF of a* and b*
PMF of H and IPMF of L* and a*
PMF of S and IPMF of L* and b*
TrainPrecision 94.75 ± 3.99 95.71 ± 8.55
RMSE 0.25 0.39
R2 0.98 0.96
TestPrecision 93.00 ± 5.26 94.30 ± 8.61
RMSE0.300.40
R20.970.95
Disclaimer/Publisher’s Note: The statements, opinions and data contained in all publications are solely those of the individual author(s) and contributor(s) and not of MDPI and/or the editor(s). MDPI and/or the editor(s) disclaim responsibility for any injury to people or property resulting from any ideas, methods, instructions or products referred to in the content.