Article

Numerical Modelling of Corrugated Paperboard Boxes

Department of Mechanical Engineering, Stellenbosch University, Stellenbosch 7600, South Africa
*
Author to whom correspondence should be addressed.
Math. Comput. Appl. 2024, 29(4), 70; https://doi.org/10.3390/mca29040070
Submission received: 31 May 2024 / Revised: 5 August 2024 / Accepted: 20 August 2024 / Published: 22 August 2024

Abstract

:
Numerical modelling of corrugated paperboard is quite challenging due to its waved geometry and material non-linearity which is affected by the material properties of the individual paper sheets. Because of the complex geometry and material behaviour of the board, there is still scope to enhance the accuracy of current modelling techniques as well as gain a better understanding of the structural performance of corrugated paperboard packaging for improved packaging design. In this study, four-point bending tests were carried out to determine the bending stiffness of un-creased samples in the machine direction (MD) and cross direction (CD). Bending tests were also carried out on creased samples with the fluting oriented in the CD with the crease at the centre. Inverse analysis was applied using the results from the bending tests to determine the material properties that accurately predict the bending stiffness of the horizontal creases, vertical creases, and panels of a box under compression loading. The finite element model of the box was divided into three sections, the horizontal creases, vertical creases, and the box panels. Each of these sections is described using different material properties. The box edges/corners are described using the optimal material properties from bending and compression tests conducted on creased samples, while the box panels are described using the optimal material properties obtained from four-point bending tests conducted on samples without creases. A homogenised finite element (FE) model of a box was simulated using the obtained material properties and validated using experimental results. The developed FE model accurately predicted the failure load of a corrugated paperboard box under compression with a variation of 0.1% when compared to the experimental results.

1. Introduction

Corrugated paperboard boxes are the most commonly used medium for the packaging and transportation of products [1]. They are the preferred packaging material due to their recyclability, biodegradability, low cost, and high strength-to-weight and stiffness-to-weight ratio compared to other packaging mediums such as wooden crates. The box compression test (BCT) is used to evaluate the top-to-bottom compression strength of the box under loading which is of significance when palletising boxes for transportation and storage.
Several researchers have applied finite element (FE) modelling to the BCT to determine the compression strength and displacement of the box under different loading configurations. Han and Park [1] developed FE models of a box without flaps (tube) to investigate the effect of varying the pattern and location of ventilation and hand holes on the compression strength of the box. The translation of the bottom edges of the box was fixed while a constant vertical displacement was applied to the top edges of the box to simulate the BCT. Stress distributions in the models were compared and validated with experimental results but no displacement results for the models were presented to demonstrate that the model accurately predicted the load–displacement curve.
Fadiji [2] developed FE models to study the structural behaviour of ventilated corrugated paperboard (VCP) boxes. The boxes were subjected to a compression load and the geometrical non-linearities of the box due to deformation were considered. The translation and rotation degrees of freedom were fixed in all directions for the bottom of the box while a uniform face pressure was applied to the top to simulate top-to-bottom compression. The FE models were validated against experimental results and the predicted compression strength differed by 10%. However, the displacement results of the FE model were also not reported.
Starke [3] used FE models of an MK4 inner and telescopic box to predict the compression strength of a box. The predicted strength was within 3% of the experimental value for both boxes; however, the model under-predicted the displacements by 77% and 92% for the inner and telescopic boxes, respectively.
Beldie et al. [4] conducted a study in which they individually compressed the top, middle, and bottom sections of a box. Their findings revealed that the upper and lower sections exhibited stiffness values that were 1.5 times greater than the entire box, whereas the middle segment demonstrated stiffness that was four times higher than the entire box. This significant difference in stiffness was primarily attributed to the presence of horizontal creases in the top and bottom sections, which resulted in the middle section being much stiffer by comparison.
Renman [5] investigated the role of creases when the load was transferred from the horizontal flaps to the panels of a box. He used a test fixture to investigate the compressive response and the eccentricity moment of a creased board to loading. A rectangular 80 m m by 220 m m sample was creased at 70 m m from the end, and folded to a 90° angle and compressed. The vertical portion of the sample was displaced by 4 m m at the failure load confirming that most of the deformation was confined to the creased region of the board.
The results of the studies conducted by [4,5] show that a significant portion of the vertical displacement measured during a BCT is due to the horizontal creases at the top and bottom of the box. However, studies carried out on the FE modelling of corrugated paperboard boxes do not consider the eccentricity caused by the horizontal creases leading to the models accurately predicting the compressive strength of the box, but significantly under-predicting the displacement as observed by Starke [3].
A detailed literature review [6] on the compression of corrugated paperboard boxes highlighted the fact that further research needs to be carried out to incorporate the influence of the vertical and horizontal creases in FE modelling. The purpose of this current work is to determine the homogenised effective material properties that accurately define the behaviour of horizontal creases, vertical creases, and panels for full-scale box simulation. The application of standard homogenisation techniques relies on material properties obtained from conventional uniaxial or biaxial tests to derive an analytical solution for the effective material properties. While these homogenisation techniques have been proven to be effective in evaluating the homogenised material properties of corrugated paperboard [7] and are efficient in predicting the load–displacement response for most load cases, they fail to effectively capture the behaviour of the board under complex multi-axial loads. This limitation highlights the need to apply inverse analysis as a more versatile homogenisation technique.
Inverse analysis, particularly through the finite element model updating (FEMU) method, utilises a FE model to simulate the conditions of experimental tests. This approach optimises the material properties of the FE model by minimising the differences between the experimental results and the FE analysis [8]. This approach has been utilised by various researchers [8,9,10] to develop material models for rubber and paper. One of the key advantages of the inverse method apart from the fact that it does not require an analytical solution lies in its ability to characterise materials under diverse and complex loading configurations that accurately reflect the physical scenarios compared to commonly used uniaxial or biaxial tests. However, the application of inverse analysis as a characterisation method results in representative material properties for the board under a specific load state that cannot necessarily be applied as a general solution that can be used for corrugated paperboard under different load cases. This was also observed in a study conducted by Murdock [11] where an optimal solution for material properties that was characterised with in-plane displacement data did not accurately simulate the out-of-plane displacement data. Therefore, the objective of this study is not to obtain an accurate material model for corrugated paperboard but rather develop a practical process for obtaining optimal material properties for different box sections as discussed in Section 2.1 under different loading states. Consequently, the inverse model serves as a powerful tool for determining the most effective homogenised FE material model for corrugated cardboard, capable of representing a wide range of loading configurations for use in full-scale box simulation.
In this study, bending tests were carried out to determine the bending stiffness of the board since the top-to-bottom compression strength of boxes is partly dependent on the load-carrying capacity of the panel areas which resist compression through bending. Bending tests were also carried out to determine the bending stiffness of the creased samples with the fluting oriented in the CD direction and a crease at the centre. Inverse analysis was applied using the results from the bending tests to determine the material properties that accurately predicted the bending stiffness of the creases and panels under compression loading. A homogenised FE model of a box was simulated using the obtained material properties and validated using experimental results.

2. Materials and Methods

2.1. Box Geometry And Features

The box design used for this study is the regular slotted container (RSC) shown in Figure 1. The size of the box is described in terms of length (L), width (W), and height(H). It consists of four different sections: the horizontal and vertical creases, panels, and flaps as described in Figure 1. The panels resist compression when the box is loaded through bending; since the panels have a pin connection at the vertical creases, they tend to bulge outwards from the centre of the panel under compression loading which consequently transfers the load-carrying capacity to the vertical creases of the box. The horizontal creases are the connection point between the flaps of the box and panels, and contribute to the initial deformation of the box under compression loading before the load is transferred to the panels and subsequently vertical creases.

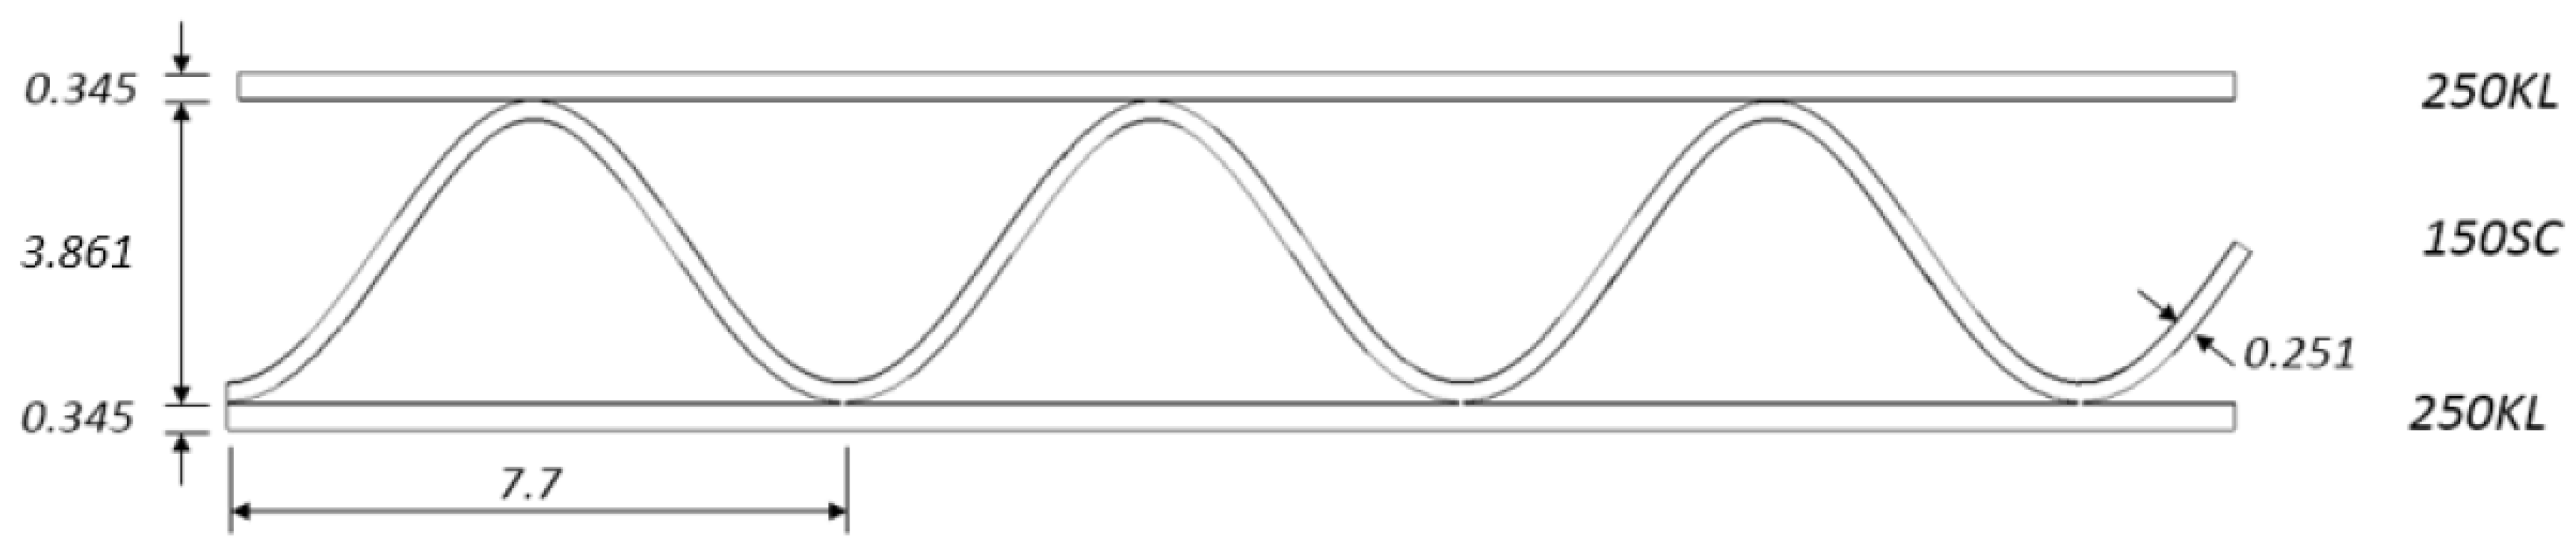
2.2. Paperboard Geometry

Corrugated paperboard is a sandwich structure consisting of two liners and a corrugated core. It is modelled as an orthotropic structure consisting of three directions, namely, the machine direction (MD) and the cross direction (CD), which is perpendicular to the MD and the out-of-plane direction (ZD) as shown in Figure 2 [12].
The paperboard and box samples used for this study were comprised of C-flute board combination of 250KL/150SC/250KL. 250KL refers to 250 grams per square metre (gsm) virgin kraft liner and 150SC refers 150 gsm semi-chemical fluting paper. All the samples used in this study were conditioned at 23 °C and 50% relative humidity (RH) for 24 h before the experiment was conducted according to BS EN 20187, 1993 standard [13].

2.3. Four-Point Bending Tests

Results obtained by [14] for the four-point bending stiffness tests in the machine direction and cross direction were used. The test samples used by [14] were from the same paperboard specifications as used in this study (described in Section 2.2), and all the tests were conducted according to the ISO 5628 (1990) standard [15].
However, for this study, further bending tests were carried out to determine the bending stiffness of the creased samples oriented in the CD with a crease at the centre of the sample (Figure 3) according to the ISO 5628 (1990) standard. The purpose of this test was to determine the bending stiffness of the vertical creases shown in Figure 1 when the box is under compression loading. Ten 400 m m by 100 m m samples were used to evaluate the repeatability of the test.
Tests were conducted on an Instron 5982 universal testing machine using an HBM S2M (100 N) loadcell and a HBM WA100 (100 m m ) linear variable differential transducer (LVDT). Both sensors were placed in position and connected to a Quantum X MX840B for data collection. The LVDT was used to measure the deflection at the centre of the sample where the crease was located. The testing machine was connected to a Dell computer equipped with Blue-hill data acquisition software and a laptop running Catman Easy data acquisition software. Figure 4 shows the experimental setup.
The four-point bending jig was positioned and securely attached to the Instron machine. The anvils on the bottom platen were set 200 m m apart, while those on the top platen were spaced 340 m m apart, leaving a free span of 70 m m on either side of the board. The displacement rate was set to 12.7   m m   min −1 and a sample was placed between the top and bottom anvils. The load and displacement data for each sample were recorded until failure was detected. The Instron machine was programmed to automatically stop when a 10% drop in maximum load was detected. The bending stiffness was calculated using Equation (1) [16].
S b = 1 16 P Y L 3 b a L
where P represents the maximum/failure load, Y denotes the maximum deflection at the centre of the sample, L is the distance between the inner supports (anvils on the bottom platen which were spaced 200 m m apart), a is the distance between a supporting anvil and loading anvil which was calculated as 70 m m , and b is the width of the sample determined as the shorter length of the sample (100 m m ).

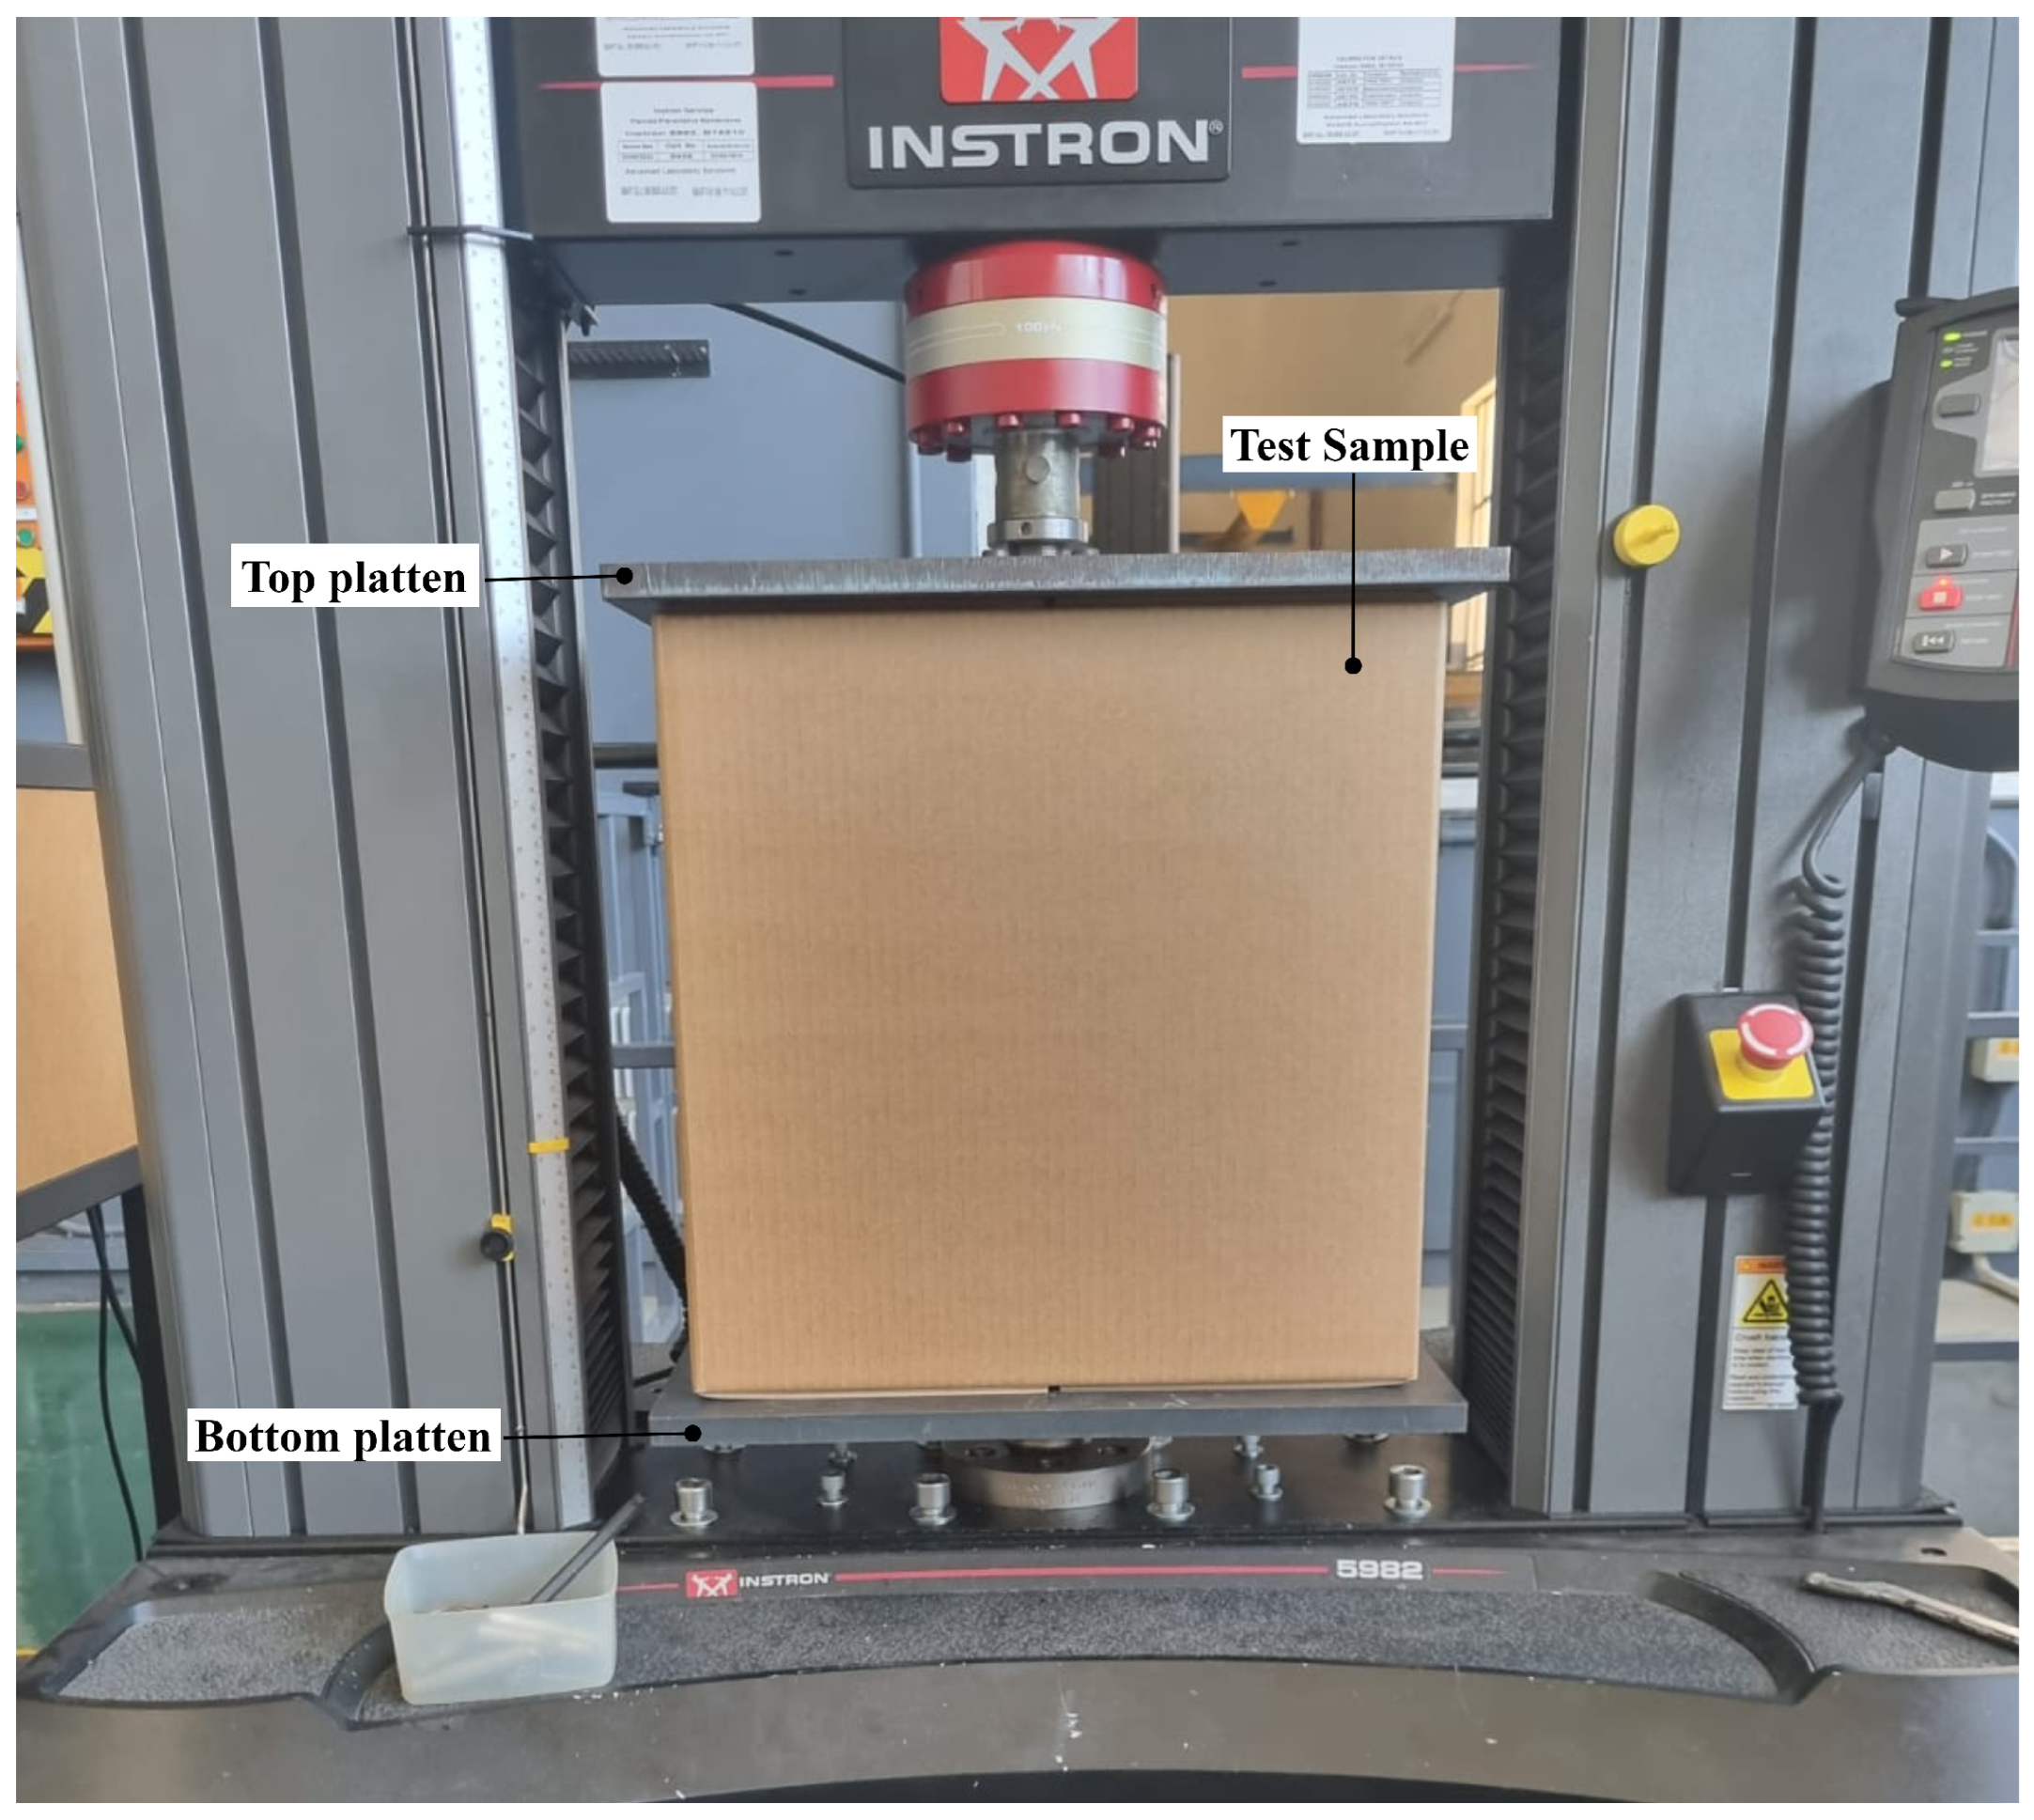
2.4. Box Compression Tests

The TAPPI T 804 standard was applied to determine the compression strength of a 400 m m by 400 m m box. Compression testing was conducted on two types of boxes: standard MK4 regular slotted containers and MK4 tubes (boxes without flaps).
The tests were conducted on an Instron 5982 testing machine using 500 m m by 500 m m top and bottom platens as depicted in Figure 5. A pre-load of 223 N was applied, with the machine’s cross-head displacement rate set to 10 m m   min −1. The Instron machine was configured to automatically stop when the load supported by the carton decreased by 10% from the peak load. The force–displacement curves for the standard boxes with flaps and tubes are discussed in Section 3.4.

2.5. Finite Element Modelling

2.5.1. Four-Point Bending Tests

Structural and homogenised finite element models were developed to simulate the four-point bending tests, using a non-linear FEA Code, Msc Marc, and Mentat (MSC Software Corporation, Newport Beach, CA, USA, 2021). The geometries were similar to the samples used for conducting the experiments and were modelled in the CAD software, Autodesk Inventor Professional (Autodesk US, San Francisco, CA, USA, 2023). The geometry of corrugated paperboard was created by joining three layers consisting of two liners and a fluting medium together by connecting the extreme positions of the fluting directly to the liners by sharing the same nodes, similarly to the method in [7]. For the structural model, the corrugated core was idealised as a sine wave with the flute height and wavelength as described in Figure 6.
A second set of structural and homogenised FE models were developed to simulate four-point bending tests on a creased sample. The creased region was defined using an interface of creased elements that were assigned different material properties as shown in Figure 7 and Figure 8.
To be able to capture both the elastic and plastic deformation of the board, an elastic–plastic orthotropic material model with Hill’s yield criterion was specified for the paperboard material. The in-plane elastic properties ( E 1 , E 2 ) used for the liners and corrugated core of the un-creased regions of the structural model were determined from tensile tests conducted on individual paper sheet samples of the C-flute board and are presented in Table 1. The other elastic constants shown in Table 1 were difficult to determine experimentally due to the anisotropy of paper and the small thickness of the material. For this reason, the out-of-plane elastic modulus, E 3 , was approximated using Mann et al.’s [17] Equation (2):
E 3 = E 1 190
The shear moduli were also approximated using Baum’s [18] Equation (3):
G 13 = E 1 55 , G 12 = 0.387 E 1 E 2 , G 23 = E 2 35
In-plane Poisson’s ratio was also approximated using Baum’s [18] relation (Equation (4)):
ν 12 = 0.293 E 1 E 2
where subscripts 1, 2, and 3 refer to the local coordinate system of the material and represent the MD, CD, and ZD directions as displayed in Figure 2 which correspond to X, Y, and Z for the global coordinate system, respectively. For the homogenised FE model, the equivalent material properties of the core were calculated using classical laminate plate theory (CLPT) as outlined in [7] and are shown in Table 1. The out-of-plane elastic modulus, E 3 , for the homogenised core was approximated as 3000 and out-of-plane Poisson’s ratios ( ν 23 , ν 13 ) for both the liners and core were approximated as 0.01 as determined by Nordstrand [19].
For the structural FE models shown in Figure 7, since the creased region was characterised by localised material failure of the liners and core, it was important to determine the correct material properties to be used for the creased region. The material properties used for this region were obtained from the calibration of the structural model with the experimental results using the procedure discussed in Section 2.6 and minimising the difference between the experimental and structural FE model force–displacement results. The results obtained from calibration are presented in Appendix A, Table A1. From the results presented in Table A1, it is observed that only E 1 for the liners is optimised; this is because for the creased section the flutings are crushed and therefore have a less significant effect on the stiffness of the board, and the liners which contribute significantly to the stiffness of the material are aligned in the machine direction; hence, the optimiser is only sensitive to E 1 for the liners. The material properties used to define the creased region are specified in Table 2 and were less than the original material properties by approximately 58% to 70% for the corrugated core and 60% to 65% for the liners. The width of the creased region in the FE model was determined by measuring the width of the creased region on the physical paperboard sample, and was approximated as 4 m m .
Hill’s yield criterion was used to simulate the plastic behaviour of the board since it accounts for the anisotropy of the board and has also been applied by many researchers in modelling corrugated paperboard [20,21]. The anisotropic Hill yield function is defined as follows [21]:
Y ( σ ) = F ( σ 22 σ 33 ) 2 + G ( σ 33 σ 11 ) 2 + H ( σ 11 σ 22 ) 2 + 2 L σ 23 2 + 2 M σ 31 2 + 2 N σ 12 2
where F, G, H, L, M, and N are constants used to describe the anisotropy and are obtained using uniaxial tests with different material orientations as shown in Equation (6):
F = 1 2 1 R 22 2 + 1 R 33 2 1 R 11 2 G = 1 2 1 R 33 2 + 1 R 11 2 1 R 22 2 H = 1 2 1 R 11 2 + 1 R 22 2 1 R 33 2 L = 3 2 R 23 2 , M = 3 R 31 2 , N = 3 R 12 2
where R 11 , R 22 , R 33 , R 12 , R 31 , and R 23 are the stress ratios of actual yield stresses in various material directions to the average yield stress defined as Equation (7):
R 11 = σ 0 σ a v , R 22 = σ 90 σ a v , R 33 = σ N σ a v R 12 = R 33 3 2 r 45 + 1 , R 23 = R 31 = 1.0
Hill’s yield criterion is implemented in Msc Marc using stress and shear coefficients (yield ratios) described in Equation (8) as input parameters.
Y R D I R ( 1 ) = R 11 , Y R D I R ( 2 ) = R 22 , Y R D I R ( 3 ) = R 33 Y R S H R ( 1 ) = R 12 = Y R D I R ( 3 ) 3 2 r 45 + 1 Y R S H R ( 2 ) = R 23 = 1.0 , Y R S H R ( 3 ) = R 31 = 1.0
where σ a v is the initial yield stress on the stress curve defined as follows:
σ a v = σ 0 + σ 90 + 2 σ 45 4
σ N is the yield stress in the thickness direction described as follows:
σ N = σ 90 r 0 ( 1 + r 90 ) r 0 + r 90
r is the strain ratio measured in the three directions and defined as follows:
r = ε w i d t h ε t h i c k n e s s
The yield stresses used to calculate yield ratios were determined by Cillie [14] for the same corrugated board and are presented in Table 3.
A thick-shell element with six degrees of freedom per node (x-, y-, and z-translation and rotation) was utilised for both the structural and homogenised models. A mesh convergence study was conducted to determine the optimal mesh size. The study converged to a 0.5   m m square mesh for the structural model and 2 m m for the homogenised models based on the bending stiffness of the board with a threshold of 0.1   N   m −1. Symmetry surfaces, (symm–y and symm–x) were used to model one-quarter of the experimental samples as illustrated in Figure 7 and Figure 8. The symmetry surfaces accounted for all six rigid body motions and no other boundary conditions were included in the model. Load was applied using a downward position control on the top cylinder ramped up using a linear timetable and the bottom cylinder was kept static. Static analysis was conducted using the Full Newton–Raphson iterative method, with the load being applied incrementally through a multi-criteria adaptive stepping procedure.

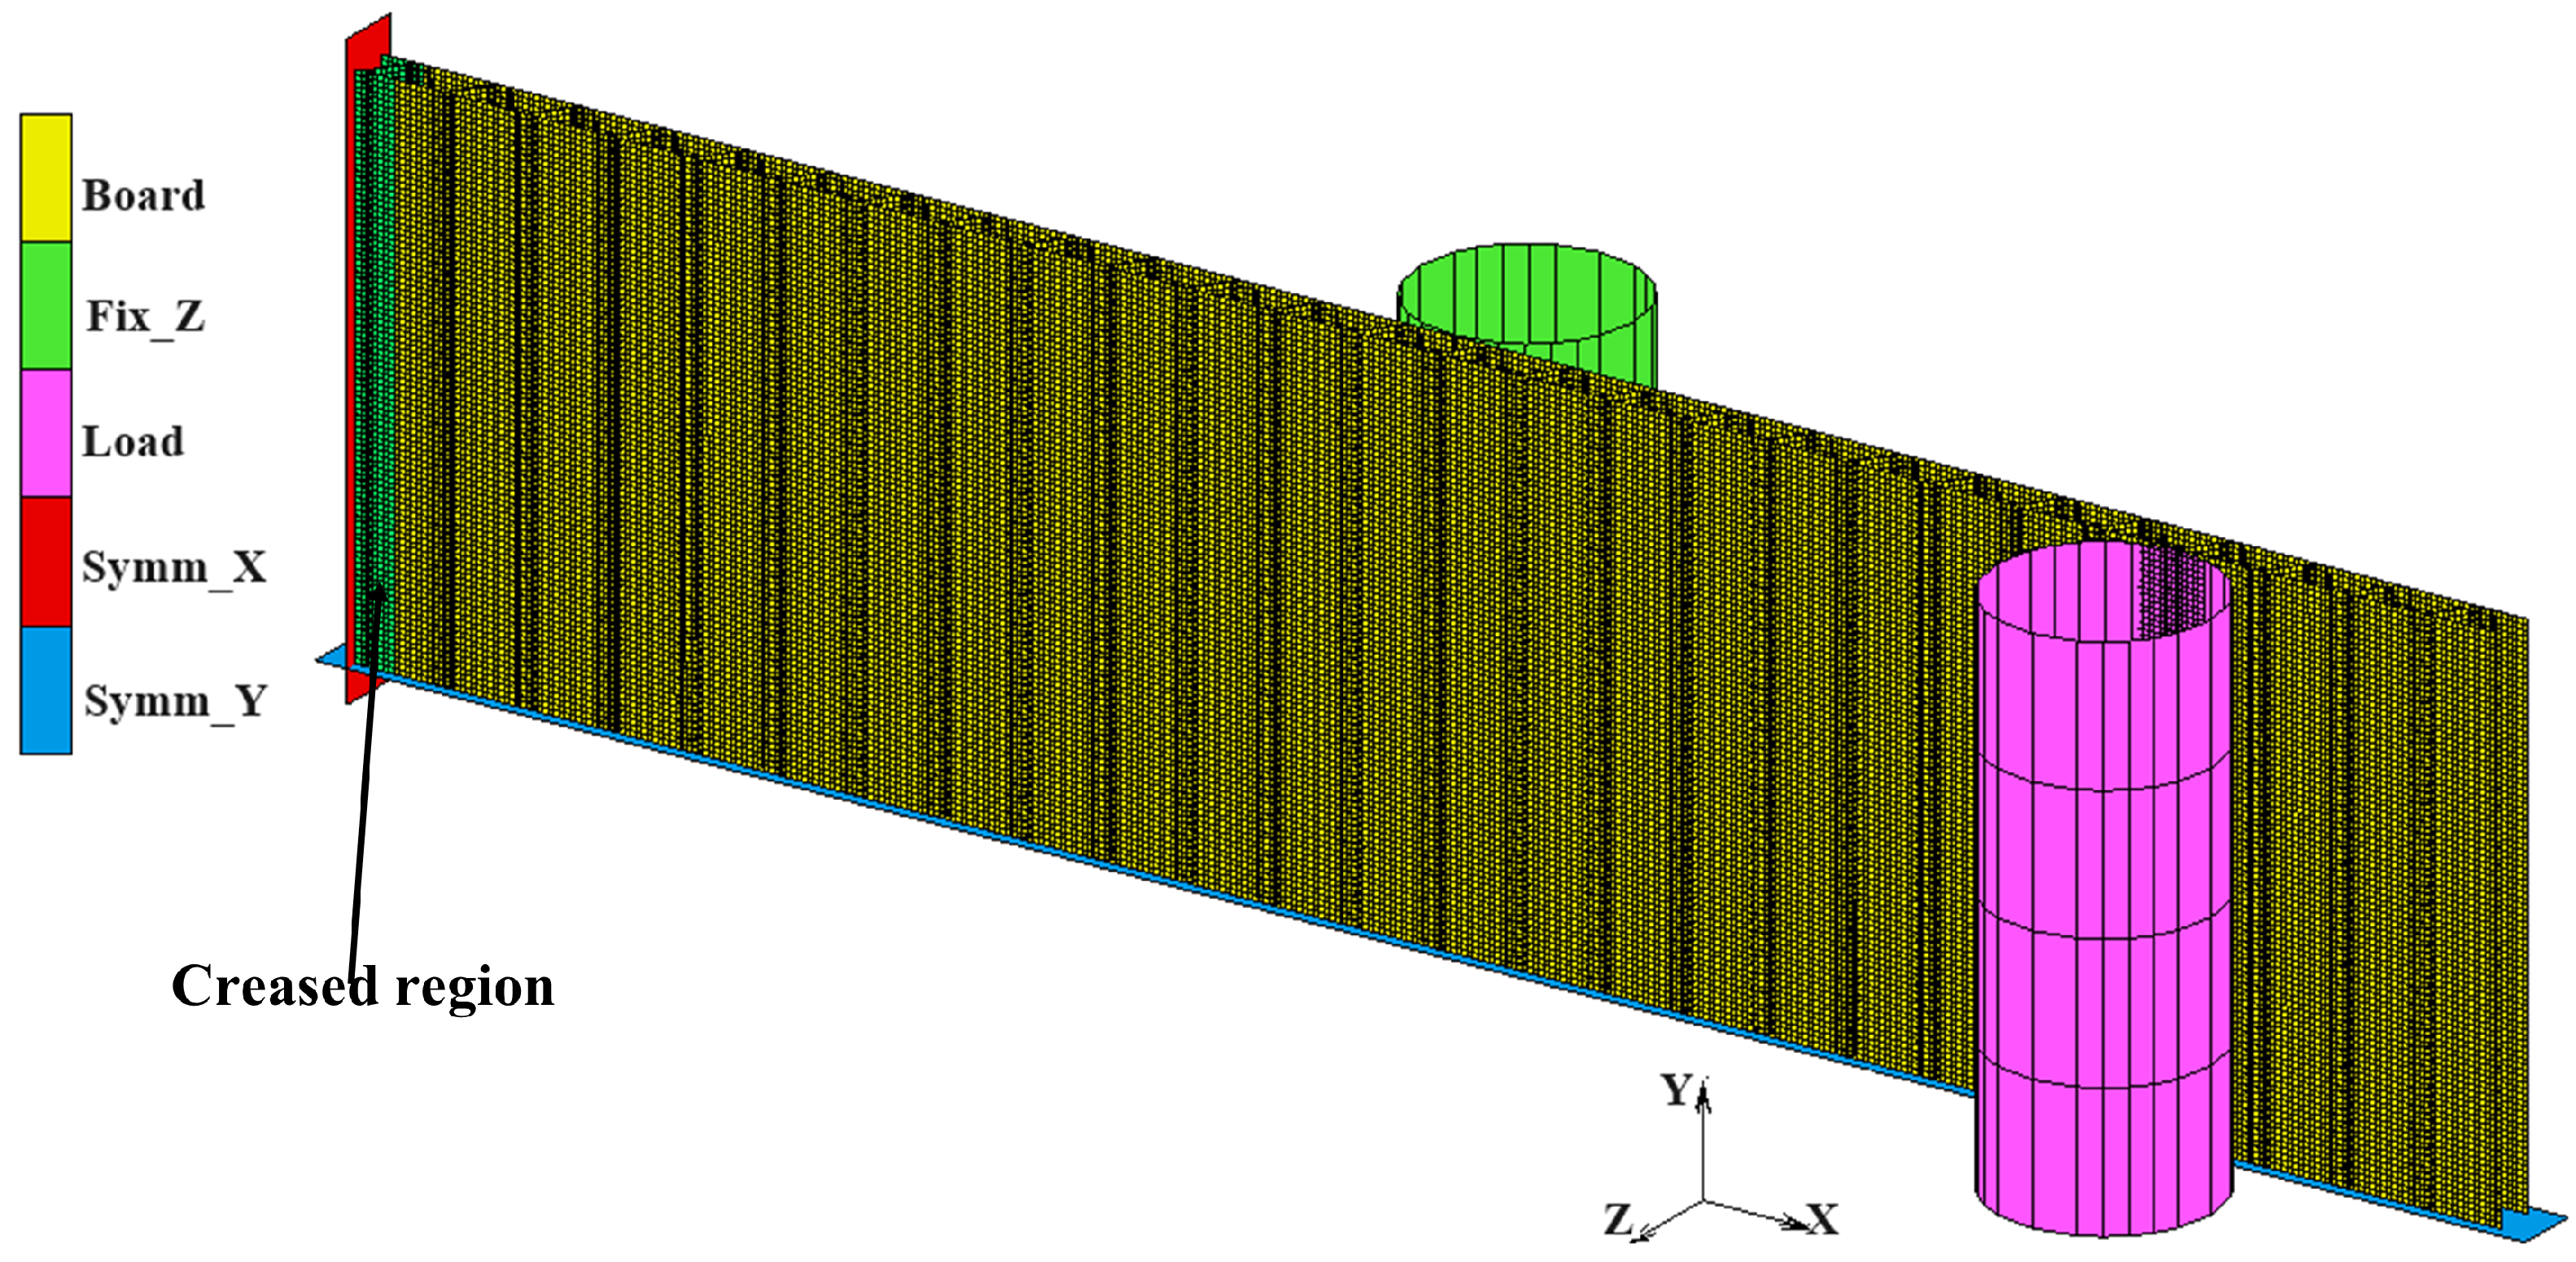
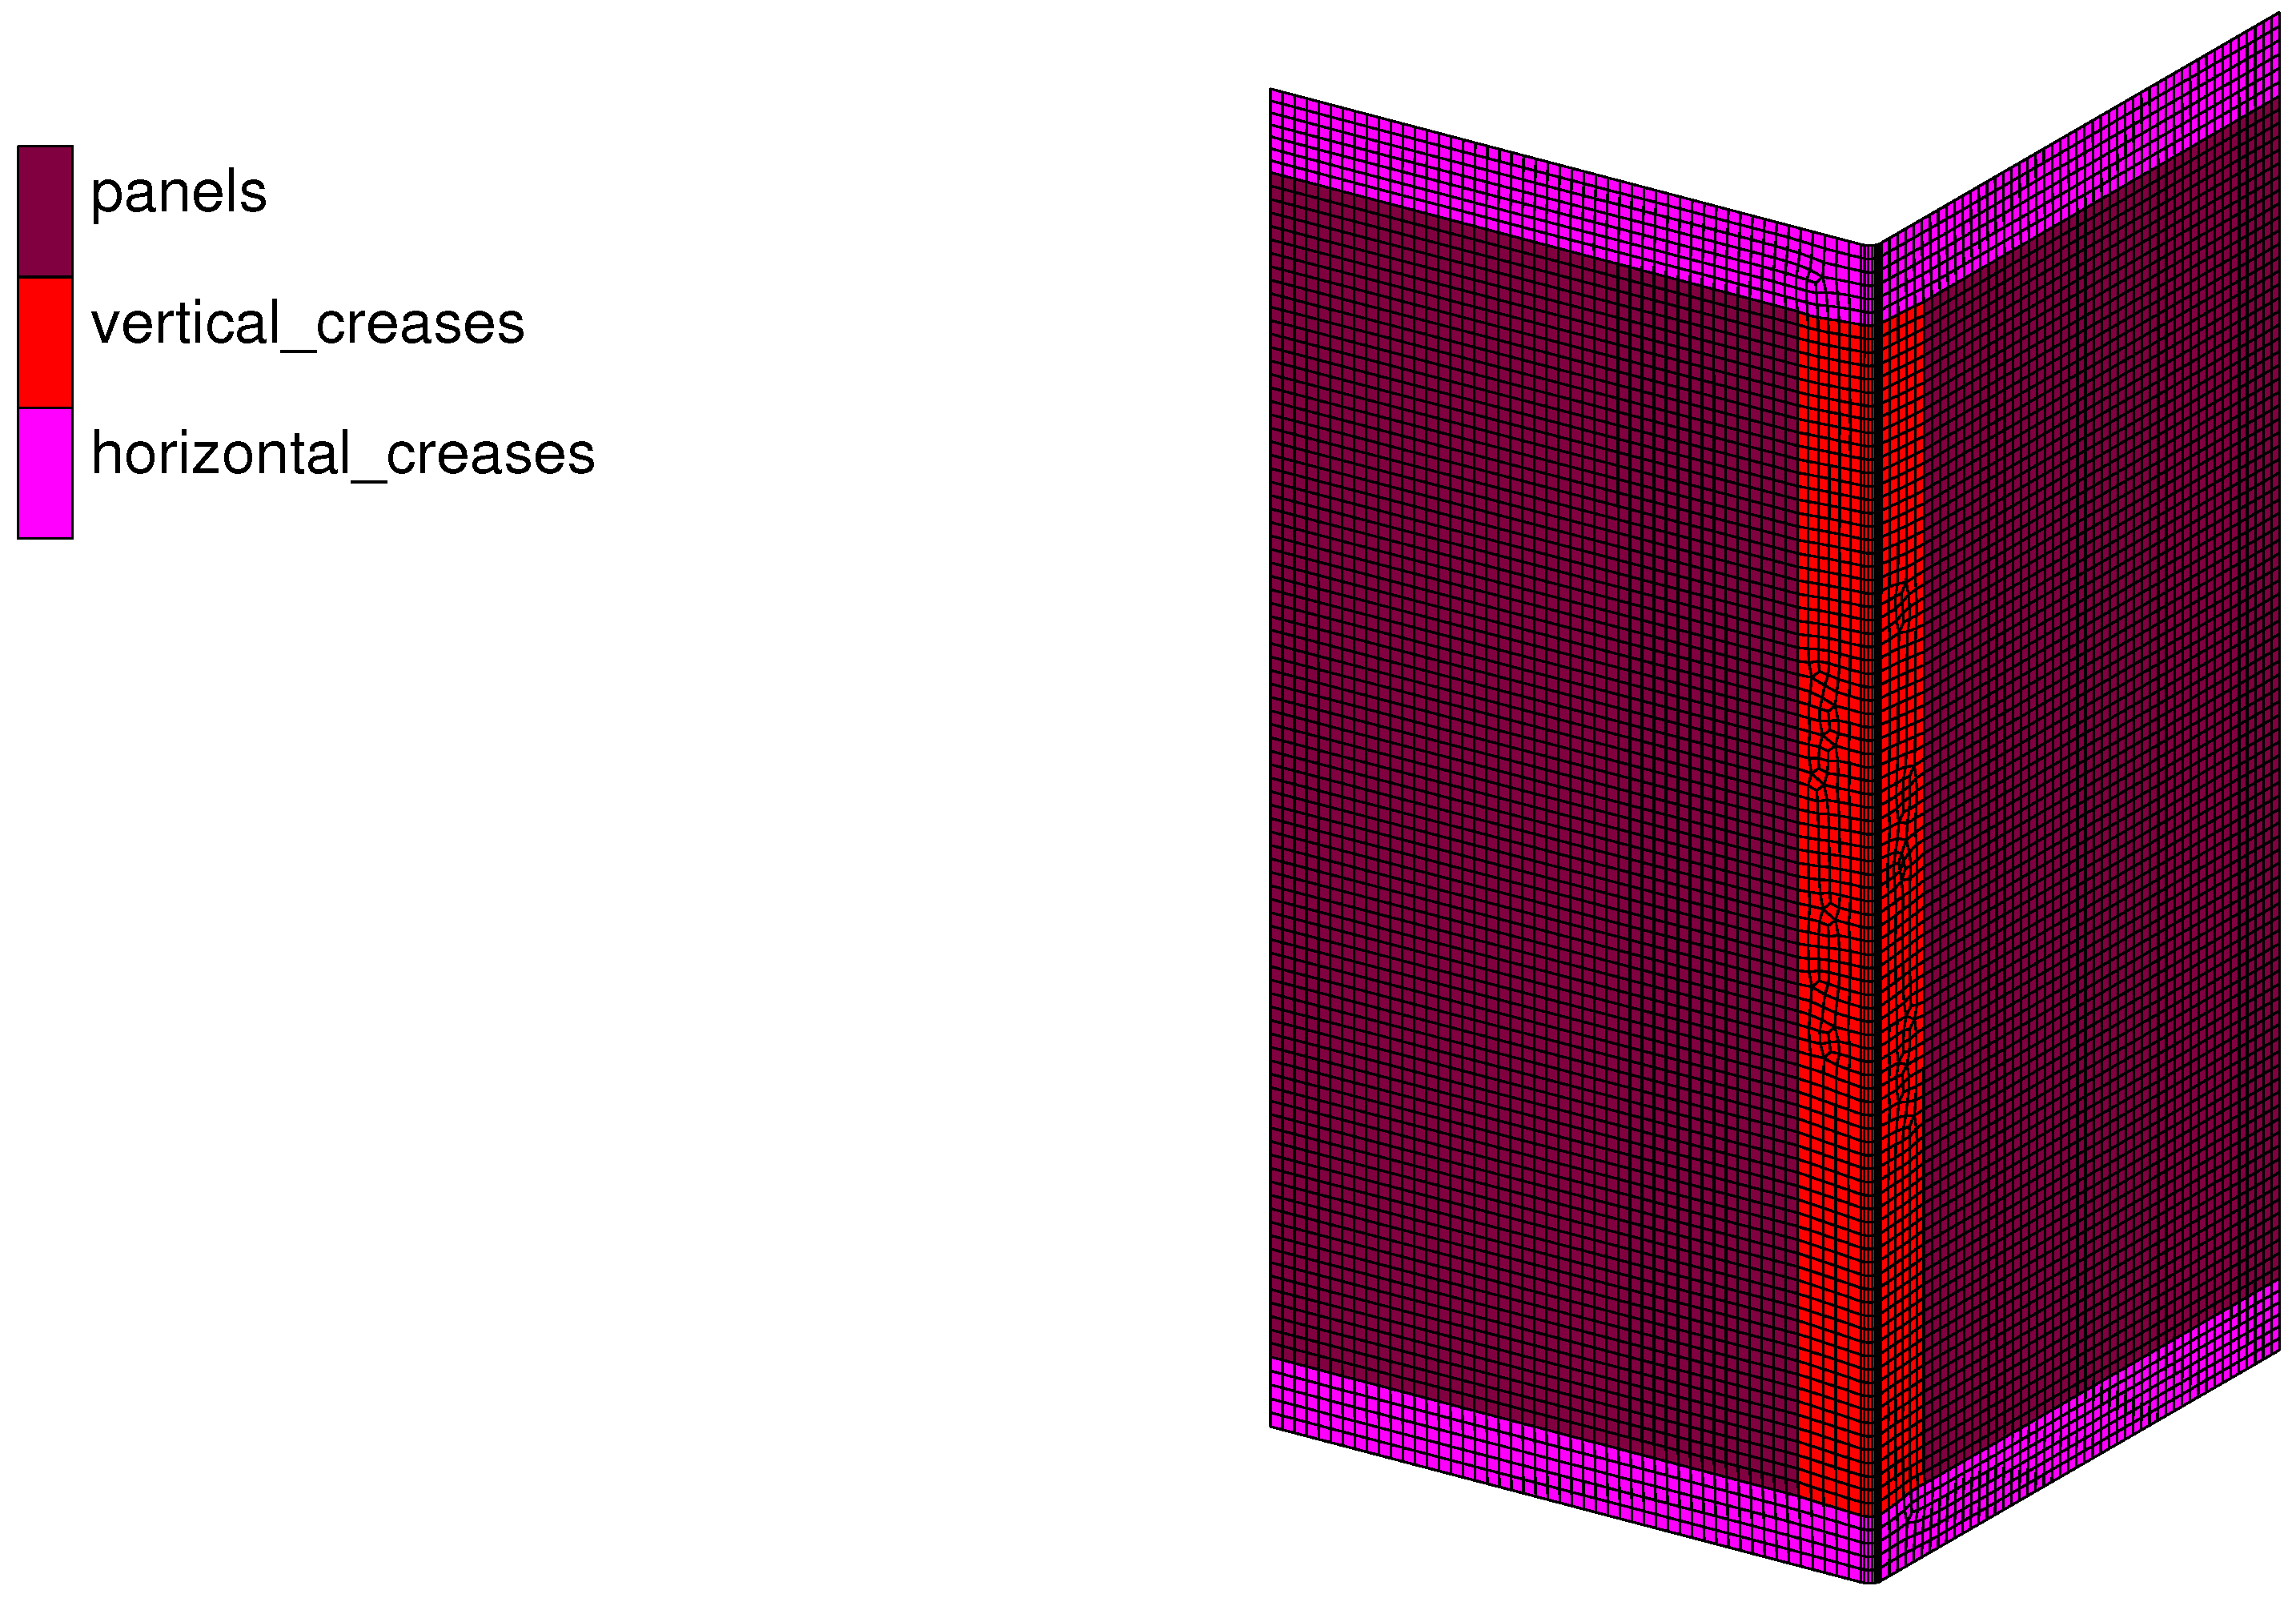
2.5.2. Horizontal Creases

Edge compression tests were also carried out initially with the aim of using the compression results to determine the best material model for predicting the horizontal creases of a box. Due to the structural FE models over-predicting the ECT value by 23% and differing failure modes, edge crushing from local buckling of the liners in the experiment versus localised buckling of the fluting in the FE model, it was not feasible to calibrate the homogenised FE models using the structural FE models. Instead, structural and homogenised FE models of the horizontal creases were used to determine the best material model that accurately predicted the behaviour of the horizontal edges of a box under compression loading.
A FE model of the creased region was developed as shown in Figure 9 and Figure 10. The length of the sample was 100 m m while the height was 25 m m . The sample was creased at 15 m m from one end and folded to a 90° angle. A 1 m m square mesh consisting of a four-node, thick-shell element was utilised. Translation in the x, y, and z directions was fixed at the bottom while the load was applied using a downward position control on the rigid body increased using a linear timetable. The load increments were applied using a multi-criteria adaptive stepping procedure and static analysis was conducted using Newton–Raphson iterative procedure.
The stiffness of the creased region was determined as outlined below:
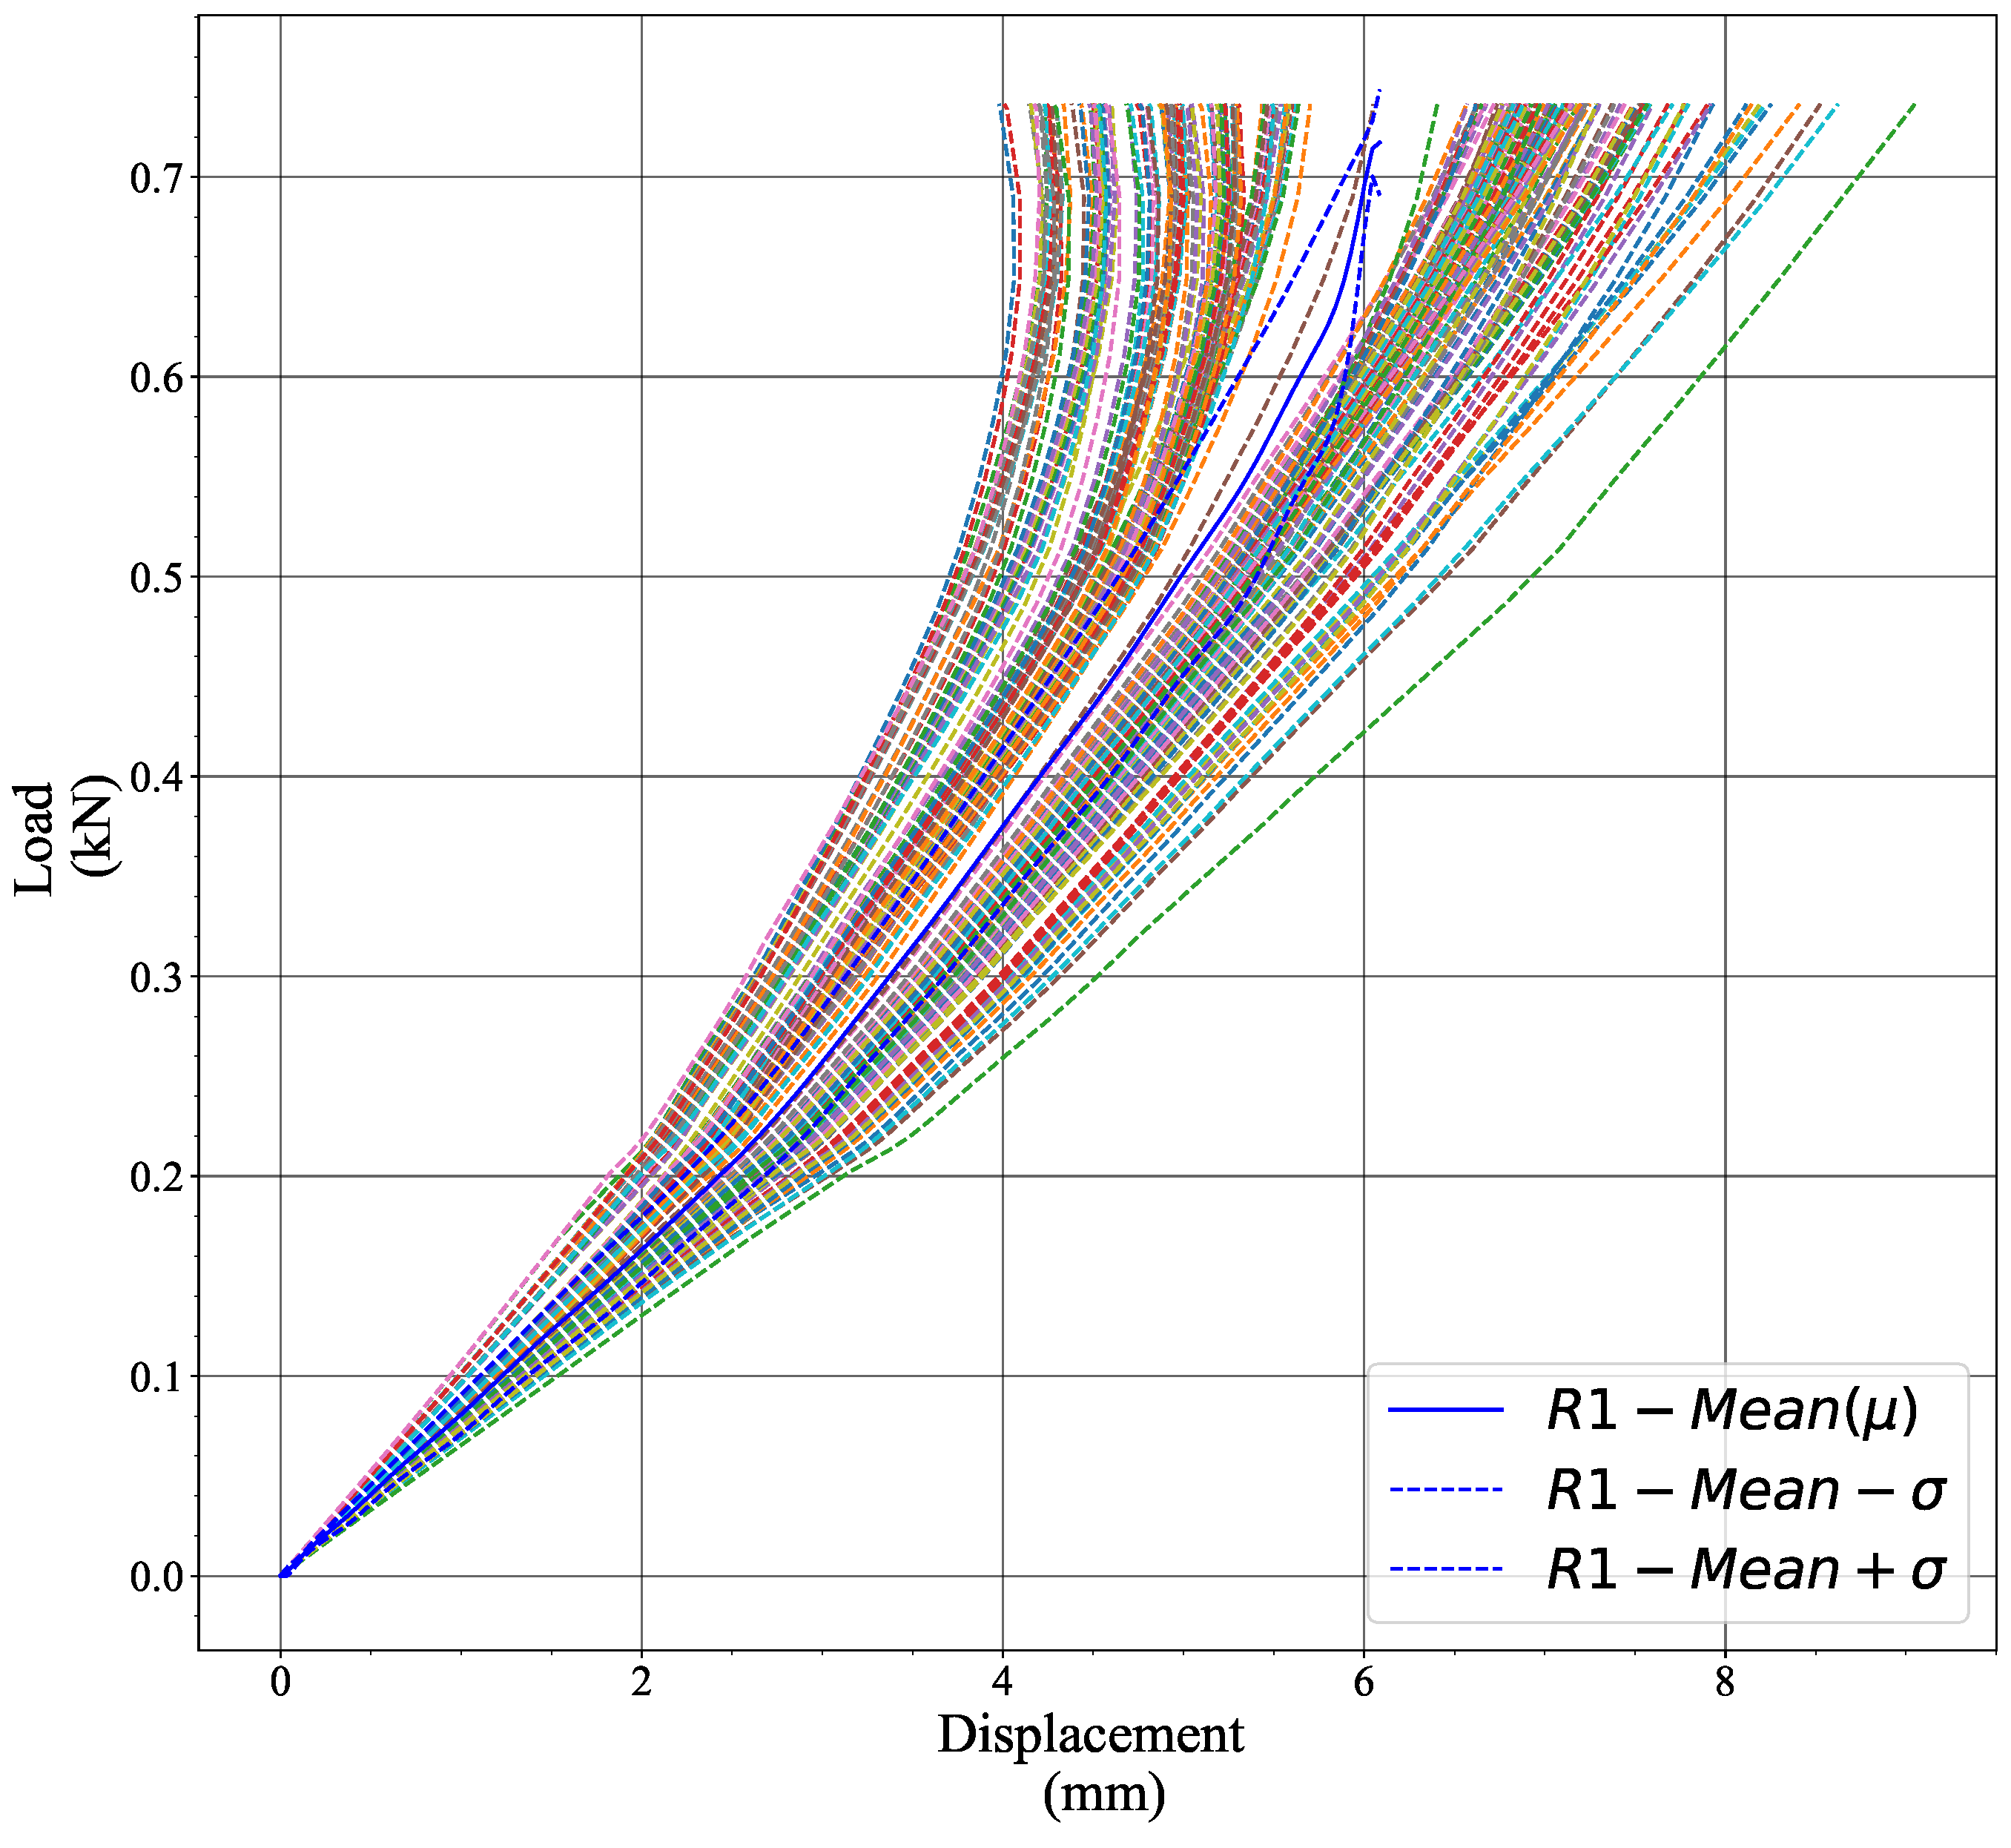
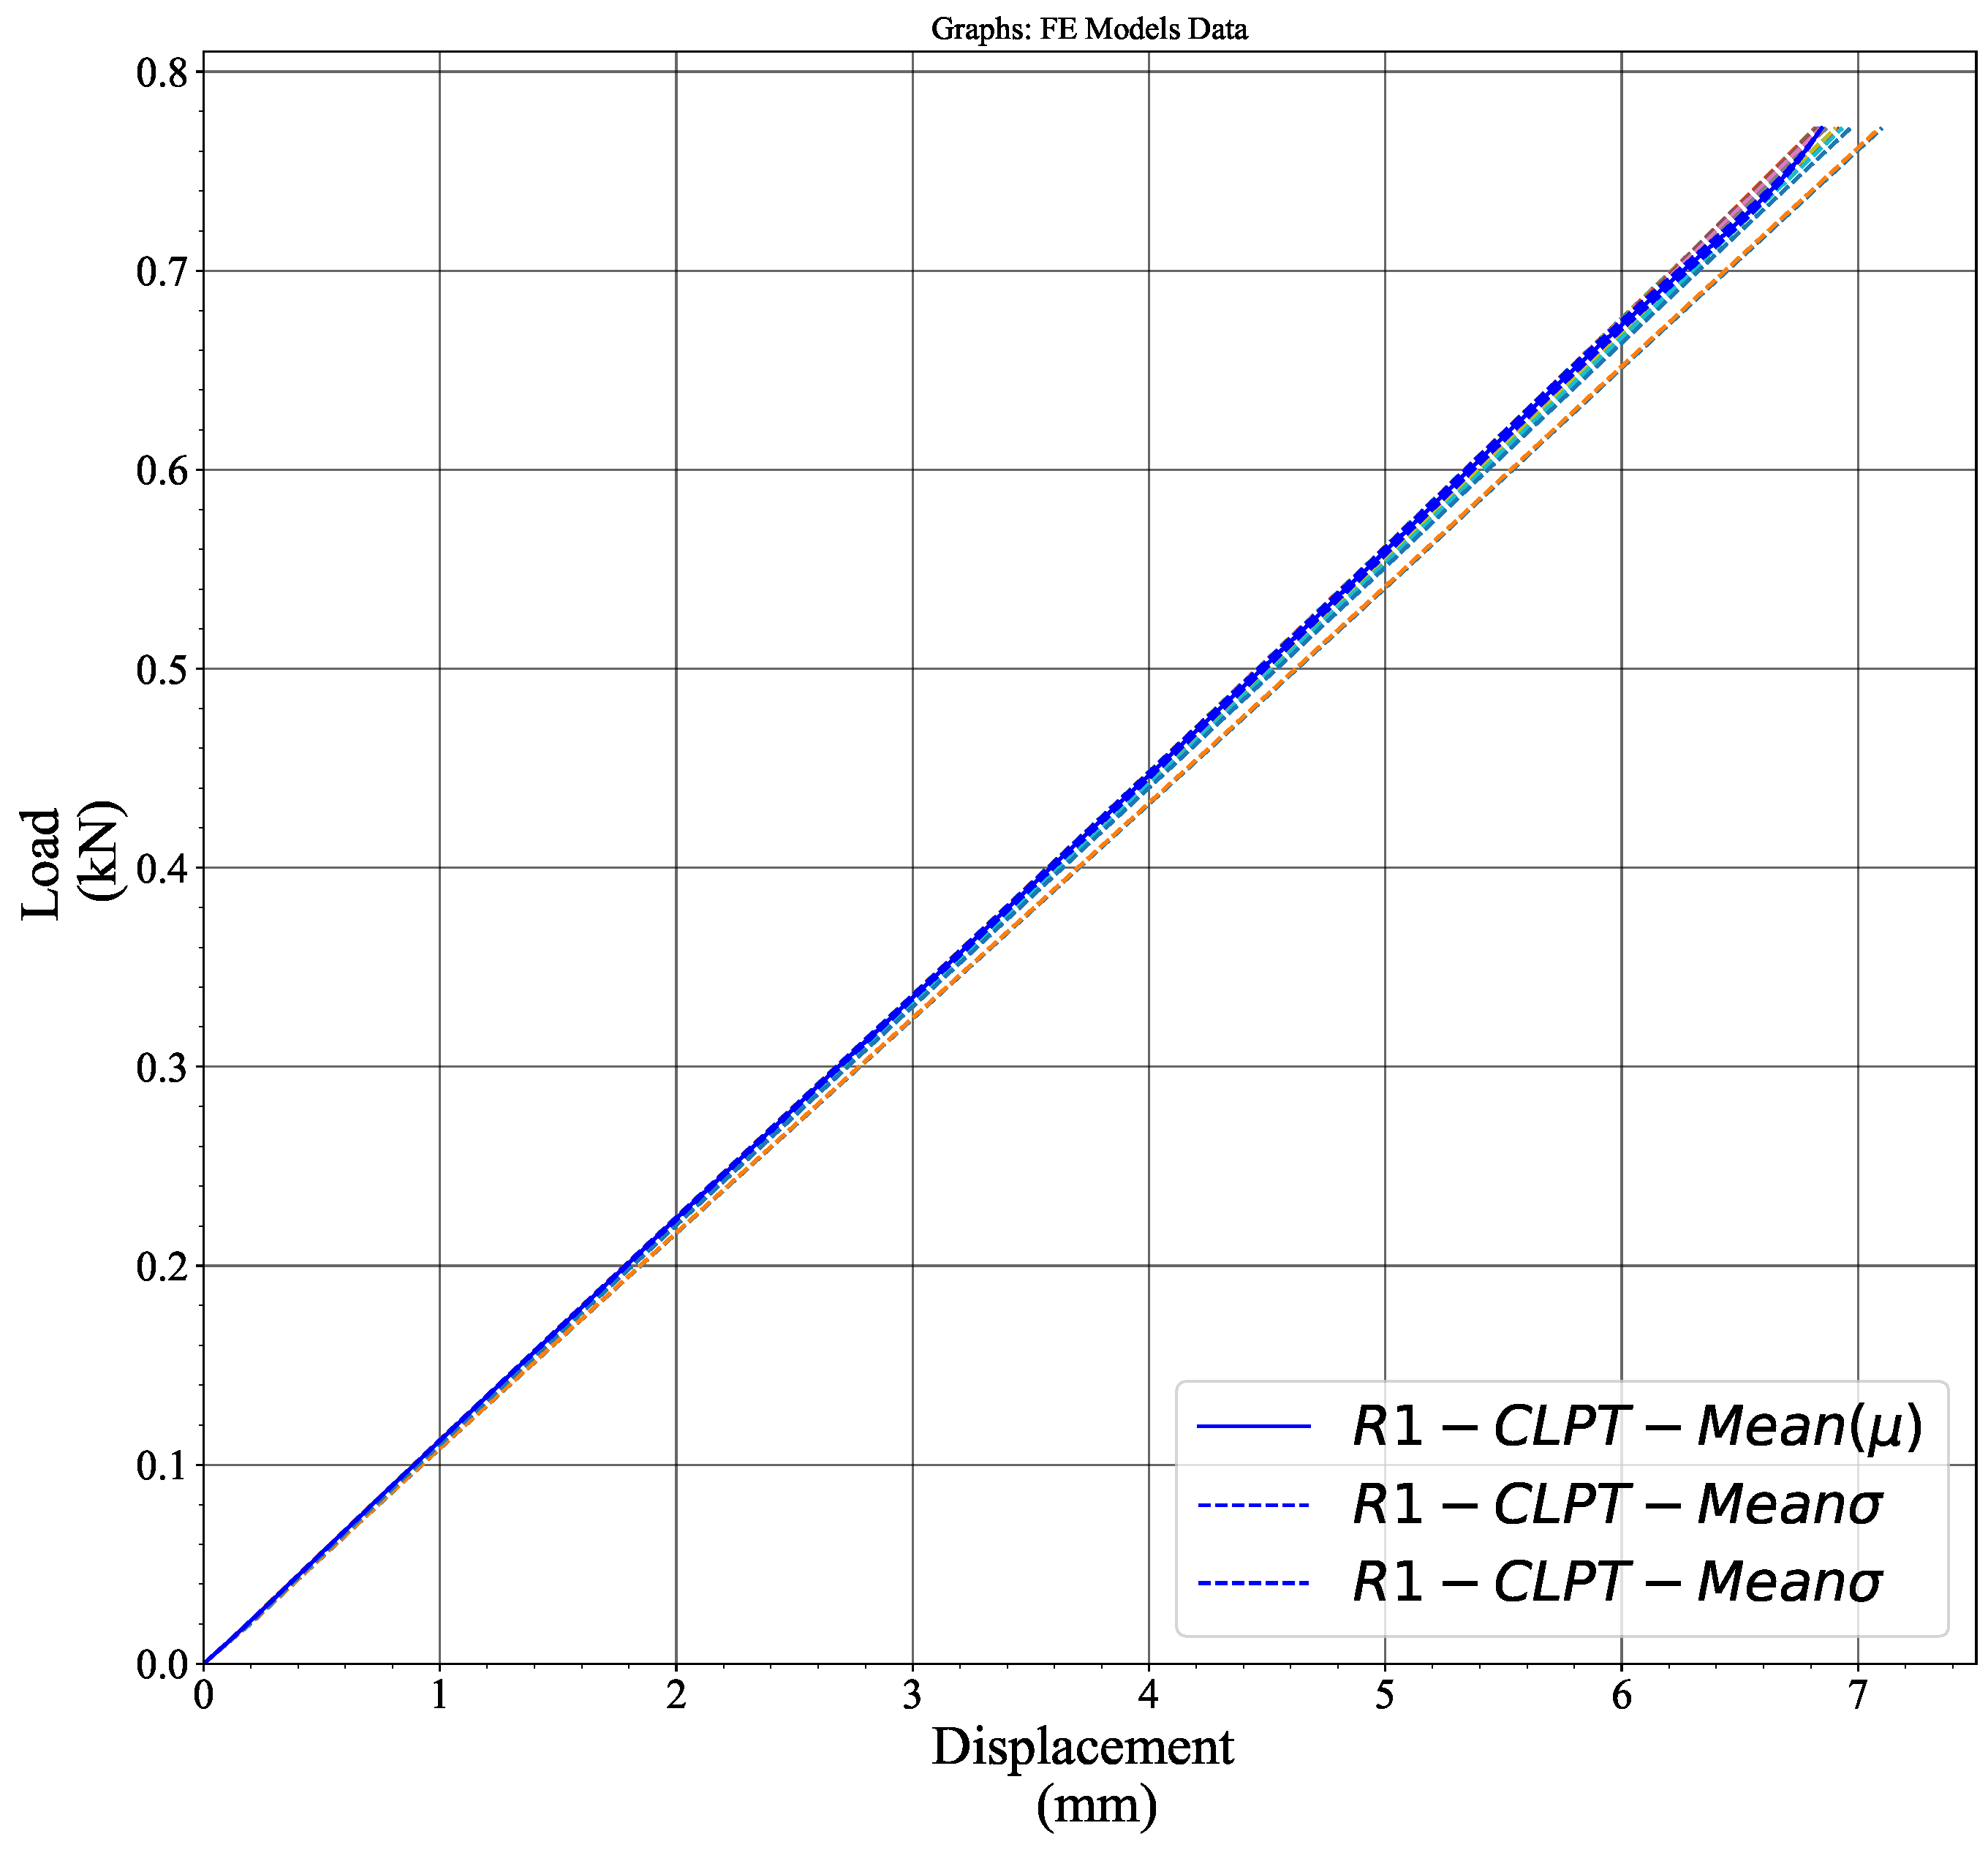
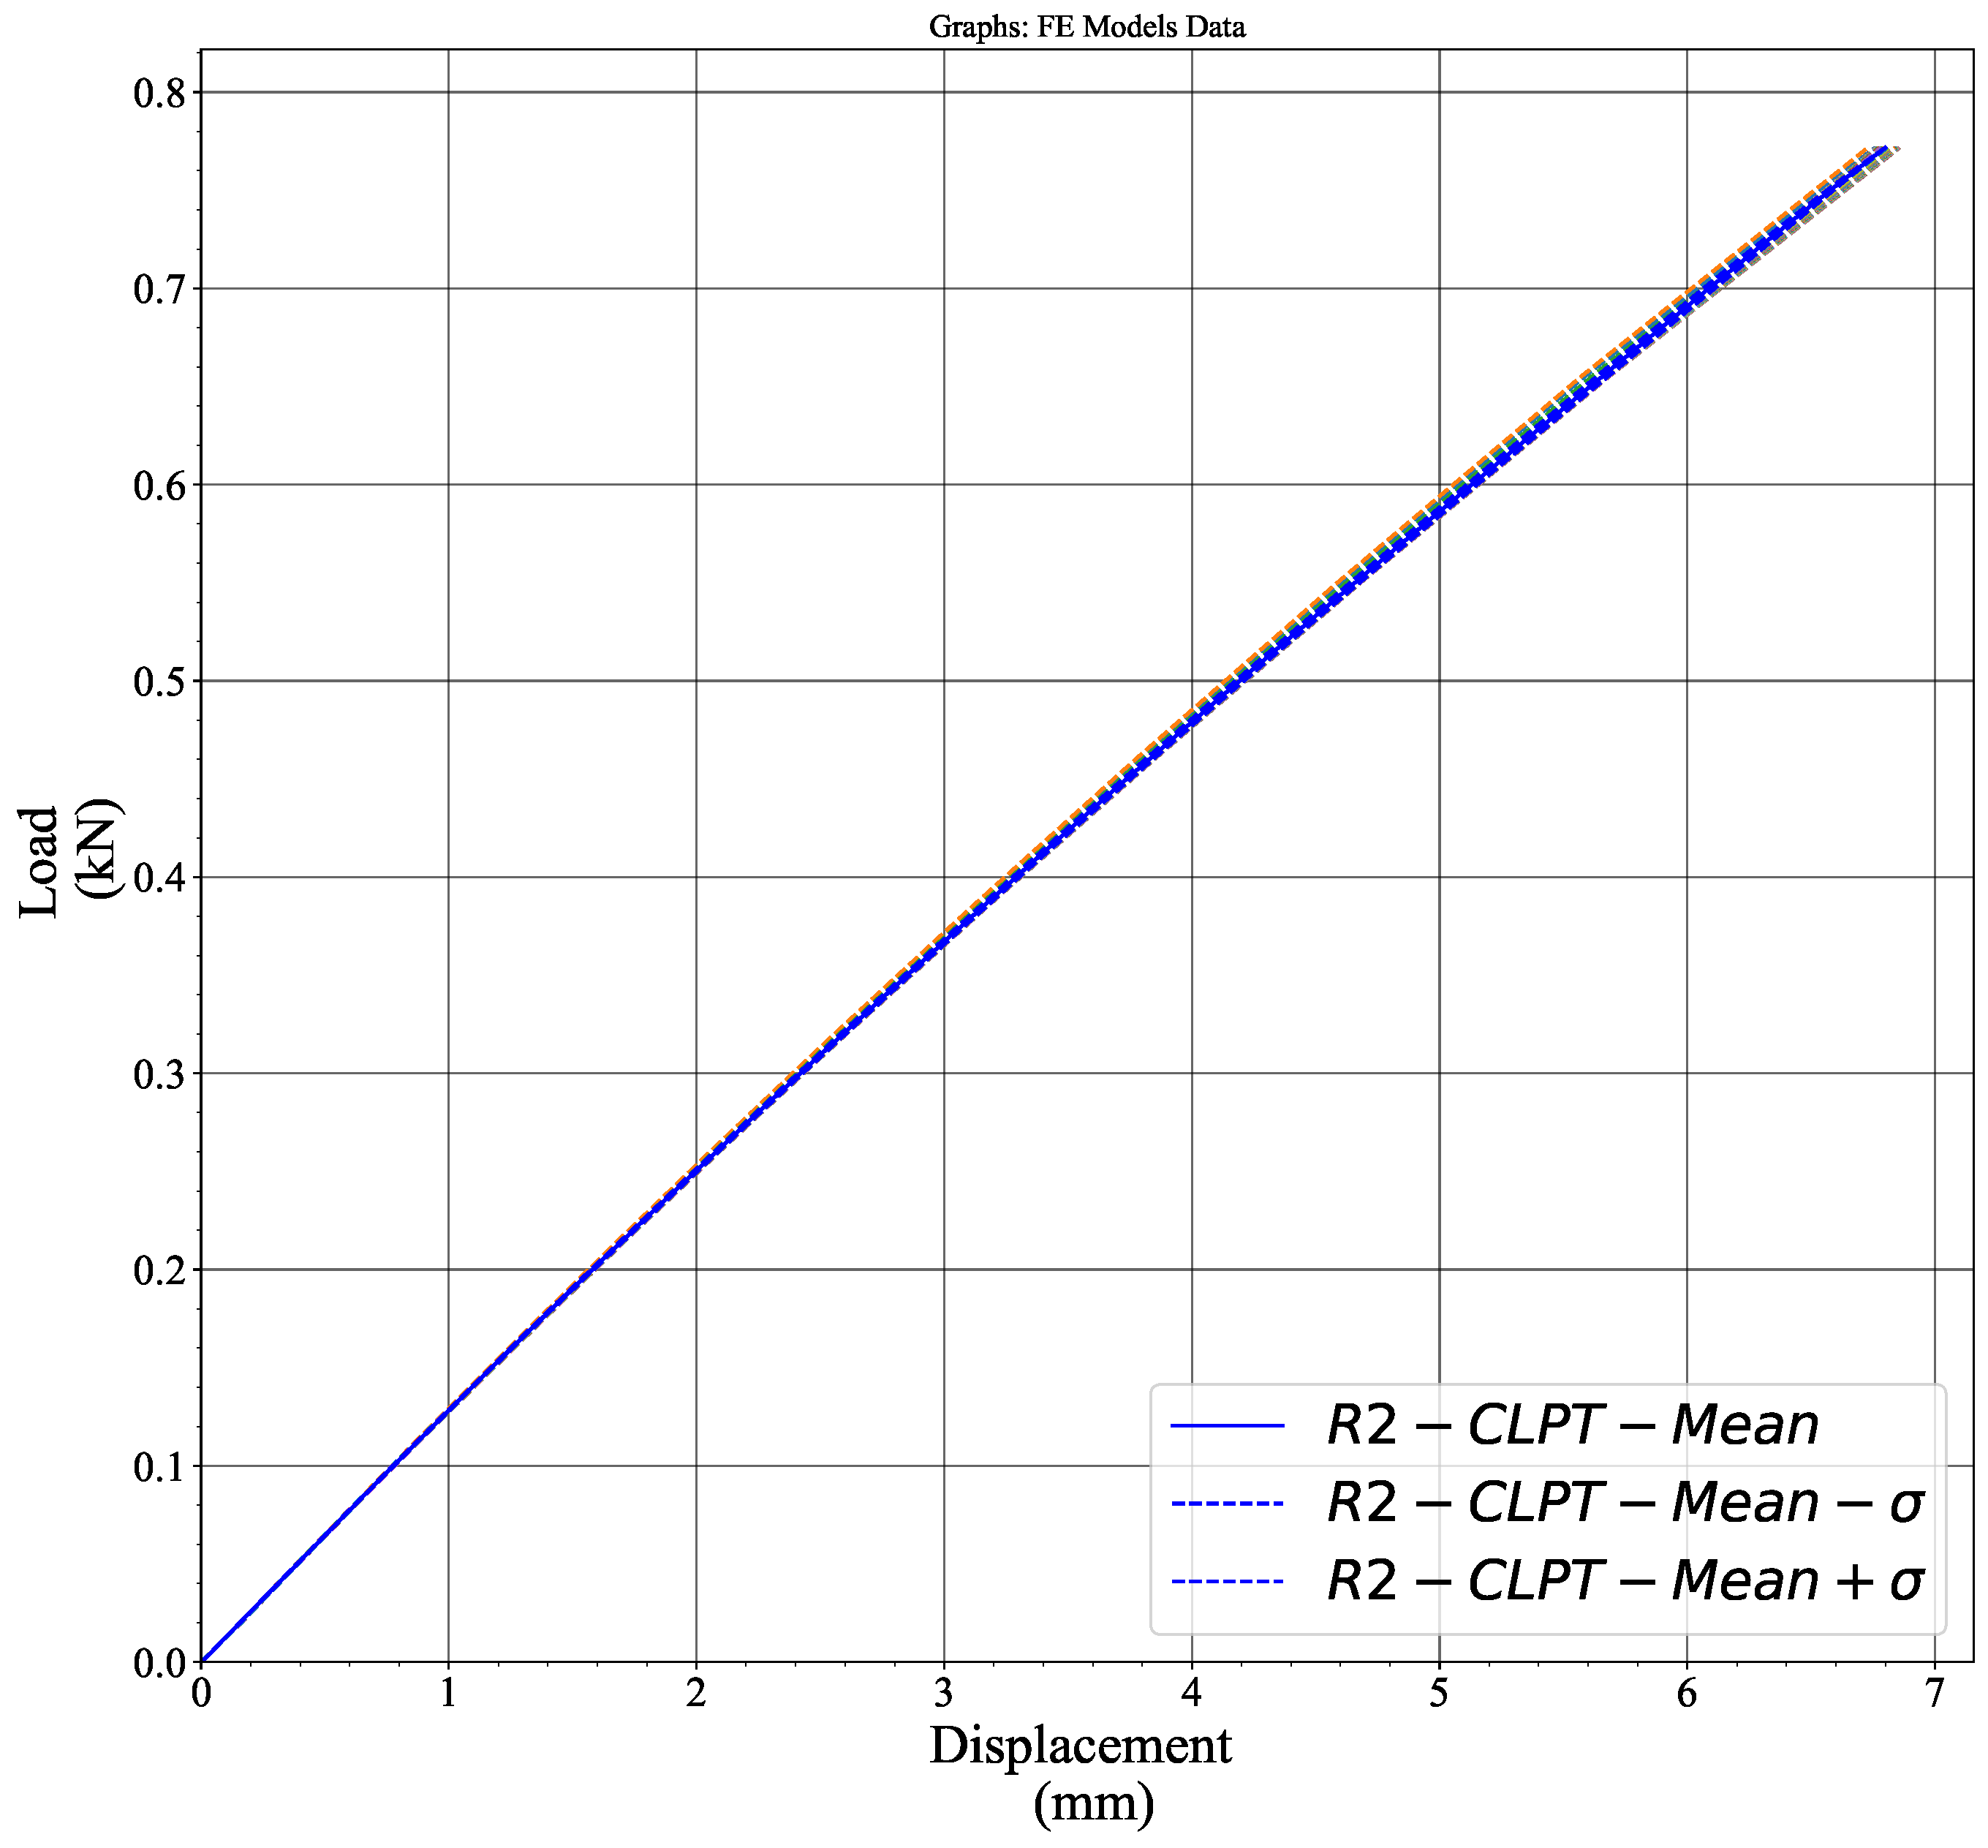
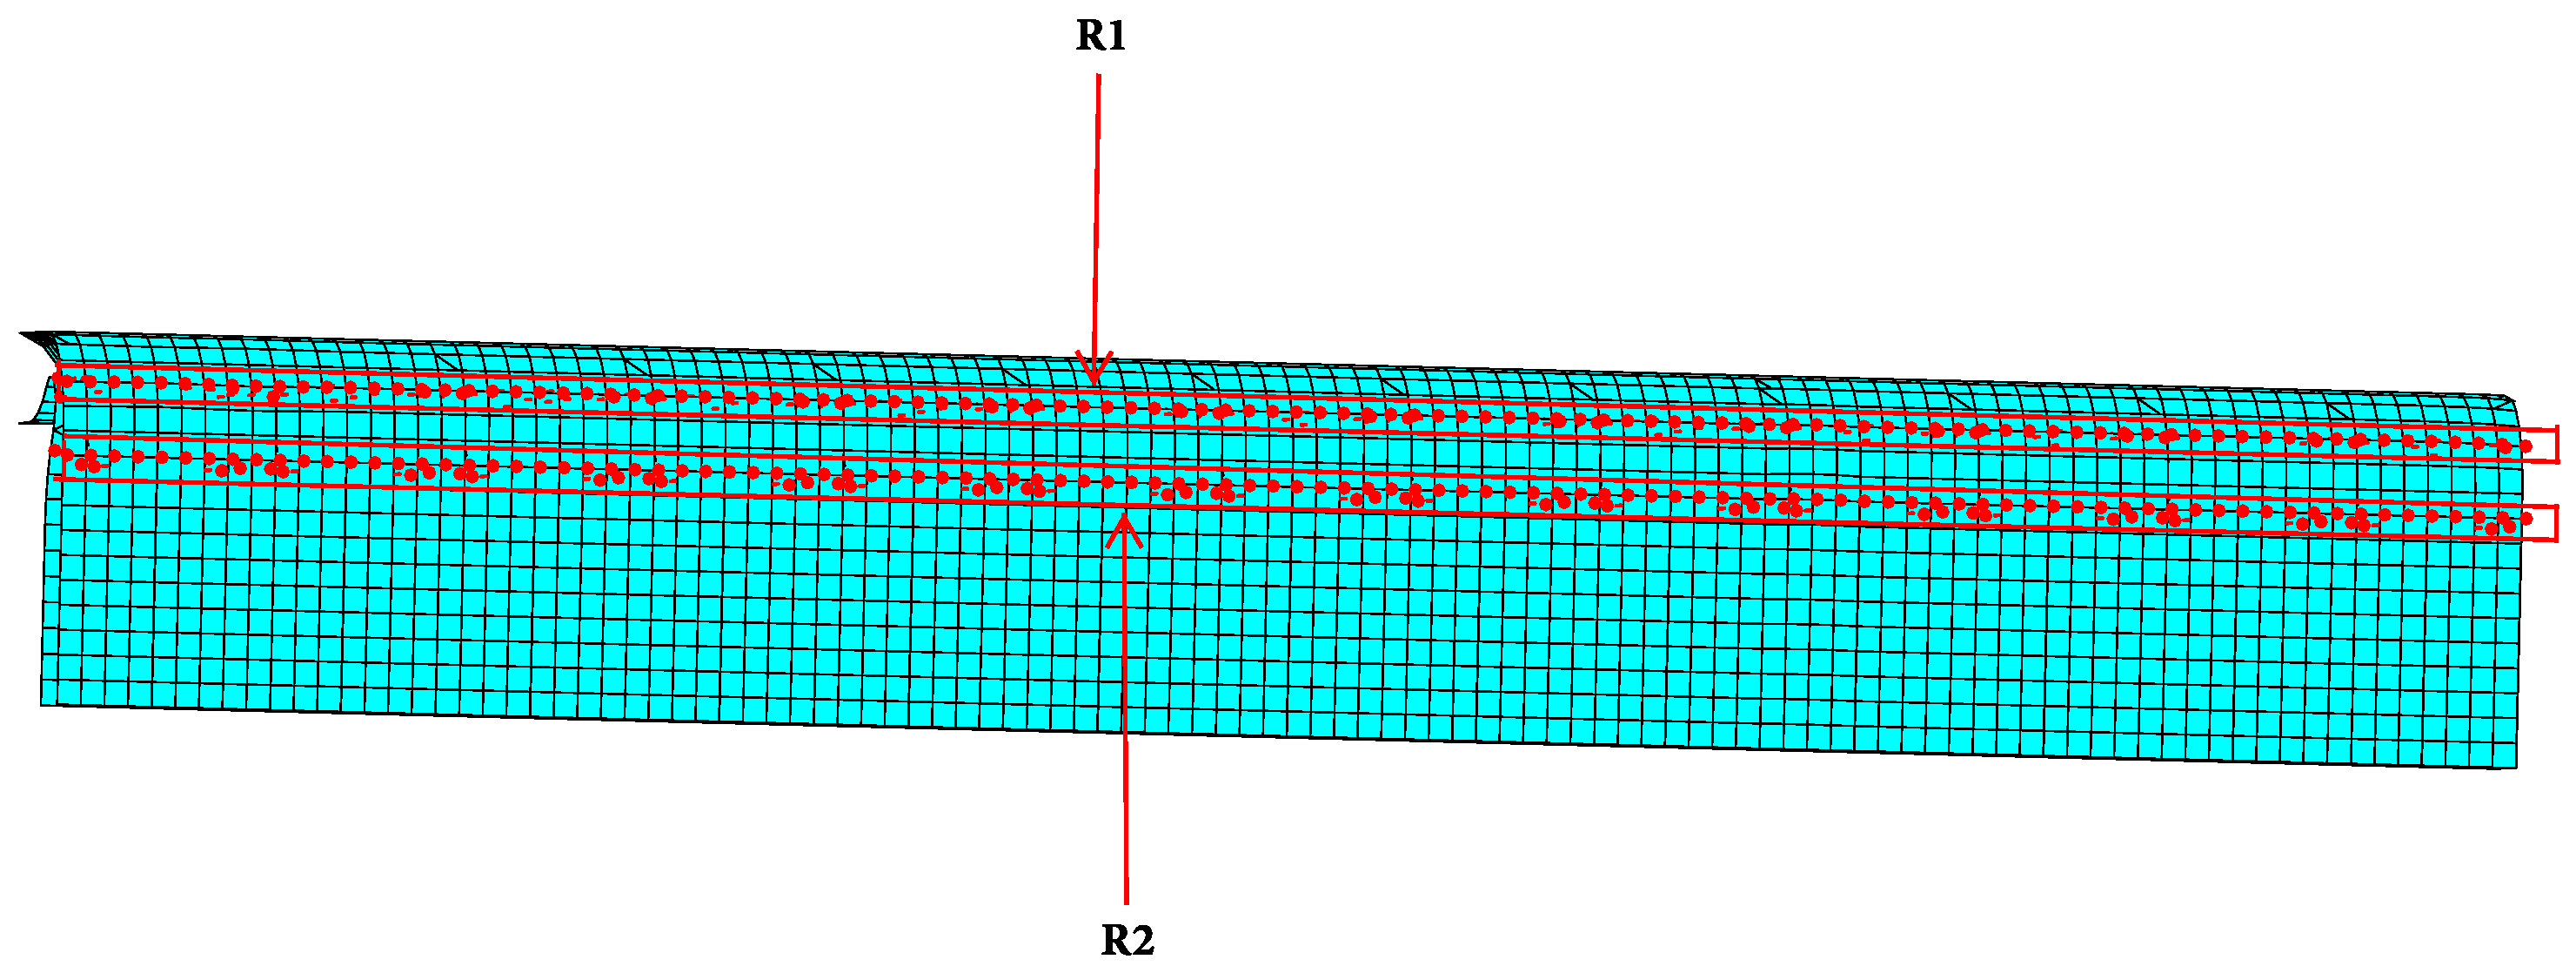
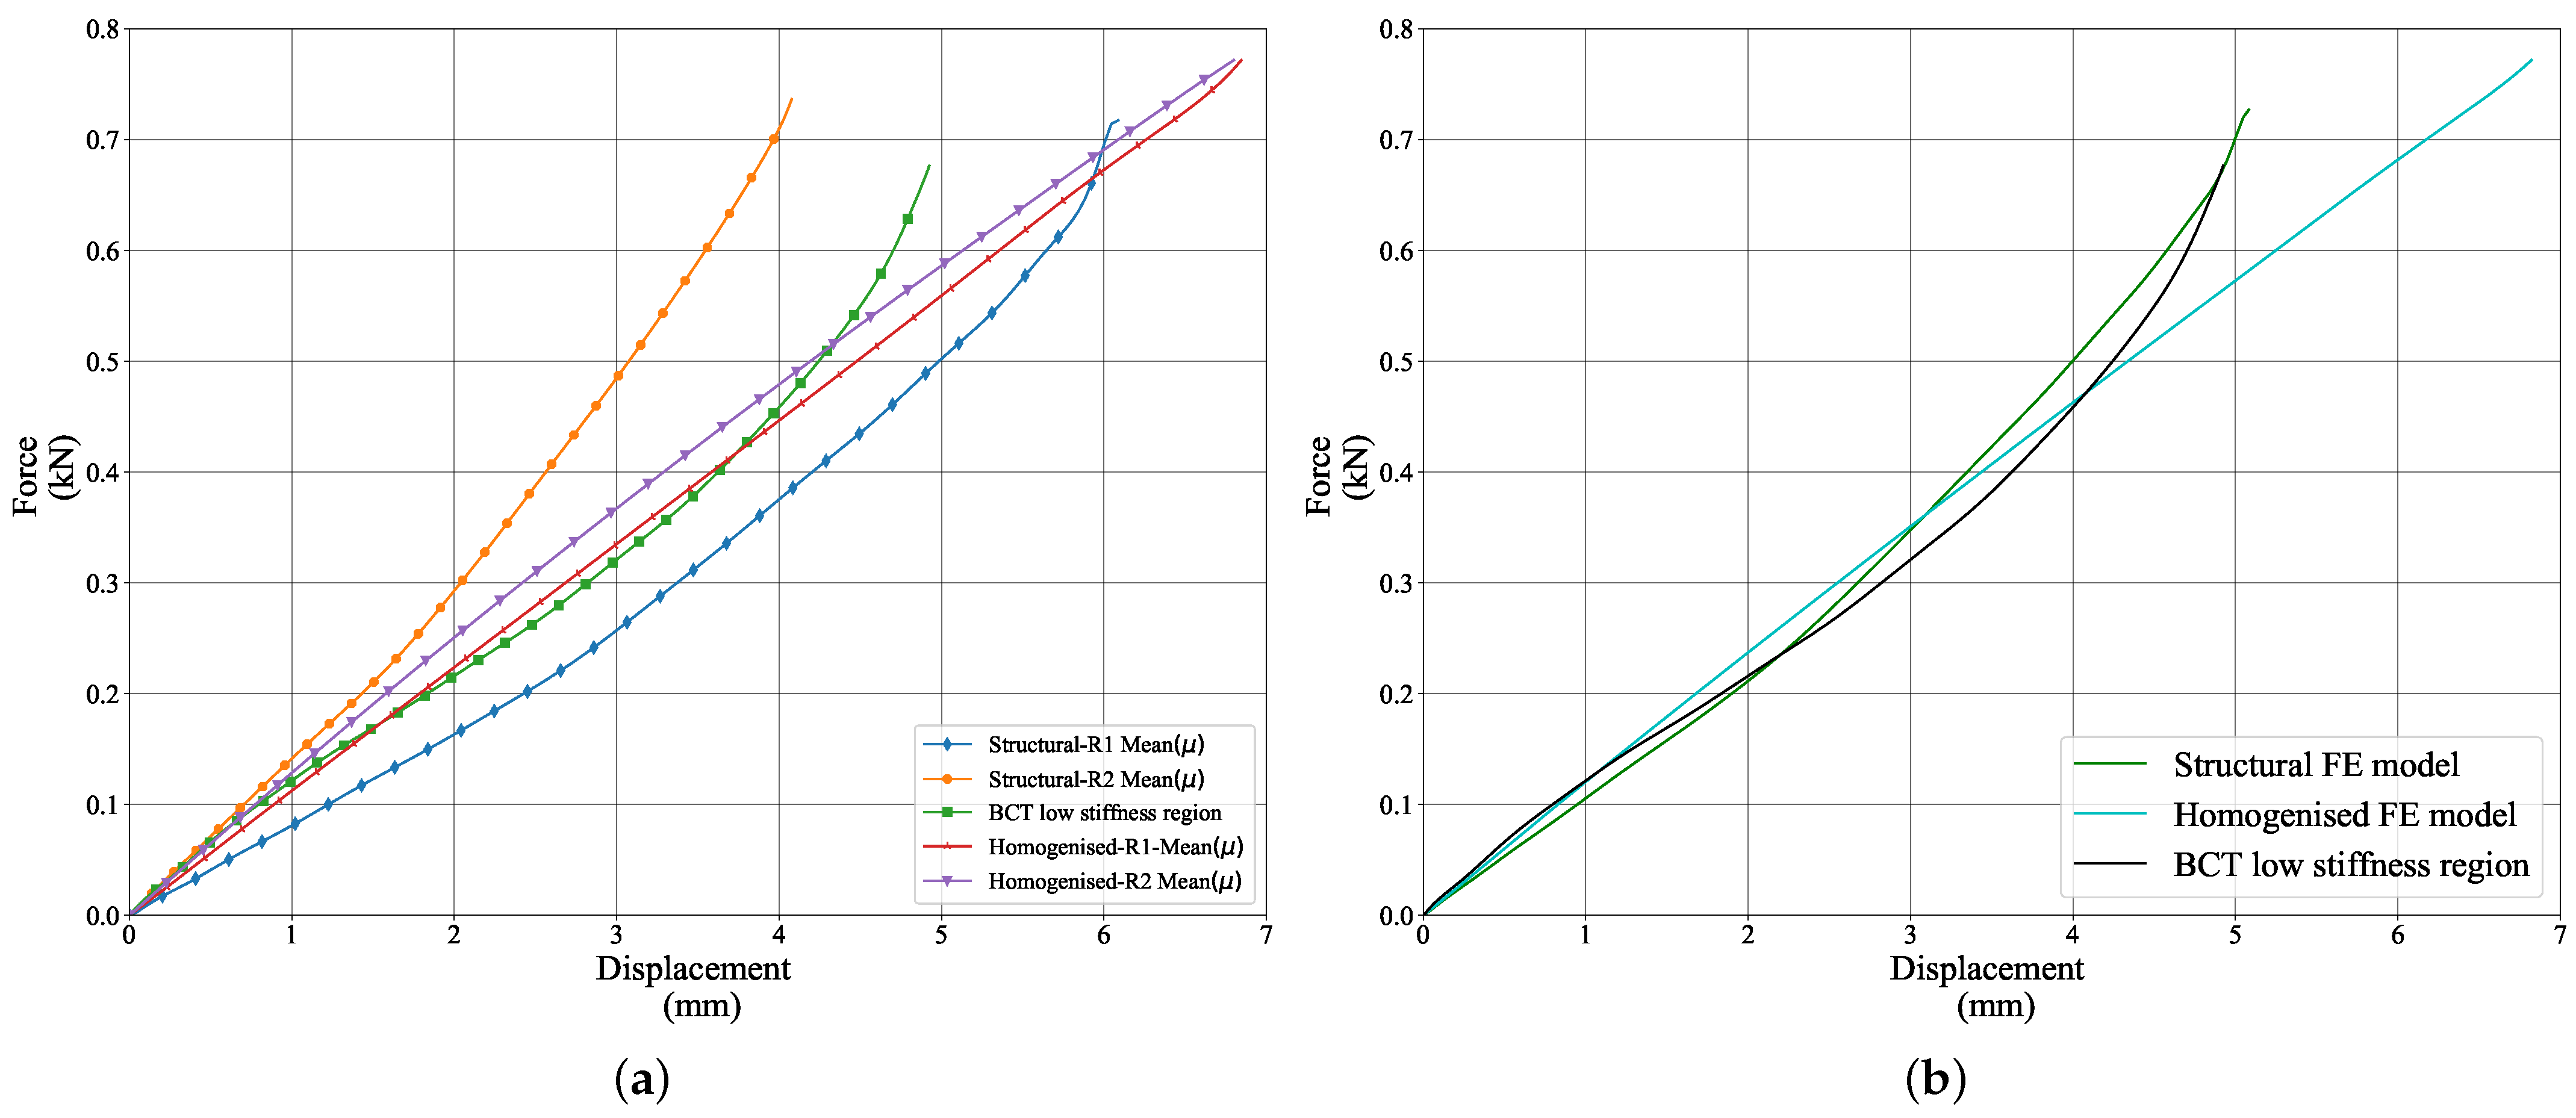
  • The section marked as R1 on Figure 10 consists of all the nodes, including both liners and fluting, shown in red along the X-axis at the centre of the crease. The section labelled R2 includes all the nodes, with liners and fluting, positioned along the X-axis 5mm below R1.
  • For each section (R1 and R2), load–displacement data were collected from all the nodes within each section (Figure A1 and Figure A2).
  • The average load–displacement curve for each section was determined by averaging the load–displacement data across all nodes in that section as shown in Figure A1 and Figure A2. This resulted in two average load–displacement curves: one for R1 and one for R2.
  • The overall average load–displacement curve for the creased region was obtained by averaging the previously calculated average curves of sections R1 and R2.
The same procedure was repeated for the homogenised model as shown in Figure A3 and Figure A4. The width of the creased region between R1 and R2 in the FE model was determined by measuring the width of the creased region on the physical paperboard sample and was approximated as 5 m m .

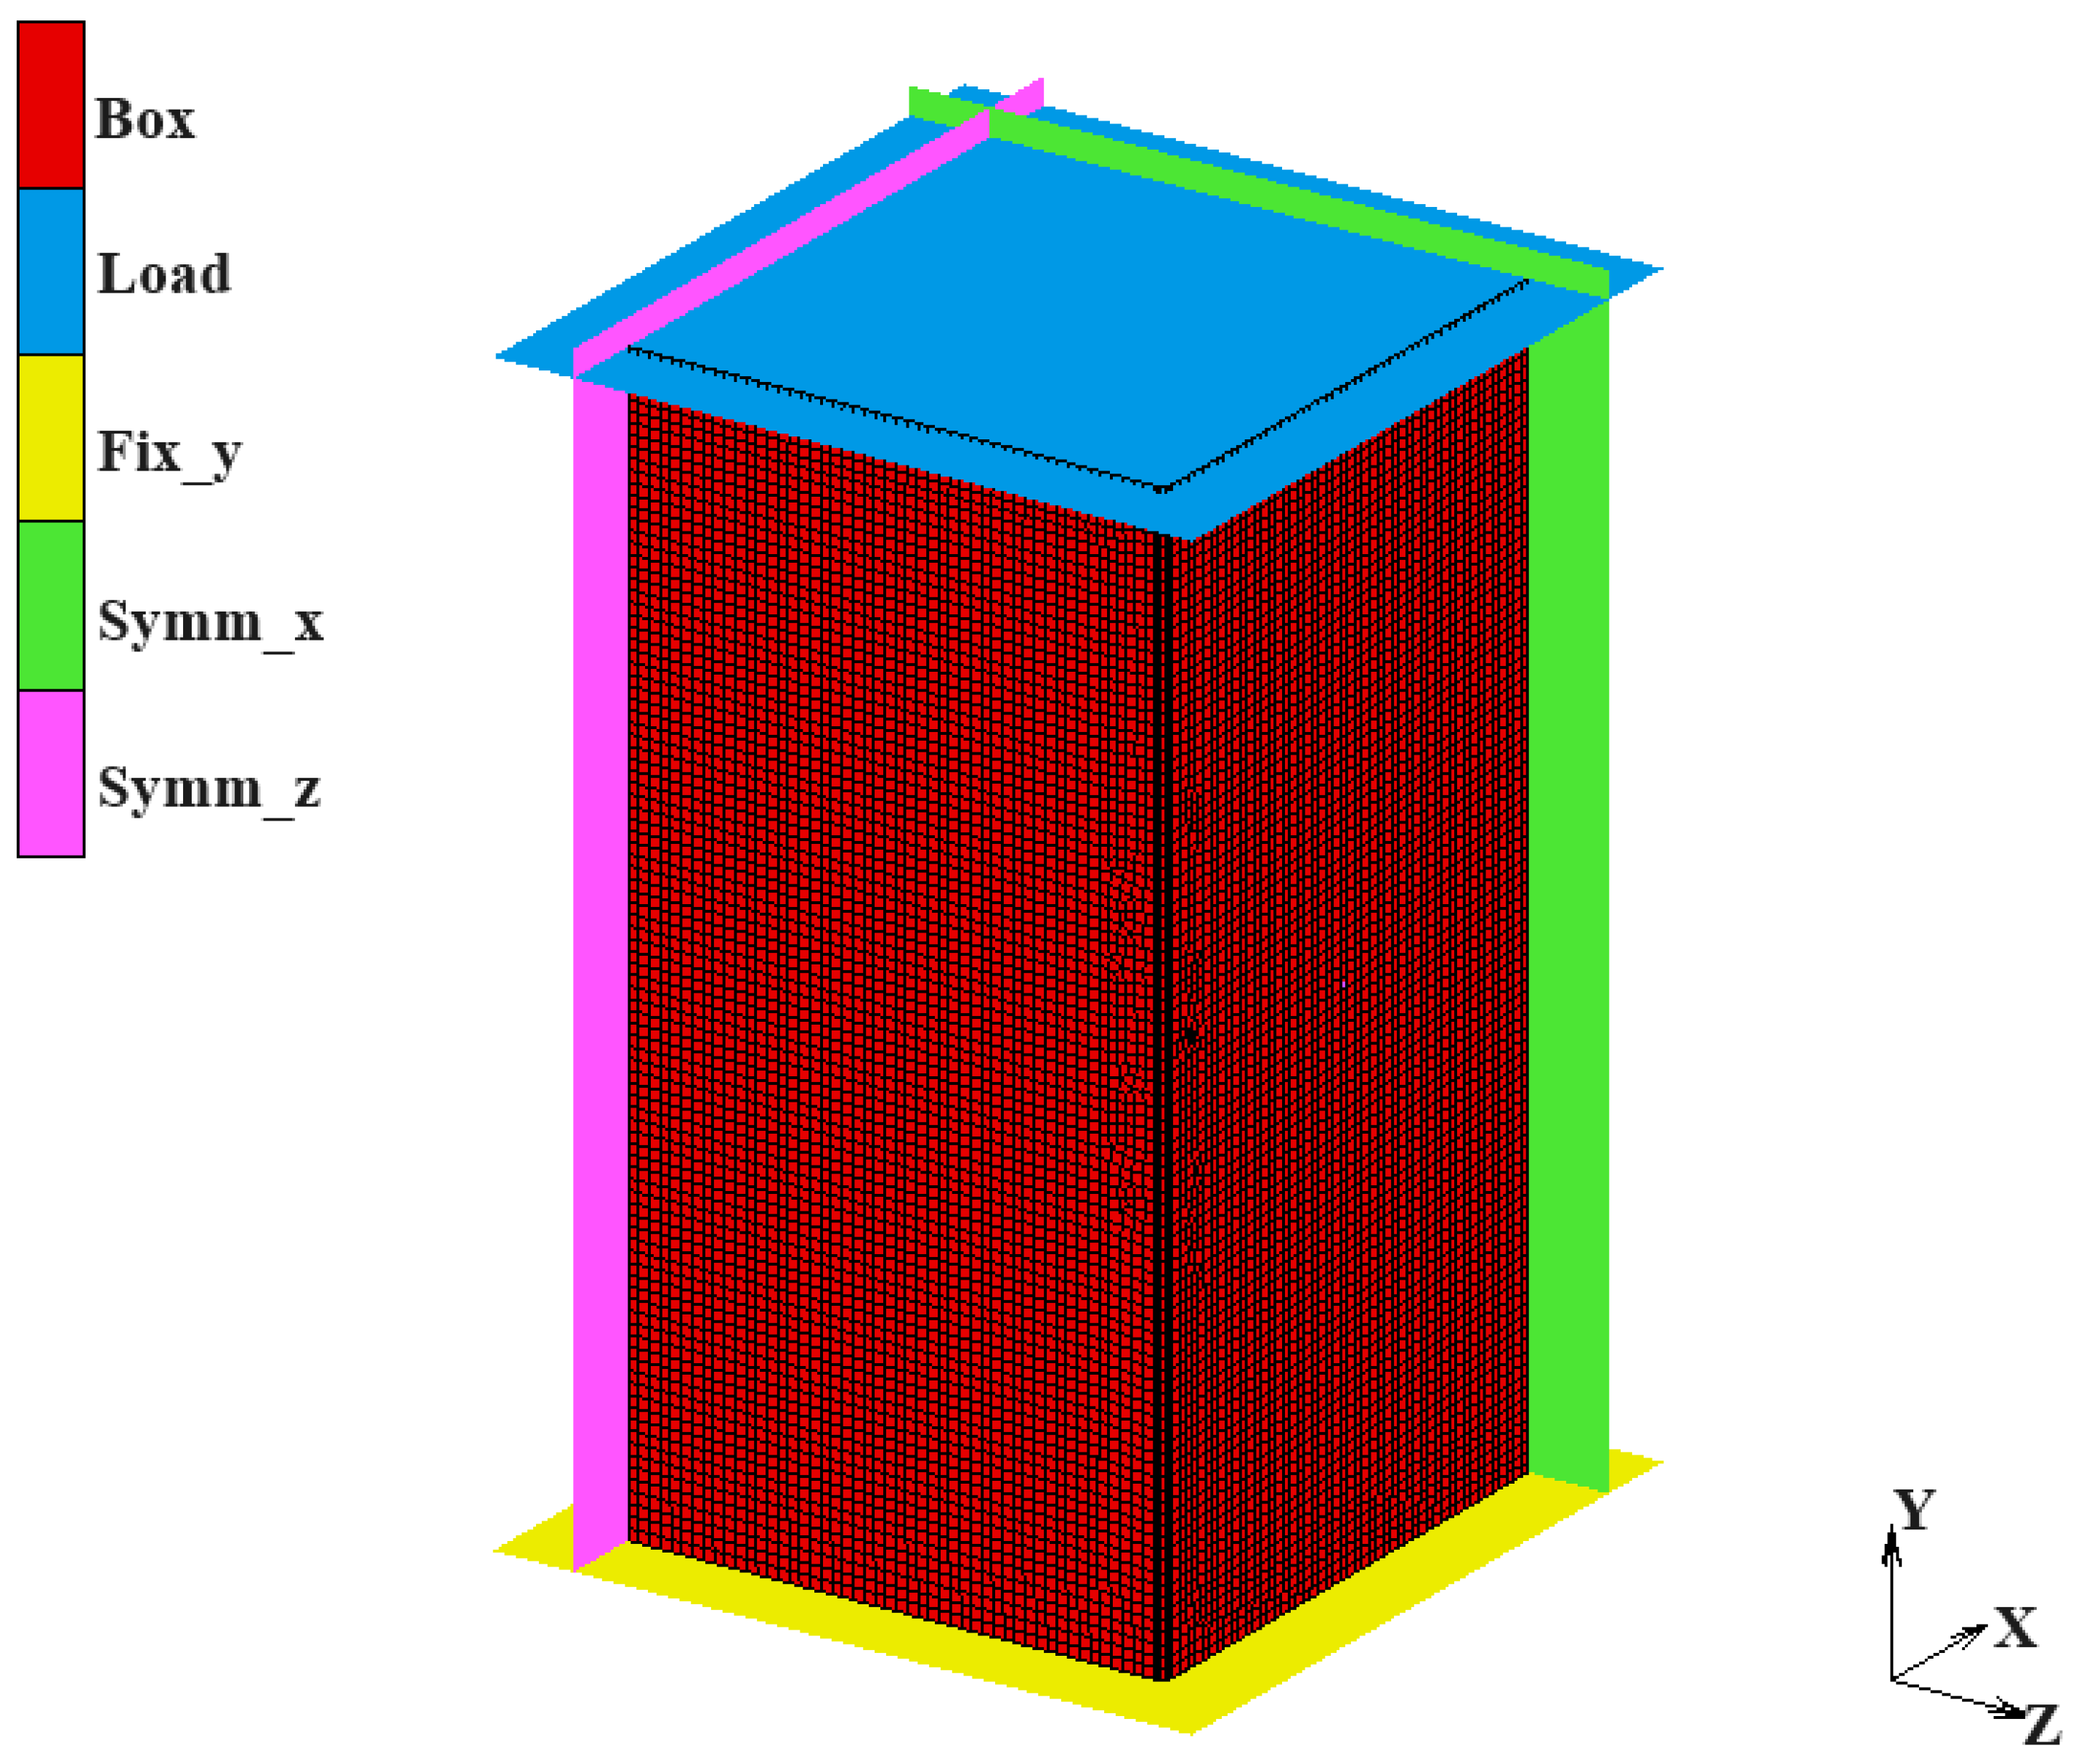
2.5.3. Box Compression Tests

Finite element models were developed to simulate the box compression test, using a non-linear FEA Code, Msc Marc, and Mentat. The geometry used to model the BCT was similar to the samples used for conducting the experiments and was created using Autodesk Inventor Professional (Autodesk US, San Francisco, CA, USA, 2023). To reduce computational costs, the corrugated box was modelled using quarter-symmetry conditions as shown in Figure 11.
Figure 11 illustrates the developed mesh for the BCT incorporating symmetry. Symmetry planes xy– and zy– were used to apply symmetry conditions. The corners of the box were connected by sharing the same nodes at the panel edges. A rigid surface was used to model the bottom compression platen while top platen was modelled using a rigid surface with displacement control. Translation was constrained in the z– direction for all the nodes at the top and bottom edges of the front-facing panel while the symmetry surface (symm–x) prevented translation in the x– and rotation in the y– and z– directions. Similarly, for the side-panel, translation was constrained in the x– direction for all the nodes at the top and bottom edge while the symmetry surface (symm–z) prevented translation in z– and rotation in the y– and x– directions. A Coulomb bilinear friction model was applied between the box and the top and bottom rigid surfaces. The friction coefficient was specified as 0.19 as obtained by [3]. Material properties obtained from inverse analysis specified in Table 4 were specified under the composite laminate formulation in Msc Marc for the panels as well as the horizontal and vertical crease regions as shown in Figure 12.
The orientation of the material was such that the CD corresponds to the global y–direction for the vertical panels. A geometric imperfection was added to the model by applying a small load to both the front and side panels in the out-of-plane direction, then performing a static followed by a buckling analysis, and extracting the first buckling mode shape. This mode shape was then used to apply a displacement perturbation on the box, scaled by a factor of 4 m m . Non-linear static and buckling analyses were conducted to determine the buckling load and mode shape for two models: one that was geometrically perfect and another that included geometric imperfections.

2.6. Optimisation of FE Models

A similar procedure to that described in [7] was used to obtain the optimal homogenised elastic–plastic parameters to be used for full-scale box simulation. In this study, structural and homogenised FE models of four-point bending tests of creased and un-creased samples were set up to represent the physical and numerical tests, respectively. Similarly, structural and homogenised FE models were set to represent the physical and numerical tests for the horizontal creases as shown in Figure 9. The objective function to be optimised was constructed from the differences between the four-point bending structural and four-point bending homogenised tests’ force–displacement curves. Calibration of the material properties was carried out simultaneously. First, the elastic parameters of the liners and core were calibrated followed by the plastic parameters. For this study, a bilinear material model was used. The bilinear material model describes the behaviour of elastic–plastic materials using two straight lines to represent the stress–strain relationship as shown in Figure 13. The elastic region of curve then corresponds to the material’s behaviour before yielding, where stress changes in proportion to the elastic modulus, E e . The inelastic or plastic region represents the behaviour after yielding where the stress changes in proportion to the tangent modulus, E p , which is significantly lower than the elastic modulus.
The reference elastic properties were defined using the material properties presented in Table 1. For the homogenised model, the reference parameters for the corrugated core were defined using elastic material properties derived from homogenisation using CLPT (Table 1). From these reference parameters, 10 random starting points were generated using the Latin hypercube function, with upper and lower limits set at 20% above and below the reference points. Plasticity in Msc Marc is defined as the post-yield or plastic portion of the stress–strain curve. A material property table is used to define the true strain versus true stress and the first point of the plastic strain definition is the yield point and corresponds to a plastic strain value of zero followed by true stresses at different strain values. Linear interpolation is used between the data points to define the plasticity curve. The plastic properties were defined and optimised as the true stresses at the yield point and at 5% strain as shown in Appendix A, Table A2. Similarly, 10 random starting points were selected using the Latin hypercube function with the upper and lower limits chosen to be 20% above and below the reference points.
Root mean square error (RMSE) was used to evaluate the error between the force–displacement results of the structural and homogenised FE models (Equations (12)–(14)) [7]. All optimisations were performed concurrently using the Sequential Quadratic Programming (SQP) algorithm in Design Optimisation Tools (DOT).
R M S E M D = i = 1 n ( F S M D ( i ) F H M D ( i ) ) 2 n
R M S E C D = i = 1 n ( F S C D ( i ) F H C D ( i ) ) 2 n
R M S E c o m b i n e d = R M S E C D + R M S E M D
where i represents the current increment number and n is the total number of increments, F S M D and F S C D are the loads extracted from the MD and CD structural FE models at each increment, and F H M D and F H C D represent the loads extracted from the homogenised MD and CD FE models at each increment [7].
The defined objective function, Equation (15), was constrained by two conditions: the elastic moduli ( E 1 , E 2 , G 12 ) in the FE models must remain positive, and the FE analysis must be validated with an exit code of 3004 from Msc Marc. An exit code of 3004 signifies that the simulation was successfully completed [7].
Minimise : RMSE Such that : E 1 , E 2 , G 12 > 0 , Msc Marc Exit Codes = 3004
The optimal material properties summarised in Appendix A, Table A2, Table A3 and Table A4 were determined from the material model with the lowest objective function (Equation (15)). The optimisation algorithm was applied to combined MD and CD samples for the four-point bending test on the sample without creases which provided the optimal numerical test for identification of in-plane material properties as explained by [7]. This is because, if the algorithm was applied solely to MD samples, it would tend to optimise E 1 only, with the other parameters ( E 2 , G 12 ) having relatively large standard deviations. Similarly, if only CD samples were optimised, the focus would be primarily on optimising E 2 . To ensure the optimisation of both E 1 and E 2 , the algorithm was simultaneously applied to both MD and CD samples.

3. Results and Discussion

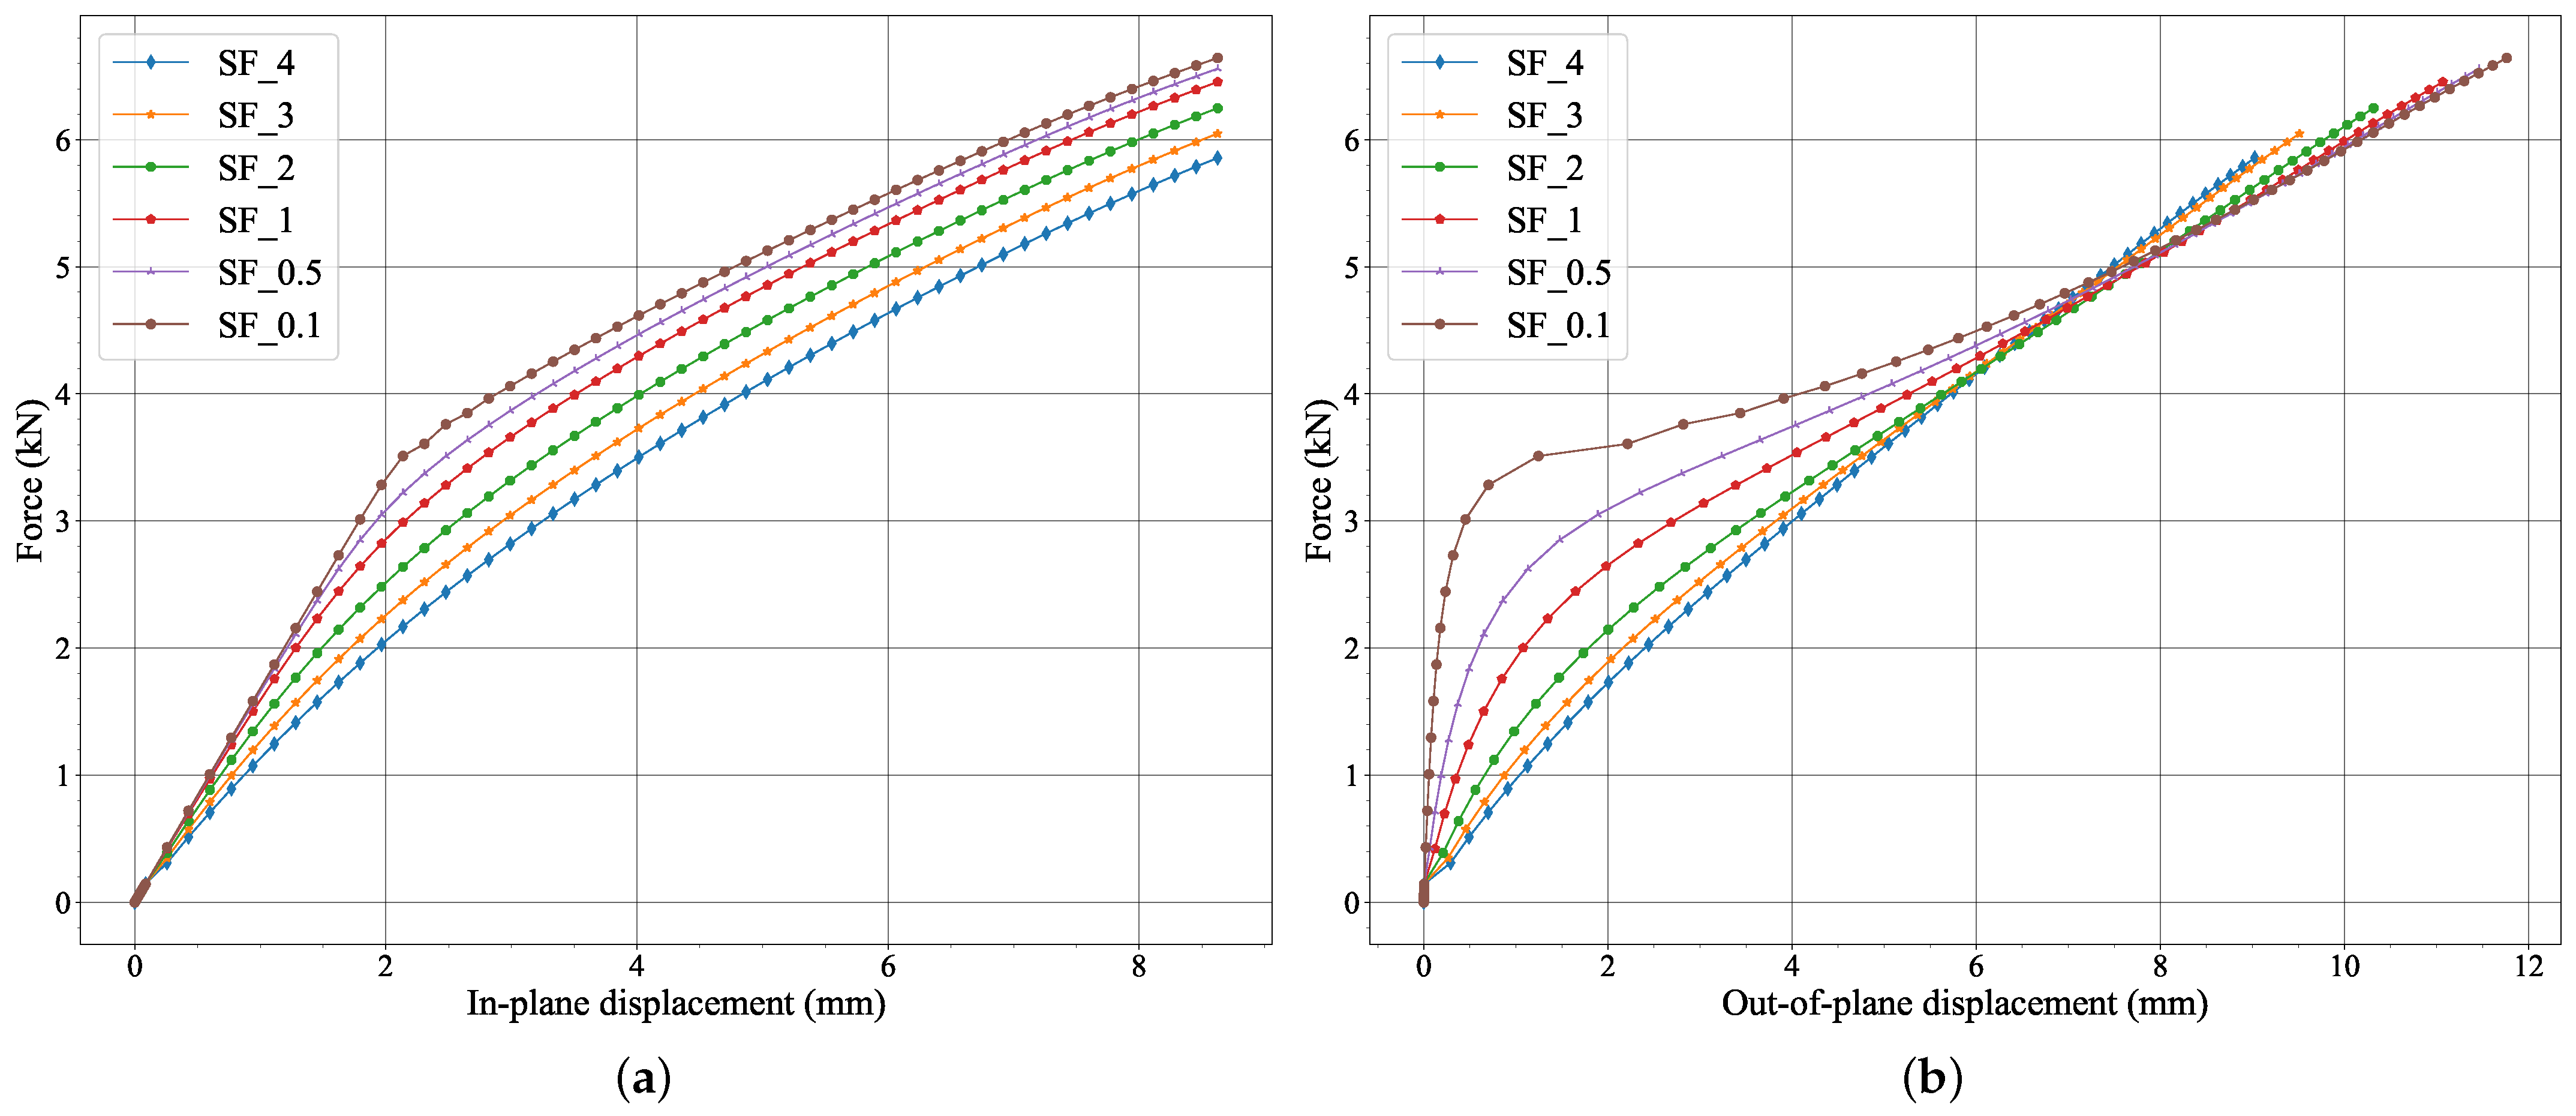
3.1. Inverse Analysis

Table 4 shows the equivalent material properties obtained using inverse analysis on FE models.
The obtained material properties presented in Table A2, Table A3 and Table A4 show converged material properties with minimal standard deviations for the values of E 1 and E 2 for different starting points (Appendix A). For all three cases, the optimiser is not sensitive to the value of G 12 since the bending test does not initiate in-plane shear on the corrugated board.
The material properties used to accurately describe the stiffness of both the horizontal and vertical creased regions are outlined in Table 4. The material properties for the creased regions are notably lower compared to the properties used to estimate the board’s (un-creased) material properties, typically reduced by around 50% to 70%. Consequently, this implies that, for full box simulation, the stiffness of the creases/edges of the box should be correctly captured when defining their material properties.
The optimised material properties (Table 4) obtained from calibration of the creased and un-creased four-point bending FE models were verified using four-point bending homogenised FE models and compared to the experimental results discussed in Section 3.2. The material properties obtained from the calibration of the horizontal crease FE model were verified using the box compression results discussed in Section 3.3 and Section 3.4.

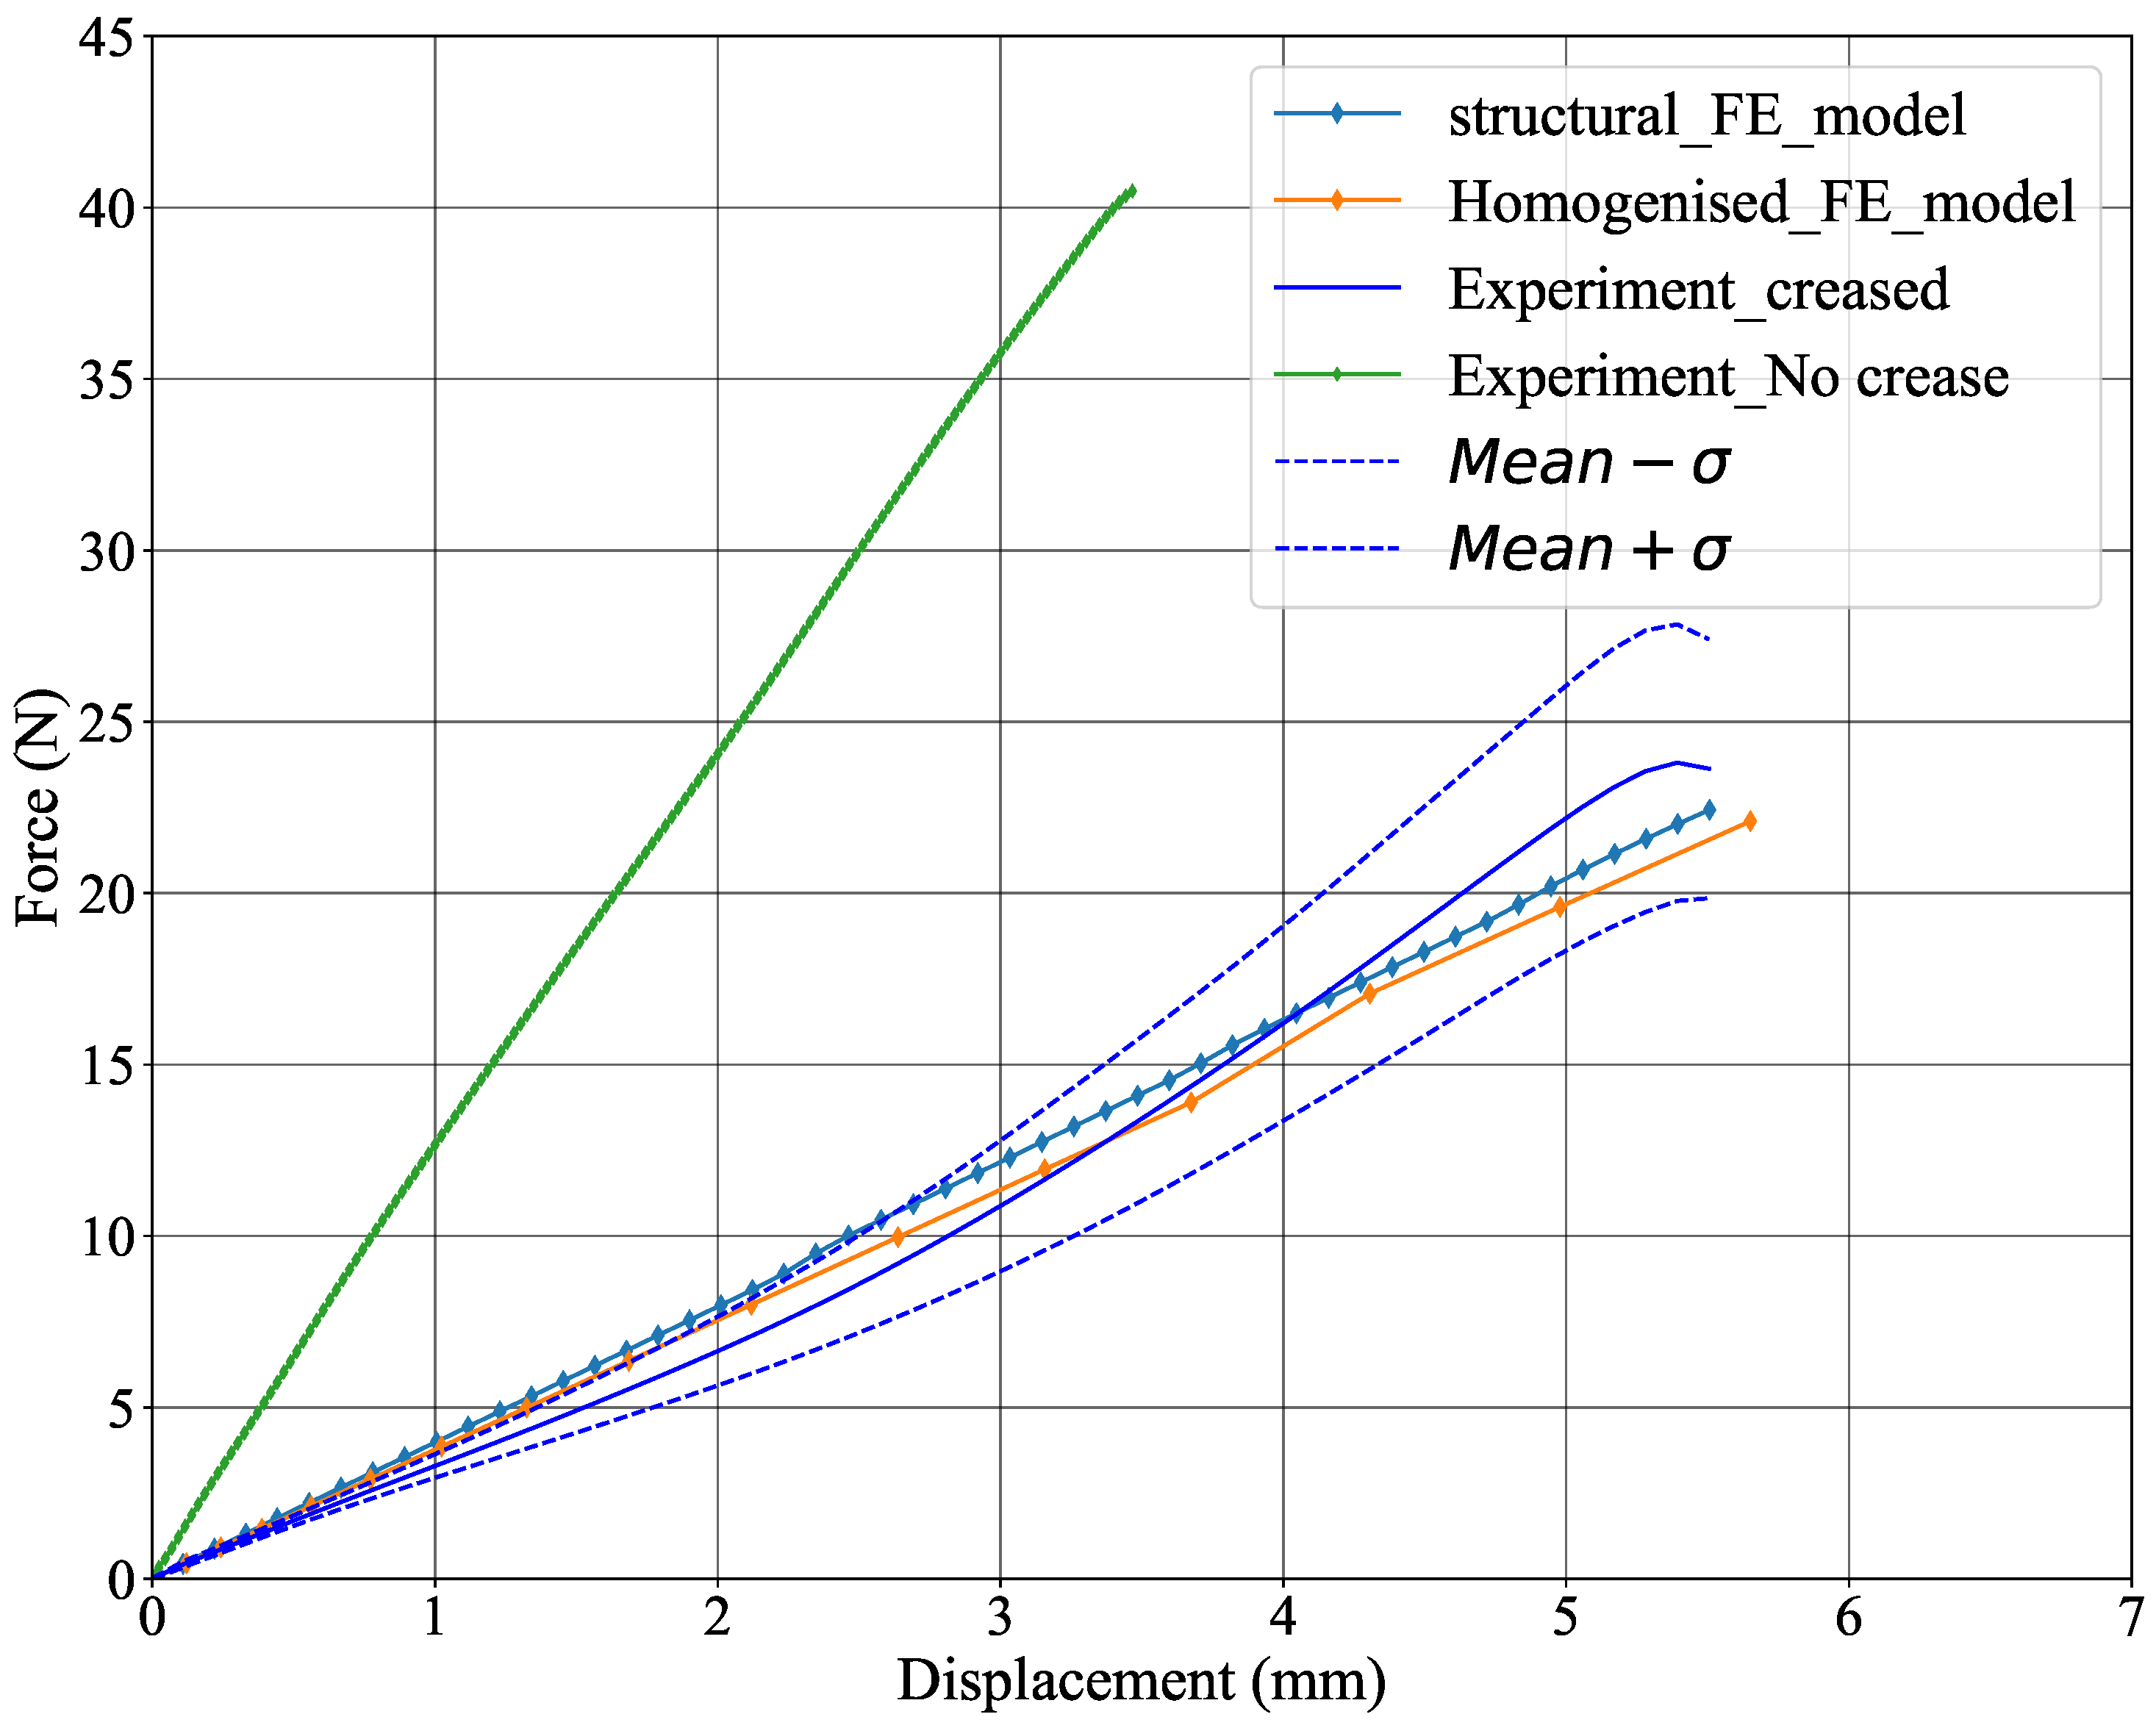
3.2. Four-Point Bending Tests

The difference between the measured and predicted stiffness for the four-point bending tests are highlighted in Table 5. The predicted stiffness for the homogenised models were obtained from FE models developed using the optimal material properties. From the results, it is seen that the structural FE models overestimate the stiffness of the board which may be attributed to the rigid connection between the liners and the corrugated fluting. However, this may not accurately reflect the behaviour of the physical board, since most of the adhesives used are starch based and any flexibility of the bond between the liners and fluting would lead to a further reduction in the board stiffness.
The homogenised FE models under-predicted the stiffness of the board; this may have resulted from the fact that the effective thickness of the homogenised board was slightly lower than the real thickness of the board. In as much as the homogenised models under-predicted the stiffness of the board, there was still a good correlation (Figure 14) between the homogenised and experimental results with correlation coefficients of 0.94 and 0.97 for the CD and MD models, respectively. Therefore, the homogenised model proves to be an effective tool for evaluating the bending stiffness of corrugated board, since it saves on computation time. Moreover, the model maintains accuracy within a margin of ±10%, meaning its predictions deviate by no more than 10% above or below the experimental values.

Four-Point Bending Models with Creases

The bending stiffness of the creased board differed from the bending stiffness of the normal sample without creases by 63% (Figure 15) showing that the creases significantly reduce the bending stiffness of the board. Both the structural and homogenised FE models with creases correlated well with the experimental results as shown in Figure 15. Therefore, the material properties of the creased sections would be appropriate for simulating the vertical edges in a full box finite element model.
According to Šarčević [22], creases defined at an angle of 90° in the CD direction similar to the experimental sample used in this study have a significant effect on the bending stiffness of the board. Šarčević [22] obtained a similar loss in bending stiffness of more than 80% for an E-flute board with a similar crease line applied at 90°. Smedman [23] also reported a reduction of over 50% in the bending force of creased paperboard when compared to un-creased corrugated paperboard. Given that creases significantly reduce the bending stiffness of corrugated paperboard, using the same set of material properties to define the properties of the box panels, and vertical and horizontal edges in a FE model of a full box does not accurately reflect the stiffness of these different sections, especially the edges/corners of the box.

3.3. Horizontal Creases

The force–displacement curves for the horizontal crease structural and homogenised FE models are shown in Figure 16. For the two regions R1 and R2 (Figure 10), the stiffness of R1 (at the crease) is lower than the stiffness of R2 (represents panel stiffness) by 40% for the structural models and 11% for the homogenised models as can been seen in Figure 16a. To verify the accuracy of the FE models in predicting the stiffness of the horizontal creases, the force–displacement curves were compared with experimental BCT results (Figure 17). The initial low stiffness (up to 5 m m displacement) region of the BCT force–displacement curve was used to verify the accuracy of the FE models.
Figure 16b shows the average force–displacement curves for both the homogenised and structural FE models compared to the experimental BCT results. The coefficient of determination, R-square ( R 2 ) (Equation (16)) was used to evaluate the variation between the experimental and predicted results.
R 2 = 1 i = 1 n ( F h o m F e x p ) 2 i = 1 n ( F e x p F m e a n ) 2
where F e x p is the experimental force, F h o m is the force predicted by the homogenised FE models, and F m e a n is the overall average force value obtained from the experimental results.
The ( R 2 ) values were 0.98 and 0.99 for the homogenised and structural FE models, respectively. These results indicate a good correlation between the FE models and the experimental data. This high level of agreement indicates that the optimised homogenised material properties are reliable for predicting the behaviour of the horizontal creases in the box.

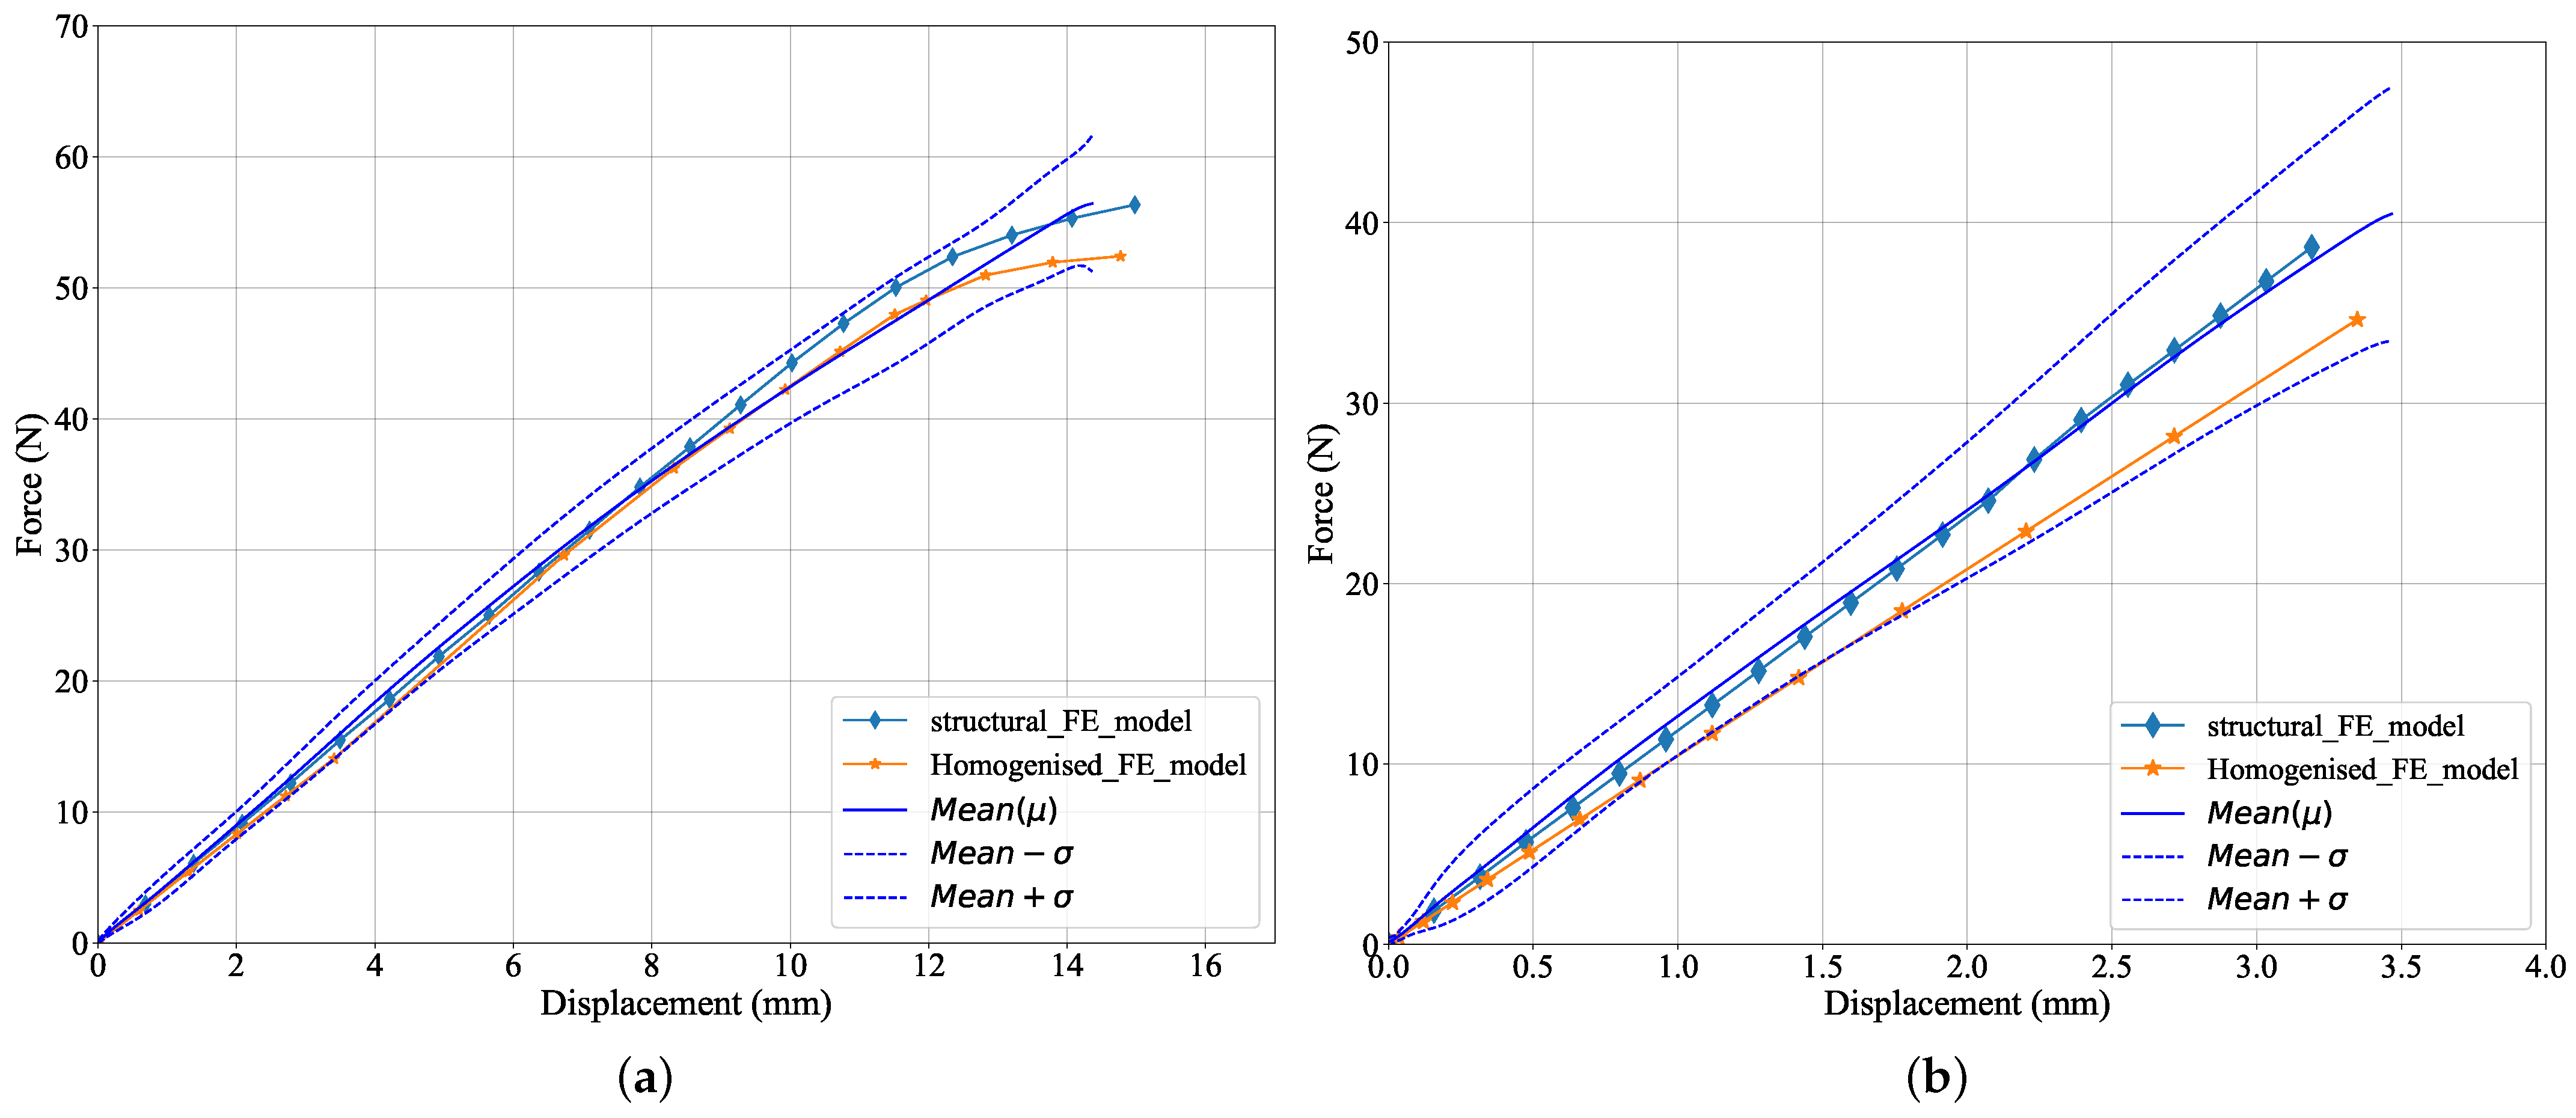
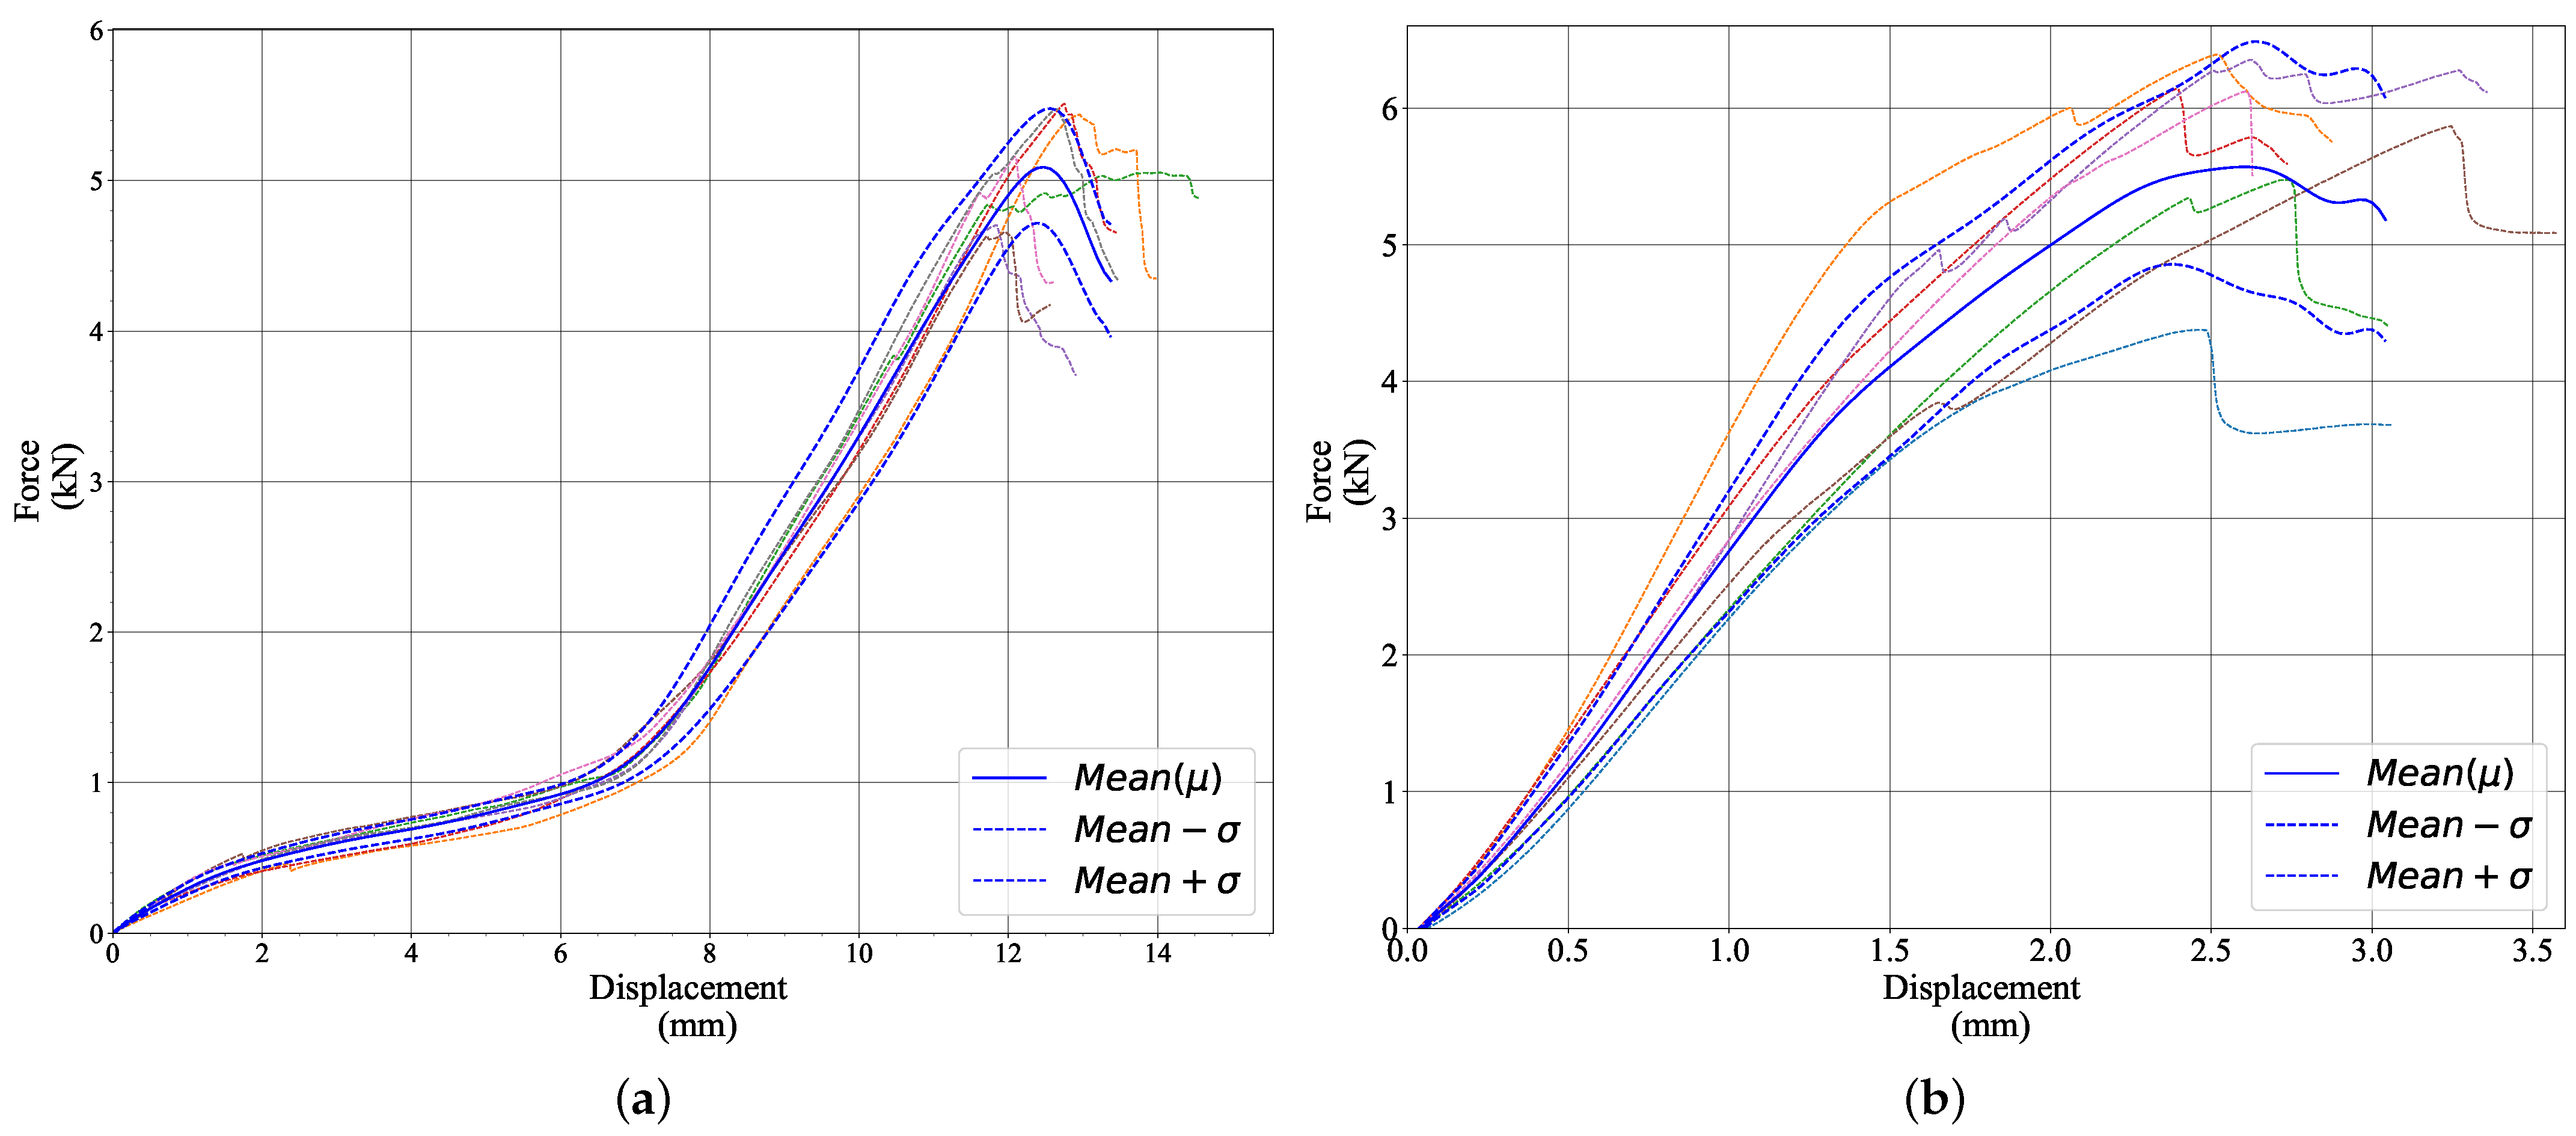
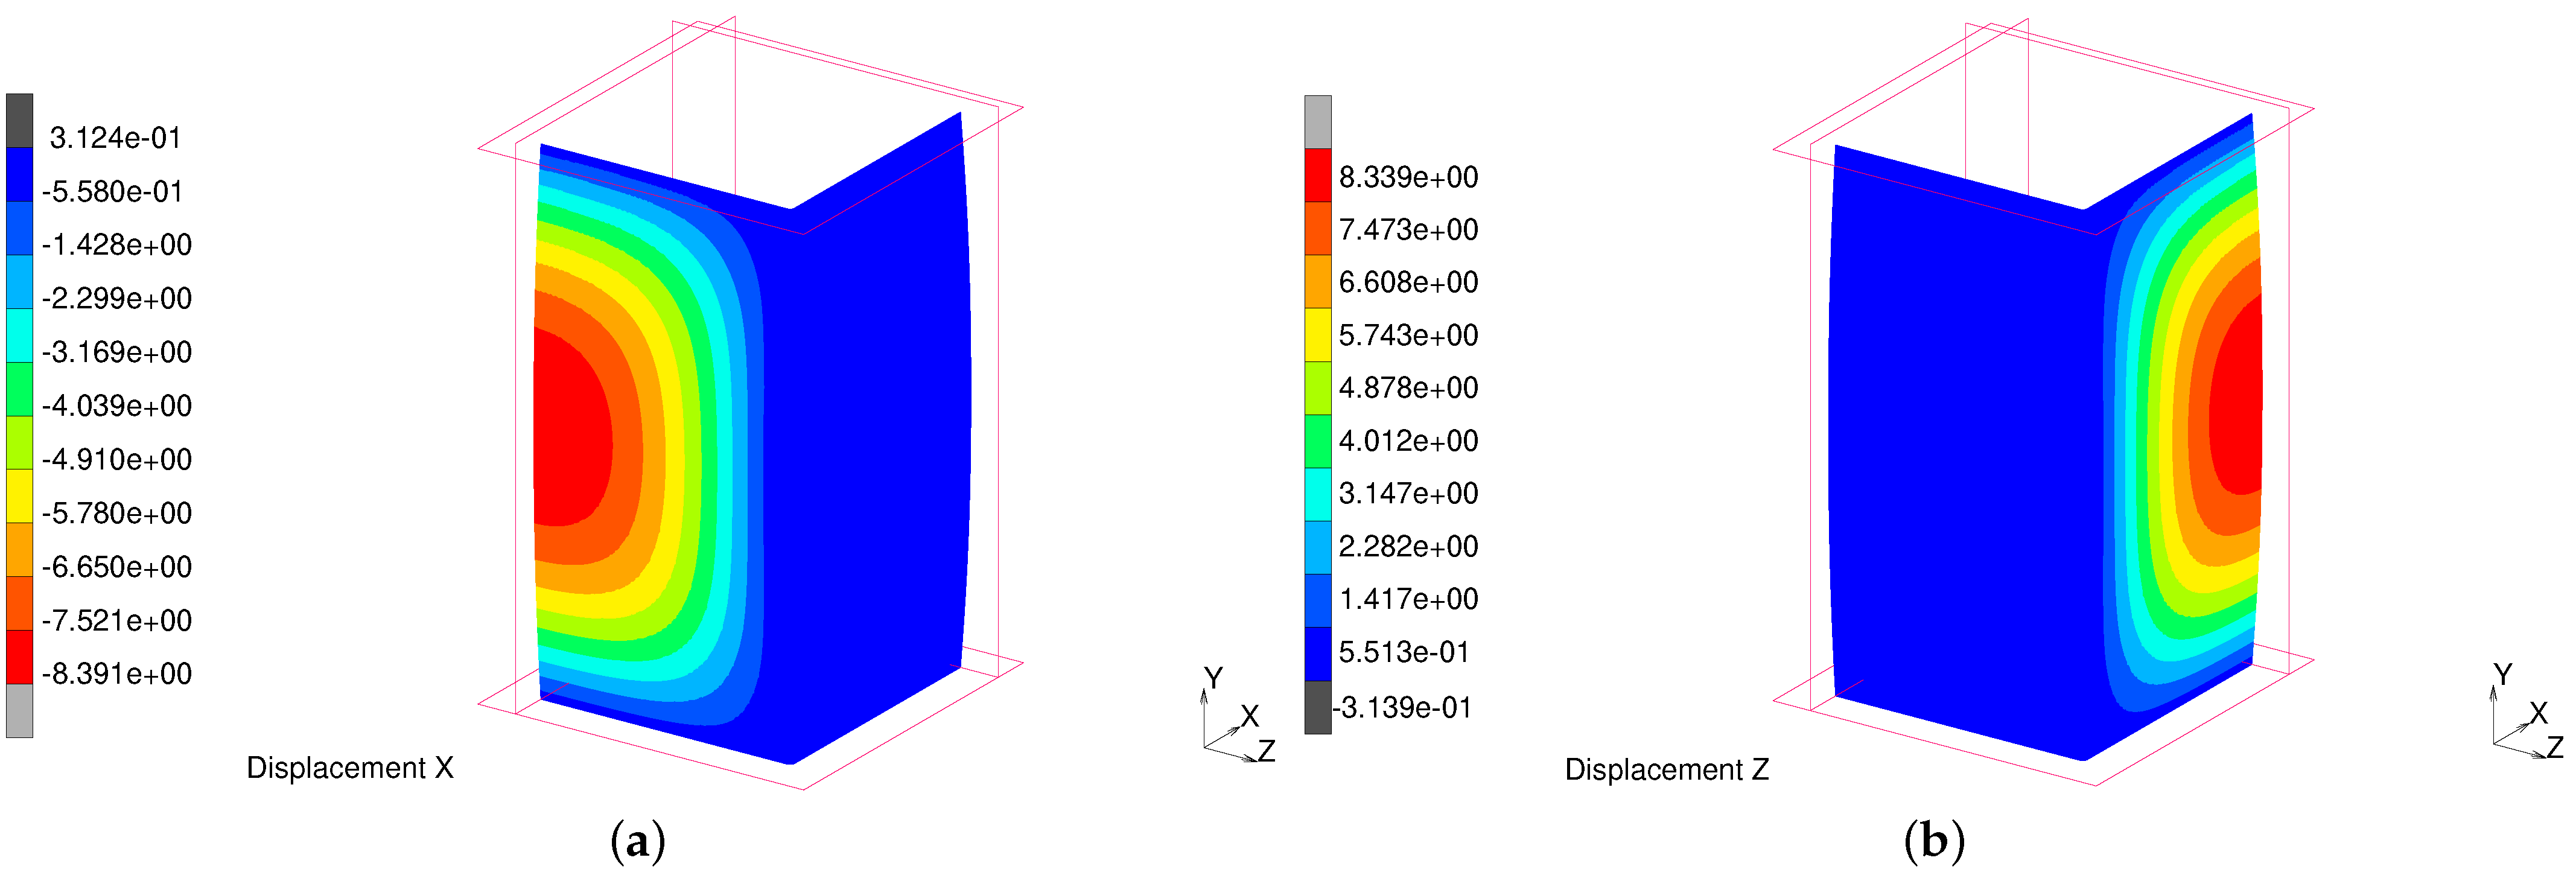
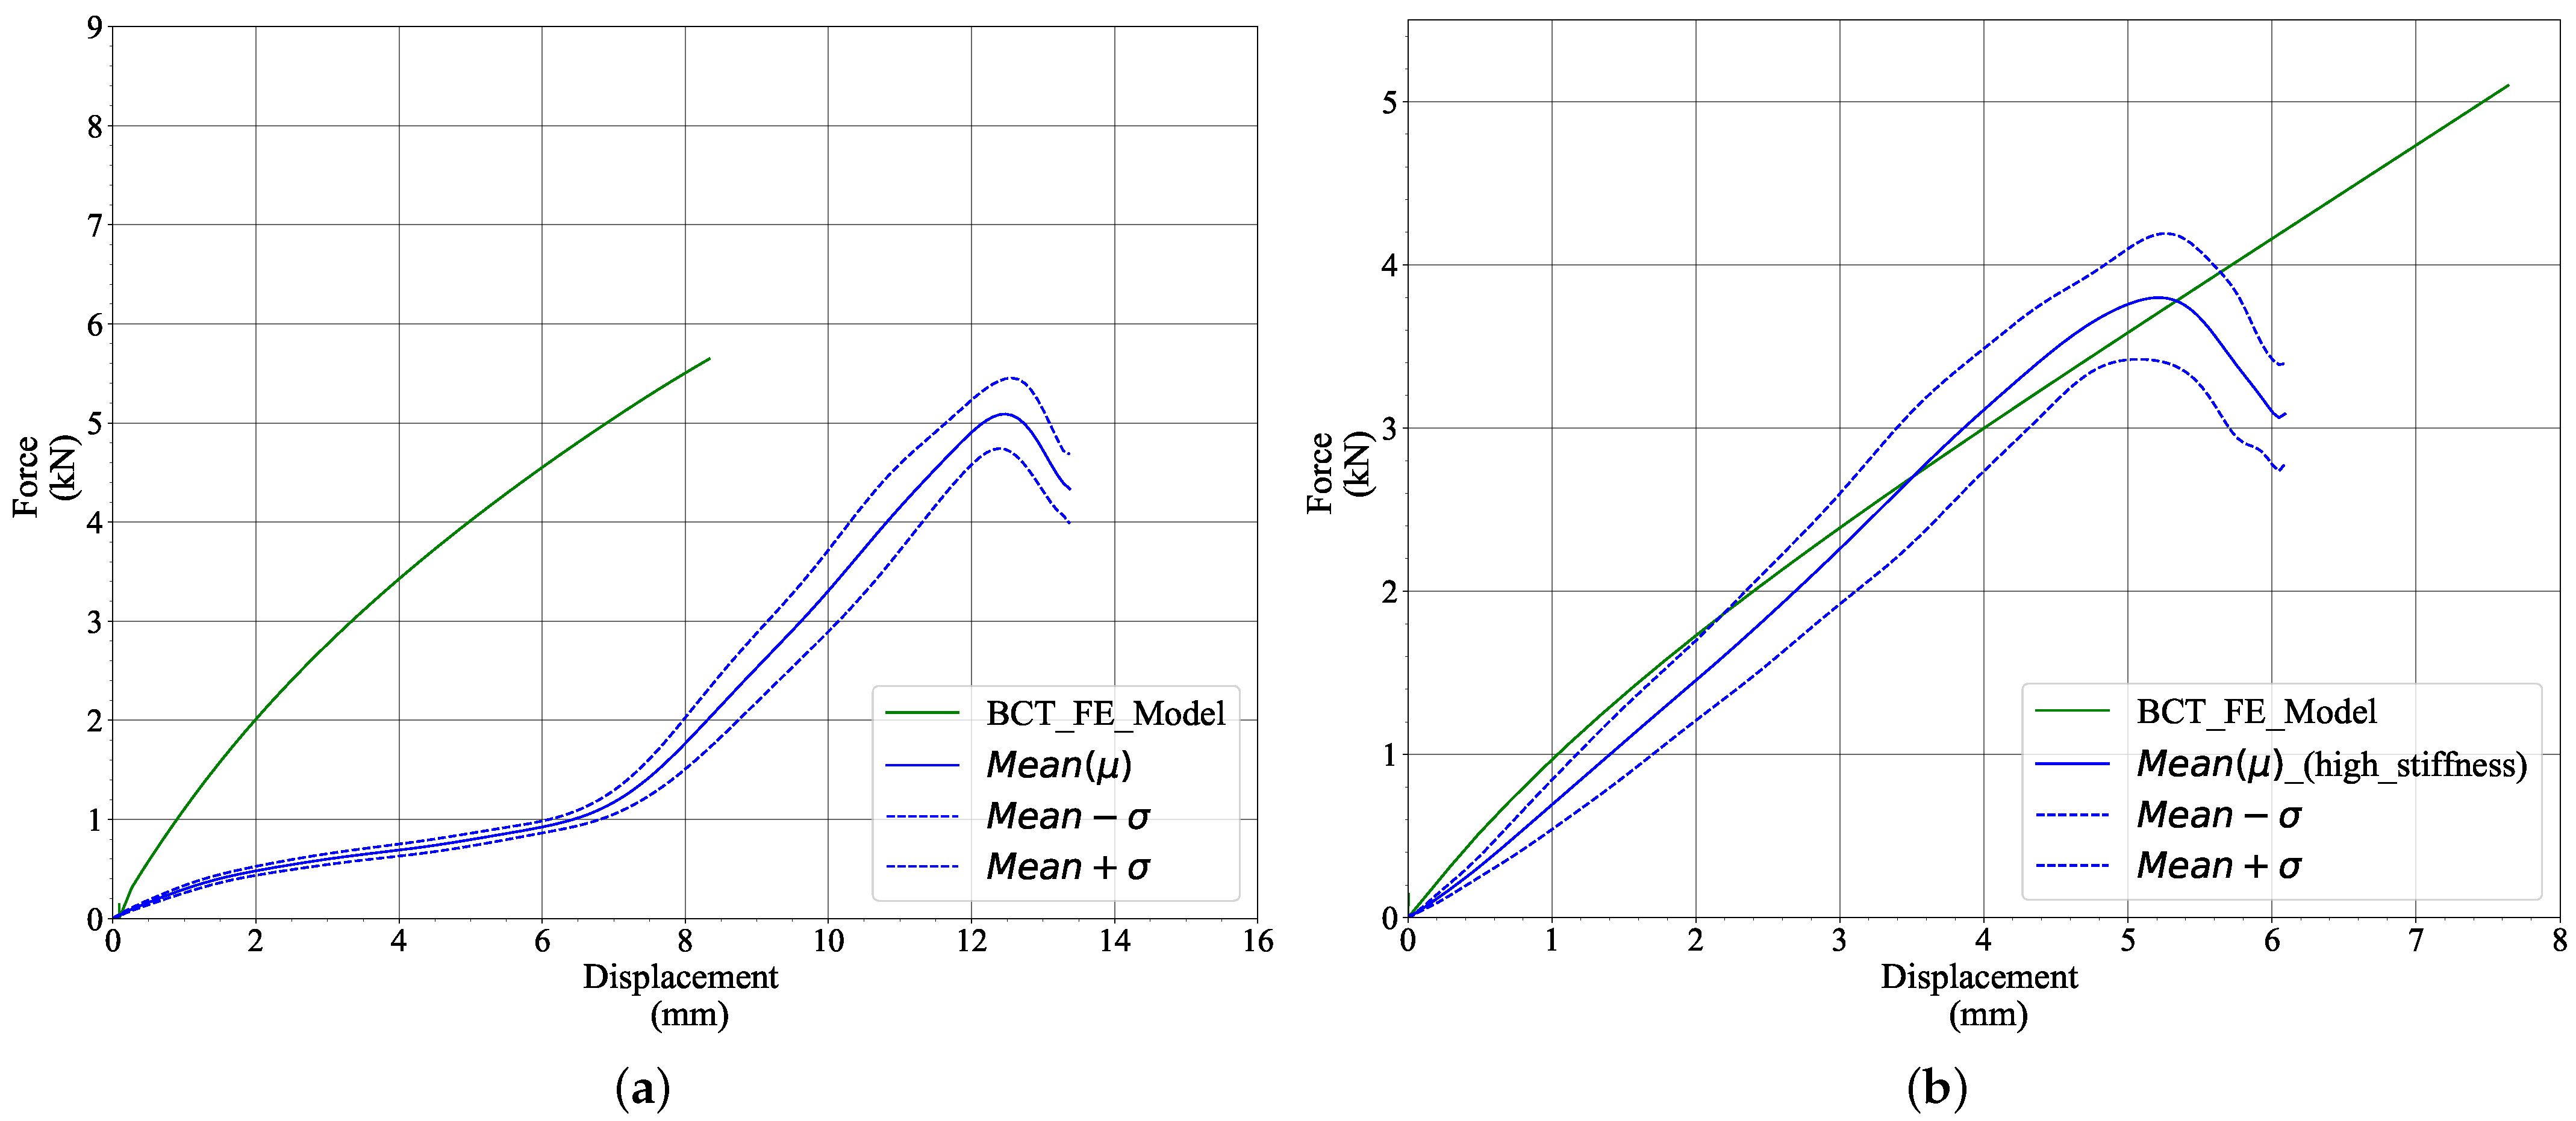
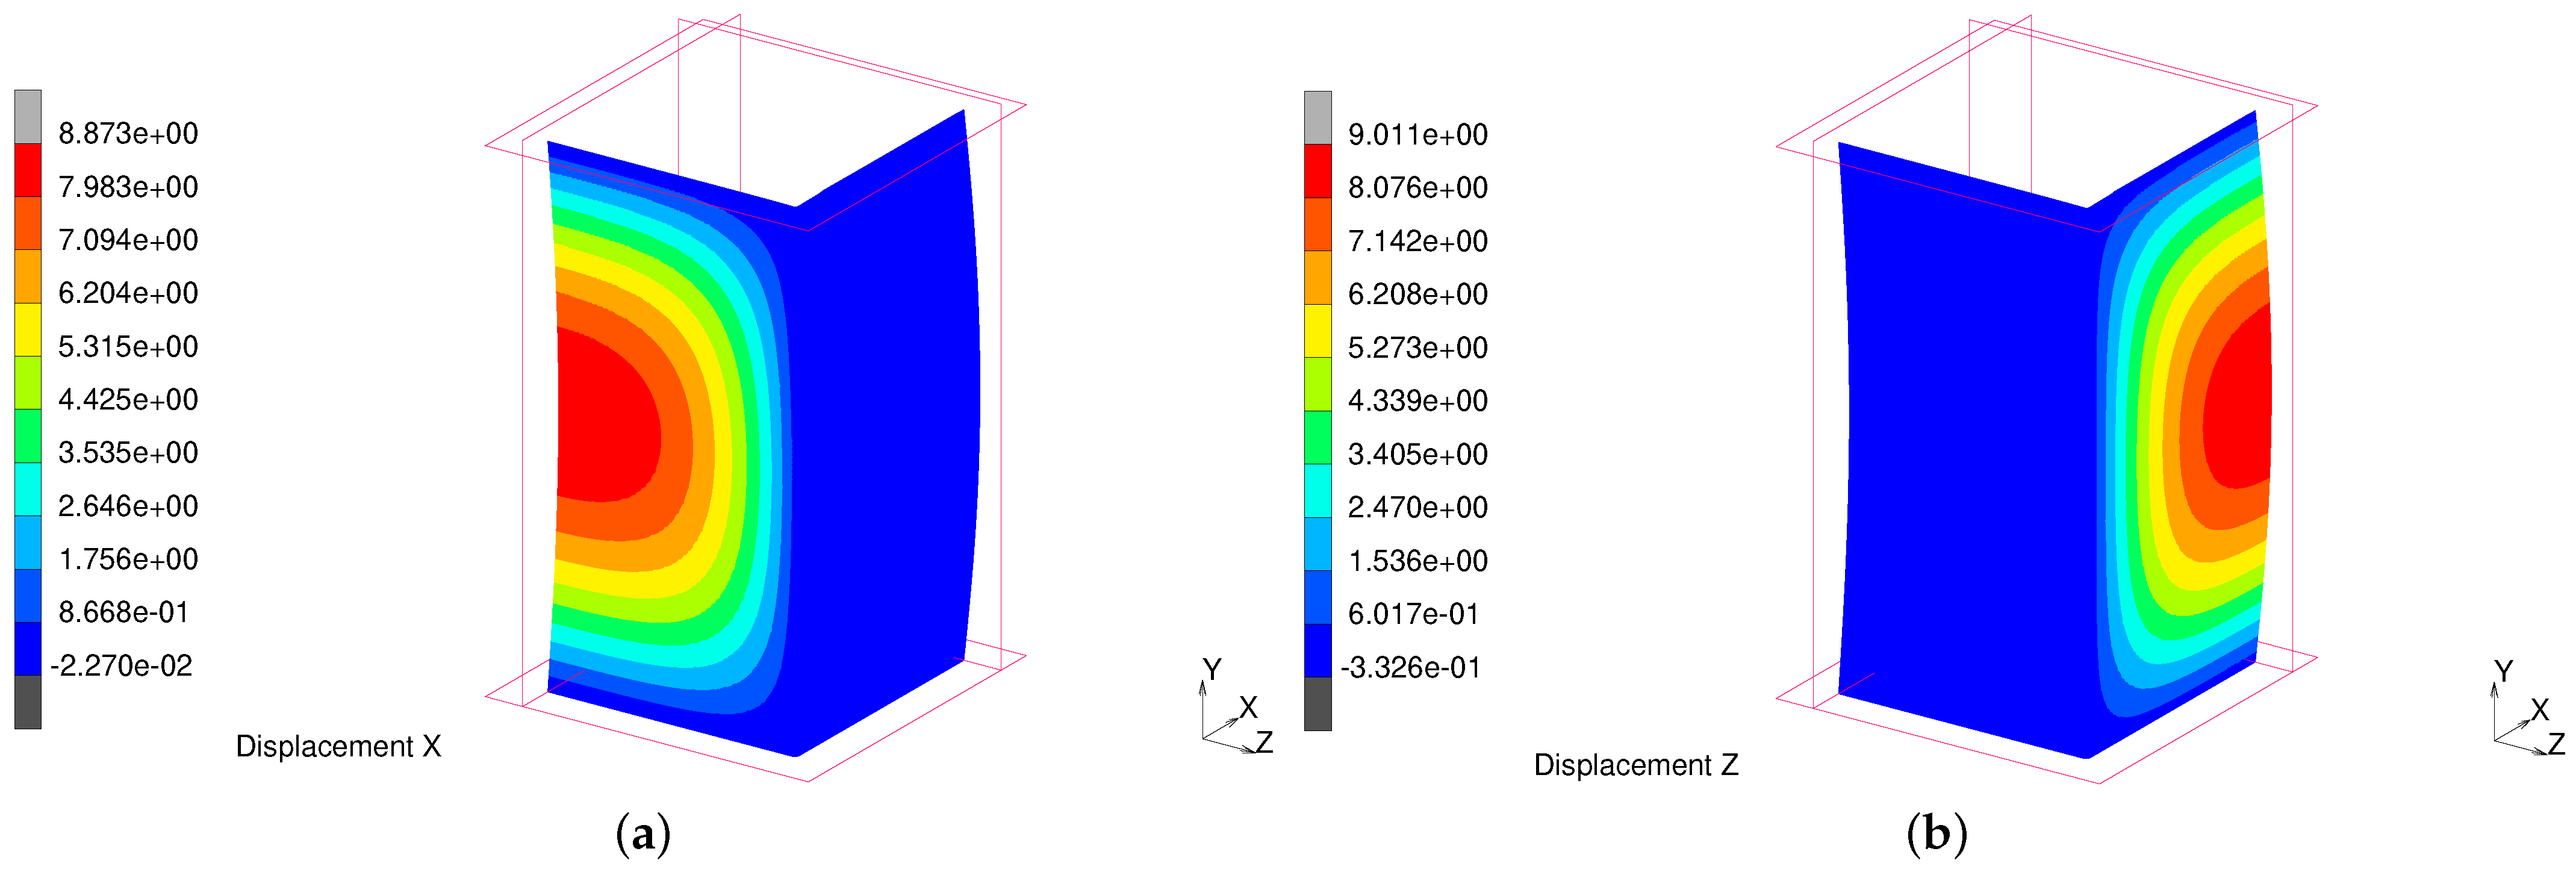
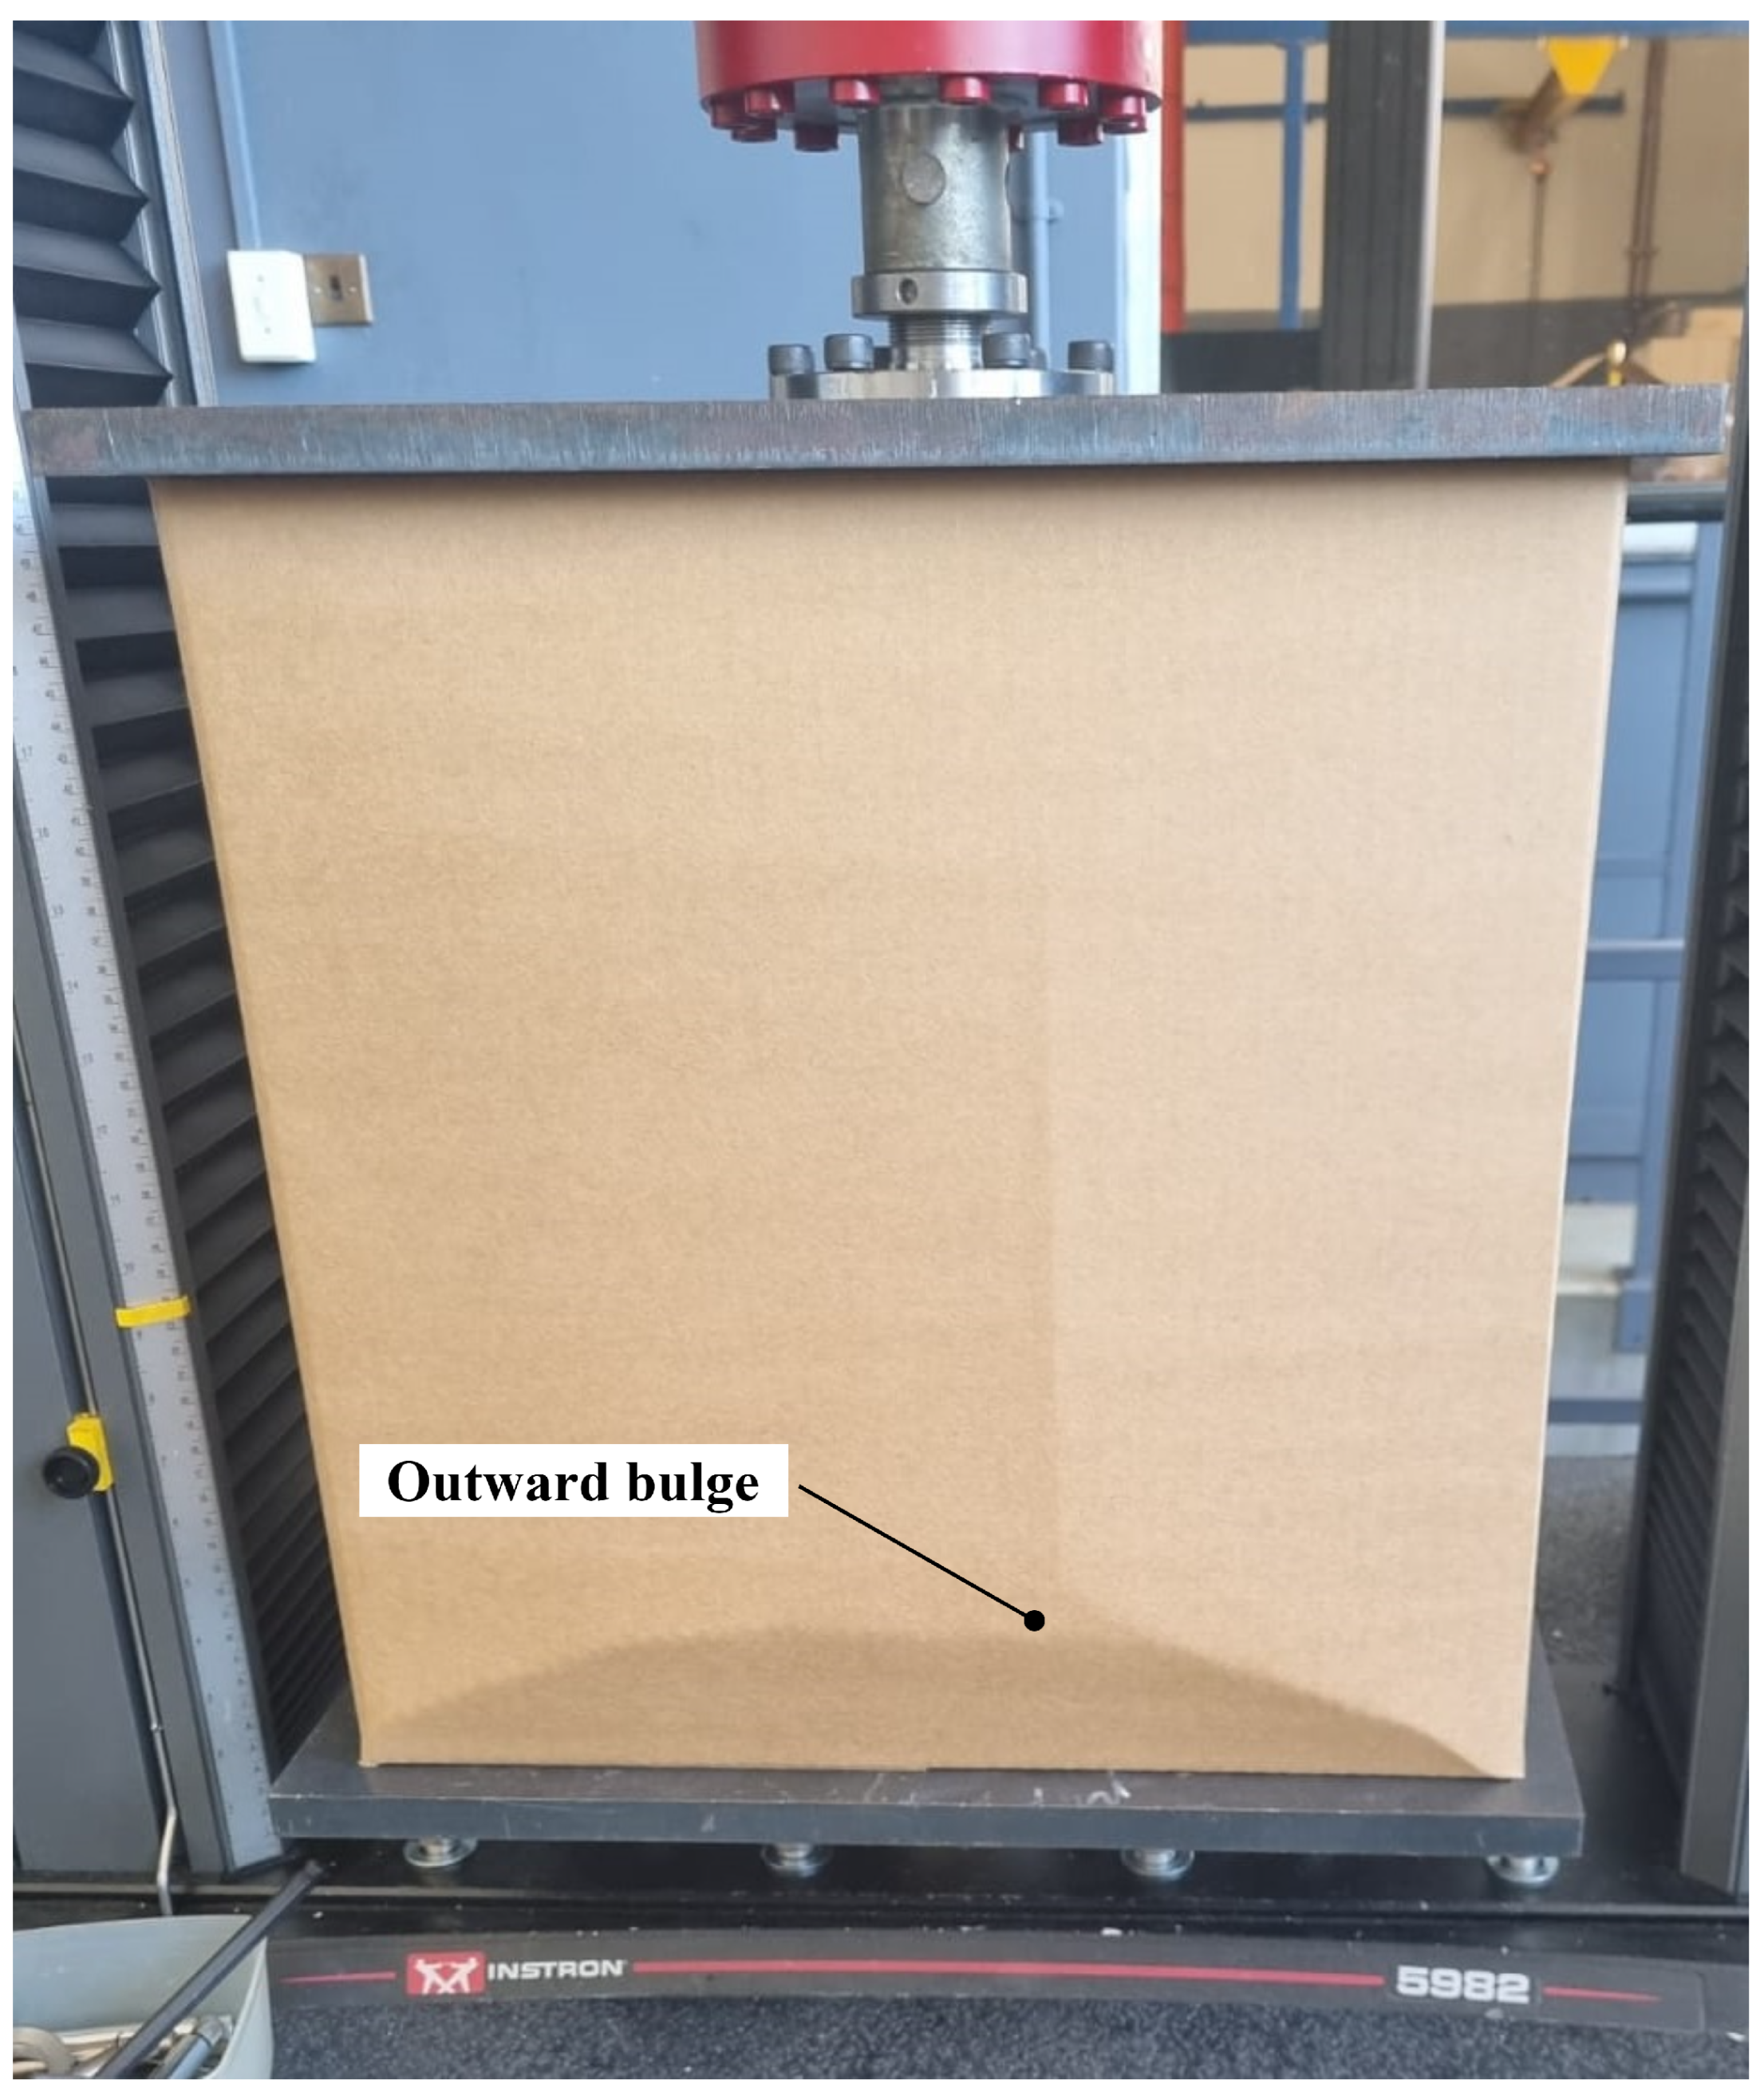
3.4. Box Compression Test

The in-plane load–displacement curves for the standard boxes with flaps and tubes are presented in Figure 17.
Based on Figure 17, the results for all the samples were consistent, hence showing good repeatability of the test. At the onset of the test, up to 6 m m displacement, the box has a relatively low stiffness which increases substantially upon further loading of the box until the box buckles at a displacement of approximately 13 m m and a peak load of 5.09 kN (Figure 17a). The stiffness (slope) of the two regions was calculated by using two points in each of the regions. The initial lower stiffness region has a stiffness value of 120 N   m m −1 while the higher stiffness region has a stiffness value of 669 N   m m −1. Cillie [14] reported similar box compression results for a similar box configuration with a C-flute board.
The initial lower stiffness is due to the compression of the flaps and upper edges/creases of the box before the load is transferred to the panels and four corners of the box which are relatively much stiffer compared to the upper section of the box. Kueh et al. [24] also reported that a more significant portion of the measured in-plane displacement is contributed by the box upper edges/creases than in-plane compression of the panels. A study conducted by Beldie et al. [4] where the BCT was conducted on three box sections—the upper, middle, and lower sections—showed that the upper and lower sections of the box were less stiff compared to the middle section of the box. Hence, the low initial stiffness is attributed to the upper and lower sections of the box.
The tubes exhibited a relatively higher compression strength and deformed less when compared to the standard boxes with flaps (Figure 17b). The tubes buckled at an average peak load of 5.6   k N at a maximum displacement of 3 m m . The higher compression strength of the tube is attributed to the fact that the edge of the tube where the load is applied remains vertical (like a fixed end) and prevents the tube panel from bending; however, once a flap is added onto the panel it introduces some form of eccentricity, redirecting the applied load to encourage an outward bulging of the side panels of the box. As the panels continue to bulge outwards, more of the load is transferred and supported by the four corners of the box, hence reducing the total strength of the box.
An initial buckling analysis was conducted on the FE model without introducing a geometric imperfection to determine the buckling load and buckling mode shape. The model predicted maximum out-of-plane displacements of 8.34   m m and 8.39   m m at the centre of the front and side panels, respectively, as shown in Figure 18.
The predicted buckling load was 8.20   k N , a 61% difference compared to the experimental results, for a geometrically perfect FE model with all nodes precisely aligned in the same plane and load accurately applied in the plane’s direction without any offsets. To further investigate this behaviour, a geometric imperfection was introduced to the model by extracting the buckling mode shape and applying a displacement perturbation scaled from 0.1 m m to 4 m m , and the results are shown in Figure 19.
Both the buckling load and out-of-plane displacements decreased with an increase in the scale of perturbation from 0.1 m m to 4 m m . Larger perturbations (2 m m to 4 m m ) showed no indication of sudden buckling as compared to the smaller perturbations (0.1 m m to 1 m m ). The 4 mm perturbation in-plane and out-of-plane load–displacement curves correspond well to the stiffness of the experimental data when compared to the other models and was therefore used for this study.
The FE model predicted a BCT strength of 5.10   k N , a 0.1% difference when compared to the experimental value of 5.09   k N as depicted in Figure 20. However, the FE model under-predicted the in-plane displacement at buckling load by 43% which is a significant improvement on the values obtained by starke [3] who reported a variation of 87% between the FE model and measured displacement for a telescopic box with vent holes and a similar C-flute board configuration. The reason for the large variation in predicted displacements of the FE model could be attributed to the fact that in as much as the material properties for the creases were accurately described in the FE model (Figure 11) the fact the the flaps were not included in the FE model implies the initial displacement contributed by the flaps is not captured on the FE model. Therefore, mostly panel deformation is captured by the FE model.
The stiffness of the FE model, 644 N   m m −1, compared relatively well (4% difference) with the higher stiffness of 669 N   m m −1 obtained from the BCT experiments as shown in Figure 20b. The experimental results shown in Figure 20b are extracted from Figure 20a by extracting the curve between displacements of 7 m m and 13 m m . There was a relatively high variation of 83 % with the lower stiffness, 120 N   m m −1 of the experiment. This implies that the main reason for the high variation between the measured and FE analysis displacement values is the fact that, with the FE model, it is difficult to capture the initial displacement (low stiffness region of the force–displacement curve) caused by the displacement of the flaps of the box.
The X- and Z-displacement fields at the buckling load of the FE model are given in Figure 21. The side panel buckled inward with a maximum out-of-plane X-displacement of 8.9   m m , while the front panel buckled outward with a maximum out-of-plane Z-displacement of 9.0   m m . A similar buckling mode shape was also observed with the BCT experiments where the front panel buckled outwards and the side panel buckled inwards, as shown in Figure 22.
The out-of-plane displacement measured using digital image correlation (DIC) by [14] for a similar box was 10 m m at failure load. The FE model out-of-plane displacement compared well, with a 10% difference, with the experimental out-of-plane displacement of the front panel. The DIC and FE model displacement fields show that maximum out-of-plane displacement occurs at the centre of the front panel as shown in Figure 21 and Figure 23.

4. Conclusions

The overall objective of this study was to determine the homogenised effective material properties that accurately describe the behaviour of the horizontal edges, vertical edges, and panels of a corrugated paperboard box for full-scale box simulation. Therefore, bending tests were carried out to determine the bending stiffness of the board since the box compression strength is dependent on the load-carrying capacity of the panel areas which resist the compression through bending. Bending tests were also carried out to determine the bending stiffness of the creased samples with the fluting oriented in the CD direction and a crease at the centre; the purpose of this test was to determine the bending stiffness of the vertical edge of a box. Structural and homogenised FE models of the horizontal creases which corresponded well with the BCT low stiffness region experimental results were used to determine the best material model that accurately predicted the behaviour of the horizontal edges of a box under compression loading.
Structural and homogenised FE models of four-point bending tests of creased and un-creased samples were set up to represent the physical and numerical tests, respectively. Similarly, structural and homogenised FE models were set to represent the physical and numerical tests for the horizontal creases. The objective function to be optimised was constructed from the differences between the structural and homogenised tests’ force–displacement curves.
The equivalent material properties obtained using inverse analysis were used for full-scale box simulation. The box panels were characterised using optimal material properties derived from the optimisation of four-point bending test FE models. The material properties used to define the vertical edges of the box were obtained from the optimisation of four-point bending FE models with creases at the centre. The horizontal edges of the box would be defined using the material properties obtained from the optimisation of FE models specific to horizontal creases. The developed BCT FE model accurately predicted the box’s collapse load with a variance of only 0.1%, though it under-predicted the displacement by 43%, which represents a significant improvement compared to values previously reported in the literature by [3].
Incorporating the effect of the crease in the BCT FE model significantly enhanced the accuracy of the predicted in-plane displacement results. However, a significant discrepancy persists between these predictions and the experimental in-plane displacement outcomes. To bridge this gap, the FE model could be further refined by incorporating the flaps, thereby enabling the model to more accurately capture the initial displacement and subsequent settling of the flaps before the load is transferred to the box’s panels and edges/creases. The extent to which the flaps should be integrated into the FE model to improve the in-plane displacement predictions requires further investigation.

Author Contributions

Conceptualisation, R.N.A., M.P.V. and C.J.C.; methodology, R.N.A.; software, R.N.A.; validation, R.N.A.; formal analysis, R.N.A.; data curation, R.N.A.; writing—original draft preparation, R.N.A., M.P.V. and C.J.C.; writing—review and editing, R.N.A., M.P.V. and C.J.C.; visualisation, R.N.A., M.P.V. and C.J.C.; supervision, M.P.V. and C.J.C.; project administration, M.P.V. and C.J.C. All authors have read and agreed to the published version of the manuscript.

Funding

This research was funded by the Stellenbosch University Postgraduate Scholarship Program.

Data Availability Statement

The data presented in this study are available on request from the corresponding author.

Conflicts of Interest

The authors declare no conflicts of interest.

Appendix A. Optimisation of FE Models

Table A1. Material properties of corrugated paperboard obtained from calibration of experimental results with structural four-point bending FE model with crease.
 LinersCore
E 1
(MPa)
E 2
(MPa)
G 12
(MPa)
E 1
(MPa)
E 2
(MPa)
G 12
(MPa)
Reference Properties
(CLPT)
3348115576123551459718
Starting
Points
12381.00836.52675.331301.521363.04510.74
22377.48887.75587.751229.441246.11589.97
32376.76894.70624.941539.981260.08687.67
42376.09953.34695.151487.811166.38467.30
52376.031053.82523.571595.701303.57654.72
62376.82996.01508.961691.961099.60562.57
72378.801107.63543.371272.201159.50529.69
82380.871108.82719.501677.841018.65663.07
92380.101034.11533.161287.351375.94674.46
102380.62927.75619.021204.64976.10623.06
Average 2378.46980.04603.071428.841196.90596.33
Standard
Deviation
1.9490.1872.01180.47130.3072.54
Table A2. Equivalent material properties of corrugated paperboard obtained from inverse analysis conducted on combined MD and CD models.
LinersCore
E 1 (MPa) E 2 (MPa) G 12 (MPa)Initial Yield StressYield Stress (5% Plastic Strain) E 1 (MPa) E 2 (MPa) G 12 (MPa)Initial Yield StressYield Stress (5% Plastic Strain)
Reference Properties (CLPT) 66952310152217.4421.96732191514.0222.43
Starting Points15370.181878.221287.3113.5324.5959.07255.2014.3212.6321.35
25368.301866.051548.0213.6120.1458.77258.5712.7515.0818.99
35371.311872.711283.4911.9020.5058.97258.2113.6211.6921.39
45371.331867.721445.3613.4718.7260.86262.2717.2913.0626.72
55363.461888.131287.3113.4621.8859.31247.3114.7313.8425.00
65359.691891.321548.0213.4823.7459.86245.2216.1716.6925.18
75370.011910.871283.4913.6617.8658.45235.1112.3914.1620.17
85361.841887.491445.3613.4925.6563.21251.9817.8717.2027.48
95371.721887.401222.8613.5724.2658.69248.9615.5816.1823.68
105361.501887.431571.6713.4422.6961.63251.2716.0714.6822.50
Average 5366.931883.731426.5413.3622.0059.88251.4115.0814.5223.25
Standard Deviation 4.5112.55156.740.492.491.477.461.751.712.69
Table A3. Equivalent material properties of corrugated paperboard obtained from inverse analysis conducted on creased four-point bending FE models.
LinersCore
E 1
(MPa)
E 2
(MPa)
G 12
(MPa)
E 1
(MPa)
E 2
(MPa)
G 12
(MPa)
Reference Properties (CLPT) 23799806037321915
Starting Points14016.23925.60806.8745.3899.4711.84
23660.87937.30699.3447.7098.899.09
33696.561027.19889.5760.06134.3910.42
42820.84940.75636.5852.6598.689.95
53157.761011.55768.9155.65126.429.50
63413.911066.66868.2741.74113.0411.28
72942.90971.99848.1858.48111.3212.88
83029.871001.44749.2743.45133.3611.74
93886.091015.50728.7850.74121.2712.59
103280.73990.93640.5954.27123.2410.76
Average 3390.57982.89763.6451.01116.0111
Standard Deviation 390.5934.7585.265.9913.131.22
Table A4. Equivalent material properties of corrugated paperboard obtained from inverse analysis conducted on horizontal crease FE models.
LinersCore
E 1   (MPa) E 2   (MPa) G 12   (MPa) E 1   (MPa) E 2   (MPa) G 12   (MPa)
Reference Properties (CLPT) 23799806027321915
Starting Points13990.331357.28835.0059.93133.309.54
23982.041379.64890.3260.58145.9112.85
33980.881368.87890.3160.52147.2212.79
43981.731374.11901.8160.94147.9110.85
53999.991286.03831.6960.28100.1010.51
63980.451382.31838.0160.12147.9411.18
73977.821380.82911.8660.53147.7812.99
83984.081369.76897.2460.64143.5012.48
93992.531344.99844.5958.53145.0911.96
103977.391381.33892.7260.62144.6312.88
Average 3984.721362.52873.3660.27140.3411.80
Standard Deviation 6.9027.9030.160.6414.031.15

Appendix B. Horizontal Crease Stiffness Determination

Figure A1. Structural horizontal crease FE model nodal displacements for section R1.
Mca 29 00070 g0a1
Figure A2. Structural horizontal crease FE model nodal displacements for section R2.
Mca 29 00070 g0a2
Figure A3. Homogenised (CLPT) horizontal crease FE model nodal displacements for section R1.
Mca 29 00070 g0a3
Figure A4. Homogenised (CLPT) horizontal crease FE model nodal displacements for section R2.
Mca 29 00070 g0a4

References

  1. Han, J.; Park, J.M. Finite element analysis of vent/hand hole designs for corrugated fibreboard boxes. Packag. Technol. Sci. 2007, 20, 39–47. [Google Scholar] [CrossRef]
  2. Fadiji, T.; Ambaw, A.; Coetzee, C.J.; Berry, T.M.; Opara, U.L. Application of finite element analysis to predict the mechanical strength of ventilated corrugated paperboard packaging for handling fresh produce. Biosyst. Eng. 2018, 174, 260–281. [Google Scholar] [CrossRef]
  3. Starke, M.M. Material and Structural Modeling of Corrugated Paperboard Packaging for Horticultural Produce. Master’s Thesis, Stellenbosch University, Stellenbosch, South Africa, 2020. [Google Scholar]
  4. Beldie, L.; Sandberg, G.; Sandberg, L. Paperboard packages exposed to static loads–finite element modeling and experiments. Packag. Technol. Sci. Int. 2001, 14, 171–178. [Google Scholar] [CrossRef]
  5. Renman, M. Test fixture for eccentricity and stiffness of corrugated board. Exp. Mech. 1996, 36, 262–268. [Google Scholar] [CrossRef]
  6. Frank, B. Corrugated box compression—A literature survey. Packag. Technol. Sci. Int. 2014, 27, 105–128. [Google Scholar] [CrossRef]
  7. Aduke, R.; Venter, M.; Coetzee, C. An Analysis of Numerical Homogenisation Methods Applied on Corrugated Paperboard. Math. Comput. Appl. 2022, 27, 108. [Google Scholar] [CrossRef]
  8. Jekel, C.F.; Venter, G.; Venter, M.P. Obtaining a hyperelastic non-linear orthotropic material model via inverse bubble inflation analysis. Struct. Multidiscip. Optim. 2016, 4, 927–935. [Google Scholar] [CrossRef]
  9. Garbowski, T.; Maier, G.; Novati, G. On calibration of orthotropic elastic-plastic constitutive models for paper foils by biaxial tests and inverse analyses. Struct. Multidiscip. Optim. 2012, 46, 111–128. [Google Scholar] [CrossRef]
  10. Helena, F. Investigating an Inverse Finite Element Approach for Characterising Soft Materials. Master’s Thesis, Stellenbosch University, Stellenbosch, South Africa, 2020. [Google Scholar]
  11. Murdock, K.; Martin, C.; Sun, W. Characterization of mechanical properties of pericardium tissue using planar biaxial tension and flexural deformation. J. Mech. Behav. Biomed. Mater. 2018, 77, 148–156. [Google Scholar] [CrossRef] [PubMed]
  12. Hagman, A. Investigations of In-Plane Properties of Paperboard. Ph.D. Thesis, KTH Royal Institute of Technology, Stockholm, Sweden, 2013. [Google Scholar]
  13. BS EN 20187:199; Paper, Board, and Pulps—Standard Atmosphere for Conditioning and Testing and Procedure for Monitoring the Atmosphere and Conditioning of Samples. British Standards Institution: London, UK, 1990. Available online: https://www.iso.org/standard/4037.html (accessed on 12 February 2023).
  14. Cillie, J.; Coetzee, C. Experimental and Numerical Investigation of the In-Plane Compression of Corrugated Paperboard Panels. Math. Comput. Appl. 2022, 27, 108. [Google Scholar] [CrossRef]
  15. ISO 5628:1990; Paper and Board—Determination of Bending Stiffness by Static Methods. International Organization for Standardization: Geneva, Switzerland, 1990. Available online: https://www.iso.org/standard/11703.html (accessed on 12 February 2023).
  16. McKee, R.; Gander, J.; Wachuta, J. Compression strength formula for corrugated boxes. Paperboard Packag. 1963, 48, 149–159. [Google Scholar]
  17. Mann, R.W.; Baum, G.A.; Habeger, C.C., Jr. Determination of All Nine Orthotropic Elastic Constants for Machine-Made Paper. Available online: https://smartech.gatech.edu/bitstream/handle/1853/3101/tps-084.pdf (accessed on 12 February 2023).
  18. Baum, G. Orthotropic elastic constants of paper. TAPPI J. 1981, 64, 97–101. [Google Scholar]
  19. Nordstrand, T.M. Parametric study of the post-buckling strength of structural core sandwich panels. Compos. Struct. 1995, 30, 441–451. [Google Scholar] [CrossRef]
  20. Mrówczyński, D.; Garbowski, T.; Knitter-Piątkowska, A. Estimation of the compressive strength of corrugated board boxes with shifted creases on the flaps. Materials 2021, 14, 5181. [Google Scholar] [CrossRef] [PubMed]
  21. Haj-Ali, R.; Choi, J.; Wei, B.S.; Popil, R.; Schaepe, M. Refined nonlinear finite element models for corrugated fiberboards. Compos. Struct. 2009, 4, 321–333. [Google Scholar] [CrossRef]
  22. Šarčević, I.; Gregor-Svetec, D.; Banić, D. Effect of perforations on the loss of corrugated cardboard bending stiffness. In Proceedings of the 11th International Symposium on Graphic Engineering and Design, Novi Sad, Serbia, 3–5 November 2022. [Google Scholar]
  23. Smedman, O. Factors Affecting the Relative Crease Strength of Paperboard. Master’s Thesis, Lund University, Lund, Sweden, 2017. [Google Scholar]
  24. Kueh, C.; Navaranjan, N.; Duke, M. The effect of in-plane boundary conditions on the post-buckling behaviour of rectangular corrugated paperboard panels. Comput. Struct. 2012, 104, 55–62. [Google Scholar] [CrossRef]
Figure 1. Corrugated paperboard box sections.
Mca 29 00070 g001
Figure 2. Corrugated paperboard cross-section.
Mca 29 00070 g002
Figure 3. Creased four-point bending sample.
Mca 29 00070 g003
Figure 4. Four-point bending test setup.
Mca 29 00070 g004
Figure 5. Box compression test setup for a standard MK4 regular slotted container.
Mca 29 00070 g005
Figure 6. Corrugated core profile with C-fluting (mm) [3].
Mca 29 00070 g006
Figure 7. Four-point bending test of structural FE model showing creased region as well as quarter-symmetry surfaces used to apply symmetry conditions.
Mca 29 00070 g007
Figure 8. Four-point bending test of homogenised FE model showing creased region and quarter-symmetry surfaces used to apply symmetry conditions.
Mca 29 00070 g008
Figure 9. Structural FE model showing creased region under compression.
Mca 29 00070 g009
Figure 10. Structural FE model showing the region used to extract the force–displacement data.
Mca 29 00070 g010
Figure 11. FE model of BCT with quarter-symmetry conditions.
Mca 29 00070 g011
Figure 12. FE model of BCT showing the definition of material properties.
Mca 29 00070 g012
Figure 13. FE model of BCT showing the definition of material properties.
Mca 29 00070 g013
Figure 14. Four-point bending force–displacement curves. (a) Comparison of MD force–displacement curves between FE models and experimental data. (b) Comparison of CD force–displacement curves between FE models and experimental data.
Mca 29 00070 g014
Figure 15. Comparison of four-point bending force–displacement curves in the CD direction between FE models and experimental data of both creased samples and the samples without creases.
Mca 29 00070 g015
Figure 16. Horizontal crease FE model force–displacement curves. (a) Comparison of force–displacement curves between structural and homogenised FE models and experimental data. (b) Comparison of force–displacement curves between FE models and experimental data.
Mca 29 00070 g016
Figure 17. Box and tube compression tests, force–displacement curves. (a) In-plane force–displacement curves for standard MK4 boxes with flaps. (b) In-plane force–displacement curves for standard MK4 tubes.
Mca 29 00070 g017
Figure 18. Displacement plots for BCT FE model without geometric imperfection. (a) x-displacement plot for simulated BCT. (b) z-displacement plot for simulated BCT.
Mca 29 00070 g018
Figure 19. Load–displacement curves plots for BCT FE model with geometric imperfection. (a) In-plane load–displacement curves for simulated BCT; (b) out-of-plane load–displacement curves for simulated BCT.
Mca 29 00070 g019
Figure 20. BCT force–displacement curves. (a) Comparison of force–displacement curves between BCT FE models and experimental data. (b) Comparison of force–displacement curves between BCT FE models and the high stiffness region of the BCT experimental results.
Mca 29 00070 g020
Figure 21. Displacement plots for BCT FE model with geometric imperfection. (a) X-displacement plot for simulated BCT. (b) Z-displacement plot for simulated BCT.
Mca 29 00070 g021
Figure 22. Deformation of a box at failure load during BCT.
Mca 29 00070 g022
Figure 23. Out-of-plane displacement of the front panel of a box measured using DIC [14].
Mca 29 00070 g023
Table 1. Material properties used for FE models.
Paper TypeLiners (250KL)Corrugated Core (150SC)Homogenised Core (CLPT)
E 1 (MPa)6695470973
E 2 (MPa)23102918219
E 3 (MPa)35423000
ν 12 0.500.370.07
ν 23 0.010.010.01
ν 13 0.010.010.01
G 12 (MPa)1522143515
G 13 (MPa)122866
G 23 (MPa)66837
Thickness (mm)0.3450.2514.4 (effective thickness of the board)
Table 2. Material properties used to define the creased elements.
Paper TypeLiners (250KL)Corrugated Core (150SC)Homogenised Core (150SC)
E 1 (MPa)2378142951
E 2 (MPa)9801197116
E 3 (MPa)1383000
ν 12 0.500.370.02
ν 23 0.010.010.01
ν 13 0.010.010.01
G 12 (MPa)60359611
G 13 (MPa)43261
G 23 (MPa)28343
Thickness (mm)0.3450.2514.4
Table 3. Yield stresses of individual paper sheets used for liners and fluting.
Type σ 0
(MPa)
σ 45
(MPa)
σ 90
(MPa)
σ av
(MPa)
Liners
(250KL)
26.1117.4417.4419.61
Fluting
(150C-SC)
32.6514.0214.0218.68
Table 4. Equivalent material properties of corrugated paperboard obtained from inverse analysis.
Layer E 1
(MPa)
E 2
(MPa)
G 12
(MPa)
Initial Yield Stress
(MPa)
Yield Stress (5% Strain)
(MPa)
Normal Sample (un-creased sample)
Liners53641884142713.3622
Homogenised core602511514.5223.25
Vertical creases
Liners3390983764--
Homogenised core5111611--
Horizontal creases
Liners39851363873--
Homogenised core6014012--
Table 5. Bending stiffness (N/m) comparison of experimental and FE models.
MDCD
Sample TypeExpStructural FE ModelHomogenised FE ModelExpStructural FE ModelHomogenised FE Model
Normal sample (without crease) 20.44 21.20 18.10 6.88 6.58 6.21
Error (%)411410
Disclaimer/Publisher’s Note: The statements, opinions and data contained in all publications are solely those of the individual author(s) and contributor(s) and not of MDPI and/or the editor(s). MDPI and/or the editor(s) disclaim responsibility for any injury to people or property resulting from any ideas, methods, instructions or products referred to in the content.

