Article

An Alternative Analysis of Computational Learning within Behavioral Neuropharmacology in an Experimental Anxiety Model Investigation

by
Isidro Vargas-Moreno
1,
Héctor Gabriel Acosta-Mesa
2,
Juan Francisco Rodríguez-Landa
3,
Martha Lorena Avendaño-Garrido
4,
Rafael Fernández-Demeneghi
1 and
Socorro Herrera-Meza
5,*
1
Instituto de Investigaciones en Comportamiento Alimentario y Nutrición (IICAN), Universidad de Guadalajara, Guadalajara 44100, Mexico
2
Instituto de Investigaciones en Inteligencia Artificial, Universidad Veracruzana, Xalapa 91090, Mexico
3
Instituto de Neuroetología, Universidad Veracruzana, Xalapa 91090, Mexico
4
Facultad de Matemáticas, Universidad Veracruzana, Xalapa 91090, Mexico
5
Instituto de Investigaciones Psicológicas, Universidad Veracruzana, Xalapa 91090, Mexico
*
Author to whom correspondence should be addressed.
Math. Comput. Appl. 2024, 29(5), 76; https://doi.org/10.3390/mca29050076
Submission received: 2 June 2024 / Revised: 2 September 2024 / Accepted: 6 September 2024 / Published: 9 September 2024
(This article belongs to the Special Issue New Trends in Computational Intelligence and Applications 2023)

Abstract

:
Behavioral neuropharmacology, a branch of neuroscience, uses behavioral analysis to demonstrate treatment effects on animal models, which is fundamental for pre-clinical evaluation. Typically, this determination is univariate, neglecting the relevant associations for understanding treatment effects in animals and humans. This study implements regression trees and Bayesian networks from a multivariate perspective by using variables obtained from behavioral tests to predict the time spent in the open arms of the elevated arm maze, a key variable to assess anxiety. Three doses of allopregnanolone were analyzed and compared to a vehicle group and a diazepam-positive control. Regression trees identified cut-off points between the anxiolytic and anxiogenic effects, with the anxiety index standing out as a robust predictor, combined with the percentage of open-arm entries and the number of entries. Bayesian networks facilitated the visualization and understanding of the interactions between multiple behavioral and biological variables, demonstrating that treatment with allopregnanolone (2 mg) emulates the effects of diazepam, validating the multivariate approach. The results highlight the relevance of integrating advanced methods, such as Bayesian networks, into preclinical research to enrich the interpretation of complex behavioral data in animal models, which can hardly be observed with univariate statistics.

Graphical Abstract

1. Introduction

Neurosciences are vital in society, as they help us better understand and comprehend the neural mechanisms that govern our physiological, biochemical, and molecular processes and behavior [1]. The latter is defined as all the observable actions, movements, and behaviors performed by an organism in response to internal and external stimuli; it can be simple or complex and is influenced by the interaction of genetic, biological, environmental, and social factors [2]. In this regard, a discipline within neuroscience called behavioral neuropharmacology (BNP) focuses on studying how drugs, including medications and other substances, impact behavior modification through central nervous system activity, which modifies behavioral responses [3,4]. This provides valuable information on how organisms interact with their environment and how they develop and express their characteristics. Therefore, behavioral analysis helps researchers and practitioners better understand organisms’ motivations, needs, experiences, and the neural mechanisms underlying such behavior or various pathologies, thereby developing strategies to improve their well-being and adaptation in multiple contexts [5,6,7,8].
In analyzing behavior, data analysis is fundamental to understanding the effects promoted by treatments or experimental manipulations that affect behavior thus identifying the biological and chemical mechanisms that modify it. For this purpose, multiple statistical methods are used to compare the measures of central tendency and generate inference at the behavioral level within the BNP. Generally, within this analysis, the most frequently used statistical techniques are comparisons of the measures of central tendency, correlation analysis, and longitudinal analysis of treatments (repeated measures ANOVA), among other techniques associated with the design of experiments [9].
In many research areas, the incursion of other data analysis techniques provides remarkable findings thus contributing to multidisciplinary growth within scientific research. With that said, computational learning, or machine learning (ML), is a branch of artificial intelligence that is responsible for developing algorithms and computational models that can learn and improve automatically from experience, i.e., machine learning systems use data to understand patterns and make predictions or help in decision-making [10]. It has many utilities, including natural language processing, computer vision, recommender systems, medical diagnosis, and pattern recognition [11]. ML has made several significant contributions in the field of neuropharmacology, allowing for advances in the understanding of the effects of drugs on the central nervous system and behavior, including the modeling of drug–receptor interactions, the prediction of side effects, the discovery of new compounds, and the analysis of brain imaging data [12,13,14]. Therefore, the interaction of both areas provides precious results for neuropharmacology research and thus a better understanding of certain aspects of various topics.
It is noteworthy that, in behavioral analysis, incursions of supervised machine learning applications have been initiated to enrich the researched topics of BNP, such as the implementation of algorithms for the classification of sleep waves [15], in the ethology of aggression [16]. Specifically, in behavior, the identification of features in tests of behaviors dependent on the treatments administered [17,18,19] promotes new ways to analyze the data collected from the BNP and enrich their interpretations. The most resorted tools so far are the Bayesian naive classifier, k nearest neighbors, support vector machines, and decision trees. However, these are not the only techniques to shed light on the behavioral unknowns.
Regression trees are a supervised machine learning model that seeks to predict continuous numerical values as a function of a set of predictor variables; it divides the feature space into small and homogeneous regions in terms of the output variable [20]. Under this process, the regression tree grows until a particular stopping criterion is met, such as reaching a maximum number of leaf nodes, a predefined maximum depth, or when the variance reduction is no longer significant [21]. Another ML tool that contributes significantly to research is the Bayesian networks, which are graphical probabilistic models that represent the relationships between random variables using an acyclic-directed graph. They comprise nodes representing the random variables, and the directed arcs represent the conditional dependence relationships between them. Each node is associated with a conditional probability distribution that describes the probability of each value of the variable represented by that node, given the combination of values of its parent nodes [22,23]. They are a handy tool for modeling and analyzing complex systems in which variables are interrelated and specific values or relationships are unknown.
Under the above description, the present work implemented regression trees and Bayesian networks in a practical case of BNP. We sought to predict the characteristic values of relevant variables and identify pharmacological treatments through the interaction of variables obtained from the behavioral tests used in BNP.

2. Materials and Methods

2.1. Subjects

Forty adult rats with the characteristics described in Table 1, were housed in translucent acrylic boxes in a biotherium of the Institute for Psychological Research of the Universidad Veracruzana, with light/dark invested cycle (light was turned on at 7:00 a.m.). The rats had unrestricted access to food and water, and all experimental care and procedures adhered to the national standard, NOM-ZOO-062 [24]. Furthermore, at the international level, the research was conducted in accordance with the guidelines outlined in the “Guide for the Care and Use of Laboratory Animals” by the Institute of Laboratory Animal Resources [25].

2.2. Experimental Groups

The experimental subjects were organized into five groups, each consisting of eight rats (Table 1): (1) the vehicle group, which received sterile water (PiSA Laboratory, Mexico City, Mexico), (2) a group-administered a 0.5 mg/kg dose of allopregnanolone, (3) a group with a 1 mg/kg dose of allopregnanolone, (4) a group with a 2 mg/kg dose of allopregnanolone (Sigma-Aldrich Co., St. Louis, MO, USA), and (5) a group given a 2 mg/kg dose of diazepam (Roche Laboratory, Mexico City, Mexico) (Figure 1). These treatments were given as a single, acute intraperitoneal injection, using a volume of 1 mL per kg of body weight. The behavioral effects were assessed 30 min post-administration.

2.3. Behavioral Tests

The sessions were videotaped for 5 min, and each subject was an exposed object. The apparatus was cleaned with a 15% ethanol solution to prevent volatile particles from interfering with the behavior. Subsequently, the videos were analyzed by two expert behavior analysts using UVehavior V1.0.0 software (https://github.com/Manolomon/uvehavior-desktop/releases/tag/v1.0.0, accessed on 2 June 2024) to obtain variables of interest.

2.3.1. Elevated Plus-Maze Test

The Elevated Plus-Maze test is commonly employed to evaluate anxiety-related behaviors in rats by exposing them to two natural fears: open spaces (agoraphobia) and heights (acrophobia) [26]. The test setup consisted of an apparatus with two open arms (50 × 10 cm) and two enclosed arms (50 × 10 × 50 cm) arranged in a cross and raised 50 cm above the ground. Each rat was individually placed in the central area facing an open arm. The following variables were recorded: (a) the time spent in the open arms (seconds) (TOA), (b) the number of entries into the open arms (OAE), (c) the number of entries into the closed arms (CAE), (d) the total number of entries into both types of arms (TE), (e) the percentage of entries into the open arms (PEOA), and (f) the anxiety index (AIn), calculated according to the formula proposed by Cohen et al. [27].
A I n = 1 T O A T T T + O A E T E 2
(TOA: time spent in the open arms; OAE: number of entries in open arms; TTT: total test time; TE: total number of entries in arms).

2.3.2. Locomotor Activity Test (Open-Field Test)

The open-field test is widely utilized to evaluate spontaneous animal activity by assessing their exploratory behavior, motivation, and motor function [28]. The test was conducted in a light blue glass box measuring 44 cm in length, 33 cm in width, and 40 cm in height, with a floor divided into 12 squares (each 11 × 11 cm). The test duration was 5 min, during which each animal was placed individually in the same corner, facing the same direction. The measured variables were (a) the number of squares crossed (C), (b) the time spent rearing (TR), and (c) the time spent grooming (TG).

2.4. Data Analysis

2.4.1. Regression Trees Analysis

The regression decision tree (fitrtree) was obtained using the fit binary decision tree for the regression algorithm in Matlab R2022b. Given the number of observations per class, all data were used for both the learning and testing phases. The decision tree’s performance was evaluated using a linear regression test of the actual and estimated observations.

2.4.2. Bayesian Networks

For the implementation of the Bayesian networks, the Weka software version 3.9.6 was used through the BayesNet algorithm to obtain the networks (estimator: Sim-pleEstimator -A0.5 and searchAlgorithm: HillClimber -P 1 -S Bayes), and SamIam version 3.0, for the generation of the probabilities by treatment. Two models were adjusted; the first one sought to categorize through the arithmetic mean with the following cut-off points in the variables:
  • TOA (low activity (LA) when they had a value below 115.66 s, high activity (HA) when they had a value equal to or greater than the mentioned cut-off point.)
  • OAE (LA when they had a frequency below 5.97 times, HA when they had a frequency equal to or greater than the mentioned cut-off point.)
  • C (LA when they had a frequency below 39.05 times, HA when they had a frequency equal to or greater than the mentioned cut-off point.)
  • TR (LA when they had a value below 18.22 s, HA when they had a value equal to or greater than the mentioned cut-off point.)
  • TG (LA when they had a value below 20.27 s, HA when they had a value equal to or greater than the mentioned cut-off point.)
The second model contemplated a categorization proposed by the Weka software when the numerical variables were entered; these were composed of the following cut-off points in the variables:
  • TOA (LA when they had a value below 79.69 s, moderate activity (MA) when they had a value equal to or greater than 79.79 and less than 172.38 s, HA when they had a value equal to or greater than 172.38 s.)
  • PEOA (LA when they had a value below 0.639, HA when they had a frequency equal to or greater than the cut-off point.)
  • AIn (LA when they had a value below 0.376, MA when they had a value equal to or greater than 0.367 and less than 0.531, HA when they had a value equal to or greater than 0.531.)
  • TR (LA when they had a value below 11.72 s, HA when they had a value equal to or greater than the cut-off point.)
  • TG (LA when they had a value below 12.21 s, HA when they had a value equal to or greater than the mentioned cut-off point.)

3. Results

3.1. Regression Trees

In the first adjusted model, we identified that the variable of greatest relevance was the anxiety index (AIn). Values below 0.3525, combined with fewer than 9.5 open-arm entries (OAE), predict a time spent in the open arms of 193.90 s. On the other hand, a number greater than 9.5 OAE predicts a value of 225.83 s in open arms. When the index is greater than or equal to 0.3525 and less than 0.4306, we must consider the percentage employed in the open arms (PEOA), where having a value below 0.68, the model predicts a time in open arms of 174.44 s. Otherwise, when PEOA is greater than or equal to 0.68, it predicts a time of 156 s in open arms. In general, we can say that values below 0.4915 in the anxiety index proposed by Cohen et al. [27] predict times between 130.88 and 225.83 s for the time spent in the open arms (Figure 1).
Conversely, when the anxiety index is greater than or equal to 0.4915 and less than 0.5305, the exposure time to the open arms is predicted to be 98.06 s. In contrast, when the anxiety index is greater than or equal to 0.5305, and there are 6.5 or more OAEs, the model predicts an open-arm time of 61.32 s. If the OAEs are less than 6.5 and the PEOA is less than 0.38, an estimated 36.46 s in the open arms is estimated. Finally, when the PEOA is greater than or equal to 0.38, the OAE is considered; if they are less than 3.5, a time of 25.52 s is predicted, while if they are greater than or equal to 3.5, a time of 20.34 s in open arms is predicted (Figure 1).
In another way, in the second model, when the group variable is added, the branching on the left remains the same as in the previous setting. However, the right branching changes, starting with the group’s presence. For the ALOP1 group, a time of 98.06 s is predicted. Inversely, when they belong to the VEH or ALOP05 group, we must consider other parameters to estimate the time in the open arms. If the OAE is greater than or equal to 6.5, a time of 61.32 s in open arms is estimated. If the OAE is less than 6.5, the PEOA must be taken into account, where values below 0.38 predict a time of 36.46 s in the open arms; when the PEOA is greater than or equal to 0.38, times between 20.34 and 25.52 s are estimated to be spent in the open arms (Figure 1).

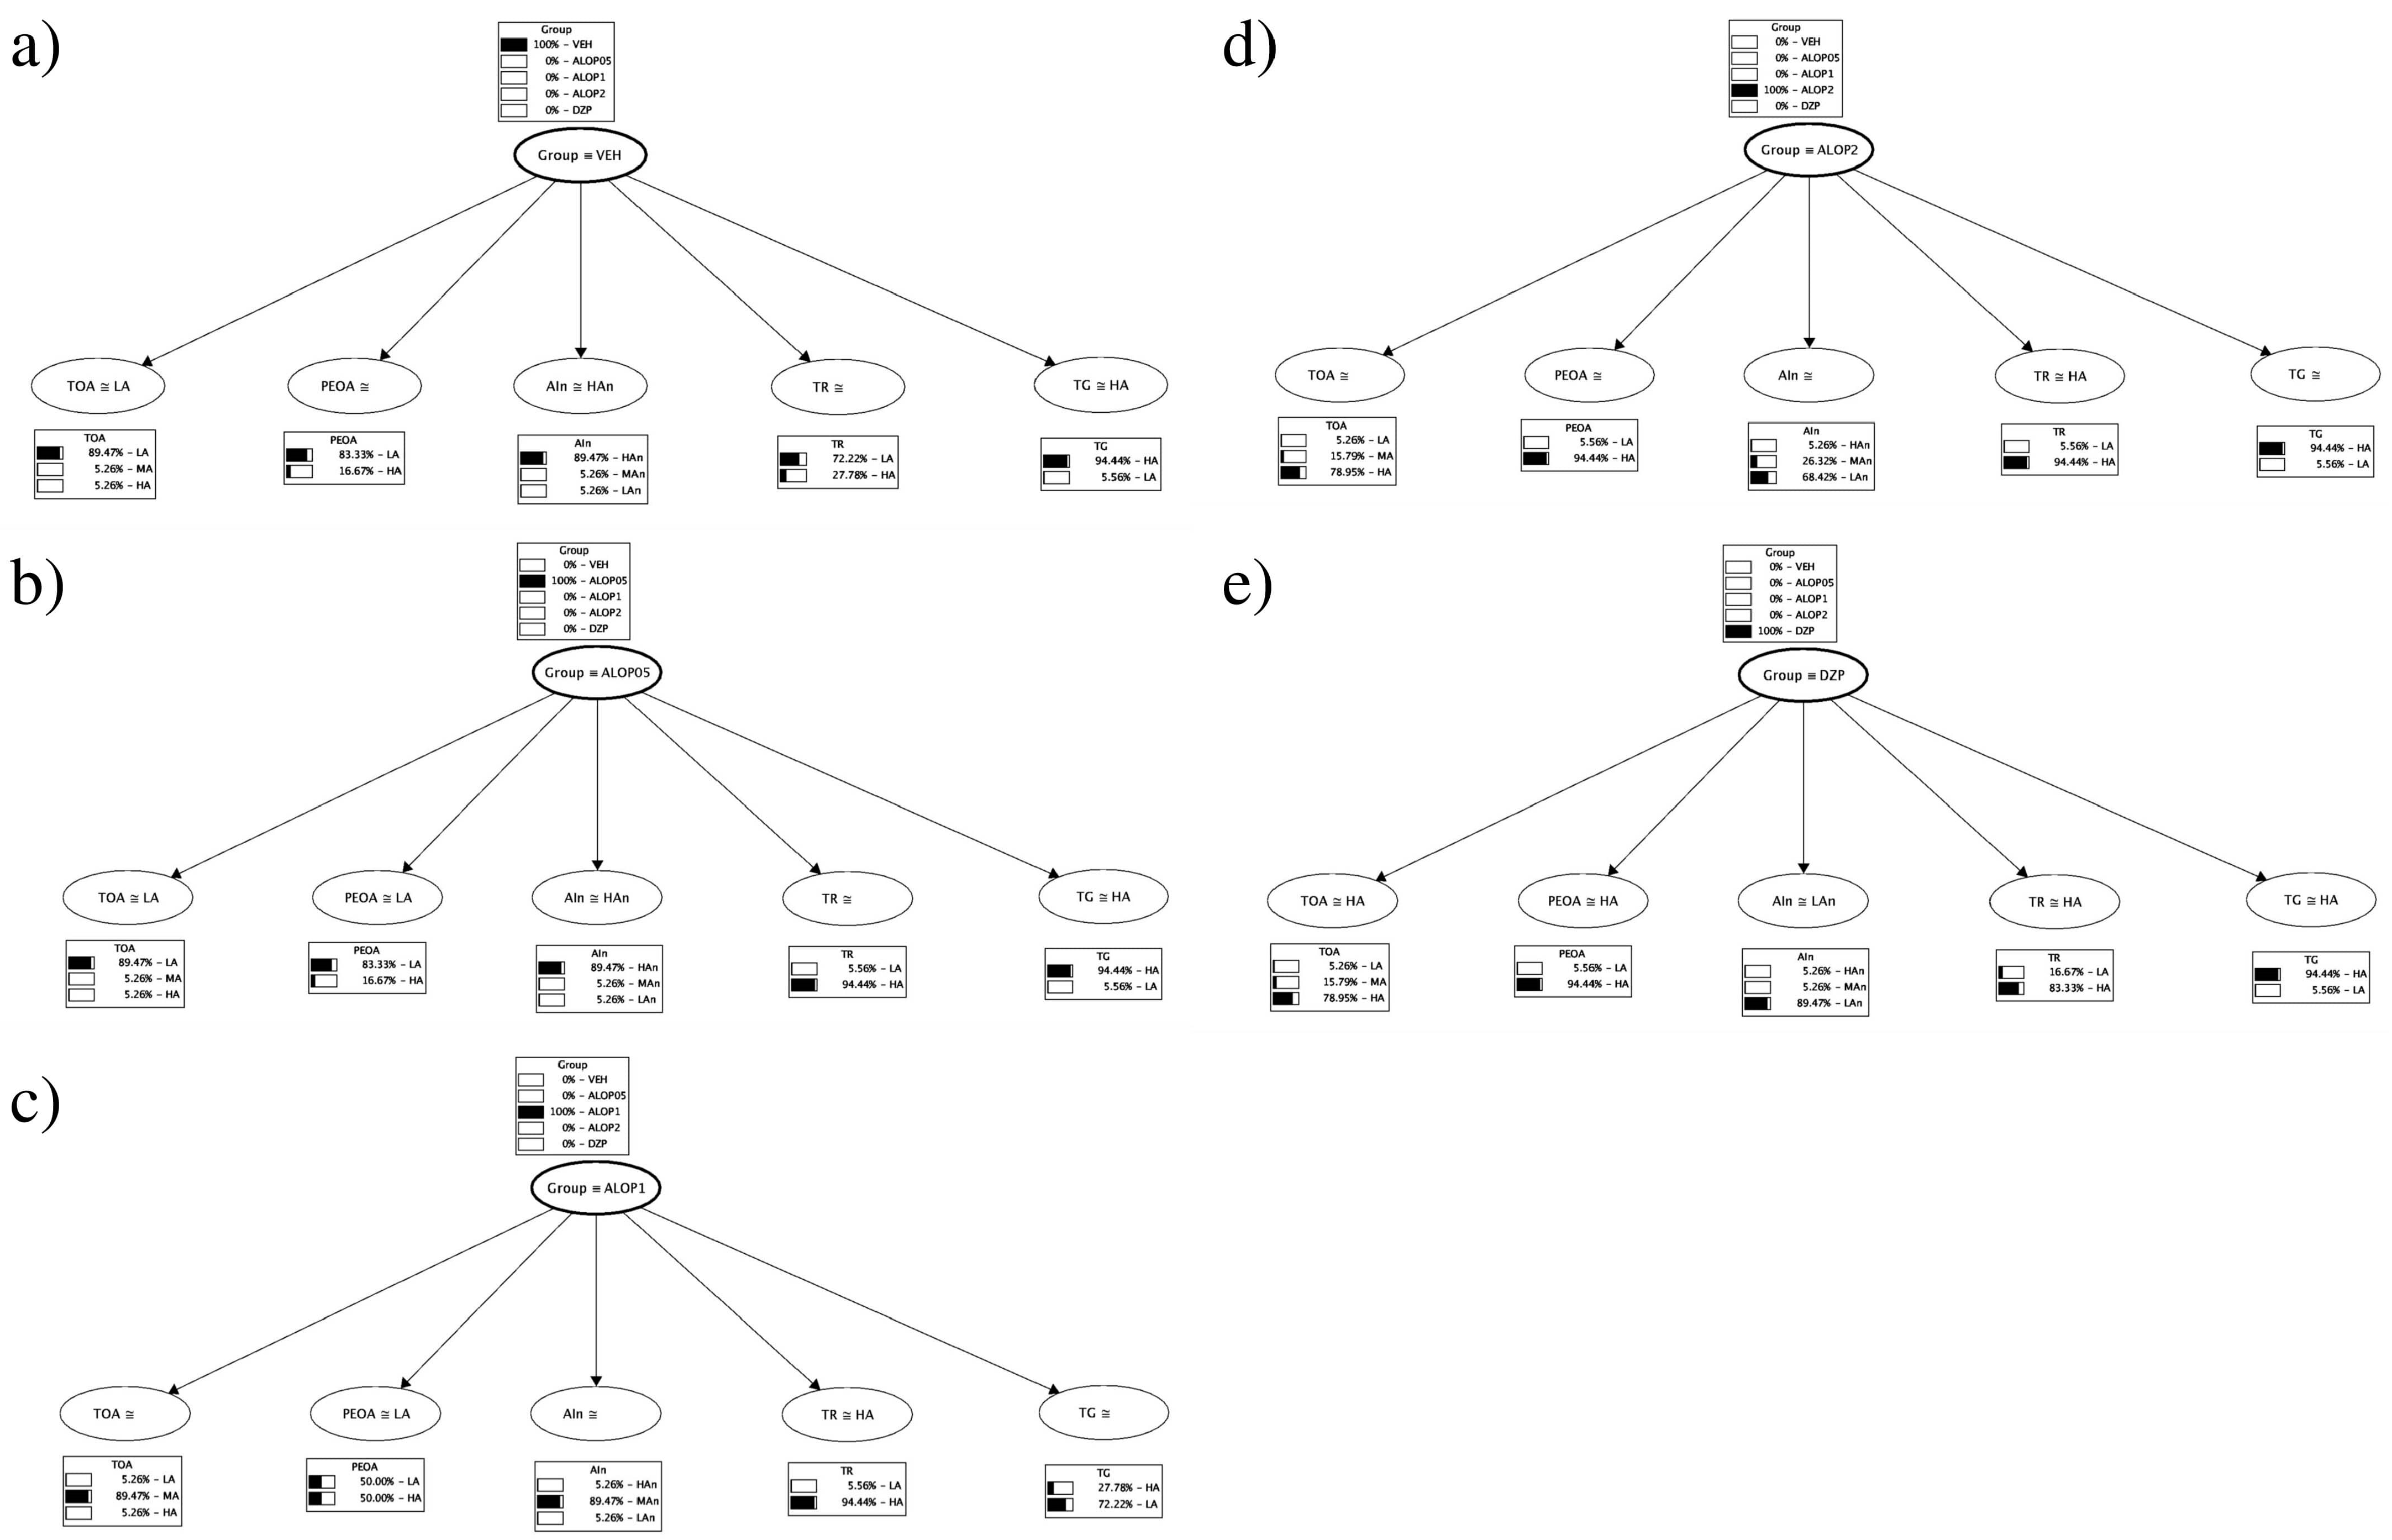
3.2. Bayesian Network

In the first model generated, categorized by mean values, when predicting the probabilities of the behavioral variables for the vehicle group (VEH), it is observed that low activities in all the variables characterize it. The time spent in the open arms (TOA) was 94.44% and, in turn, 83.55% in OAE; this also triggered a 66.82% probability of time spent in vertical behavior (TR), resulting in a 61.11% probability of time spent in grooming (Figure 2a). The ALOP05 group shows very similar values to the VEH group, with the difference that the grooming activity (TG) has a 61.11% of being high (Figure 2b).
As for the positive control group, diazepam (DZP) presents higher probabilities of having high activity in variables such as TOA (94.44%), OAE (83.33%), and TG (61.11%), while TR has a similar probability among the types of activity (Figure 2e). The ALOP2 treatment is similar to DZP in TOA, OAE, and TR, although in TG, this treatment does not show differences between activity types (Figure 2d). Finally, the ALOP1 treatment follows a similar trend to the DZP and ALOP2 groups, but in TG, it suffers a modification in the probability, with 94.44% presenting a low activity (Figure 2c).
When evaluating the variables categorized by the Weka software, it is identified that the VEH group presents high probabilities of having a low activity in TOA (89.47%), PEOA (83.33%), and TR (72.22%), as well as a high activity in TG with 94.44%, and a high AIn with 89.47% (Figure 3a). Similar to the previous model, the ALOP05 group has similar probabilities to the VEH group, except in TR, where it presents high activity with 94.44% (Figure 2b). The ALOP1 group continues to show similar trends to the previous model, with higher probabilities of moderate activity in TOA and AIn (89.47% in both cases) and low activity in TG with 72.22% (Figure 3c). Meanwhile, the ALOP2 and DZP groups share the incidences of their variables, slightly changing some probabilities but showing similar effects on subjects’ behavior (Figure 3d,e).

4. Discussion

The present study determined the implementation of the regression trees and Bayesian networks in a practical BNP case to predict the values of the variable time spent in the open arms of the elevated plus-maze (EPM), one of the most used variables to determine an effect on anxiety in rodents. In addition, we sought to identify treatments through the interaction of variables obtained from the analysis of preclinical behavior using the BNP. This case study is a continuation of what was reported by our work group [29], where we evaluated three doses of allopregnanolone compared against a vehicle group and a positive control group with diazepam.
In our study, the application of regression trees allowed us to demonstrate the cut-off points to differentiate an anxiolytic effect from an anxiogenic one through the prediction of open-arm times. The most relevant variable was the anxiety index (AIn), a quotient that considers the total number of entries, the entries to open arms, the total time of the test, and the time spent in open arms. This index has been proposed by Cohen and collaborators [27], who established that values close to 1 indicate an anxiogenic effect, while values close to 0 evidence an anxiolytic effect. Our analysis showed that values below 0.4915 in the AIn predicted times between 130.88 and 225.83 s in the open arms. Combining different characteristics of the variables percentage (PEOA) and entries (OAE) to the open arms. This coincides with multiple studies in the BNP literature since the validation of the EPM, where longer times in open arms had been established [26].
An example is the study by Contreras and collaborators [30], where they evaluated the administration of amniotic fluid and its component fatty acids, finding an anxiolytic effect with myristic acid, reflected in a lower AIn value and times of approximately 170 s in the open arms, like the positive control with diazepam at 2 mg/kg. Another similar example is reported by García-Ríos and collaborators [31], where they administered an aqueous extract of leaves of Justicia spicigera (muicle) in the female rats, observing a decrease in AIn at a dose of 12 mg/kg of the extract, specifically in the pro-estrus–estrus phase, with times of approximately 150 s in open arms, which is congruent with our results. Moreover, when the anxiogenic effects were determined, there was an increase in the AIn and a decrease in the time spent in the open arms. Our model obtained values above 0.4915 in AIn, combined with variables such as group, OAE, and PEOA, predicting times between 20.34 and 98.06 s in the open arms. Studies with space restriction in rats have shown a higher AIn, with times of approximately 50 s in the open arms and fewer entries to the open arms [32]. These parameters, interpreted in a univariate manner in that research, coincide with the variables that our model uses to predict the open-arm time, with the advantage of observing how the variables are related even from different behavioral tests.
Regression trees have emerged as an easy-to-interpret tool for the interaction of relevant variables and the characterization of treatment parameters in behavioral neuropharmacology, where it is crucial to rule out any alterations not visible in the univariate analysis of behavioral variables. This tool is easily implementable with categorical and quantitative variables and captures non-linear relationships between the independent and dependent variables, allowing them to model more complex relationships [33].
On the other hand, the Bayesian networks (BN) have become a crucial tool in scientific research and decision-making due to their ability to model probabilistic dependence relationships between variables intuitively and accurately. This allows for the integration of quantitative and qualitative data, capturing the uncertainty inherent to complex processes [34]. In NBP, these networks facilitate identifying and understanding interactions between multiple behavioral and biological variables. In addition, they provide a clear visualization of causal relationships and dynamic updating of probabilities. Our results demonstrate characteristic patterns of treatment-dependent behavior. In the fitted models, the ALOP05 group was identified as having no potential anxiolytic effect, corroborated by the similarity with the vehicle group. Furthermore, it was found that ALOP2 treatment promotes parameters similar to those observed for 2 mg diazepam treatment, concluding an anxiolytic type of effect under a multivariate interaction that enriches the interpretation of such effect. Additionally, this technique allows us to glimpse the changes in allopregnanolone doses, visualizing the dose–response variations reflected through probabilities.
Frequently, BNP studies use significant variables to conclude a pharmacological effect in the preclinical part, i.e., to detect a difference in anxiety patterns without modifying motor activity. This approach is correct within the established methodology, providing the basis for many current drugs. For example, the anxiolytic effect of Salvia miltiorrhiza bunge (Danshen) extract through the EPM model and Hole–Board test [35]. Similarly, the angiogenic effect of caffeine has been studied through the light/dark models and the EPM [36], even detecting beneficial effects on lead exposure through taurine [37]. However, it is essential to consider the variables that provide univariate evidence of an impact on anxiety and the interaction between them. Even in clinical practice, multivariate analyses identify associations supporting clinical decision-making [38]. The Bayesian networks are gaining relevance in neuroscience for their contributions to detecting causal relationships, such as in amyotrophic lateral sclerosis (ALS) [39], Parkinson’s prediction [40], and multiple diseases [41]. In BNP, they have been used to predict the interaction of treatments for Alzheimer’s disease [42].
Although decision trees have not been used extensively in neuropharmacology, their application in medicine is practical for predicting values associated with diseases such as pulmonary and tuberculosis [43]. In this context, animal and human models have significant advantages and disadvantages. Animal models allow for precise control over experimental variables and facilitate invasive manipulations, which helps study specific biological mechanisms and assess drugs’ impact throughout different life cycle stages. However, the translational relevance of these findings may be limited due to physiological differences between species, and animal behavior may not accurately reflect human behavior under natural conditions [44]. In contrast, human studies provide directly applicable results and allow detailed assessment of side effects, toxicities, and cognitive insights, offering a more complete picture of pharmacology in real-world settings [45]. Using these tools makes it more feasible in the medium and long term to comply with the 3 R’s proposed by Russel for using and managing animals in experimentation [46].
Nevertheless, due to strict ethical regulations that may restrict experimental design and increase both costs and research time, integrating both approaches may provide a more comprehensive understanding of the impact of drugs on the nervous system [46]. In this way, animal studies can benefit significantly from supervised machine learning analysis. These advanced approaches enable thorough analysis of experimental data, facilitating the identification of complex patterns and accurate prediction of pharmacological effects. Supervised machine learning optimizes experimental design and reduces the need for invasive manipulations but also improves the extrapolation of results to human clinical settings, thereby increasing the relevance and applicability of preclinical studies.
In rat studies, these networks have been used to test psychophysical responses through spiking activity in the sensorimotor cortex [47] and to detect obstructive apnea episodes through electrocardiogram measurement [48]. More studies need to be using these tools to evaluate behavior in animal models. Therefore, the contribution of the present investigation is to promote the use of Bayesian networks not as a replacement for the methodology established in the BNP but as a complement that enriches the conclusions on the effects of treatments on behavior. In this way, changes not perceived in the traditional analysis are addressed, evidencing interactions or behavioral patterns that should be detected to better understand the treatment, both in behavioral aspects and brain mechanisms. Which we observe and summarize in this research (Table 2).

5. Conclusions

This study highlights the effectiveness of regression trees and Bayesian networks in behavioral neuropharmacology. Implementing these methodologies allows us to accurately differentiate between anxiolytic and anxiogenic effects and reveals the complex interaction of behavioral and biological variables, significantly enriching the interpretation of the results. Our findings indicate that the anxiety index (AIn) is a robust predictor of time spent in open arms and that its combination with other variables, such as the percentage of entries to open arms (PEOA) and the number of entries (OAE), allows for an accurate and revealing modeling of the anxiolytic effects of the treatments evaluated. Furthermore, the ability of BNs to integrate quantitative and qualitative data allowed for the probabilities to be dynamically evidenced, offering a powerful tool and providing a clear visualization of the causal relationships for behavioral neuropharmacology. The identification that allopregnanolone (ALOP2) treatment emulates diazepam’s effects underscores our multivariate approach’s validity. This study supports the relevance of traditional methods and argues for including advanced techniques, such as Bayesian networks, to enrich the understanding of pharmacological effects and their application in preclinical research.
Finally, integrating these methodological approaches may revolutionize the evaluation of treatments in animal models, offering new insights and greater precision in interpreting complex behavioral data and laying the groundwork for future research in behavioral neuroscience and neuropharmacology. In future work, we will continue to seek the application of tools that can allow us to compare characteristic behavioral patterns of the treatments used in behavioral neuropharmacology, allowing us to explain with greater specificity the brain mechanisms involved in each behavioral pattern.

Author Contributions

Conceptualization, S.H.-M. and J.F.R.-L.; methodology, J.F.R.-L.; software, H.G.A.-M. and I.V.-M.; validation, I.V.-M., H.G.A.-M. and M.L.A.-G.; formal analysis, I.V.-M.; investigation, I.V.-M., J.F.R.-L. and R.F.-D.; resources, S.H.-M. and J.F.R.-L.; data curation, I.V.-M. and R.F.-D.; writing—original draft preparation, I.V.-M.; writing—review and editing, all authors; visualization, I.V.-M.; supervision, S.H.-M., J.F.R.-L., H.G.A.-M. and M.L.A.-G.; project administration, S.H.-M. and J.F.R.-L.; funding acquisition, S.H.-M. and J.F.R.-L. All authors have read and agreed to the published version of the manuscript.

Funding

This research received no external funding.

Data Availability Statement

The data will be available to the corresponding author upon request under reasonable justification.

Acknowledgments

Authors I.V.-M. (CVU: 628503) and R.F.-D. thank CONAHCyT for the postdoctoral fellowships awarded.

Conflicts of Interest

The authors declare no conflicts of interest.

References

  1. Kindt, M. A behavioural neuroscience perspective on the aetiology and treatment of anxiety disorders. Behav. Res. Ther. 2014, 62, 24–36. [Google Scholar] [CrossRef]
  2. Levitis, D.A.; Lidicker, W.Z., Jr.; Freund, G. Behavioural biologists do not agree on what constitutes behaviour. Anim. Behav. 2009, 78, 103–110. [Google Scholar] [CrossRef]
  3. Boutrel, B.; Koob, G.F. What keeps us awake: The neuropharmacology of stimulants and wakefulness promoting medications. Sleep 2004, 27, 1181–1194. [Google Scholar] [CrossRef] [PubMed]
  4. Mondoloni, S.; Durand-de Cuttoli, R.; Mourot, A. Cell-specific neuropharmacology. Trends Pharmacol. Sci. 2009, 40, 696–710. [Google Scholar] [CrossRef]
  5. Lattal, K.A.; Fernandez, E.J. Grounding applied animal behavior practices in the experimental analysis of behavior. J. Exp. Anal. Behav. 2022, 118, 186–207. [Google Scholar] [CrossRef] [PubMed]
  6. Bale, T.L.; Abel, T.; Akil, H.; Carlezon, W.A., Jr.; Moghaddam, B.; Nestler, E.J.; Ressler, K.J.; Thompson, S.M. The critical importance of basic animal research for neuropsychiatric disorders. Neuropsychopharmacol 2019, 44, 1349–1353. [Google Scholar] [CrossRef] [PubMed]
  7. Fernandez, E.J.; Martin, A.L. Animal training, environmental enrichment, and animal welfare: A history of behavior analysis in zoos. J. Zool. Bot. Gard. 2021, 2, 531–543. [Google Scholar] [CrossRef]
  8. Friedman, S.G.; Stringfield, C.E.; Desmarchelier, M.R. Animal Behavior and Learning: Support from Applied Behavior Analysis. Vet. Clin. N. Am. Exot. Anim. Prac. 2021, 24, 1–16. [Google Scholar] [CrossRef]
  9. Montgomery, D. Diseño y Análisis de Experimentos, 4th ed.; Limusa: Mexico City, Mexico, 2015; pp. 60–119. [Google Scholar]
  10. Mitchell, T. Machine Learning; McGraw Hill: New York, NY, USA, 1997; pp. 52–78, 154–199. [Google Scholar]
  11. Angra, S.; Ahuja, S. Machine learning and its applications: A review. In Proceedings of the 2017 International Conference on Big Data Analytics and Computational Intelligence, ICBDAC, Chirala, India, 23–25 March 2017; IEEE: New York, NY, USA, 2017; pp. 57–60. [Google Scholar]
  12. Doyle, O.M.; Mehta, M.A.; Brammer, M.J. The role of machine learning in neuroimaging for drug discovery and development. Psychopharmacology 2015, 232, 4179–4189. [Google Scholar] [CrossRef]
  13. Alexandrov, V.; Brunner, D.; Hanania, T.; Leahy, E. High-throughput analysis of behavior for drug discovery. Eur. J. Pharmacol 2015, 750, 82–89. [Google Scholar] [CrossRef]
  14. Mayer, B.; Kringel, D.; Lötsch, J. Artificial intelligence and machine learning in clinical pharmacological research. Expert. Rev. Clin. Pharmacol. 2024, 17, 79–91. [Google Scholar] [CrossRef] [PubMed]
  15. Yu, Z.E.; Kuo, C.C.; Chou, C.H.; Chang, F. A machine learning approach to classify sleep stages of rats. In Proceedings of the 9th WSEAS International Conference on Signal, Speech and Image Processing, and 9th WSEAS International Conference on Multimedia, Internet & Video Technologies, Budapest, Hungary, 3–5 September 2009; pp. 120–125. [Google Scholar]
  16. Goodwin, N.L.; Nilsson, S.R.; Golden, S.A. Rage Against the Machine: Advancing the study of aggression ethology via machine learning. Psychopharmacology 2020, 237, 2569–2588. [Google Scholar] [CrossRef] [PubMed]
  17. Fernández-Demeneghi, R.; Rodríguez-Landa, J.F.; Guzmán-Gerónimo, R.I.; Acosta-Mesa, H.G.; Meza-Alvarado, E.; Vargas-Moreno, I.; Herrera-Meza, S. Effect of blackberry juice (Rubus fruticosus L.) on anxiety-like behaviour in Wistar rats. Int. J. Food Sci. Nutr. 2019, 70, 856–867. [Google Scholar] [CrossRef]
  18. Vargas-Moreno, I.; Avendaño-Garrdo, M.L.; Acosta-Mesa, H.G.; Fernández-Demeneghi, R.; Rodríguez-Landa, J.F.; Herrera-Meza, S. Application of Supervised Machine Learning Models for the Identification of the Anxiolytic-like Effect Produced by Progesterone in Wistar Rats. In Proceedings of the 2021 IEEE International Autumn Meeting on Power, Electronics and Computing (ROPEC), Ixtapa, Mexico, 10–12 November 2021; Volume 5, pp. 1–6. [Google Scholar]
  19. Vargas-Moreno, I.; Rodríguez-Landa, J.F.; Acosta-Mesa, H.G.; Fernández-Demeneghi, R.; Oliart-Ros, R.; Baltazar, D.H.; Herrera-Meza, S. Effects of Sterculia Apetala Seed Oil on Anxiety-like Behavior and Neuronal Cells in the Hippocampus in Rats. J. Food Nutr. Res. 2023, 11, 211–222. [Google Scholar] [CrossRef]
  20. Lewis, R.J. An introduction to classification and regression tree (CART) analysis. In Annual Meeting of the Society for Academic Emergency Medicine in San Francisco; Department of Emergency Medicine Harbor-UCLA Medical Center Torrance: San Francisco, CA, USA, 2000; Volume 14, pp. 1–14. [Google Scholar]
  21. Loh, W.Y. Classification and regression trees. Data Min. Knowl. Discov. 2011, 1, 14–23. [Google Scholar] [CrossRef]
  22. Heckerman, D. Bayesian networks for data mining. Data Min. Knowl. Discov. 1997, 1, 79–119. [Google Scholar] [CrossRef]
  23. Darwiche, A. Bayesian networks. Found. Artif. Intell. 2008, 3, 467–509. [Google Scholar]
  24. NOM-062-ZOO-1999; Norma Oficial Mexicana. Especificaciones Técnicas para la Producción, Cuidado y Uso de los Animales de Laboratorio. Secretaría de Agricultura, Ganadería, Desarrollo Rural, Pesca y Alimentación: México City, Mexico, 1999.
  25. Institute of Laboratory Animal Resources (US); Committee on Care. Use of Laboratory Animals: Guide for the Care and Use of Laboratory Animals (No. 86); US Department of Health and Human Services, Public Health Service, NIH: Bethesda, MD, USA, 1986.
  26. Pellow, S.; Chopin, P.; File, S.E.; Briley, M. Validation of open: Closed arm entries in an elevated plus-maze as a measure of anxiety in the rat. J. Neurosci. Methods 1985, 14, 149–167. [Google Scholar] [CrossRef]
  27. Cohen, H.; Matar, M.A.; Joseph, Z. Animal models of post-traumatic stress disorder. Curr. Protoc. Neurosci. 2013, 64, 9–45. [Google Scholar] [CrossRef]
  28. Hall, C.S. Emotional behavior in the rat. I. Defecation and urination as measures of individual differences in emotionality. J. Comparat. Psychol. 1934, 18, 385. [Google Scholar] [CrossRef]
  29. Vargas-Moreno, I.; Acosta-Mesa, H.G.; Rodríguez-Landa, J.F.; Avendaño-Garido, M.L.; Herrera-Meza, S. Computational Learning in Behavioral Neuropharmacology. In Mexican International Conference on Artificial Intelligence; Springer Nature: Cham, Switzerland, 2023; pp. 422–431. [Google Scholar]
  30. Contreras, C.M.; Rodríguez-Landa, J.F.; García-Ríos, R.I.; Cueto-Escobedo, J.; Guillen-Ruiz, G.; Bernal-Morales, B. Myristic acid produces anxiolytic-like effects in Wistar rats in the elevated plus maze. BioMed Res. Int. 2014, 2014, 492141. [Google Scholar] [CrossRef]
  31. García-Ríos, R.I.; Mora-Pérez, A.; González-Torres, D.; de Jesús Carpio-Reyes, R.; Soria-Fregozo, C. Anxiolytic-like effect of the aqueous extract of Justicia spicigera leaves on female rats: A comparison to diazepam. Phytomedicine 2019, 55, 9–13. [Google Scholar] [CrossRef] [PubMed]
  32. Moreno-Martínez, S.; Tendilla-Beltrán, H.; Sandoval, V.; Flores, G.; Terrón, J.A. Chronic restraint stress induces anxiety-like behavior and remodeling of dendritic spines in the central nucleus of the amygdala. Behav. Brain Res. 2022, 416, 113523. [Google Scholar] [CrossRef]
  33. Loh, W.Y. Classification and regression trees. Wiley interdisciplinary reviews: Data mining and knowledge discovery. WIREs Data Min. Knowl. Discov. 2011, 1, 14–23. [Google Scholar] [CrossRef]
  34. Chen, S.H.; Pollino, C.A. Good practice in Bayesian network modelling. Environ. Model. Soft. 2012, 37, 134–145. [Google Scholar] [CrossRef]
  35. Lin, Y.S.; Peng, W.H.; Shih, M.F.; Cherng, J.Y. Anxiolytic effect of an extract of Salvia miltiorrhiza Bunge (Danshen) in mice. J. Ethnopharmacol. 2021, 264, 113285. [Google Scholar] [CrossRef]
  36. Guillén-Ruiz, G.; Cueto-Escobedo, J.; Hernández-López, F.; Rivera-Aburto, L.E.; Herrera-Huerta, E.V.; Rodríguez-Landa, J.F. Estrous cycle modulates the anxiogenic effects of caffeine in the elevated plus maze and light/dark box in female rats. Behav. Brain Res. 2021, 413, 113469. [Google Scholar] [CrossRef] [PubMed]
  37. Neuwirth, L.S.; Emenike, B.U.; Cruz, G.B.; Cabañas, E.; Vasquez, M.A.; Joseph, J.N.; Ayaz, Z.; Mian, M.; Ali, M.M.; Clarke, E.G.; et al. Taurine-derived compounds produce anxiolytic effects in rats following developmental lead exposure. In Taurine 12: A Conditionally Essential Amino Acid; Springer International Publishing: Berlin/Heidelberg, Germany, 2022; pp. 445–460. [Google Scholar]
  38. Yet, B.; Perkins, Z.B.; Rasmussen, T.E.; Tai, N.R.; Marsh, D.W.R. Combining data and meta-analysis to build Bayesian networks for clinical decision support. J. Biomed. 2014, 52, 373–385. [Google Scholar] [CrossRef] [PubMed]
  39. Karaboga, H.A.; Gunel, A.; Korkut, S.V.; Demir, I.; Celik, R. Bayesian network as a decision tool for predicting ALS disease. Brain Sci. 2021, 11, 150. [Google Scholar] [CrossRef]
  40. Morales, D.A.; Vives-Gilabert, Y.; Gómez-Ansón, B.; Bengoetxea, E.; Larrañaga, P.; Bielza, C.; Pagonabarraga, J.; Kulisevsky, J.; Corcuera-Solano, I.; Delfino, M. Predicting dementia development in Parkinson’s disease using Bayesian network classifiers. Psychiatry Res. Neuroimaging 2013, 213, 92–98. [Google Scholar] [CrossRef]
  41. Langarizadeh, M.; Moghbeli, F. Applying naive bayesian networks to disease prediction: A systematic review. Acta Inform. Med. 2016, 24, 364–369. [Google Scholar] [CrossRef] [PubMed]
  42. Zhang, T.; Liu, N.; Cao, H.; Wei, W.; Ma, L.; Li, H. Different doses of pharmacological treatments for mild to moderate Alzheimer’s disease: A bayesian network meta-analysis. Front. Pharmacol. 2020, 11, 778. [Google Scholar] [CrossRef] [PubMed]
  43. Aguiar, F.S.; Almeida, L.L.; Ruffino-Netto, A.; Kritski, A.L.; Mello, F.C.; Werneck, G.L. Classification and regression tree (CART) model to predict pulmonary tuberculosis in hospitalized patients. BMC Pulm. Med. 2012, 12, 40. [Google Scholar] [CrossRef]
  44. Cenci, M.A.; Whishaw, I.Q.; Schallert, T. Animal models of neurological deficits: How relevant is the rat? Nat. Rev. Neurosci. 2002, 3, 574–579. [Google Scholar] [CrossRef]
  45. McGonigle, P.; Ruggeri, B. Animal models of human disease: Challenges in enabling translation. Biochem. Pharmacol. 2014, 87, 162–171. [Google Scholar] [CrossRef] [PubMed]
  46. Tannenbaum, J.; Bennett, B.T. Russell and Burch’s 3Rs then and now: The need for clarity in definition and purpose. J. Am. Assoc. Lab. Anim. Sci. 2015, 54, 120–132. [Google Scholar]
  47. Öztürk, S.; Devecioğlu, İ.; Güçlü, B. Bayesian prediction of psychophysical detection responses from spike activity in the rat sensorimotor cortex. J. Comput. Neurosci. 2023, 51, 207–222. [Google Scholar] [CrossRef]
  48. Romero, D.; Jané, R. Detecting obstructive apnea episodes using dynamic bayesian networks and ECG-based time-series. In Proceedings of the 2022 44th Annual International Conference of the IEEE Engineering in Medicine & Biology Society (EMBC), Glasgow, UK, 11–15 July 2022; IEEE: New York, NY, USA, 2022; pp. 3273–3276. [Google Scholar]
Figure 1. Regression tree with the variables obtained from the behavioral tests, predicting the time spent in open arms. (AIn: anxiety index; OAE: open-arm entries; PEOA: percentage employed in open arms; VEH: vehicle; ALOP05: allopregnanolone dose of 0.05 mg/kg; ALOP1: allopregnanolone dose of 1 mg/kg).
Mca 29 00076 g001
Figure 2. Bayesian networks with variables categorized through the arithmetic mean of the behavioral variables, the probabilities of the treatments are shown: (a) VEH, (b) ALOP05, (c) ALOP1, (d) ALOP2, (e) DZP. (VEH: vehicle; ALOP05: allopregnanolone dose of 0.05 mg/kg; ALOP1: allopregnanolone dose of 1 mg/kg; ALOP2: allopregnanolone dose of 2 mg/kg; DZP: diazepam dose of 2 mg/kg; TOA: time spent in open arms; OAE: open-arm entries; TR: time spent in rearing; TG: time spent in grooming; C: crossing; LA: low activity; HA: high activity).
Mca 29 00076 g002
Figure 3. Bayesian networks with categorized variables through the Weka software of the behavioral variables, the probabilities of the treatments are shown: (a) VEH, (b) ALOP05, (c) ALOP1, (d) ALOP2, (e) DZP. (VEH: vehicle; ALOP05: allopregnanolone dose of 0.05 mg/kg; ALOP1: allopregnanolone dose of 1 mg/kg; ALOP2: allopregnanolone dose of 2 mg/kg; DZP: diazepam dose of 2 mg/kg; TOA: time spent in open arms; OAE: open-arm entries; TR: time spent in rearing; TG: time spent in grooming; C: crossing; LA: low activity; MA: moderate activity HA: high activity).
Mca 29 00076 g003
Table 1. Characteristics of the sample and the experimental groups.
Experimental subjects
StrainWistar Rats
GenderMale
Weight250 and 300 g
Experimental conditions
Temperature25 ± 1 °C
Light cycleInvested 12/12 h
Experimental groups
VEHVehicleSterile water
ALOP05Allopregnanolone0.5 mg/kg
ALOP11 mg/kg
ALOP22 mg/kg
DZPDiazepam2 mg/kg
Table 2. Benefits of machine learning algorithms over conventional methods.
Statistical MethodsMachine Learning Models
Univariate analysis.
Conclusions linked by significant statistics.
Detection of pharmacological effects.
Regression treesRegression trees proved to be an effective tool for predicting the variable “time in open arms” values in the elevated arm maze. It established significant relationships with multiple variables of the same behavioral test and the open field.

This methodology also facilitated identifying groups with anxiolytic effects through branching analysis, making it possible to clearly distinguish prolonged times corresponding to the anxiolytic impacts.

These results underscore the value of regression trees as a robust statistical technique for assessing anxiety-associated behaviors and detecting relevant behavioral patterns in preclinical studies.
Bayesian networksBayesian networks made it possible to quantify the probabilities of various behaviors about the treatments administered (vehicle and diazepam). They facilitated the identification of similar behavioral patterns between different doses of allopregnanolone.

It showed that some variables (crossing) might not be determinant in the characterization of the treatments.

The categorization of behavioral variables provided a solid mathematical foundation for classifying regular activity, hyperactivity, or hypoactivity, providing valuable quantitative support for evaluation in behavioral neuropharmacology.

The Bayesian networks are a robust tool for modeling and analyzing complex behavioral responses to pharmacological treatments in anxiety models.
Disclaimer/Publisher’s Note: The statements, opinions and data contained in all publications are solely those of the individual author(s) and contributor(s) and not of MDPI and/or the editor(s). MDPI and/or the editor(s) disclaim responsibility for any injury to people or property resulting from any ideas, methods, instructions or products referred to in the content.

