Abstract
This article studies the effective design of content distribution networks over cloud computing platforms. This problem is relevant nowadays to provide fast and reliable access to content on the internet. A bio-inspired evolutionary multiobjective optimization approach is applied as a viable alternative to solve realistic problem instances where exact optimization methods are not applicable. Ad hoc representation and search operators are applied to optimize relevant metrics from the point of view of both system administrators and users. In the evaluation of problem instances built using real data, the evolutionary multiobjective optimization approach was able to compute more accurate solutions in terms of cost and quality of service when compared to the exact resolution method. The obtained results represent an improvement over greedy heuristics from 47.6% to 93.3% in terms of cost while maintaining competitive quality of service. In addition, the computed solutions had different tradeoffs between the problem objectives. This can provide different options for content distribution network design, allowing for a fast configuration that fulfills specific quality of service demands.
1. Introduction
A reliable internet connection has become an essential service for modern societies, enabling a growing number of daily activities. Internet providers face challenges not only in extending services to an increasing number of new users but also in meeting the demand for low-latency performance [1]. Content Distribution Networks (CDNs) were developed in response to the need for efficient internet service. A CDN is a system of distributed servers designed to deliver web content efficiently to users, who are served on a proximity basis [2].
CDN providers usually deploy servers as close to clients as possible in order to reduce latency and route requests so as to efficiently deliver content to end users [3]. Cloud-based CDNs rely on the Infrastructure-as-a-Service (IaaS) model, allowing CDN providers to lease infrastructure. The hardware of the servers is virtualized on the cloud, allowing the assigned resources to be adjusted according to computational needs. IaaS providers have data centers distributed around the world and provide storage, Virtual Machines (VMs), and network infrastructure to CDN providers. Cloud CDN providers maintain competitive Quality of Service (QoS), benefiting from the adaptability of cloud resources. However, implementing a cloud CDN presents the significant challenge of provisioning the necessary resources within the cloud to meet user demand while providing good QoS with an affordable cost.
The cloud broker is a business agent developed to act as an intermediary between users and cloud service providers while assisting users to find the best providers for their needs. Virtual brokers [4] represent a business model that handles the complex supply chain between content providers, IaaS providers, and users. A multi-tenancy approach is adopted to reduce costs by managing multiple content providers simultaneously, thereby leveraging discounted VM prices for large volumes. Resource-sharing strategies also enhance the QoS provided to users.
This article introduces an optimization model for finding strategies to design a cloud-based CDN by a virtual broker considering user demand, content providers, and IaaS providers. The model aims at simultaneously optimizing the cost for the virtual broker and the QoS provided to the users. Designing CDNs is an NP-hard problem, as it is a specific application of the combinatorial facility location problem [5]. Thus, to address this problem, a tailored Multiobjective Evolutionary Algorithm (MOEA) [6] is proposed using ad hoc solution representations and operators. The MOEA is compared to a set of three baseline heuristics and an exact solver based on a Mixed-Integer Linear Programming (MILP) model.
Experimental results on real-world instances demonstrate the effectiveness of the proposed bio-inspired multiobjective evolutionary approach. The MOEA was able to compute accurate and more diverse solutions than the exact solver for small problem instances, and the computed solutions significantly improved over greedy heuristics that optimize cost and QoS. The MOEA generated better Pareto fronts than greedy heuristics, which tended to concentrate on solutions with extreme objective values. MOEA computed significantly better results regarding the Relative Hypervolume (RHV) metric for multiobjective optimization, with an average improvement of 34.7%, as well as for the Empirical Attainment Surface (EAS) estimator. Improvements on the problem objectives ranged from 47.6% to 93.3% in terms of cost while maintaining very accurate QoS levels. The values provided by the EAS estimator also confirmed the superiority of the multiobjective evolutionary approach.
This problem was also studied in our previous work [7]. The current article presents the following new contributions: (i) an extended methodology applying specific search operators; (ii) a new set of realistic problem instances built using real information from internet and cloud providers; and (iii) a fully comprehensive experimental evaluation of the proposed MOEA approach, including a comparison with exact solutions and three baseline heuristics.
The rest of this article is organized as follows: Section 2 defines the cloud-based CDN problem, detailing its connection to cloud platforms and brokers, the mathematical formulation, and the QoS model; Section 3 reviews the key related work in the literature; Section 4 introduces the MOEA designed for the cloud-based CDN problem, covering solution representation, algorithm structure and stages, evolutionary operators, and implementation details; Section 5 describes the baseline optimization methods used for comparison, including the three heuristic approaches and the exact solver; Section 6 presents the experimental validation of the proposed MOEA and baseline methods via testing on realistic instances; finally, Section 7 highlights the main conclusions and outlines directions for future research.
2. The Cloud-Based CDN Design Problem
This section presents the cloud-based CDN design problem, including a conceptual description of the problem along with its main features and the mathematical formulation.
2.1. Cloud Platforms and Virtual Brokers
A CDN is a distributed system of servers hosted across multiple data centers on the internet. CDNs deliver online content, ensuring high availability and performance through efficient load balancing on servers and links. The geographic distribution of the servers on a CDN allows data to be served to users based on their geographic proximity to each server. However, it is prohibitively expensive for small content providers to compete on a large scale with conventional CDN service providers by implementing new data centers. Thus, the computing model based on cloud platforms [8] offers a cost-effective solution for small content providers based on a more efficient and dynamic allocation of resources.
Cloud platforms provide on-demand access to shared resources that are dynamically allocated and released [9], creating the perception of unlimited always-available resources for end users by automating allocation and scaling. If a cloud platform cannot meet resource demands, it can leverage additional resources from other platforms using the cloud bursting technique [10]. In a cloud-based CDN, it is possible to dynamically balance bandwidth, VMs, and storage resources based on content demand, resulting in reduced overall leasing costs while maintaining QoS for end users [11]. The cloud-based CDN must allow end users to access content shared by content providers and ensure that there is no interference between content providers. The previously-discussed IaaS business model in cloud platforms creates new opportunities for small content providers to use cost-effective and scalable CDNs without investing in the installation and maintenance of infrastructure; as such, there is a growing research trend around leveraging the advantages of developing cloud-based CDNs [12,13,14,15]. However, with the extension of cloud-based CDN, new managerial problems such as resource provisioning arise, representing a complex resource allocation problem [16].
To manage the diverse offerings of cloud service providers, a cloud broker acts as an intermediary between cloud service providers and cloud users [17]. The cloud broker assists users in identifying the providers that best meet their performance requirements, service level agreements, security, and costs. The cloud broker business model involves leasing VMs from various cloud service providers for extended periods in order to secure significant price discounts, allowing the cloud broker to offer VMs to cloud users on demand at a lower price than direct cloud service providers. The business model applied in this article considers a special type of cloud broker called a virtual broker, discussed in our previous publication [4]. A virtual broker focuses on minimizing the total cost of a cloud-based CDN built within IaaS provider data centers. It achieves this by enabling multiple content providers to share the cloud-based CDN while maintaining QoS for the end users who consume the content.
For two reasons, the virtual broker business model offers cost advantages for a cloud-based CDN used by multiple content providers when compared to a single-provider setup. The first is that IaaS service providers generally grant volume discounts when leasing resources on the same infrastructure. A cloud-based CDN with multiple content providers benefits from aggregating their collective resource demand, thereby qualifying for larger discounts. The second reason is that the virtual broker can maximize the utilization of reserved VM instances. These instances, which are more cost-effective when reserved for extended periods, can be shared among content providers based on fluctuating user demands, reducing reliance on more expensive on-demand VMs.
Figure 1 shows a diagram of how the virtual broker, content providers, IaaS service providers, and end users interact. Content providers contract the cloud-based CDN service offered by the virtual broker, which leases usage time and storage on VM instances from IaaS providers. End users then utilize the cloud-based CDN built by the virtual broker to consume the resources of the content providers. The virtual broker is responsible for managing and allocating resources to each content provider according to the demand of their end users. IaaS service providers grant discounts to the virtual broker for the volume of leased resources; in turn, the virtual broker is able to better utilize the usage time of the reserved VM instances by being able to use them with multiple content providers.
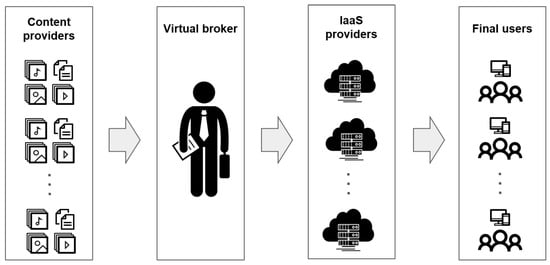
Figure 1.
Interaction between content providers, virtual broker, IaaS providers, and final users.
2.2. Conceptual Model
Given a set of content, content providers, available VMs and VM instances, and a set of geographical regions demanding content, the design of a cloud-based CDN requires addressing a complex combinatorial optimization problem. The problem involves simultaneously solving two planning tasks over a given planning horizon:
- Assigning content shared by different providers to instances of VMs available in data centers at each time interval.
- Determining which data center should be used to fulfill the demand for content at each time interval from users located in different geographical regions.
Both planning tasks must be solved in order to minimize the overall cost (includes the cost of renting VMs, storing content, and transferring data from VMs to the internet) while maximizing the QoS provided to users. CDNs have several characteristics that make this a complex decision problem. First, the unit costs per data of content usually differ between data centers; thus, the assignment of content to data centers must be carefully planned. Additionally, data centers may have VMs that can be rented for the whole planning horizon as well as VMs that can be rented on-demand for a specific time interval. Moreover, the QoS provided to users is influenced by the selection of data centers to serve their requests.
2.3. Mathematical Formulation
The mathematical formulation of the cloud-based CDN design problem is developed using the sets, parameters, and variables specified in Table 1.

Table 1.
Sets, parameters, and variables of the mathematical formulation.
Three cost functions related to the costs of the CDN are defined:
- 1.
- returns the cost of reserving and renting on-demand VM instances in data center .
- 2.
- returns the cost of storing content in data center through a cost function that returns the cost of transferring data from the data centers to the internet.
- 3.
- measures the inverse of the QoS provided to users.
Then, the objective functions of the cloud-CDN problem are defined as follows:
Equation (1a) proposes minimizing the overall cost of all the data centers in the CDN, while Equation (1b) proposes minimizing the inverse of the overall QoS provided to the users to guarantee maximization of the provided QoS (see the QoS model in the next subsection). The problem is bound by specific constraints. First, the demand for each content from each region and at each time interval must be fulfilled. A solution is only considered feasible if it satisfies the demand of every user. Second, a VM instance cannot host content from multiple providers at the same time. Third, the total content assigned to a VM must not exceed its processing capacity. Finally, a data center can only fulfill requests for content stored within it.
2.4. Quality of Service Based on the Round-Trip Time
Proposing a metric to capture the service level provided to users from each region by every data center is a challenging task. This article uses a QoS metric based on the Round-Trip Time (RTT), that is, the time required for a user to send a request and receive a response from a server. The RTT is closely related to the effective network distance between the end users and cloud servers, as shown in the comprehensive analysis by Landa et al. [18]. A lower RTT corresponds to a shorter effective distance between the user and the content server.
To measure QoS based on RTT, we used data from RIPE Atlas [19]. RIPE Atlas is a platform that enables measurement of network parameters on the internet using a distributed worldwide network of sensors. The data center regions were chosen from locations where Amazon provides its Elastic Compute Cloud EC2 service, which allows users to rent VMs for executing applications while charging per second of active server usage [20]. The user regions were identified as the regions with the largest populations demanding Amazon EC2 services.
RTT measurements were collected every 2 h over two periods in 2016 and 2017. The data were downloaded from RIPE Atlas and processed using Python (version 3.10) libraries. The processing involved several stages. First, the Kolmogorov–Smirnov test [21] was applied to determine whether the RTT measurements followed a normal distribution. Because the results showed that normality could not be assumed, the median was selected as the measure of central tendency. Finally, the median RTT values for approximately 35,000 measurements between each user region and data center region were calculated in order to estimate the QoS provided by each data center region to the corresponding user region. The median RTT values provides a robust estimation of QoS, leveraging RTT as a precise and performance-focused metric. The smaller the median RTT values, the better the QoS provided to the users.
The collected measurements allowed us to design representative scenarios, especially considering that the proposed algorithmic models are robust against different values of the problem scenarios, as demonstrated in previous articles [7,22].
3. Literature Review
The design of CDNs on cloud platforms has been approached by considering a number of different optimization criteria for modeling the cloud resource provisioning problem. Related works have proposed optimization algorithms for efficient CDN design; however, few of these have followed multiobjective approaches. A review of related work is presented next.
Zheng and Zheng [23] proposed a Genetic Algorithm (GA) to optimize the delivery cost for static content delivery in cloud storage through a CDN. Costs were based on the network bandwidth and processing capability, allowing network peers to be classified within a local region based on the current peer load status. The evaluation was performed using the CloudSim simulator. Ten problem instances were built from the OR-Library based on set covering problem cases with weights, simulating content delivery for different groups of a static CDN topology. Experimental results showed improved CDN designs with reduced delivery costs.
Iturriaga et al. [24] studied multiobjective design and optimization of CDNs in the cloud while minimizing infrastructure costs and maximizing QoS for end users. An MOEA was applied to address the offline problem of provisioning infrastructure resources. The results indicated that the MOEA effectively optimized resource provisioning in cloud-based CDNs. The proposal was then extended by considering costs related to VMs, networking, and storage [22]. Three MOEAs were proposed for addressing the offline provisioning of cloud resources. Experimental results indicated that SMS-EMOA was the most accurate MOEA for all problem instances. In addition, the results demonstrated that the proposed approach reduced total costs by up to 10.6% while maintaining high QoS levels.
Stephanakis et al. [25] proposed a capacitated QoS network model to optimize the placement of surrogate media servers within the access portion of a CDN. The optimization objectives included minimizing costs and link delays based on capacity and utilization requirements as well as minimizing the network architecture. An MOEA was used to evaluate all possible connections between the first-level aggregation points in the access network and prioritize different types of traffic according to their class of service. The evaluation was performed on scenarios representing the traffic requirements of 20 access nodes aggregated on 20 digital subscriber line access multiplexers for live broadcast/IPTV and video-on-demand. The results indicated that the use of multiple cost-oriented strategies within the access network led to cost-effective implementations and improved quality of IPTV services.
Bektaş et al. [26] proposed a two-level Simulated Annealing (SA) to tackle the joint problem of object placement and request routing in a CDN under the constraints of server capacity and end-to-end object transfer delay. The objective function represented the total cost of transferring content when a client receives content through a proxy, reflecting the cost summed across all proxies, clients, and objects. Fifteen large-scale instances randomly generated using an internet topology generator were analyzed, where the number of proxy servers ranged from 20 to 60, the number of objects varied from 60 to 100, and the number of clients was set at 200. The results showed that SA consistently outperformed a greedy algorithm across all instances. Additionally, the proposed SA approach produced better solutions than the baseline algorithm for instances with more than 30 proxy servers.
Ellouze et al. [27] proposed a cross-layer framework to optimize traffic for a CDN media streaming service by using a random selection of a surrogate for each client and one-way transmission of delivery cost information from network operators to cloud service providers. The Cooperative Association for Internet Data Analysis (CAIDA) provided the topology and traffic model over 24 h, fluctuating between idle and busy times. The cross-layer optimization framework improved over the random selection, proportion map, and routing cost map techniques, yielding improved network utilization and higher perceived QoS.
Mangili et al. [28] proposed an optimization approach to assess the performance of Content-Centric Networking (CCN) compared to traditional CDNs. Their proposed approach included an optimization model designed to study the performance limits of a CCN by addressing the combined object placement and routing problem. The problem instances utilized topologies from the Abilene network (consisting of 11 routers and 14 links), the GEANT network (with 37 routers and 56 links), and a random-geometric graph (comprising 26 routers and 60 links) with 10 producers and 25 consumers. The results showed that the CCN provided significant performance improvements compared to a traditional IP-based network, even with small cache sizes; however, when the caching storage was large, the benefits of using advanced cache replacement policies were greatly diminished.
Coppens et al. [29] proposed a co-operative cost optimization algorithm for replica placement within a self-organizing hybrid CDN architecture using online content replication managed through control traffic. The proposed approach targeted the content distribution module within the CDN operation layer. The topology was based on a realistic European fiber-optic network with a throughput of 1 GB. The case study demanded an average of twelve movies per minute. Results showed that control traffic could be effectively regulated using a Control Ratio (CR). By applying an adaptive CR that measures the evolution of data traffic, the convergence time was reduced by up to 30%.
Cevallos et al. [30] proposed the multi-objective deployment of service function chains within virtualized CDNs for live streaming. Deep reinforcement learning was used on a real-world dataset from a video delivery operator. The dataset was limited to a five-day trace, with hosting nodes in Italy. The results demonstrated that the proposed method significantly improved QoS and QoE, as evidenced by a higher session acceptance ratio than the other tested algorithms while maintaining operational costs within acceptable limits.
Karaata et al. [31] proposed a multipath routing algorithm designed for CDN-P2P networks that enhances load balancing, scalability, and throughput while reducing buffer requirements and network bottlenecks. The proposed approach evaluates routing messages over all disjoint paths between two peers within a star P2P overlay network. The evaluation involved source peers ranging from 2000 to 5000 with a maximum network size of 5040 nodes, providing sufficient messages to keep the network channels active. The PeerSim simulator was employed to assess diverse network properties. The results indicated that an increase in network size slightly boosts the throughput achieved by the algorithm.
Bęben et al. [32] proposed a multi-criteria decision algorithm to address the problem of multisource content resolution within a CDN. First, the algorithm discovers multiple content delivery paths and gathers their respective transfer characteristics. Then, it triggers each content request to determine the best content server and delivery path combination. The evaluation used an internet-scale network model focusing on video content consumption. The topology included 36,000 domains with 103,000 inter-domain links. Results indicated that having better knowledge about links and servers enhances system efficiency. Specifically, integrating an appropriate routing algorithm with a suitable decision algorithm boosts the effectiveness of the system.
Neves et al. [33] addressed the replica placement and request distribution problem, taking into account server disk space, bandwidth, QoS requirements for requests, and variations in network conditions. Their approach combines exact methods with a heuristic hybrid strategy. Evaluation was conducted on 60 instances from the LABIC project using real data from Brazilian internet providers. The hybrid network heuristic achieved good solutions in significantly less computational time compared to the baseline greedy algorithm used for the offline version of the problem. The proposed method reduced the average gap by more than 1% and cut computational times by over 50%.
Khansoltani et al. [34] proposed an algorithm for selecting servers by evaluating both qualitative and quantitative features within a CDN. The authors used the Promethee decision-making algorithm to consider five key indicators: service price, server latency, CPU resource availability, memory, and server I/O capacity. The evaluation involved 50 servers with resource capacities determined by a normal distribution and 2000 applications submitted to the CDN. The proposed method improved over Promethee_RR (63.2%) and Promethee_MCT (68.7%) on average. The proposed method also demonstrated better performance in terms of service price, with averages of 59.8% and 58.4%.
Jabraili et al. [35] proposed a GA for allocating objects to servers based on their iteration frequency, load, and generated delay, with the goal of developing an effective policy for distributing outsourced content within a CDN infrastructure. The GA was evaluated over problem instances with a random transit-stub structure with 1464 nodes, 5000 objects, and 500,000 user requests. The proposed method significantly improved the mean response time and hit rate while maintaining a low load on the CDN servers.
Lai et al. [36] proposed the STARFRONT framework for optimizing cost and access latency in content distribution, considering dynamic network topology, workload distribution, and pricing policies from cloud operators. The minimum cost path was found by solving an integer linear programming problem. Then, a heuristic was employed for latency minimization by assigning cache servers to meet application-level requirements while minimizing bandwidth and storage costs. The problem instances considered 552,000 real-world flow records from a commercial cloud CDN operator and the Amazon AWS network topology. STARFRONT resulted in reduced round-trip times compared to a cloud-only strategy.
Jin et al. [37] introduced a randomized online edge-renting algorithm for content service providers with the aim of extending cloud-based CDNs into edge environments. The objective was to minimize the costs associated with renting edge services while accounting for bandwidth costs over the charging period without foresight into future demands. The evaluation included three real-world instances using actual charging prices for cloud and edge products where end users required 1 Mbps of bandwidth to access videos. The tested scenarios involved 600, 1200, and 1800 videos that generated visitor data over 150 days. The proposed algorithm was shown to represent an improvement over a standard solution.
Farahani et al. [38] proposed a hybrid P2P–CDN architecture for minimizing client latency and network costs during live video streaming. An unsupervised self-organizing map technique was designed to assist in decision-making for action selection. The approach was evaluated on a large-scale testbed with 350 players running an adaptive bitrate algorithm and five Apache HTTP servers (four CDN servers and an origin server) hosted in the CloudLab environment. Their approach significantly outperformed baseline schemes in regard to user QoE, latency, and network utilization. Later, the same authors presented a new framework for live video streaming that leverages the idle resources of peers to provide distributed video transcoding and super-resolution services [39]. This optimization model jointly optimizes end-to-end latency and network costs using a greedy algorithm while also considering resource limitations. The evaluation considered 350 HTTP Adaptive Streaming clients, and the results showed that their approach provided improvements over the traditional CDN and hybrid P2P–CDN baseline methods.
Yadav and Kar [40] proposed an optimization algorithm for minimizing the cost and delay of CDNs based on the placement of fog nodes within a specific region. Unsupervised Machine Learning (ML) was applied in two stages, namely, clustering and Voronoi. The algorithm was evaluated on datasets using real-time data from open public WiFi access points in Delhi and New York City, with link costs assigned to each link based on the CDN provider. The proposed approach reduced the overall cost of deployment and distribution.
Marri and Reddy [41] proposed an adaptive hybrid approach to enhance the performance of CDN–P2P by considering the serviceability of hosts and organizing peer groups in mesh and tree topologies. The approach was evaluated on a scenario with 1000 peers participating in a 60-min streaming session. The proposed hybrid approach improved over traditional CDN methods regarding upload capacity and startup delay.
The above analysis of related works allows us to identify a growing interest in optimization algorithms for problems involving efficient CDN design. Continuing in this line of work, the current article contributes to the field of multiobjective evolutionary approaches for cloud-based CDN design.
4. Multiobjective Evolutionary Approach for Cloud-Based CDN Design
This section describes the proposed MOEA to solve the CDN design problem.
4.1. Specification of the Proposed MOEA
To address the CDN design problem in cloud platforms, a specific MOEA based on the Nondominated Sorting Genetic Algorithm II (NSGA-II) was implemented. NSGA-II was introduced by Deb et al. [42] as an enhanced version of its predecessor, NSGA [43]. The new version integrates the following features, which enable improved evolutionary search compared to the original NSGA algorithm: (i) a non-dominated elitist sorting approach that uses an auxiliary subpopulation to reduce the complexity associated with dominance checking; (ii) a fitness assignment procedure based on nondominated rank ranges, incorporating crowding distance values to evaluate solution diversity; (iii) a new mechanism for preserving population diversity by using a crowding technique that does not require additional parameters, replacing the sharing technique used in the previous NSGA.
The implemented MOEA based on NSGA-II consists of three phases: population initialization, scheduling, and routing. Figure 2 presents the main activities comprising each phase of the proposed MOEA. The population initialization and scheduling phases determine the allocation of VMs to data centers in order to fulfill content requests, while the routing phase determines which VM serves each content request.
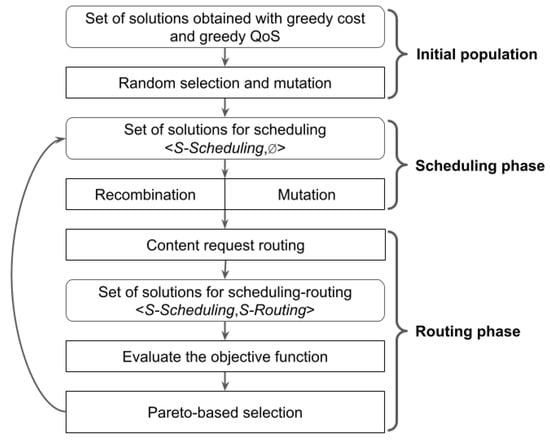
Figure 2.
Stages of the implemented MOEA to solve the CDN design problem in cloud platforms.
The proposed MOEA represents solutions as <S-Scheduling, S-Routing>, where the S-Scheduling components is built in the first two phases and the S-Routing component is constructed in the routing phase (for a complete description of the applied representation, see Section 4.2).
4.1.1. First Stage: Population Initialization
The population initialization stage of the MOEA executes at the beginning of the algorithm. The initial population of the MOEA consists of solutions in the form <S-Scheduling,∅>. The S-Scheduling components of the initial solutions are randomly selected from a set of solutions G using a uniform distribution. The set G is constructed with solutions obtained through the greedy cost and greedy QoS heuristics described in Section 5.1. Random perturbations are performed by applying the mutation operator to each initial solution with a probability in order to introduce genetic diversity in the initial population.
4.1.2. Second Stage: Scheduling
In this phase, for each data center, the MOEA determines the number of each type of VM assigned in each planning hour considering the demand of content requests for each hour. The MOEA also determines which content resources are stored in each data center. Then, the MOEA constructs solutions in the form <S-Scheduling,∅>. Both crossover and mutation operators are applied to each solution with their respective probabilities.
4.1.3. Third Stage: Routing
In this stage, the MOEA determines which data center should serve each content resource request. For each solution, the S-Routing component is constructed using the content resource request routing algorithm described in Section 4.6. Finally, when each solution has both of the <S-Scheduling, S-Routing> components, the objective functions are evaluated. The evolutionary search continues until the termination criterion is met; after evaluating the objective functions, the MOEA selects parent solutions that generate offspring to be part of the new population, then returns to the beginning of the scheduling phase.
4.2. Representation of Solutions
In the proposed MOEA, solutions are represented by four matrices:
- Y: An integer matrix of dimension .
- X: A binary matrix of dimension .
- : An integer matrix of dimension .
- Z: An integer matrix of dimension .
where H is the number of hours to plan in the period , m is the number of data centers, n is the number of content resources, s is the number of geographical regions from which users make requests, and v is the number of VMs allocated throughout the planning period.
The S-Scheduling component is represented by matrices Y, , and X. Matrix indicates how many instances of reserved VMs are assigned to each data center throughout the planning period. Matrix X represents the allocation of content provider resources for each data center. Matrix Y indicates the number of VMs needed to meet the demand for content resource requests for each data center and in each planning hour . The number of VMs requested on-demand is expressed for each hour and for each data center as . The S-Routing component is represented by the matrix Z. The value indicates that users from region download content a total of b times from VM v at data center at time t, where time is expressed in minutes.
Equation (2) shows the encoding of the S-Scheduling component of a solution for an instance with three data centers , , and six resources , …, for an hour h within the planning period . Table 2 displays the assignment of content resources to data centers and the number of VMs used at each data center in the given example.
Table 2.
VMs and resources allocated to each data center in the example representation of the S-Scheduling component of the solution.
4.3. Recombination Operator
The recombination operator is based on uniform crossover, with specific adaptations included to take the problem constraints into account. The recombination operator receives two feasible solutions, performs the crossover operation on the S-Scheduling component of each solution, and returns two feasible solutions.
For each data center, the recombination operator exchanges the content resource allocation, the total VM allocation, and the proportion of VMs that are assigned on demand. Each attribute is randomly selected with uniform distribution (probability 0.5) to be exchanged between the data centers of the solutions.
Algorithm 1 shows the pseudocode of the recombination operator. Given two solutions to recombine, the first loop (lines 1–6) exchanges the allocation of content resources to data centers. For each resource selected with uniform distribution (probability 0.5) and for each data center , the loop exchanges the allocation of resource to data center between the two solutions participating in the crossover (line 4). Because the described exchange is performed for all data centers , no infeasible solutions are generated due to lack of allocation of any resource. In the second loop (lines 7–12), each scheduling hour h ∈ is selected with uniform distribution (probability 0.5) and the assignment of VMs for all data centers in C is swapped between the two solutions (line 10). Because the described swapping is performed for all the data centers ∈ C, no infeasible solutions are generated due to not being able to cover the demand for VMs in a scheduling hour h ∈ . The last loop of the algorithm (lines 13–16) selects each data center with uniform distribution (probability 0.5) and exchanges the reserved VM assigned in between the solutions involved in the crossing (line 15).
For all data centers , the following condition must hold: the total number of VMs assigned must always be greater than or equal to the number of VMs reserved. Therefore, the exchanges made in the last two loops of the algorithm can generate unfeasible solutions. Thus, line 17 executes the algorithm for correcting solutions, as described in Section 4.5.
| Algorithm 1 Recombination operator |
|
4.4. Mutation Operator
The mutation operator receives a feasible solution, performs modifications on the S-Scheduling component, and returns a feasible solution. The mutation operator changes the allocation of content resources to data centers, taking into account that no content resources are left unallocated. Regarding the allocation of VMs to data centers, the mutation operator produces changes in the solution that vary the proportion of reserved and on-demand VMs that the data center uses to cover the demand for content resources.
Algorithm 2 describes the mutation operator. The first loop of the algorithm (lines 1–10) changes the allocation of resources to data centers. For each resource , data centers are selected with uniform distribution (probability ). If the resource is not assigned to the selected data center, then the resource is assigned to the data center (line 5). If it is already assigned, the resource is unassigned to the data center after checking that the resource is assigned to at least one other data center in C (line 7). The check that the resource is assigned to another data center is performed to avoid generating an infeasible solution due to lack of resource allocation. The second loop of the algorithm (lines 11–23) modifies the allocation of VMs to data centers in the solution. For each scheduling hour , the loop selects data centers with uniform distribution (probability ). If data center has VMs assigned to it, the loop selects a uniformly distributed MVcant value in the set (line 15), then removes MVcant number of VMs assigned to that data center at hour h (line 17) and assigns them at hour h to another data center selected with uniform probability (line 18). If data center has no VMs assigned, then the loop assigns a VM to it (line 20). Because the described mutation does not modify the total number of VMs assigned to the data centers in each planning hour h, no infeasible solutions will be generated due to not being able to cover the demand for VMs in hour h.
The third loop (lines 24–31) modifies the number of VMs reserved in each data center selected with uniform distribution (probability ). If the selected data center has reserved VMs, a value with uniform distribution is selected and assigned as the new value of reserved VMs of data center (line 27). If the selected data center does not have a reserved VM, then one is assigned to it (line 28). Modifying the number of VMs assigned and reserved in a data center can generate unfeasible solutions. Therefore, line 32 executes the algorithm for correcting solutions, as described in Section 4.5.
| Algorithm 2 Mutation operator |
|
4.5. Correction of Infeasible Solutions
According to the problem constraints, for all data centers , the total number of allocated VMs must always be greater than or equal to the number of reserved VMs. Therefore, applying the recombination or mutation operations may result in infeasible solutions. The correction algorithm operates on infeasible solutions, modifying the number of reserved VMs in the data centers to ensure that the solutions satisfy the feasibility condition.
Algorithm 3 presents the solution correction method. The loop modifies the number of reserved VMs in each data center to make the solution feasible. For each data center , the value of mc is computed as the minimum number of VMs used in the data center over the entire planning period (line 2). If mc is lower than the number of reserved VMs in the data center (), then mc reserved VMs are assigned to the data center (line 4).
| Algorithm 3 Correction of infeasible solutions |
|
4.6. Routing Algorithms
The Content Resource Request Routing (CRP) algorithm defines the routing phase of the MOEA. Considering the VM and content resource allocation specified in S-Planning, the CRP algorithm assigns each content resource request to a data center while respecting the problem constraints.
To assign resource requests to data centers, the CRP algorithm selects between two resource request allocation strategies with probability 0.5 and uniform distribution, choosing either a strategy that prioritizes cost (BestCostRoute) or a strategy that prioritizes QoS (BestQoSRoute). After selecting an allocation strategy, the CRP applies it in assigning all content resource requests.
The BestCostRoute and BestQoSRoute strategies apply more than one greedy method for allocating content resources. If a method fails to allocate all content resources, then the allocations made thus far are discarded and the next method with more relaxed restrictions is applied. In each strategy, the methods are ordered from the most restrictive to the least restrictive. In this way, the methods are ordered in decreasing order (measured by cost or QoS) of the solution they build.
4.6.1. BestCostRouting: Cost-Prioritized Routing Strategy
BestCostRouting has two methods for assigning content resources, namely, m1Cost and m2Cost. Both methods select the cheapest VM that meets the imposed conditions. m1Cost is the most restrictive strategy; as a necessary condition for assigning a content request, it considers that the data center must have the content resource to meet the request. In order to optimize the use of VMs, it prioritizes VMs that are already being used by the same content provider that has the resource associated with the request. If a VM used by the provider is not found, then a free VM is selected. m2Cost relaxes the above-mentioned restriction. Because m2Cost does not follow the allocation of resources to data centers in S-Planning, this component must be corrected.
Algorithm 4 presents the pseudocode of the BestCostRouting. At each time t, the function getVMBestCost is applied to search for the VM with the best cost that meets the three constraints of the problem along with the additional constraint add_constraint.
The first loop of the algorithm (lines 1–17) implements the m1Cost assignment method. For each content request at each time t, m1Cost iteratively searches for the best cost VM using the function getVMBestCost (line 6). Here, add_constraint ensures that the VM returned by the function is being used by the content provider associated with the request that the VM will serve. Additionally, the constraint ensures that the data center has the resource associated with the request. If the function does not find a suitable VM, then the search is repeated (line 9) while relaxing add_constraint. If a suitable VM is found in either of the two searches, then the request is assigned to that VM. If no VM is found in the searches, then m1Cost ends and the m2Cost method is executed.
| Algorithm 4 Best cost routing algorithm |
|
The second loop of the algorithm (lines 19–32) implements m2Cost. When applying m2Cost, none of the content request assignments made in m1Cost are considered; the assignment process starts anew from the first request. m2Cost iterates over the content resource requests for each time t. The initial search calls the getVMBestCost function (line 24), with add_constraint requiring that the VM returned by the function is being used by the content provider associated with the request. In this case, the function may return a VM located in a data center that does not have the assigned content resource. If the function does not find a suitable VM meeting the imposed condition, then m2Cost searches for a VM without an associated add_constraint; the VM only needs to satisfy the problem constraints.
Due to the feasibility of the S-Scheduling solution component, the m2Cost method always finds a VM for each content request. Therefore, the request is assigned to the found VM in the last line of the algorithm, and the content resource associated with the request is allocated to the data center of the VM if it was not already assigned.
4.6.2. BestQoSRouting: QoS-Prioritized Routing Strategy
BestQoSRouting applies four methods for assigning content resource requests:
- m1QoS: Assigns a content request to a VM considering the constraint that the VM must be in a data center with the assigned content resource related to the request.
- m2QoS: Extends m1QoS by adding the constraint to prioritize VMs already in use by the content provider associated with the request.
- m3QoS: Removes the constraint from m1QoS
- m4QoS: Removes the constraint from m2QoS.
Methods m3QoS and m4QoS do not adhere to the resource allocation to the data centers as represented in the S-Scheduling component of the solution. Therefore, the BestQoSRouting strategy must correct this component in the event of a content resource request being assigned to a data center that does not have the associated resource.
Algorithm 5 presents the pseudocode for the BestQoSRouting strategy. The getVMBestQoS() function is applied to search for the VM with the best QoS at each time t, satisfying the constraints of the problem along with the additional constraint , which varies depending on which method is being used.
The first loop (lines 1–9) implements the m1QoS method. For each content request at each time t, it iteratively searches for the VM with the best QoS using the function getVMBestQoS (line 4) while requiring that the VM belongs to a data center with the resource associated with the request. If a VM is found, then the request is associated with that VM. If no VM is found, the m1QoS method ends and the m2QoS method is executed next.
The second loop (lines 12–23) implements the m2QoS method. This method does not consider any of the content request assignments made in m1QoS; the assignment process starts anew from the first request. Similar to m1QoS, m2QoS iterates over content resource requests for each time t and searches for the VM with the best QoS using the function getVMBestQoS (line 14), requiring that the VM is being used by the content provider associated with the request that will be served by that VM. Additionally, the constraint requires that the data center has the resource associated with the request. If no VM meeting the condition is found, then the search is repeated (line 16) while removing from the requirement that the VM must be in use by the content provider associated with the request. If a VM is found in either of these two searches, the request is associated with it; if no VM is found in the searches, then the m2QoS method ends and the m3QoS method is executed next.
The m3QoS method has the same structure as m1QoS, with two differences: (i) during invocation of the getVMBestQoS (line 29) function, the requirement that the data center must have the resource associated with the request is not considered, and (ii) it modifies the S-Scheduling component of the solution when assigning the content resource request to a data center that does not have the associated resource (line 31). Similarly, the m4QoS method has the same structure as m2QoS, with two exceptions: (i) The getVMBestQoS function (lines 41 and 44) removes the requirement that the data center must have the resource associated with the request, and (ii) it modifies the S-Scheduling component of the solution when assigning the content resource request to a data center that does not have the associated resource (line 47).
| Algorithm 5 Best QoS routing algorithm |
|
4.6.3. Implementation Details
The proposed MOEA was implemented using the JMetal framework [44]. JMetal aims at the development, experimentation, and study of metaheuristics to solve multiobjective optimization problems. JMetal is developed in Java using the object-oriented paradigm. JMetal provides a set of classic and modern optimizers, a collection of benchmark problems, and a set of quality indicators for use in evaluating the quality and computational efficiency of algorithms. With JMetal, it is possible to configure and execute complete experimental studies that generate statistical information about the obtained results. The framework also takes advantage of multi-core processing to accelerate the execution time of experiments.
5. Baseline Optimization Methods for Comparison
In this section, we present the baseline optimization algorithms for comparison with the MOEA, which include a set of three heuristics methods and an exact resolution approach.
5.1. Heuristics
Three heuristics are used for the cloud-based CDN design problem: greedy cost, greedy QoS, and round robin. To clarify their implementations, the general procedure common to all heuristics is presented first, followed by a discussion of their specific features.
5.1.1. General Procedure
The general procedure of the heuristics is outlined in Algorithm 6. The heuristics iterate over content resource requests for each time instant. For every content request, assignment to a data center is made based on a predefined criterion (line 3). Then, the heuristics check for an available VM in the selected data center with sufficient capacity to assign the request. If no VM with sufficient capacity is found, a new VM is added to the selected data center. The type of VM added depends on whether the time instant corresponds to a demand peak; either an on-demand VM is rented for a demand peak (lines 8 and 9), or a VM is reserved for the entire planning horizon (lines 10 and 11).
A time instant is classified as a demand peak if the required number of VMs at that instant meets or exceeds a threshold number of VMs, denoted as . By adjusting the value of , different subsets of time instants are identified as demand peaks, resulting in varied heuristic solutions. The value of ranges from zero to the maximum number of VMs needed to meet demand at any time within the planning horizon . To determine the number of required VMs at each time instant, content requests are analyzed in accordance with the constraints outlined in Section 2.3, i.e., that no two providers can share the same VM simultaneously and that a single VM cannot process more than a predefined number of concurrent content requests. Finally, dominated or repeated solutions are removed to construct the Pareto front for each heuristic.
For a given set of input parameters, each heuristic produces a unique solution. To facilitate comparison between the proposed baseline heuristics and the MOEA, multiple solutions are generated by executing each heuristic with different input parameters. Specifically, the variation is applied to the set of time instants considered as demand peaks.
| Algorithm 6 General procedure for the baseline heuristics |
|
5.1.2. Specific Features of Heuristics
The specific features of each baseline heuristic are as follows.
Greedy Cost. The predefined criterion of the greedy cost is to assign each content request to the data center that offers the lowest cost while satisfying a minimum QoS threshold. Input parameters include the subset of time instants identified as demand peaks and the minimum QoS threshold. Greedy cost aims at obtaining cost-efficient solutions that fulfill a required minimum QoS threshold. To generate a range of solutions, in addition to the subsets of demand peak time instants, the QoS thresholds for each subset of demand peak time instants are also varied.
Greedy QoS. The predefined criterion of the greedy QoS is to assign the content request to the data center that provides the best QoS for each content request. The input parameter is the subset of time instants identified as demand peaks. The greedy QoS heuristic aims to obtain solutions that prioritize high QoS for users.
Round Robin. The predefined criterion of the round robin heuristic is to iteratively assign content requests to data centers in a sequential manner. Data centers are numbered from 0 to n, where n is the total number of data centers. Each content request is assigned to the next data center in the sequence. When a content request is assigned to data center n, the next content request is assigned to data center 0. The goal of the round robin heuristic is to distribute content requests evenly across data centers, avoiding imbalances where some data centers handle too many requests while others handle too few.
5.2. Exact Resolution Approach
AMPL [45] was used as the modeling language for the CDN design problem. CPLEX version 12.6.3.0 was used as the exact solver. The mathematical formulation results in an MILP model driven by the inclusion of discrete variables , , , and .
The -constraint method was applied to solve the resulting bi-objective problem. The -constraint is effective for generating a set of Pareto-optimal solutions in complex problems [46]. Equation (1a) remains the primary objective function, whereas Equation (1b) is transformed into a constraint, serving as a restricted objective (Equation (3)).
By adjusting the parameter , the model yields different compromise solutions, allowing us to explore the tradeoff between cost and user QoS. Initially, is set to the total number of content requests in the instance multiplied by the worst QoS value between a user region and a data center. Then, is progressively reduced by one unit until it reaches a minimum value of one.
6. Experimental Validation
This section describes the experimental evaluation of the proposed bio-inspired multiobjective optimization approach for cloud-based CDN design.
6.1. Methodology for the Evaluation
Our evaluation of the proposed MOEA involved three stages: parameter tuning, empirical evaluation, and comparison with exact and heuristic baseline methods.
Several important solutions for multiobjective problems were considered: the best solution in terms of cost, the best solution in terms of QoS, and the compromise solution that most equally weights the two objectives (i.e., the solution that is closest to zero according to the Euclidean norm).
Regarding metrics, we computed two relevant indicators to determine the quality of solution found by each studied method: RHV and EAS. RHV is a relevant metric in multiobjective optimization that assesses the two main purposes of a multiobjective optimization algorithm, namely, the proximity to the Pareto front and the diversity of the obtained solutions [47]. The RHV metric is the ratio between the volume determined by the Pareto front calculated for the resolution method and the volume determined by the reference Pareto front. The ideal value of the ratio is 1 [47]. The RHV metric was computed regarding an approximation of the optimal Pareto front built by gathering the nondominated solutions found in all executions of the studied methods, which is a common approach when solving multiobjective optimization problems with an unknown optimal Pareto front [48]. In turn, the attainment surface represents the set of ideal tradeoffs between conflicting objectives. Points in the attainment surface indicate the best achievable performance for each objective [49]. EAS is a statistical estimator of the attainment surface; for each vector in the objective space, it determines the probability of its being dominated by the computed Pareto front in a given execution of the studied algorithm. Unlike RHV, EAS does not depend on the (unknown) real Pareto front. The analysis is based on the 50%-EAS [49], which considers the estimated attainment surface obtained by at least 50% of multiple executions, i.e., it is analogous to the median in single objective optimization. The ideal value of the 50%-EAS metric is 1.
The methodology of Knowles and Corne [50] was adopted to compare the EAS of each studied method. First, a statistical pairwise comparison was performed by computing the 50%-EAS with a statistical confidence level of 95%. Then, two key metrics were evaluated: (i) the proportion of the area where there is statistical confidence that the compared algorithm is undefeated by any other algorithm (U), and (ii) the proportion of the area where there is statistical confidence that the compared algorithm outperforms all other algorithms in terms of 50%-EAS values (B). Unlike the comparison relying on the RHV metric, this does not rely on the optimal Pareto front constructed for each specific problem instance.
In our empirical evaluation, we solved ten realistic instances to compute approximations to the Pareto front considering different tradeoff solutions. Due to the stochastic nature of MOEAs, 50 independent executions using different seeds for the pseudorandom number generator were performed for each problem instance. The distributions of the results were examined using the Kolmogorov–Smirnov statistical test to determine whether the samples followed a normal distribution. The Kruskal–Wallis statistical test was applied to determine the statistical significance of the differences between results.
To avoid biased results, parameter tuning experiments were performed on a set of smaller problem instances different from the validation instances. A set of relevant parameters that impact the search capabilities of the proposed MOEA were studied: recombination probability (), mutation probability (), and population size (#P).
Finally, a comparison with baseline optimization methods is reported. The comparison considered an exact approach using CPLEX, a traditional business-as-usual round robin method, and greedy heuristics focused on optimizing cost (greedy cost) and QoS (greedy QoS). To guarantee the statistical significance of the MOEA results over the baseline heuristics, the median (med) RHV was used as estimator and the Interquartile Range (IQR) of the RHV values was used to evaluate the dispersion. Improvements were considered statistically significant if .
6.2. Evaluation Instances
A set of realistic instances of the cloud-based CDN design problem were generated using the GlobeTraff tool [51]. GlobeTraff is a traffic generator that allows realistic mixes of internet traffic to be created. GlobeTraff is able to generate various types of application traffic based on models presented in the literature, allowing for detailed parameterization of both the generated models and the composition of the resulting traffic mix. In each generated instance, the traffic generated by GlobeTraff was divided by geographic regions. For a more realistic traffic division, we used information provided in the report made by the Cisco company [52], in which a division of traffic by types and geographic areas is proposed.
Different scenarios were generated by varying the size of the traffic simulations created with GlobeTraff based on the execution time and the number of independent executions of the evaluated MOEA. The instance sizes for the experimental evaluation were adjusted using reference data consisting of the number of video requests over time obtained from statistics of the OpenFING project, an online educational video service at Engineering Faculty of the Universidad de la República, Uruguay (https://open.fing.edu.uy/).
Smaller instances were used for the MOEA parameters setting experiments. For the MOEA validation, the size of the instances was adjusted into three groups: small, medium, and large. For experiments solving the problem using AMPL with CPLEX, the size of the instances was adjusted based on the execution time and the memory available in the infrastructure used to run AMPL. For all the generated instances, the number of user regions was kept fixed at 30 and the number of data centers at 10, as explained in Section 6.2. The other characteristics are reported in Table 3.
Table 3.
Details of problem instances for each stage in the experimental evaluation.
6.3. Development and Execution Platform
The MOEA and baseline heuristics were developed in the Java programming language using the JMetal framework [44]. The exact resolution algorithm was implemented in AMPL, and the problem was solved using CPLEX version 12.6.3.0.
The experimental evaluation was performed using the National Supercomputing Center (Cluster-UY), Uruguay [53]. The computing resources included a DELL Power Edge R720 server, two Intel Xeon E52650 2.00 GHz processors with eight cores each, 64 GB of RAM, 600 GB of disk storage, and the Linux CentOS operating system.
6.4. Parameters Setting Experiments
Parameter setting experiments were performed over instances A1, C1, D1, and D2 using up to 4000 videos, a planning horizon of 480 min, seven providers, and 600 video requests. For each instance, 50 independent executions were performed, with a stopping criterion of 1000 generations for each combination of three relevant parameters of the studied MOEA: , , and . The candidate values were , , and . The RHV metric was considered in the analysis.
The Kolmogorov–Smirnov statistical test was applied to analyze the result distributions. Based on the obtained p-values, not all instances followed a normal distribution for the RHV metric. Therefore, the median was chosen as an estimator of the RHV results.
For the four instances we used, a classification of each parameter combination was made according to its median RHV and 50%-EAS value. When the nonparametric Kruskal–Wallis test did not allow us to determine statistical significance with a confidence level of 95%, which would ensure a significant difference between the distribution of results of two parametric configurations, the execution time was used to determine the classification. For each parameter combination, the number of times each position was occupied in the different classifications was determined. A total number of 27 different configurations were studied. Table 4 reports the configurations on the first four positions of the ranking.
Table 4.
Number of times each parameter configuration occupied the top four positions in the ranking of best results for RHV, 50%-EAS, and execution time.
The results in Table 4 show that configurations with a population size equal to 200 individuals occupied the first four positions of the ranking more often. In turn, the best configurations had the values and . The Kruskal–Wallis test for different population sizes yielded p-values less than 1 × ; therefore, the differences are assured with a statistical confidence level greater than 95%. For configurations with different values of and where the p-values could not guarantee statistical significance, the median of the MOEA execution time was used as a tiebreaker. The best parameter configuration we found was , , and .
6.5. Validation Results and Comparison with Baseline Optimization Methods
This subsection reports the results of the experimental evaluation. A comparison is presented with solutions obtained by exactly solving small instances of the cloud-based CDN design problem and with solutions computed using the greedy cost, greedy QoS, and round robin techniques.
6.5.1. Comparison of Results for Instances That Are Solvable Using an Exact Method
Table 5 reports the median results of the RHV and 50%-EAS metrics computed for each problem instance. For the proposed MOEA, the Interquartile Range (IQR) is included as a measure to assess the robustness and spread of the results. The greedy QoS and round robin techniques are not included in the RHV and 50%-EAS comparison, as they compute a single solution.
Table 5.
RHV (±IQR for the proposed MOEA) and 50%-EAS results.
The results in Table 5 demonstrate that the proposed MOEA computed high-quality solutions for small size problem instances. CPLEX solved the problem to optimality and computed the optimal RHV value on instances AMPL1 and AMPL3 (the ideal value of 1) and 0.99 in instance AMPL2. In those instances, the MOEA computed solutions with a maximum difference of only 0.06. Different results were computed for problem instance AMPL4, where the MOEA computed a RHV value 0.13 better than CPLEX. The greedy cost heuristic computed the worst RHV results for all instances. The MOEA improved over greedy cost by up to 0.26 in problem instance AMPL4. The RHV values computed by the proposed MOEA demonstrate strong convergence towards the reference Pareto front and show good diversity within the calculated solutions. The statistical significance of the difference between the median RHV of the proposed MOEA and the RHV values of the other methods is confirmed for all problem instances. A similar trend is observed for 50%-EAS values, showing that the proposed MOEA improved significantly over the greedy cost method and computed better values of the metric in problem instance AMPL4, with a large percentage of both undefeated and outperforming solutions.
Table 6 reports the compromise solution and best solutions regarding each problem objective computed by each studied method for the four problem instances that were solved exactly. The best values regarding cost and QoS are marked in bold.
Table 6.
Comparison of results, showing the compromise solution, best cost solution, and best QoS solution using the studied methods for exactly solvable instances.
Regarding the best cost solutions, Table 6 shows that the MOEA matched the value of CPLEX in both cost and QoS for instances AMPL2, AMPL3, and AMPL4. Only in instance AMPL1 did the MOEA reported a slightly worse value for the value of cost compared to CPLEX. Regarding the best QoS solutions, greedy QoS always obtained the best QoS value, as it is strongly biased towards that problem objective. The MOEA computed the same QoS as greedy QoS on AMPL1 instance, but the cost value was 4.8% better. In instances AMPL2 and AMPL4, the MOEA computed the second-best QoS value, but with significantly better cost values (up to 14.9% better in instance AMPL2). Overall, the MOEA computed accurate results with better tradeoff values between the problem objectives. In the particular case of AMPL4, CPLEX obtained a solution that was significantly worse than the MOEA solution in terms of QoS. This occurred because CPLEX failed to find solutions when the value was set to low levels. In fact, CPLEX was unable to find a feasible solution even after an entire day of computation.
The proposed MOEA simultaneously improved in terms of cost and QoS over greedy cost for all instances. The average cost improvement was 36.4%, with values between 21.1% (for AMPL1) and 50.0% (for AMPL2 and AMPL3). QoS improvements were even more significant, with an average of 47.2%, minimum of 43.7% (for AMPL1) and maximum of 51.2% (for AMPL3). Even larger improvements were obtained over the round robin technique, between three and four times in terms of QoS and reducing the cost up to 63.6%, with an average improvement of 45.7$. These results imply a significant improvement in both objective functions over a business-as-usual (BaU) strategy that does not apply an intelligent resource planning.
Table 7 reports the execution times of the studied methods (in seconds). The proposed MOEA computes solutions efficiently, with execution times of around two minutes for all instances. While the greedy methods are faster, their results are not accurate. The execution times of the exact method were over two orders of magnitude higher than the execution time of the MOEA for instances AMPL1 to AMPL3, and over three orders of magnitude higher for instance AMPL4. These results demonstrate the efficiency of the proposed MOEA for computing accurate solutions with reduced execution times.
Table 7.
Execution times of the studied methods (in seconds).
Figure 3 presents the Pareto fronts generated by the studied methods for instances AMPL1 to AMPL4. The Pareto fronts were generated by gathering the nondominated solutions computed by each proposed optimization method in all the performed executions.
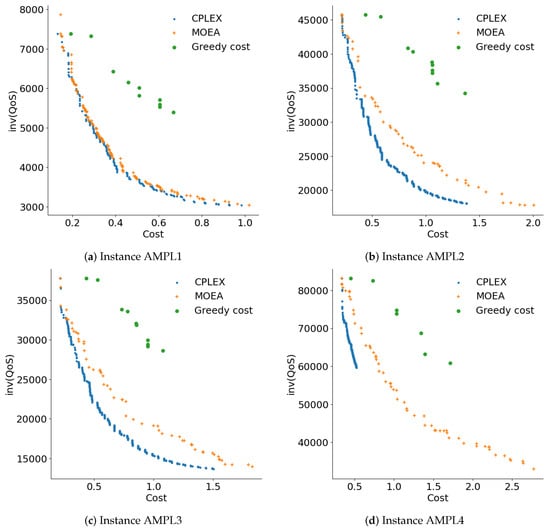
Figure 3.
Pareto fronts computed using the studied methods.
Figure 3 shows that the proposed MOEA generated more diverse Pareto fronts compared to greedy cost, which tended to concentrate on solutions with extreme cost values. The overall Pareto front for each instance consists of solutions from CPLEX and MOEA. Except for instance AMPL4, a significant portion of the reference Pareto front comprises solutions from CPLEX, followed by the MOEA, and finally the greedy methods. The MOEA managed to cover a wider range of solutions in the QoS component, particularly on instance AMPL4, where it formed the majority of the reference Pareto front. Figure 3d shows that CPLEX was unable to obtain feasible solutions with good QoS values for instance AMPL4.
Figure 4 presents the 25%, 50%, and 75% attainment surfaces of representative executions of the studied methods for instances AMPL1 to AMPL4. In general, the RHV and 50%-EAS results show that CPLEX struggled to cover a wide range of solutions in the QoS component, with greedy cost also facing this issue to a lesser extent. On the other hand, the MOEA stands out for its diverse solutions, being closer or directly forming the reference Pareto front when compared to the greedy method. In general, it can be concluded that the MOEA yields good results in the best solutions according to QoS.
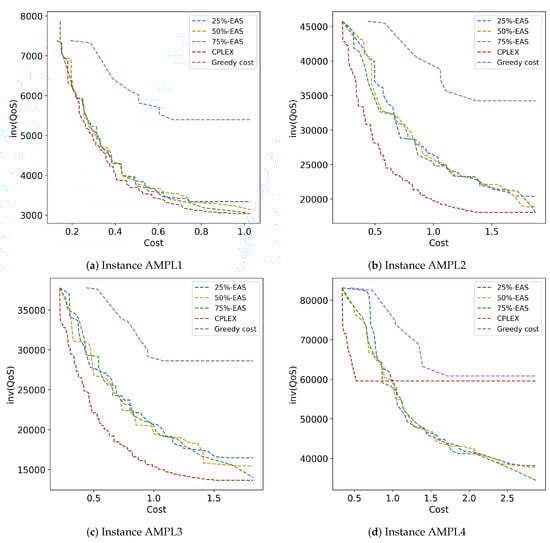
Figure 4.
Attainment surfaces computed by the studied methods for instances AMPL1 to AMPL4.
6.5.2. Comparison of Results for Instances That Are Not Solvable Using an Exact Method
Table 8 reports the RHV and 50%-EAS results, cost/inv(QoS) values (×103) of the compromise solution, and best solutions regarding each problem objective computed by each studied method.
Table 8.
Comparison of results, showing RHV, 50%-EAS, compromise solution, best cost solution, and best QoS solution using the studied methods for instances that are not exactly solvable.
The best values regarding cost and QoS are marked in bold. RHV results are also reported for the MOEA and greedy cost. Greedy QoS and round robin are not included in the RHV comparison, as they compute a single solution.
Regarding RHV values, the MOEA computed significantly better results than greedy cost; the average improvement was 34.7% and the best improvement in the large problem instances was 40.0%. Following the trend detected in the comparison between the MOEA and the CPLEX exact solver, the multiobjective evolutionary search showed proper convergence to the reference Pareto front; at the same time, the computed solutions showed good diversity. The RHV results were highly robust in all experiments, fulfilling the statistical significance criterion described in Section 6.1. Overall, the MOEA computed significantly better solutions than the greedy cost method.
The 50%-EAS results confirm that MOEA computed better solutions that the other methods, with significant improvements in both the proportion of the area where there is statistical confidence that MOEA solutions are undefeated by any other algorithm (U) and the proportion of the area where there is statistical confidence that the compared algorithm outperforms all other algorithms in terms of 50%-EAS values (B).
Regarding the best cost solutions, MOEA obtained the best cost for all instances. The MOEA was able to properly sample the region of the Pareto front associated with low cost values while maintaining accurate QoS values. The improvements provided by the MOEA were between 47.6% and 93.9%. Regarding the second-best greedy cost method, the improvements were between 47.6% and 90.4%. In absolute values, these improvements allow the cost to be reduced by between half (for small instance S2) and one sixth (for large instance L2) over the greedy cost heuristic. The best improvements were computed for the larger instances, demonstrating the scalability of the multiobjective evolutionary approach.
Regarding the best QoS solutions, the greedy QoS heuristic computed solutions with the same value of inv(QoS) and different cost values. Therefore, solutions with the same value of inv(QoS) turned out to be dominated and were removed from the solution set. The improvements provided by the MOEA were between 48.5% and 75.9%. Regarding the greedy QoS method, the improvements in cost were between 84.3% and 93.3%, and MOEA was slightly lower in QoS (between 0.1% and 1.99%). The best QoS values were computed for the larger instances, again demonstrating the scalability of the proposed MOEA.
For the compromise solutions, the MOEA significantly improved in both cost and QoS over the greedy cost and round robin techniques for all instances. When compared with greedy QoS, the MOEA only improved regarding the cost objective.
Figure 5 shows the Pareto fronts generated for instances that are not solvable by exact methods. The graphics show that the round robin technique generated a solution that is very far from the reference Pareto front. The reference Pareto front is composed by solutions computed by the MOEA plus a single nondominated solution computed by greedy QoS. MOEA was the technique with the greatest diversity of solutions. Regarding diversity, the second-best method was greedy cost; however, the graphics show that the computed solutions were not close to the reference Pareto front. In general terms, Figure 5 indicates that the MOEA generated more diverse and better quality solutions than the rest of the techniques studied in the comparative analysis.
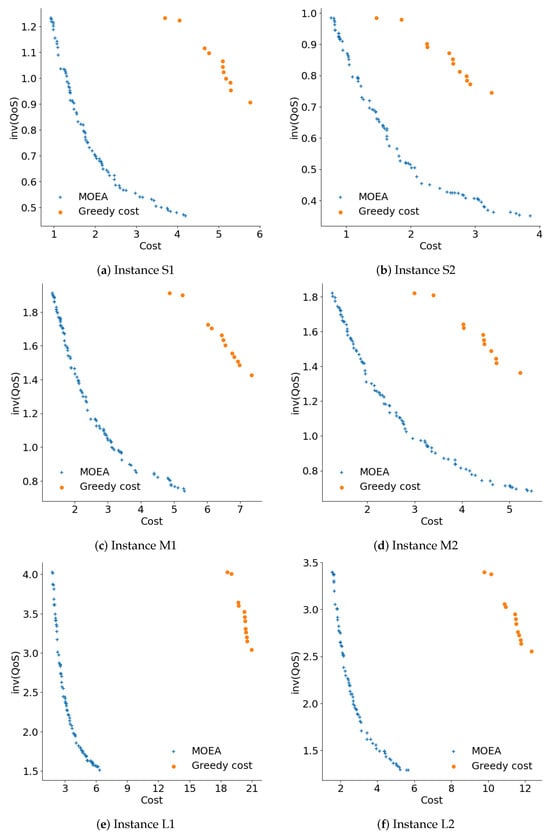
Figure 5.
Pareto fronts computed by the studied methods; inv(QoS) values are expressed in millions.
The diversity of the solutions computed by the MOEA captures different tradeoffs between the problem objectives. The diverse solutions provide different options for CDN design, allowing for fast deployment and configuration to fulfill specific QoS demands.
Overall, the comparative analysis allows us to conclude that the MOEA is able to compute accurate solutions that represent an improvement over baseline methods. The improvements on the cost objective stand out, where the MOEA is able to compute cost-effective solutions to the cloud-based CDN design problem. Improvements in QoS are also significant when considering that almost the same QoS of the greedy QoS method is obtained with a significantly lower cost. The most significant factor when comparing with other methods to solve the problem is that the MOEA shows a much greater diversity of solutions, with different tradeoffs between the problem objectives. These solutions provide different suggestions to decision-makers, allowing them to properly balance cost investments and inv(QoS) level according to specific needs.
Figure 6 presents the 25%, 50%, and 75% attainment surfaces of representative executions of the studied methods for the six instances solved in the comparative analysis.
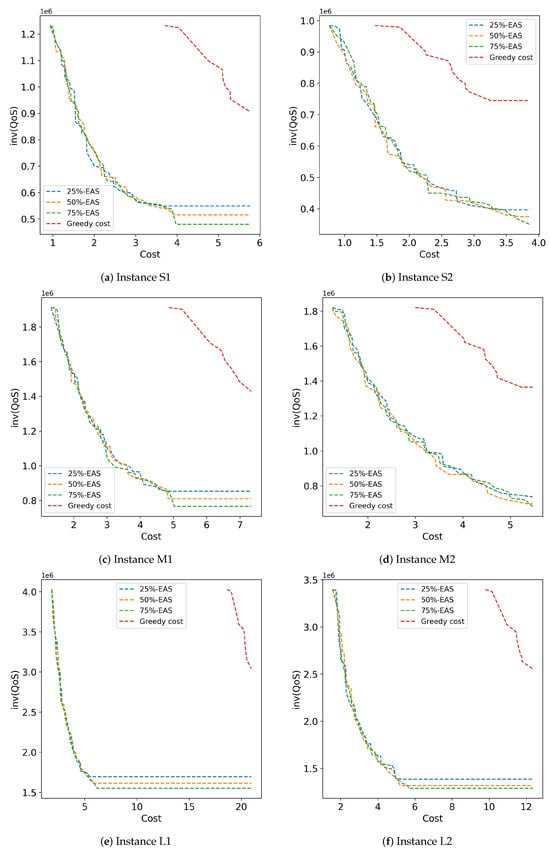
Figure 6.
Attainment surfaces computed by the studied methods for problem instances S1 to L2.
The MOEA demonstrates its ability to compute competitive results compared to well-known heuristics and exact solvers, and is integrable into online systems used to process real-time data. This study represents an essential first step before integrating the MOEA into an online framework. In addition to this, the contributions of this article also include managerial insights. By leveraging recurring demand patterns, the offline solutions obtained from the MOEA can provide decision-makers with valuable information on key problem parameters. For instance, the MOEA can help to identify the extreme values of system costs, the level of QoS provided to users, and the approximate range of both objectives in tradeoff solutions.
6.6. Comparison with Recent Related Works
The proposed MOEA obtains significant improvements in CDN design costs and QoS as evaluated by the RTT for accessing content. The improvements are comparable and in certain cases even better than those reported for similar problems in recent related works, especially considering that few articles have followed multiobjective approaches.
The cost improvements of the proposed MOEA (47.6% to 93.3%) are significantly better than the randomized online edge-renting algorithm presented by Jin et al. [37] (10.5% to 17.6% over BaU), taking advantage of the intelligent evolutionary exploration of the search space. QoS improvements (47.2%) were lower than those reported for the STARFRONT framework by Lai et al. [36], mainly because STARFRONT is heavily focused on reducing round-trip times (90% improvement over BaU) and does not optimize for cost.
The improvements of MOEA regarding QoS are not at good as the improvements reported for the unsupervised self-organizing map technique presented by Farahani et al. [38], which improved by over 59% in Quality of Experience (QoE). However, the self-organizing map approach does not optimize for design costs, and higher costs will eventually be required to guarantee the reported QoE improvements. When taking cost optimization into account, the MOEA provides better improvements compared to the greedy algorithm for joint cost/QoS optimization presented by the same authors [39] in terms of both QoS/Quality of Experience (QoE) (22% over the traditional CDN and hybrid P2P–CDN baseline methods) and cost (34% over baseline).
The cost improvement provided by the proposed MOEA is also significantly better than the improvement reported for the two-step machine learning optimization method by Yadav and Kar [40] (30% of improvement in overall cost of deployment and distribution), where QoS was not optimized but was included as constraint. Finally, the QoS improvement of the proposed MOEA over BaU is higher than that provided by the adaptive hybrid approach of Marri and Reddy [41] (19% to 25% improvement regarding upload capacity and startup delay), where no cost optimization was proposed.
The above comparison with recent related works allows us to conclude that the proposed MOEA is effective for the simultaneous optimization of cost and QoS in cloud-based CDN design. Table 9 summarizes the main aspects and results of the comparison.
Table 9.
Comparison with recent related works.
7. Conclusions
A reliable internet connection is essential for modern societies, driving an increasing number of everyday activities, particularly through mobile and wireless devices. Internet providers face the dual challenge of expanding services to accommodate more users while ensuring low-latency performance. To meet these demands, cloud-based CDNs have emerged as a key solution for constructing cost-efficient networks. By deploying servers in strategic locations and intelligently allocating content, CDNs enhance the speed and reliability of web content delivery while maintaining network cost efficiency. However, CDN design and content allocation must be carefully planned in order to minimize operational costs while ensuring high service quality for users.
In this context, the present article introduces an optimization model aimed at designing cloud-based CDNs that account for the demands of end users, content providers, and IaaS providers. The model simultaneously optimizes the operational costs of the virtual broker that manages the system and the QoS delivered to users. A tailored MOEA incorporating ad hoc solution representations and evolutionary operators is proposed to solve the cloud-based CDN problem. The performance of the proposed MOEA was benchmarked against three baseline heuristics and an exact solver based on an MILP formulation. Experimental results on real-world instances highlight the effectiveness of the proposed MOEA, which consistently produced accurate and diverse solutions. The proposed MOEA outperformed the exact solver for small problem instances and yielded significantly better results than baseline heuristic algorithms focused solely on cost or QoS optimization. In addition, the MOEA generated more diverse Pareto fronts compared to the heuristics, which tended to concentrate on solutions with extreme objective values. In terms of the RHV metric, the MOEA achieved an average improvement of 34.7% over the baseline heuristics. Significant improvement were also obtained regarding the 50%-EAS metric. Cost reductions ranged between 47.6% and 93.3%, while QoS levels remained highly accurate, improving by 47.2% over BaU.
Future work will focus on expanding the problem instances to create a more diverse and complex test environment. The online variant of the problem should also be studied further in order to enhance the applicability of the proposed approach. Incorporating historical traffic data and refining the QoS function by including factors such as network bandwidth in addition to RTT could enhance the precision of the model. This would provide a deeper understanding of the effectiveness of the model and lead to more realistic solutions. Additionally, efforts will be directed towards improving the efficiency of the proposed algorithm to enable real-time online execution, complementing the current offline approach.
This research was developed under the replicable research paradigm. Source code and data are available in the GitHub repository https://github.com/gerardogoni20170819/CDN_CLOUD (accessed on 29 December 2024). Details about the research are also reported on the website https://www.fing.edu.uy/inco/grupos/cecal/hpc/DRCC/ (accessed on 29 December 2024).
Author Contributions
Conceptualization, S.N.; methodology, S.N. and G.G.; software, G.G.; validation, G.G., S.N., D.R., P.M.-B. and A.T.; formal analysis, S.N. and A.T.; investigation, G.G., S.N., D.R. and P.M.-B.; resources, G.G. and S.N.; data curation, G.G.; writing—original draft preparation, G.G., S.N., D.R., P.M.-B. and A.T.; writing—review and editing, G.G., S.N., D.R., P.M.-B. and A.T.; visualization, G.G., S.N., D.R. and P.M.-B.; supervision, S.N.; project administration, G.G. and S.N. All authors have read and agreed to the published version of the manuscript.
Funding
This research received no external funding.
Data Availability Statement
Data and results are available upon request.
Conflicts of Interest
The authors declare no conflicts of interest.
References
- Zolfaghari, B.; Srivastava, G.; Roy, S.; Nemati, H.; Afghah, F.; Koshiba, T.; Razi, A.; Bibak, K.; Mitra, P.; Rai, B. Content delivery networks: State of the art, trends, and future roadmap. ACM Comput. Surv. 2020, 53, 34. [Google Scholar] [CrossRef]
- Vakali, A.; Pallis, G. Content delivery networks: Status and trends. IEEE Internet Comput. 2003, 7, 68–74. [Google Scholar] [CrossRef]
- Salahuddin, M.; Sahoo, J.; Glitho, R.; Elbiaze, H.; Ajib, W. A survey on content placement algorithms for cloud-based content delivery networks. IEEE Access 2017, 6, 91–114. [Google Scholar] [CrossRef]
- Nesmachnow, S.; Iturriaga, S.; Dorronsoro, B. Efficient Heuristics for Profit Optimization of Virtual Cloud Brokers. IEEE Comput. Intell. Mag. 2015, 10, 33–43. [Google Scholar] [CrossRef]
- Drezner, Z.; Hamacher, H.W. (Eds.) Facility Location: Applications and Theory; Springer: Berlin/Heidelberg, Germany, 2004. [Google Scholar]
- Nesmachnow, S. An overview of metaheuristics: Accurate and efficient methods for optimisation. Int. J. Metaheuristics 2014, 3, 320–347. [Google Scholar] [CrossRef]
- Goñi, G.; Nesmachnow, S.; Chernykh, A. Design of Content Distribution Networks for smart cities. In Smart Cities; Springer Nature: Cham, Switzerland, 2025; pp. 267–281. [Google Scholar]
- Buyya, R.; Broberg, J.; Goscinski, A. Cloud Computing: Principles and Paradigms; Wiley Series on Parallel and Distributed Computing; Wiley: Hoboken, NJ, USA, 2010. [Google Scholar] [CrossRef]
- Papagianni, C.; Leivadeas, A.; Papavassiliou, S. A cloud-oriented content delivery network paradigm: Modeling and assessment. IEEE Trans. Dependable Secur. Comput. 2013, 10, 287–300. [Google Scholar] [CrossRef]
- Mattess, M.; Vecchiola, C.; Garg, S.K.; Buyya, R. Cloud Bursting: Managing Peak Loads by Leasing Public Cloud Services. In Cloud Computing; CRC Press: Boca Raton, FL, USA, 2017; pp. 343–367. [Google Scholar] [CrossRef]
- Wang, M.; Jayaraman, P.; Ranjan, R.; Mitra, K.; Zhang, M.; Li, E.; Khan, S.; Pathan, M.; Georgeakopoulos, D. An overview of cloud based content delivery networks: Research dimensions and state-of-the-art. In Transactions on Large-Scale Data-and Knowledge-Centered Systems XX; Springer: Berlin/Heidelberg, Germany, 2015; pp. 131–158. [Google Scholar] [CrossRef]
- Xiao, W.; Bao, W.; Zhu, X.; Wang, C.; Chen, L.; Yang, L.T. Dynamic request redirection and resource provisioning for cloud-based video services under heterogeneous environment. IEEE Trans. Parallel Distrib. Syst. 2016, 27, 1954–1967. [Google Scholar] [CrossRef]
- Gao, G.; Zhang, W.; Wen, Y.; Wang, Z.; Zhu, W. Towards Cost-Efficient Video Transcoding in Media Cloud: Insights Learned from User Viewing Patterns. IEEE Trans. Multimed. 2015, 17, 1286–1296. [Google Scholar] [CrossRef]
- Hu, M.; Luo, J.; Wang, Y.; Veeravalli, B. Practical resource provisioning and caching with dynamic resilience for cloud-based content distribution networks. IEEE Trans. Parallel Distrib. Syst. 2014, 25, 2169–2179. [Google Scholar] [CrossRef]
- Jokhio, F.; Ashraf, A.; Lafond, S.; Lilius, J. A Computation and Storage Trade-off Strategy for Cost-Efficient Video Transcoding in the Cloud. In Proceedings of the 2013 39th Euromicro Conference on Software Engineering and Advanced Applications, Santander, Spain, 4–6 September 2013; pp. 365–372. [Google Scholar] [CrossRef]
- Zhang, J.; Huang, H.; Wang, X. Resource provision algorithms in cloud computing: A survey. J. Netw. Comput. Appl. 2016, 64, 23–42. [Google Scholar] [CrossRef]
- Baruwal Chhetri, M.; Chichin, S.; Bao Vo, Q.; Kowalczyk, R. Smart Cloud Broker: Finding your home in the clouds. In Proceedings of the 2013 28th IEEE/ACM International Conference on Automated Software Engineering (ASE), Silicon Valley, CA, USA, 11–15 November 2013; pp. 698–701. [Google Scholar] [CrossRef]
- Landa, R.; Araujo, J.; Clegg, R.; Mykoniati, E.; Griffin, D.; Rio, M. The large-scale geography of Internet round trip times. In Proceedings of the 2013 IFIP Networking Conference, Brooklyn, NY, USA, 22–24 May 2013; pp. 1–9. [Google Scholar]
- Candela, M.; Kisteleki, R.; Aben, E.; Homburg, P.; Beest, J.; Amin, C.; Strikos, A.; Queen, D.; Antony, A. RIPE Atlas: A Global Internet Measurement Network. Internet Protoc. J. 2015, 18, 3. [Google Scholar]
- Agmon, O.; Ben, M.; Schuster, A.; Tsafrir, D. Deconstructing Amazon EC2 spot instance pricing. ACM Trans. Econ. Comput. 2013, 1, 16. [Google Scholar] [CrossRef]
- Massey, F.J. The Kolmogorov-Smirnov test for goodness of fit. J. Am. Stat. Assoc. 1951, 46, 68–78. [Google Scholar] [CrossRef]
- Iturriaga, S.; Nesmachnow, S.; Goñi, G.; Dorronsoro, B.; Tchernykh, A. Evolutionary Algorithms for Optimizing Cost and QoS on Cloud-based Content Distribution Networks. Program. Comput. Softw. 2019, 45, 544–556. [Google Scholar] [CrossRef]
- Zheng, Z.; Zheng, Z. Towards an improved heuristic genetic algorithm for static content delivery in cloud storage. Comput. Electr. Eng. 2018, 69, 422–434. [Google Scholar] [CrossRef]
- Iturriaga, S.; Goñi, G.; Nesmachnow, S.; Dorronsoro, B.; Tchernykh, A. Cost and QoS Optimization of Cloud-Based Content Distribution Networks Using Evolutionary Algorithms. In Proceedings of the High Performance Computing, Bucaramanga, Colombia, 26–28 September 2018; Meneses, E., Castro, H., Barrios Hernández, C.J., Ramos-Pollan, R., Eds.; Springer: Cham, Awitzerland, 2019; pp. 293–306. [Google Scholar] [CrossRef]
- Stephanakis, I.; Logothetis, D. Evolutionary Algorithm Optimization of Edge Delivery Sites in Next Generation Multi-service Content Distribution Networks. In Proceedings of the Engineering Applications of Neural Networks, Corfu, Greece, 15–18 September 2011; Iliadis, L., Jayne, C., Eds.; Springer: Berlin/Heidelberg, Germany, 2011; pp. 192–202. [Google Scholar] [CrossRef]
- Bektaş, T.; Cordeau, J.F.; Erkut, E.; Laporte, G. A two-level simulated annealing algorithm for efficient dissemination of electronic content. J. Oper. Res. Soc. 2008, 59, 1557–1567. [Google Scholar] [CrossRef]
- Ellouze, S.; Mathieu, B.; Lemlouma, T. A bidirectional network collaboration interface for CDNs and Clouds services traffic optimization. In Proceedings of the 2013 IEEE International Conference on Communications (ICC), Budapest, Hungary, 9–13 June 2013; pp. 3592–3596. [Google Scholar] [CrossRef]
- Mangili, M.; Martignon, F.; Capone, A. A comparative study of Content-Centric and Content-Distribution Networks: Performance and bounds. In Proceedings of the 2013 IEEE Global Communications Conference (GLOBECOM), Atlanta, GA, USA, 9–13 December 2013; pp. 1403–1409. [Google Scholar] [CrossRef]
- Coppens, J.; Wauters, T.; de Turck, F.; Dhoedt, B.; Demeester, P. Design and Performance of a Self-Organizing Adaptive Content Distribution Network. In Proceedings of the 2006 IEEE/IFIP Network Operations and Management Symposium NOMS 2006, Vancouver, BC, Canada, 3–7 April 2006; pp. 534–545. [Google Scholar] [CrossRef]
- Cevallos Moreno, J.F.; Sattler, R.; Caulier Cisterna, R.P.; Ricciardi Celsi, L.; Sánchez Rodríguez, A.; Mecella, M. Online Service Function Chain Deployment for Live-Streaming in Virtualized Content Delivery Networks: A Deep Reinforcement Learning Approach. Future Internet 2021, 13, 278. [Google Scholar] [CrossRef]
- Karaata, M.; Al-Mutairi, A.; Alsubaihi, S. Multipath Routing Over Star Overlays for Quality of Service Enhancement in Hybrid Content Distribution Peer-to-Peer Networks. IEEE Access 2022, 10, 7042–7058. [Google Scholar] [CrossRef]
- Bęben, A.; Batalla, J.M.; Chai, W.K.; Śliwiński, J. Multi-criteria decision algorithms for efficient content delivery in content networks. Ann. Telecommun.—Ann. Télécommun. 2013, 68, 153–165. [Google Scholar] [CrossRef]
- Neves, T.; Ochi, L.; Albuquerque, C. A new hybrid heuristic for replica placement and request distribution in content distribution networks. Optim. Lett. 2015, 9, 677–692. [Google Scholar] [CrossRef]
- Khansoltani, A.; Jamali, S.; Fotohi, R. A Request Redirection Algorithm in Content Delivery Network: Using PROMETHEE Approach. Wirel. Pers. Commun. 2022, 126, 1145–1175. [Google Scholar] [CrossRef]
- Jabraili, H.; Yousefi, S.; Boukani, B.; Rad, M.B. Replication based on objects iteration frequency and load using a genetic algorithm under a content distribution network. In Proceedings of the 2013 21st Iranian Conference on Electrical Engineering (ICEE), Mashhad, Iran, 14–16 May 2013; pp. 1–6. [Google Scholar] [CrossRef]
- Lai, Z.; Li, H.; Zhang, Q.; Wu, Q.; Wu, J. Cooperatively Constructing Cost-Effective Content Distribution Networks upon Emerging Low Earth Orbit Satellites and Clouds. In Proceedings of the 2021 IEEE 29th International Conference on Network Protocols (ICNP), Dallas, TX, USA, 1–5 November 2021; pp. 1–12. [Google Scholar] [CrossRef]
- Jin, Z.; Pan, L.; Liu, S. Randomized online edge service renting: Extending cloud-based CDN to edge environments. Knowl.-Based Syst. 2022, 257, 109957. [Google Scholar] [CrossRef]
- Farahani, R.; Bentaleb, A.; Çetinkaya, E.; Timmerer, C.; Zimmermann, R.; Hellwagner, H. Hybrid P2P-CDN Architecture for Live Video Streaming: An Online Learning Approach. In Proceedings of the GLOBECOM 2022—2022 IEEE Global Communications Conference, Rio de Janeiro, Brazil, 4–8 December 2022; pp. 1911–1917. [Google Scholar] [CrossRef]
- Farahani, R.; Çetinkaya, E.; Timmerer, C.; Shojafar, M.; Ghanbari, M.; Hellwagner, H. ALIVE: A Latency- and Cost-Aware Hybrid P2P-CDN Framework for Live Video Streaming. IEEE Trans. Netw. Serv. Manag. 2024, 21, 1561–1580. [Google Scholar] [CrossRef]
- Yadav, P.; Kar, S. Efficient Content Distribution in Fog-Based CDN: A Joint Optimization Algorithm for Fog-Node Placement and Content Delivery. IEEE Internet Things J. 2024, 11, 16578–16590. [Google Scholar] [CrossRef]
- Marri, S.; Reddy, P.C. Deep Temporal LSTM Regression Network (DTLR-Net) Model for Optimizing Quality of Video Streaming Quality in CDN-P2P Model. IEEE Access 2025, 13, 42521–42529. [Google Scholar] [CrossRef]
- Deb, K.; Agrawal, S.; Pratap, A.; Meyarivan, T. A Fast Elitist Non-dominated Sorting Genetic Algorithm for Multi-objective Optimization: NSGA-II. In Proceedings of the Parallel Problem Solving from Nature PPSN VI, Paris, France, 18–20 September 2000; Schoenauer, M., Deb, K., Rudolph, G., Yao, X., Lutton, E., Merelo, J.J., Schwefel, H.P., Eds.; Springer: Berlin/Heidelberg, Germany, 2000; pp. 849–858. [Google Scholar] [CrossRef]
- Srinivas, N.; Deb, K. Muiltiobjective Optimization Using Nondominated Sorting in Genetic Algorithms. Evol. Comput. 1994, 2, 221–248. [Google Scholar] [CrossRef]
- Durillo, J.; Nebro, A. JMetal: A Java framework for multi-objective optimization. Adv. Eng. Softw. 2011, 42, 760–771. [Google Scholar] [CrossRef]
- Fourer, R.; Gay, D.M.; Kernighan, B.W. A Modeling Language for Mathematical Programming. Manag. Sci. 1990, 36, 519–554. [Google Scholar] [CrossRef]
- Rossit, D.G.; Toutouh, J.; Nesmachnow, S. Exact and heuristic approaches for multi-objective garbage accumulation points location in real scenarios. Waste Manag. 2020, 105, 467–481. [Google Scholar] [CrossRef]
- Deb, K.; Pratap, A.; Agarwal, S.; Meyarivan, T. A fast and elitist multiobjective genetic algorithm: NSGA-II. IEEE Trans. Evol. Comput. 2002, 6, 182–197. [Google Scholar] [CrossRef]
- Coello Coello, C.A.; Lamont, G.B.; Van Veldhuizen, D.A. Evolutionary Algorithms for Solving Multi-Objective Problems; Springer: New York, NY, USA, 2007. [Google Scholar] [CrossRef]
- Knowles, J. A summary-attainment-surface plotting method for visualizing the performance of stochastic multiobjective optimizers. In Proceedings of the 5th International Conference on Intelligent Systems Design and Applications, Warsaw, Poland, 8–10 September 2005; IEEE: Piscataway, NJ, USA, 2005. [Google Scholar] [CrossRef]
- Knowles, J.; Corne, D. Approximating the Nondominated Front Using the Pareto Archived Evolution Strategy. Evol. Comput. 2000, 8, 149–172. [Google Scholar] [CrossRef] [PubMed]
- Katsaros, K.V.; Xylomenos, G.; Polyzos, G.C. GlobeTraff: A Traffic Workload Generator for the Performance Evaluation of Future Internet Architectures. In Proceedings of the 2012 5th International Conference on New Technologies, Mobility and Security (NTMS), Istanbul, Turkey, 7–10 May 2012; pp. 1–5. [Google Scholar] [CrossRef]
- Cisco. Cisco Visual Networking Index: Global Mobile Data Traffic Forecast Update, 2015–2020; Technical Report C11-738429-00; Cisco: San Jose, CA, USA, 2016. [Google Scholar]
- Nesmachnow, S.; Iturriaga, S. Cluster-UY: Collaborative Scientific High Performance Computing in Uruguay. In Supercomputing; Torres, M., Klapp, J., Eds.; Communications in Computer and Information Science; Springer: Cham, Switzerland, 2019; pp. 188–202. [Google Scholar] [CrossRef]

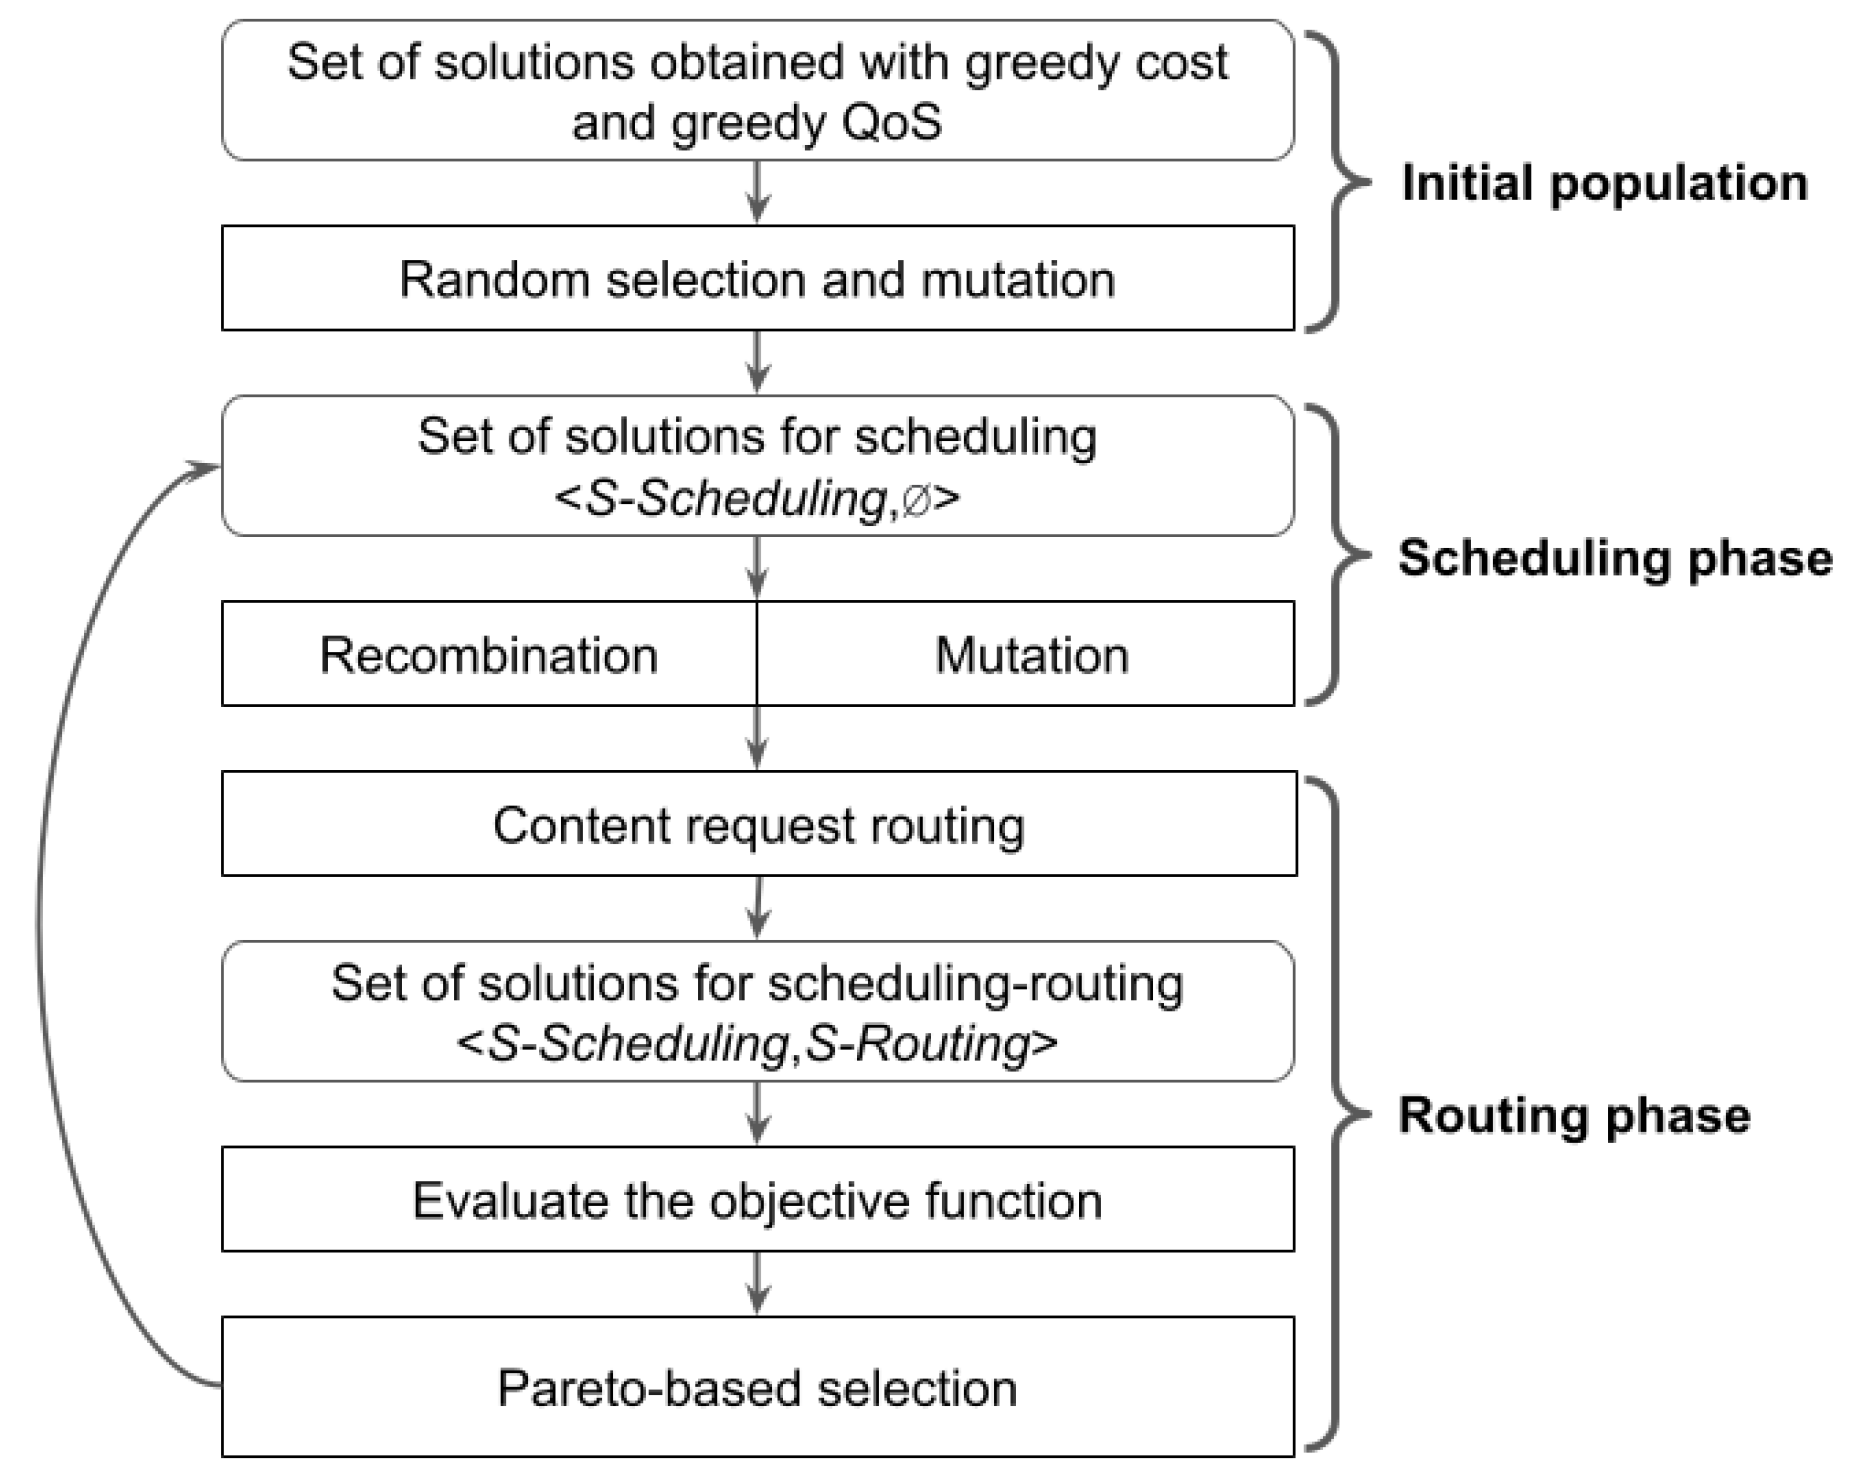
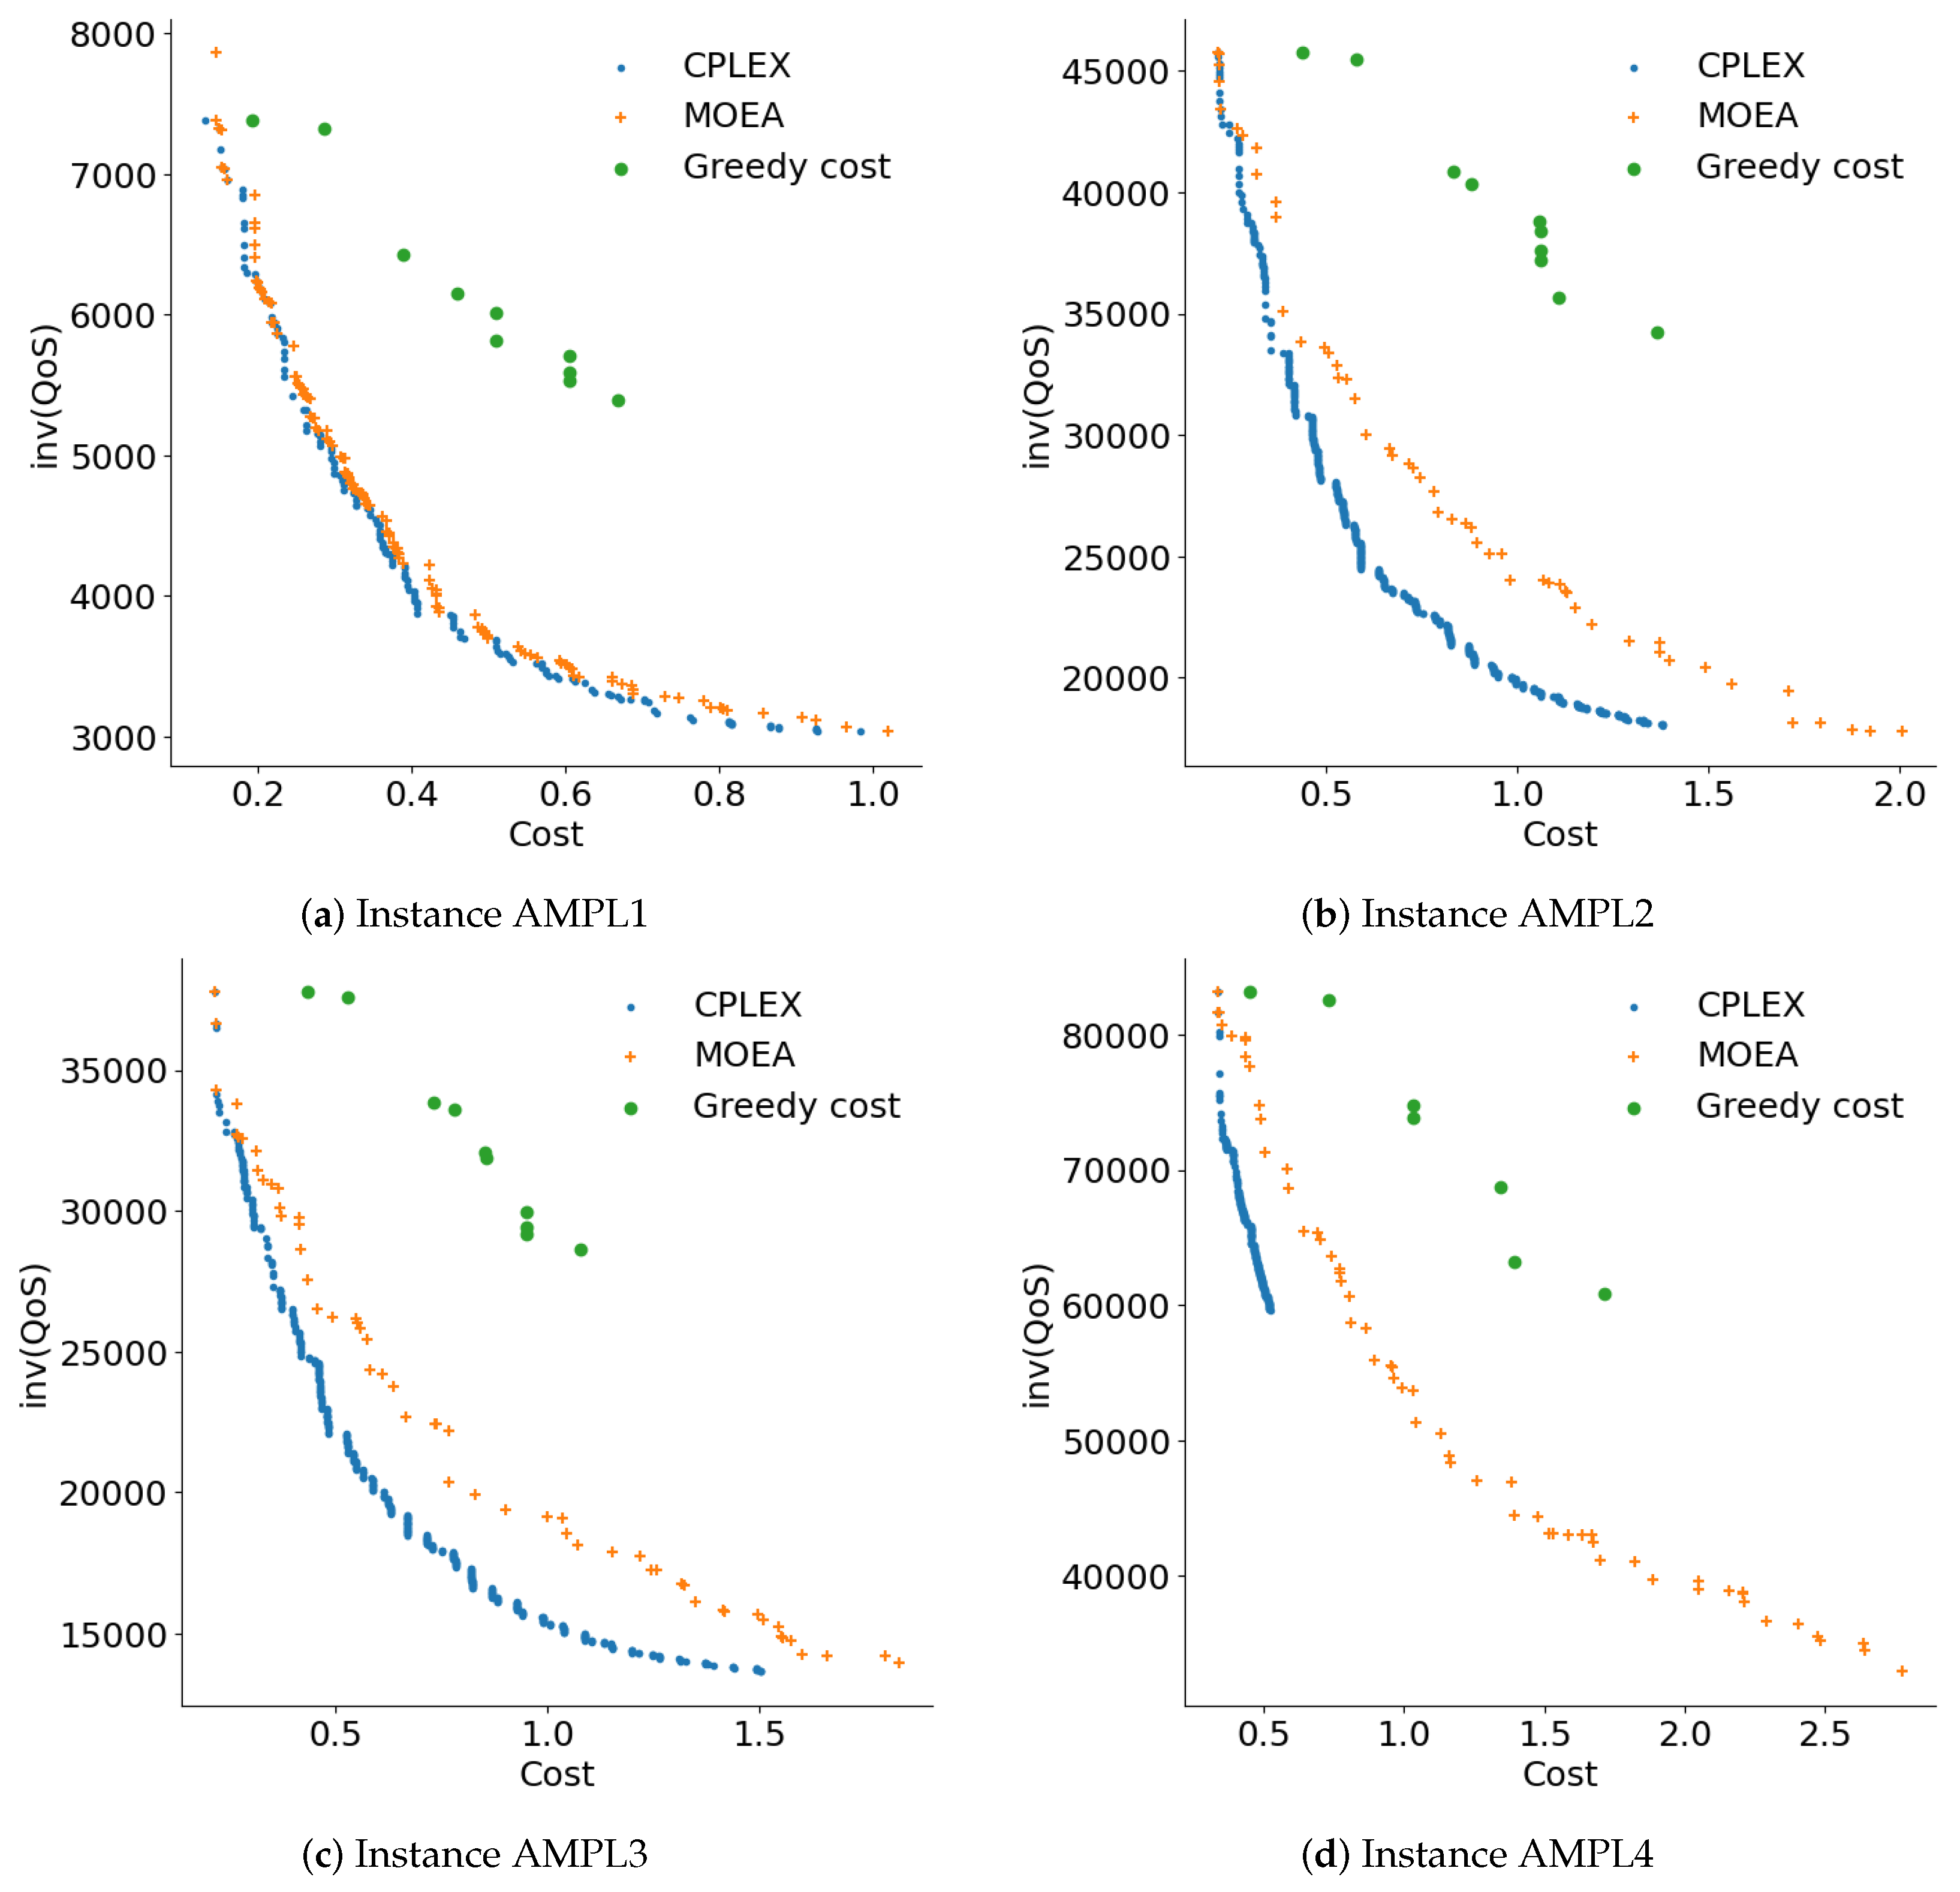
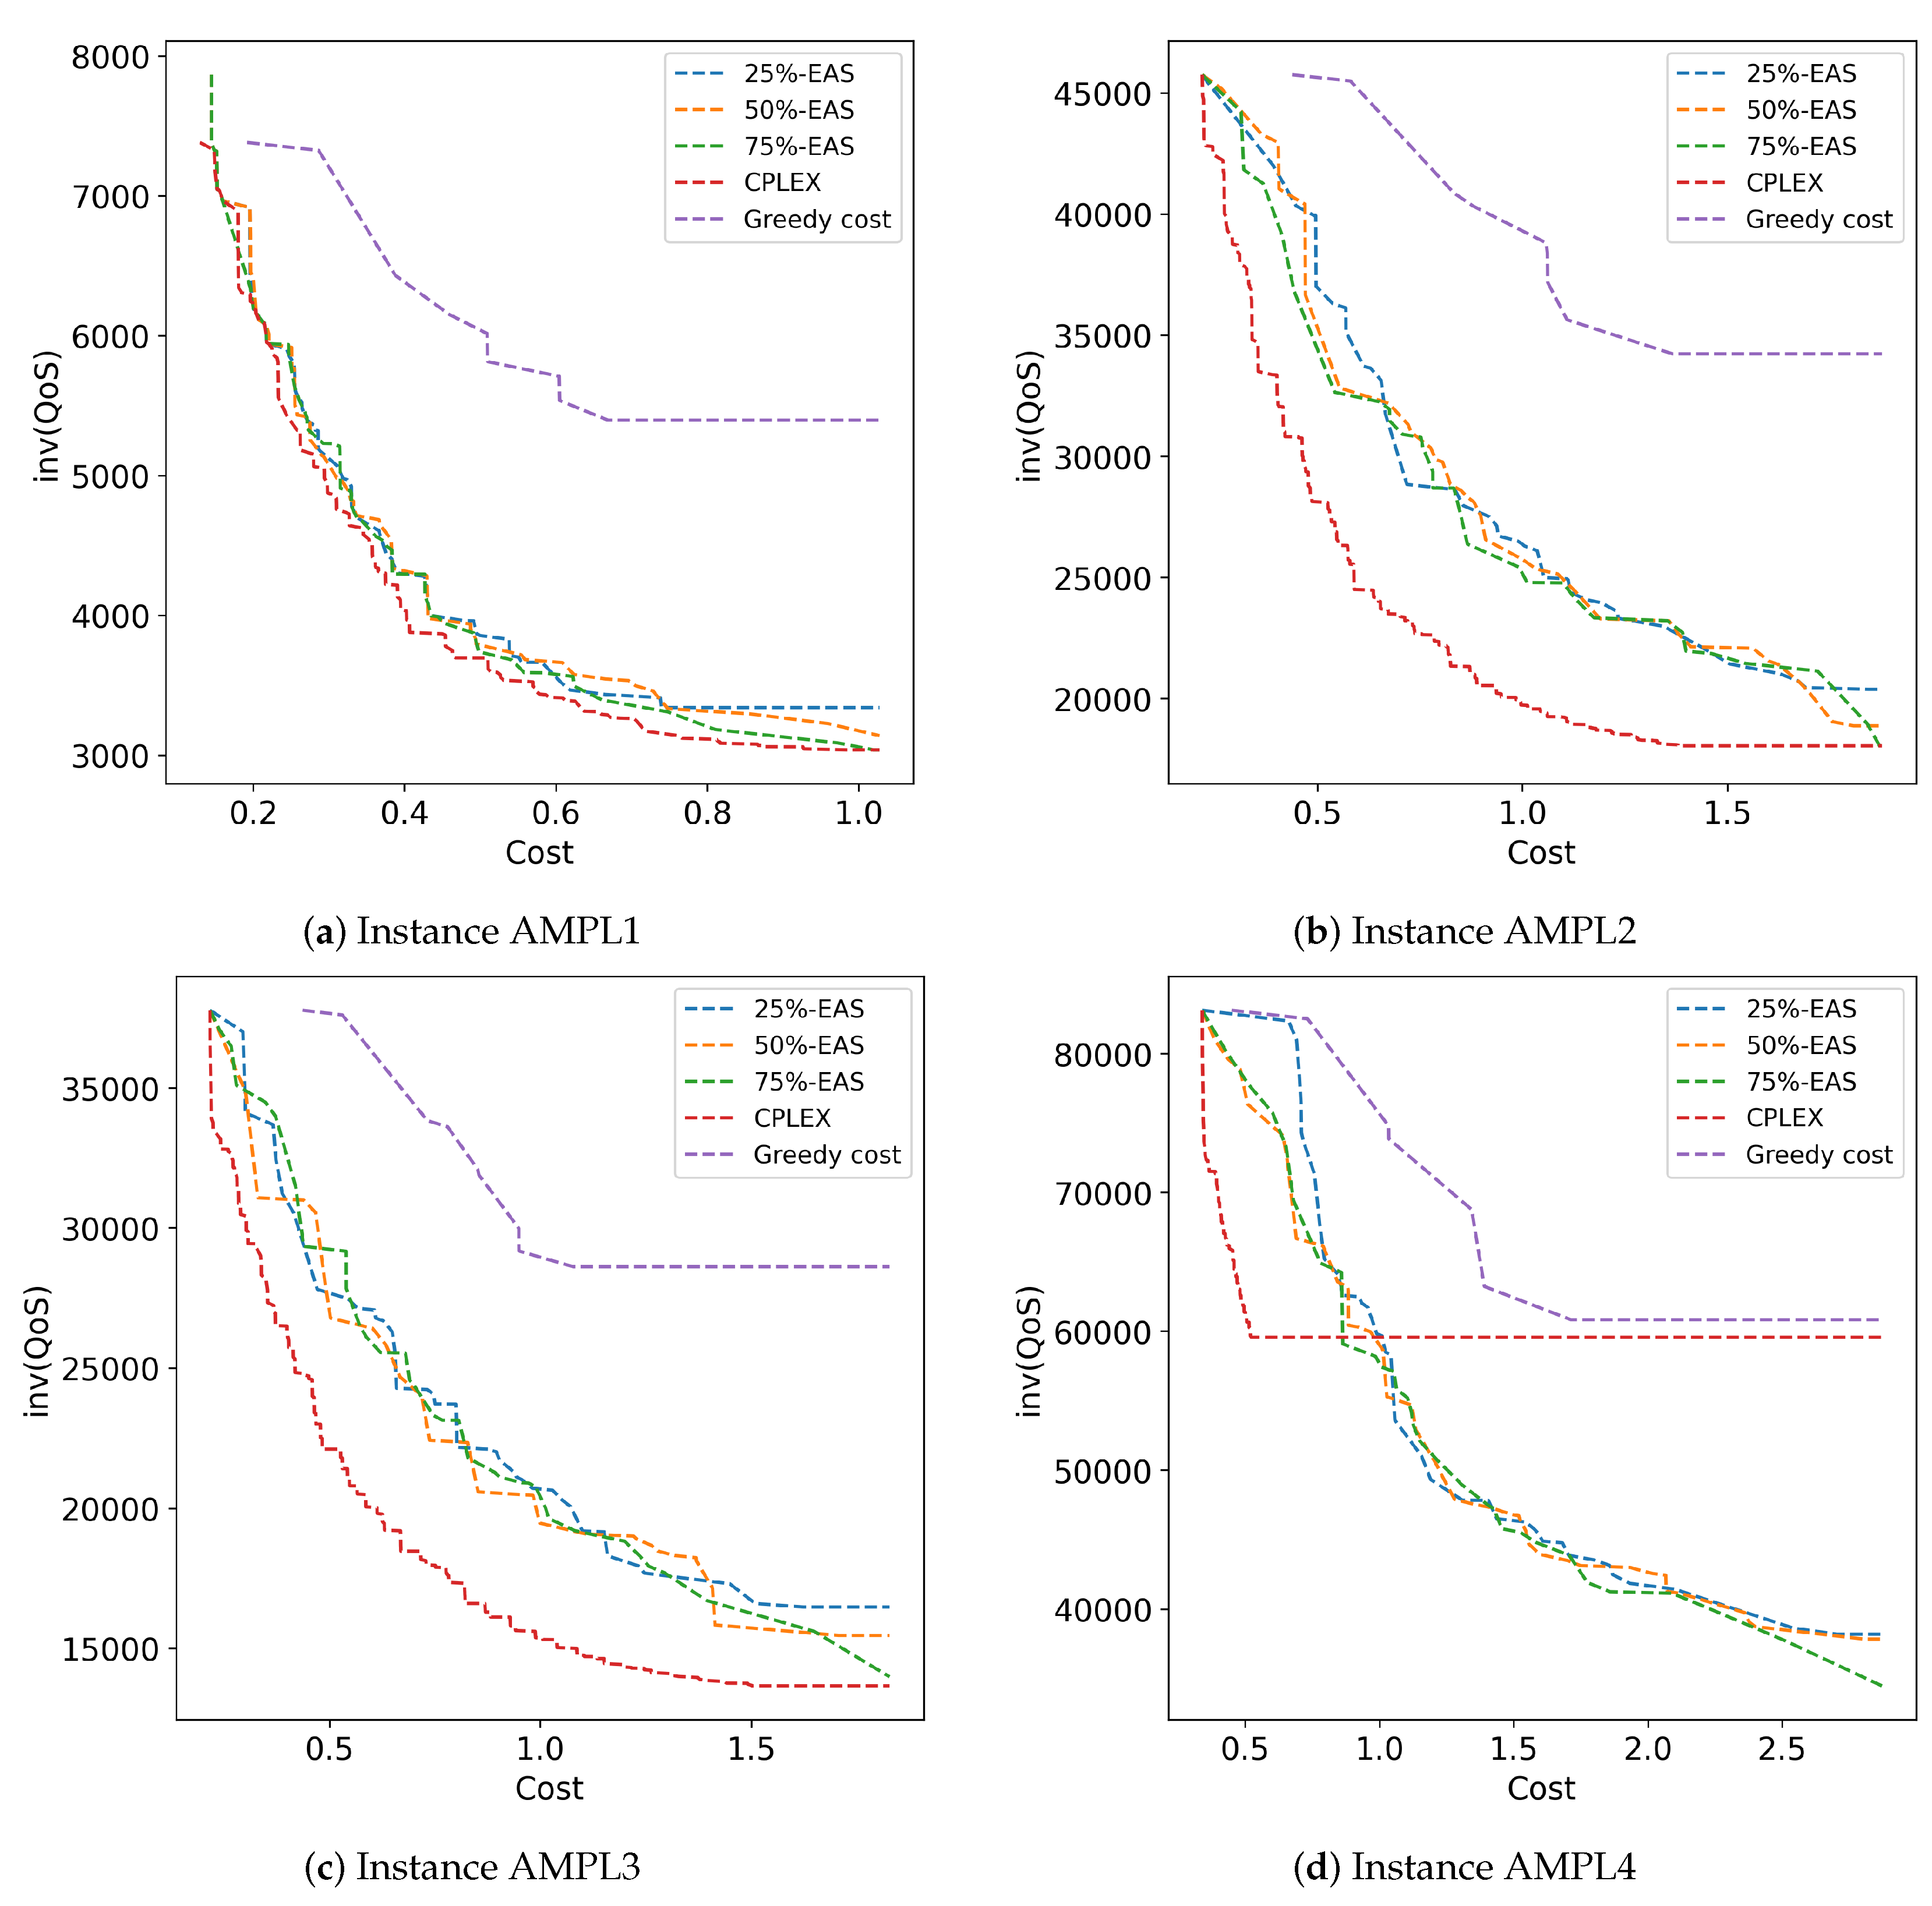
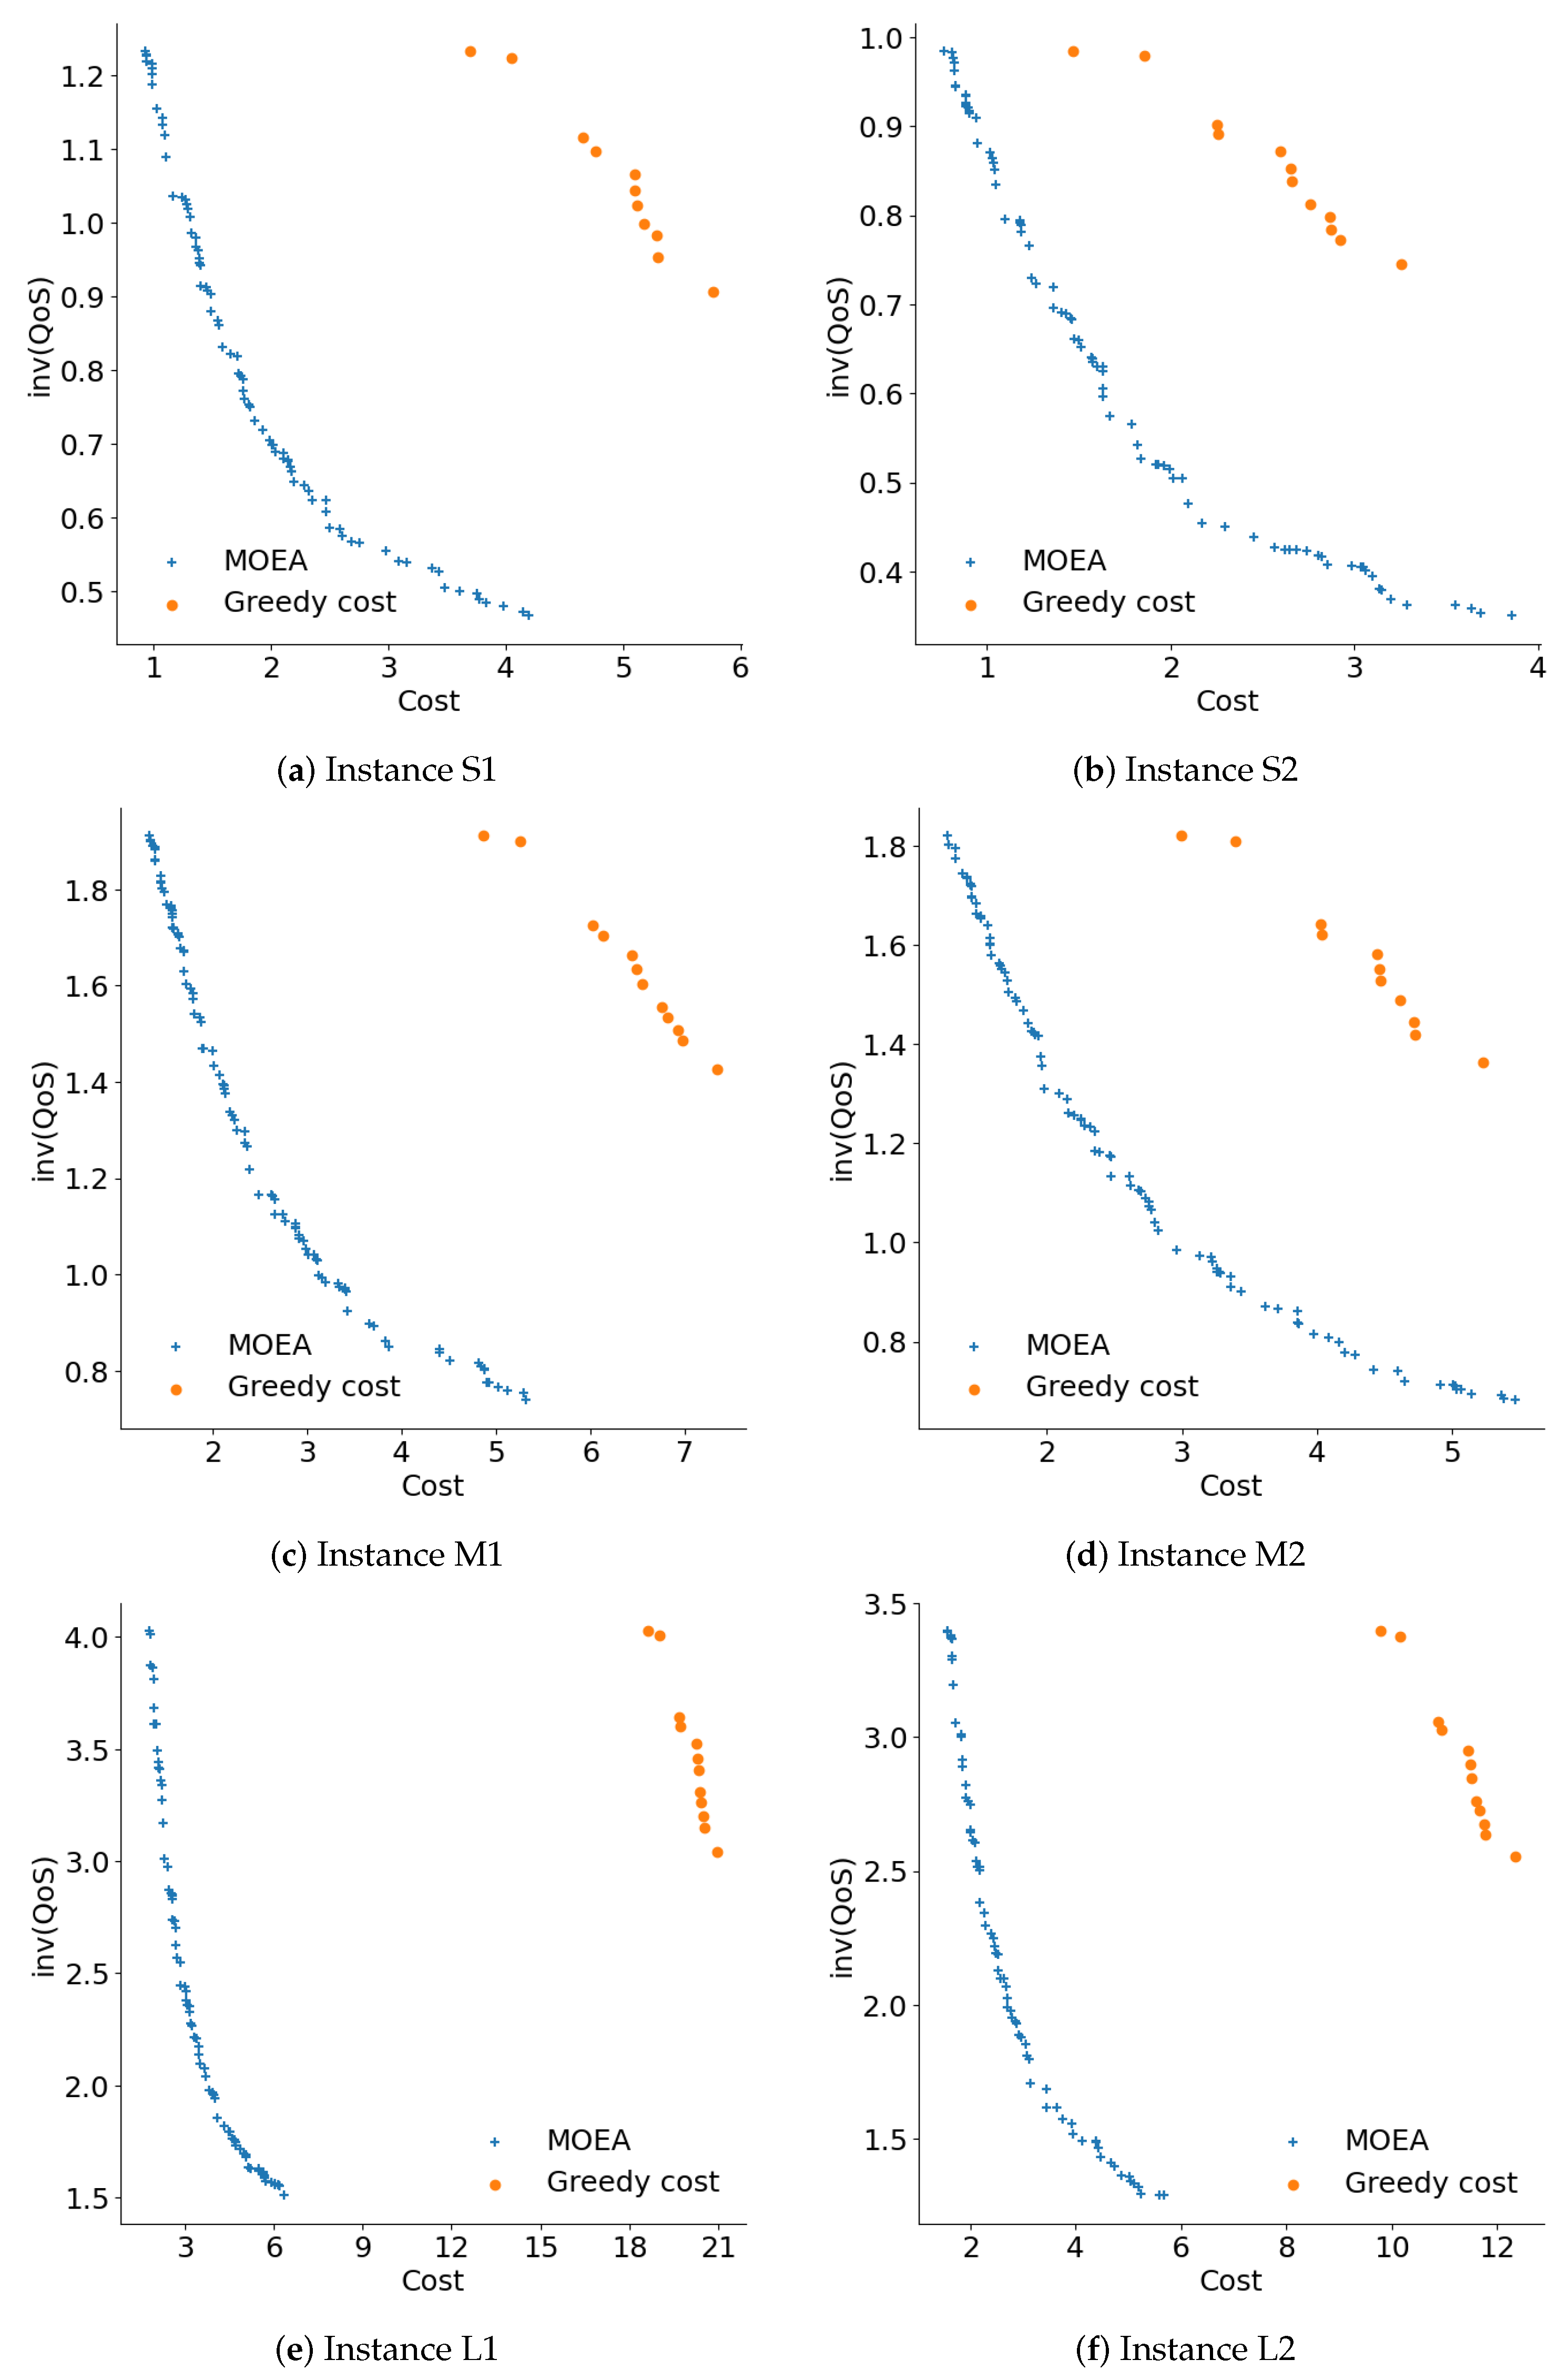
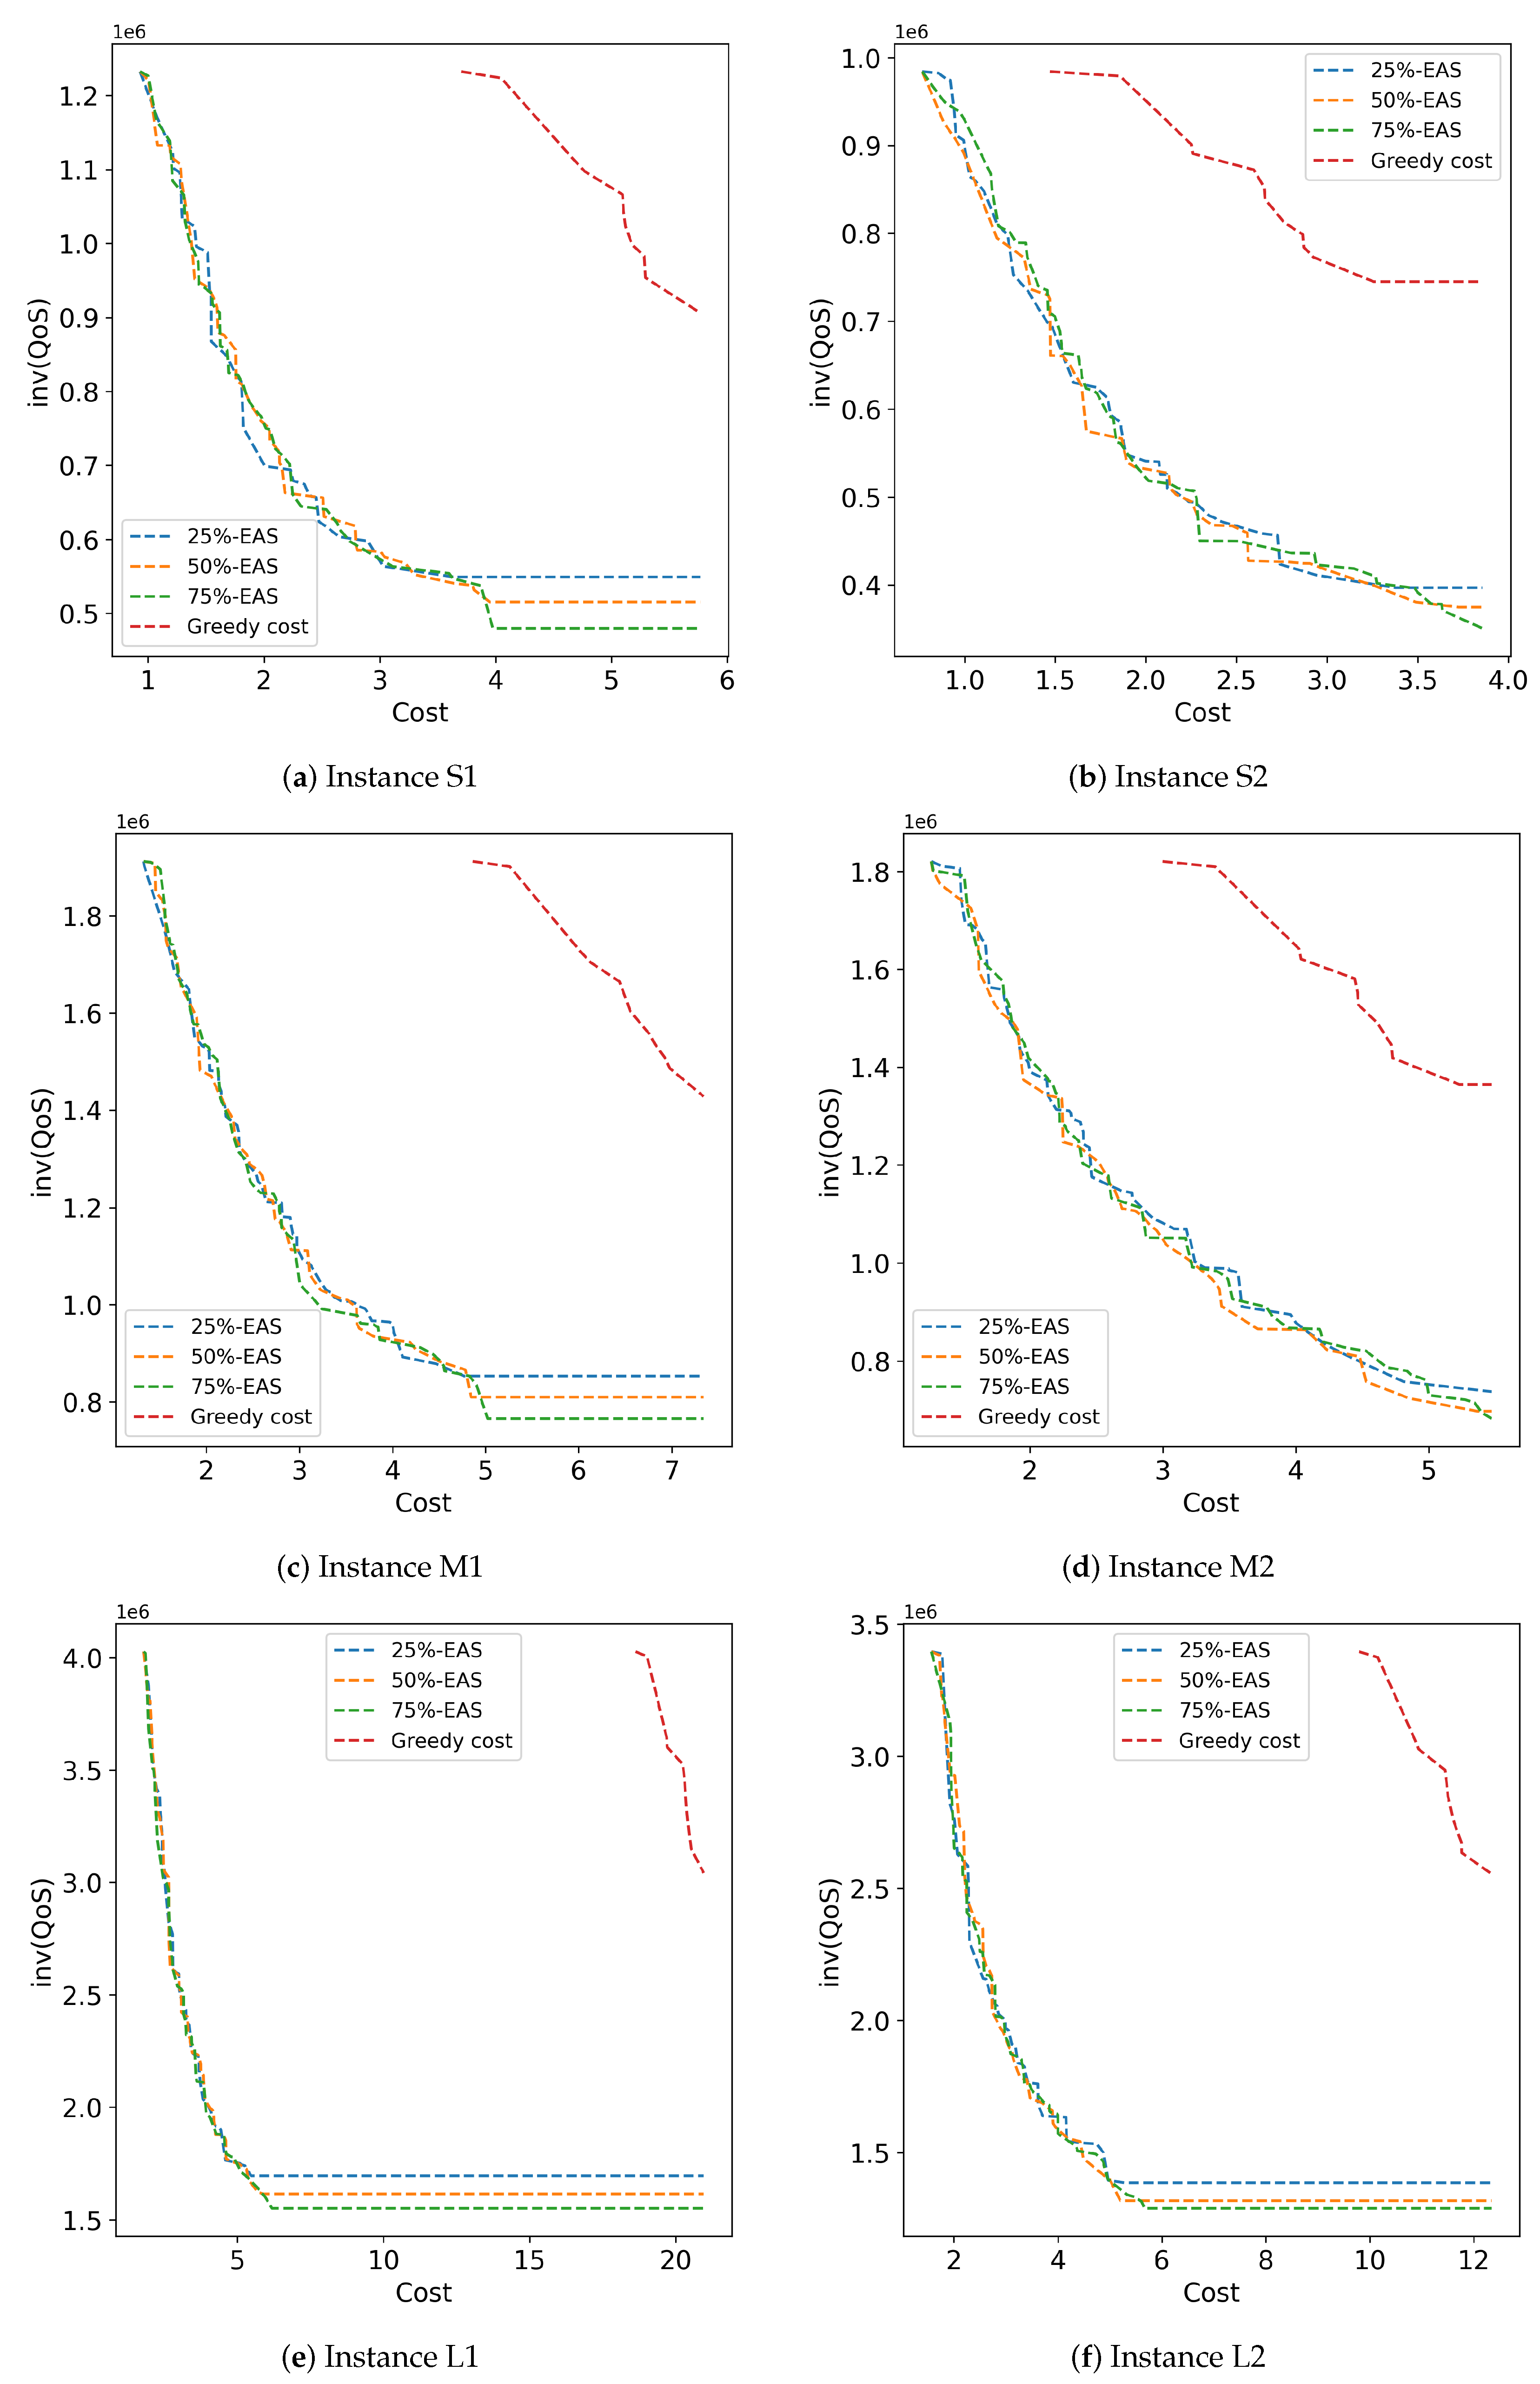
Disclaimer/Publisher’s Note: The statements, opinions and data contained in all publications are solely those of the individual author(s) and contributor(s) and not of MDPI and/or the editor(s). MDPI and/or the editor(s) disclaim responsibility for any injury to people or property resulting from any ideas, methods, instructions or products referred to in the content. |
© 2025 by the authors. Licensee MDPI, Basel, Switzerland. This article is an open access article distributed under the terms and conditions of the Creative Commons Attribution (CC BY) license (https://creativecommons.org/licenses/by/4.0/).