Identification of Browning in Human Adipocytes by Partial Least Squares Regression (PLSR), Infrared Spectral Biomarkers, and Partial Least Squares Discriminant Analysis (PLS-DA) Using FTIR Spectroscopy
Abstract
:1. Introduction
2. Materials and Methods
2.1. Human Adipose-Derived Stem Cell Culture and Differentiation
2.2. Oil-Red-O Staining
2.3. Quantitative Reverse Transcription PCR (qRT-PCR) Analysis
2.4. Preparation and Collection of FTIR Spectra
2.5. Partial Least-Squares Regression (PLSR) and Partial Least-Squares Discriminant Analysis (PLS-DA) Modeling
| PLSR for Objective | No. of Spectra from 3 Tests (n = 3) | Used Wavenumbers | Pre-Treatment | Input Value | Predicted Value | Peaks in Pre-Processed Spectra Used for PLSR | R2 a | RMSECV b | RPD c | Comment |
|---|---|---|---|---|---|---|---|---|---|---|
| hBA | 15 (hWA), 12 (hBA + NE), 11 (hBA + Rosi) | 3997–3656, 1618–938 cm−1 | 1st derivative, vector normalization, 17 smoothing points, PLS | hWA; 0 hBA + NE, hBA + Rosi; 100 | −18.2~32.5 68.8~134.5 | 3700–3584 cm−1 (OH), 1509 cm−1 (CH in-plane), 1448 cm−1 (CH3 asy d), 1221 cm−1 (phosphate), 1145 cm−1 (oligosaccharides), 970 cm−1 (DNA) | 88.95 | 2.13 | 3.01 | Figure 1F,G |
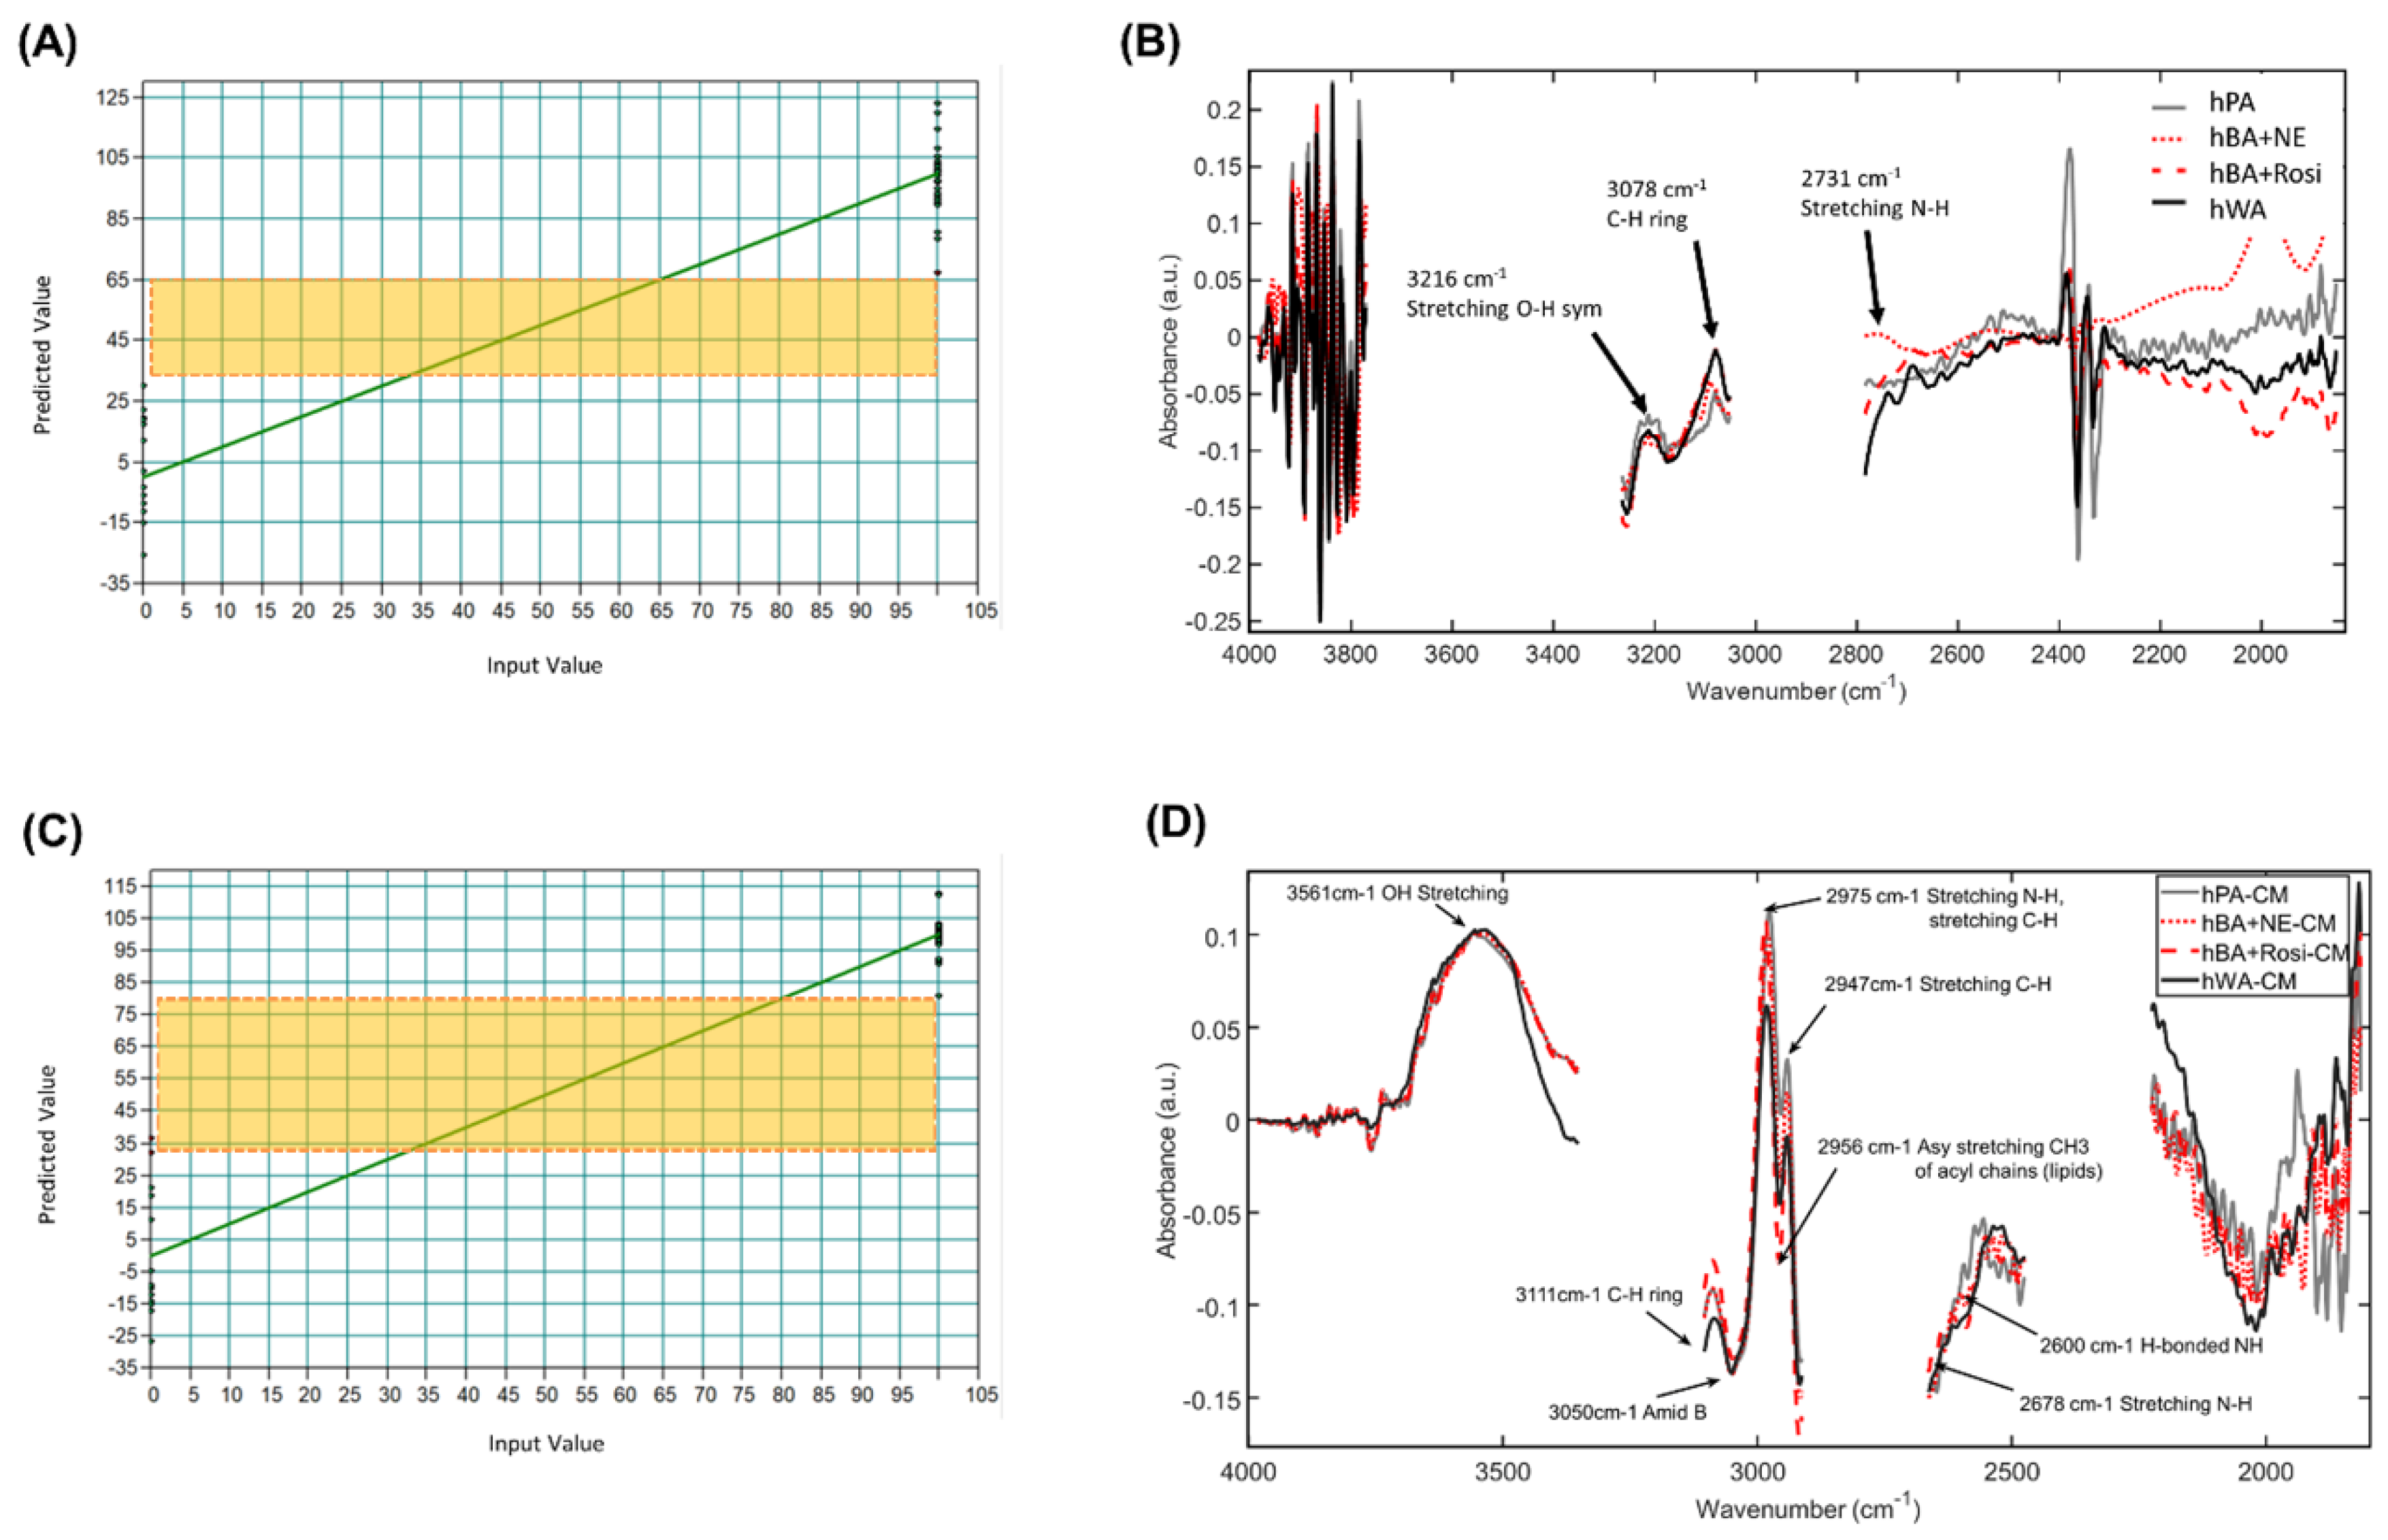
| hBA on a slide glass | 14 (hWA), 15 (hBA + NE), 15 (hBA + Rosi) | 3997–3756, 3278–3037, 2798–1838 cm−1 | 1st derivative, vector normalization, 17 smoothing points, PLS | hWA; 0hBA + NE, hBA + Rosi; 100 | −26.0~29.5 66.7~122.7 | 3700–3584 cm−1 (lipid-related CH), 3216 cm−1 (OH sym e), 3078 cm−1 (CH ring), 2731 m−1 (NH) | 92.11 | 1.72 | 3.56 | Figure 2A,B |
| hBA-CM on a slide glass | 13 (hWA-CM) 16 (hBA + NE-CM), 16 (hBA + Rosi-CM) | 3997–3338, 3118–2898, 2678–2459, 2239–1800 cm−1 | 1st derivative, vector normalization, 17 smoothing points, PLS | hWA-CM; 0 hBA + NE-CM, hBA + Rosi-CM; 100 | −27.0~31.6 80.6~111.9 | 3561 cm−1 (OH), 3111 cm−1 (CH), 3050 cm−1 (Amid B), 2975 cm−1 (NH, CH), 2956 cm−1 (CH3 asy (lipids)), 2947 cm−1 (CH), 2678 cm−1 (NH), 2600 cm−1 (H bonded NH) | 93.39 | 1.53 | 3.89 | Figure 2C,D |

2.6. Infrared Spectral Biomarkers
2.7. Statistical Analysis
3. Results
3.1. PLSR Using FTIR Spectra of Established Human Adipocytes
3.2. PLSR Using FTIR Spectra of Human Adipocytes and Human Adipocyte-Conditioned Media on a Slide Glass
3.3. Comparing PLSRs
3.4. Infrared Spectral Biomarkers on Human Beige Adipocytes
3.5. Infrared Spectral Biomarkers on Human Beige Adipocyte-Conditioned Media on a Slide Glass
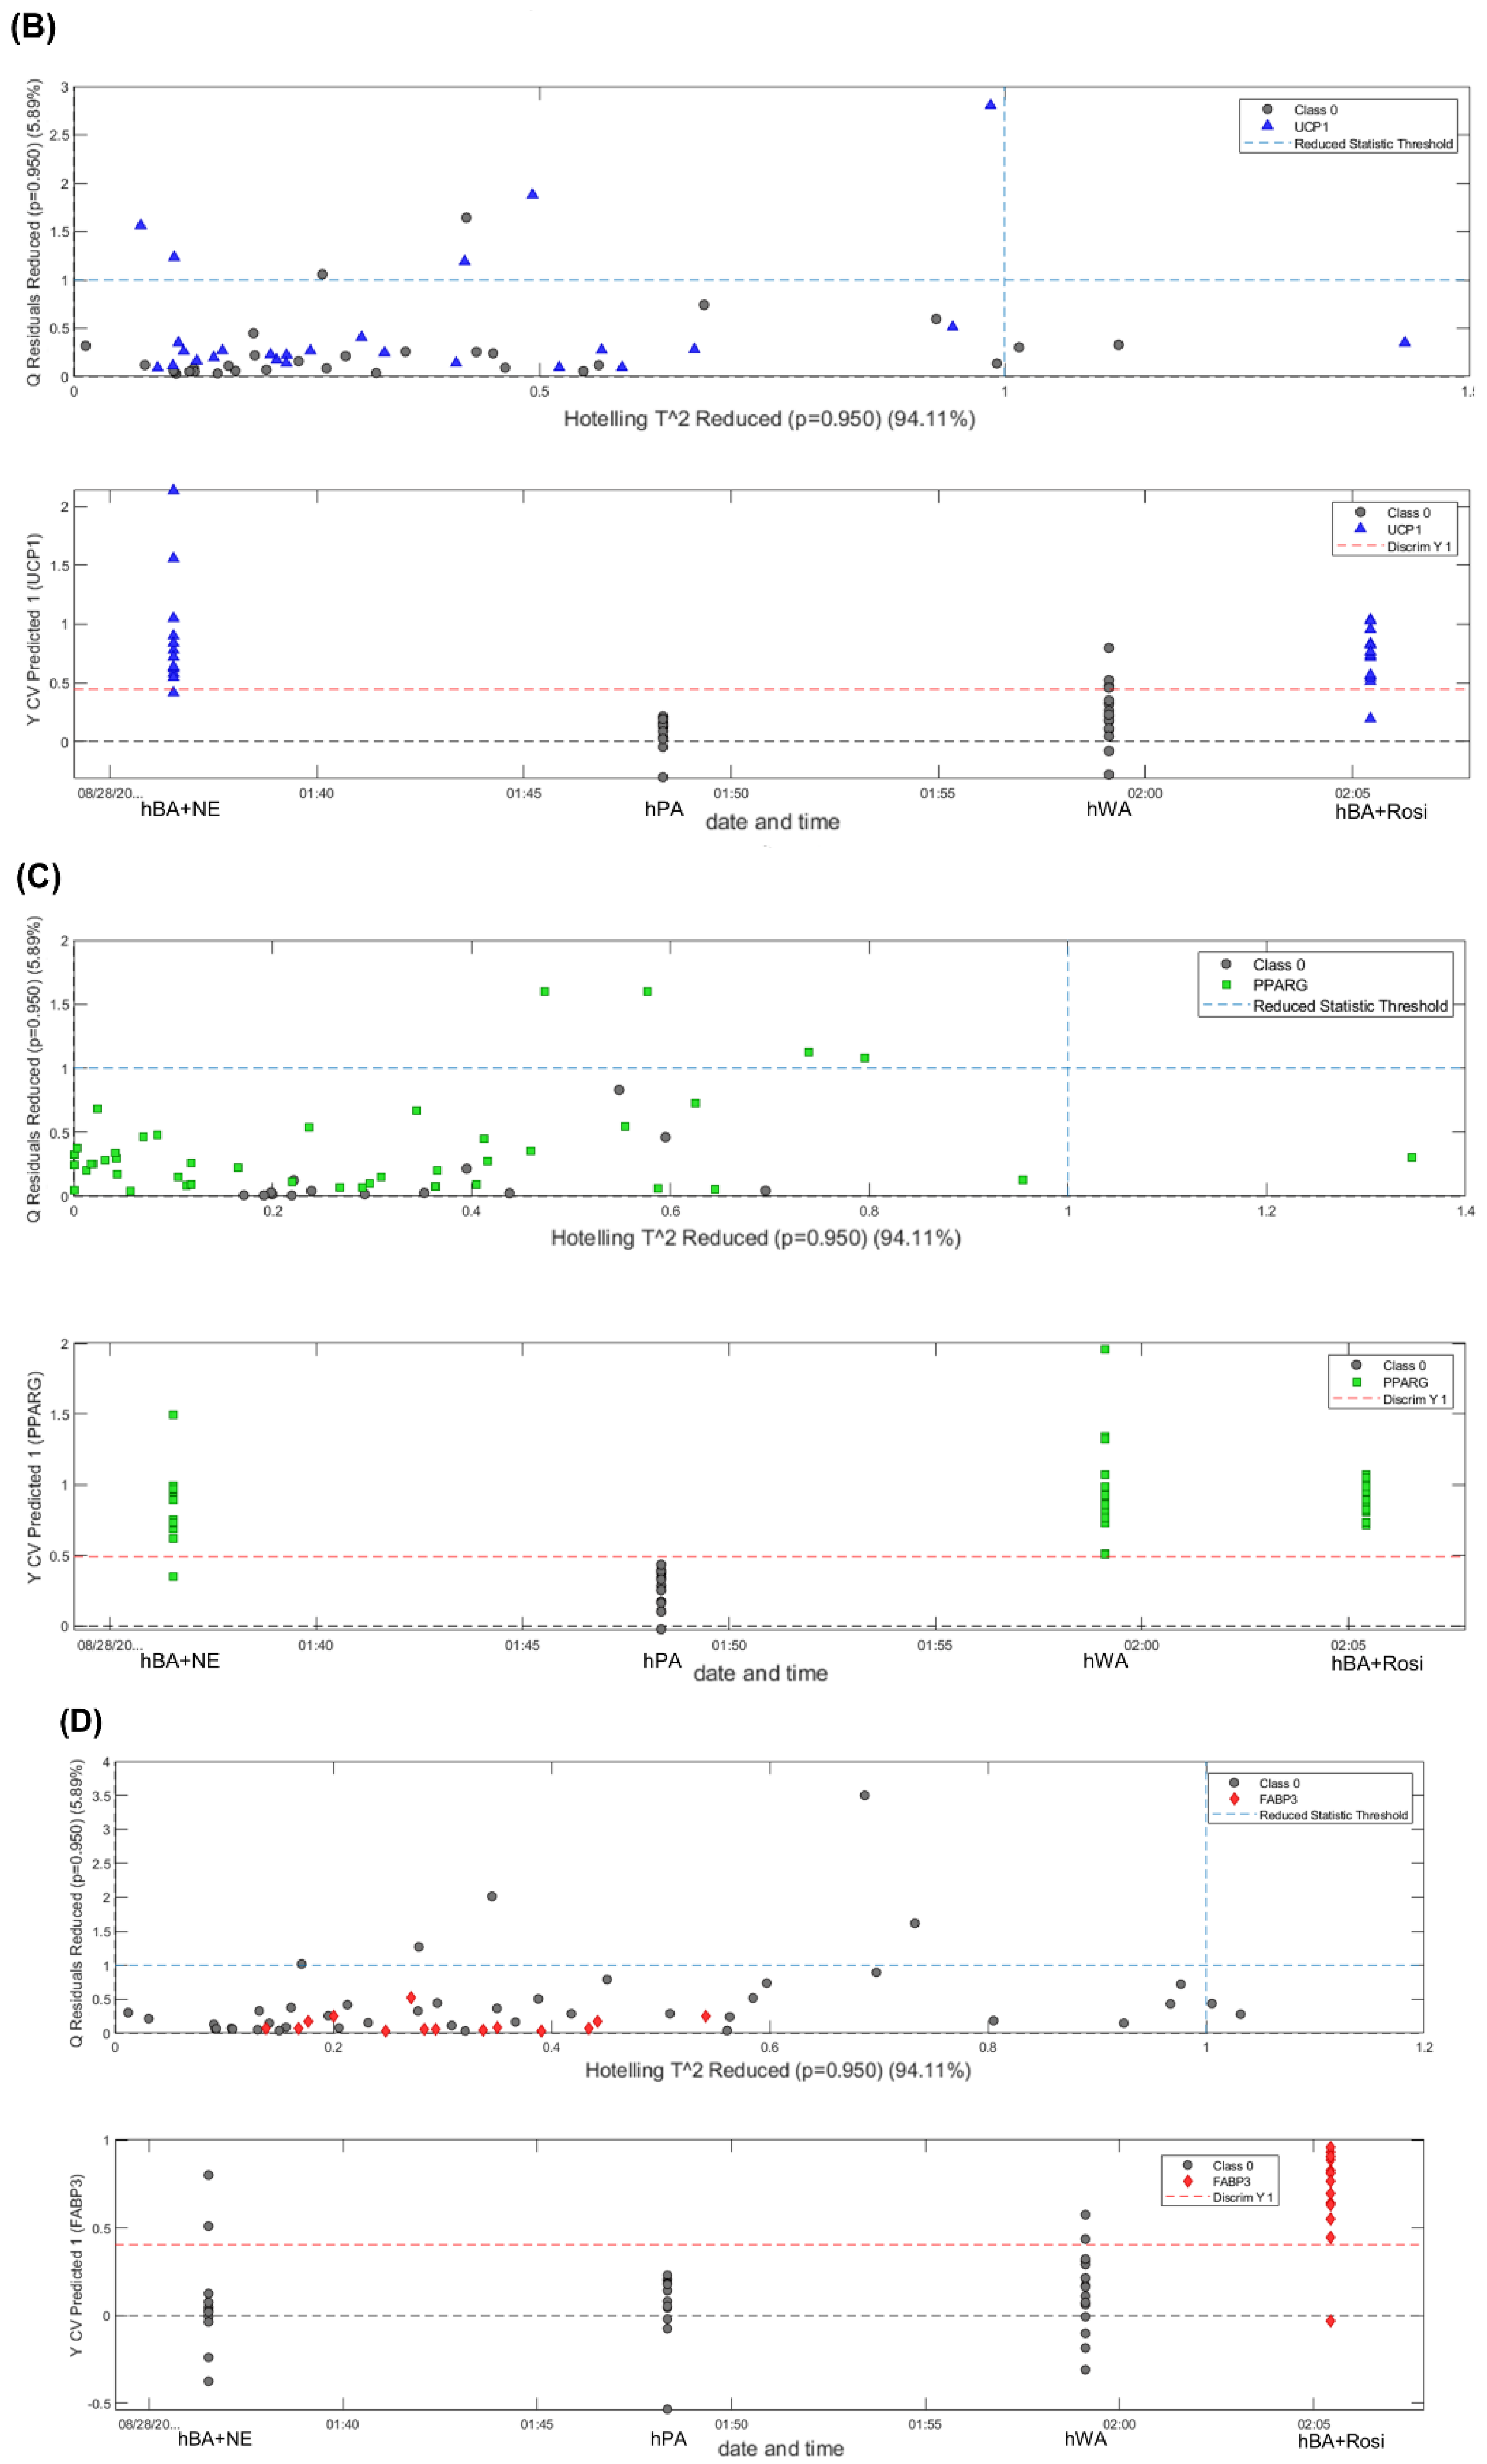
3.6. PLS-DA, Classification of Adipocytes and Expression Distribution of Adipogenesis Genes in Adipocytes
4. Discussion
5. Conclusions
Supplementary Materials
Author Contributions
Funding
Institutional Review Board Statement
Informed Consent Statement
Data Availability Statement
Conflicts of Interest
Abbreviations
References
- Renehan, A.G.; Tyson, M.; Egger, M.; Heller, R.F.; Zwahlen, M. Body-mass index and incidence of cancer: A systematic review and meta-analysis of prospective observational studies. Lancet 2008, 371, 569–578. [Google Scholar] [CrossRef] [PubMed]
- James, P.T. Obesity: The worldwide epidemic. Clin. Dermatol. 2004, 22, 276–280. [Google Scholar] [PubMed]
- Kahn, S.E.; Hull, R.L.; Utzschneider, K.M. Mechanisms linking obesity to insulin resistance and type 2 diabetes. Nature 2006, 444, 840–846. [Google Scholar] [CrossRef] [PubMed]
- Seale, P.; Lazar, M.A. Brown Fat in Humans: Turning up the Heat on Obesity. Diabetes 2009, 58, 1482–1484. [Google Scholar] [CrossRef] [PubMed] [Green Version]
- Feakins, R.M. Obesity and metabolic syndrome: Pathological effects on the gastrointestinal tract. Histopathology 2016, 68, 630–640. [Google Scholar] [CrossRef] [PubMed]
- Pischon, T.; Boeing, H.; Hoffmann, K. General and abdominal adiposity and risk of death in Europe. J. Vasc. Surg. 2009, 49, 811–812. [Google Scholar] [CrossRef] [Green Version]
- Harms, M.J.; Li, Q.; Lee, S.; Zhang, C.; Kull, B.; Hallen, S.; Thorell, A.; Alexandersson, I.; Hagberg, C.E.; Peng, X.R. Mature human white adipocytes cultured under membranes maintain identity, function, and can transdifferentiate into brown-like adipocytes. Cell Rep. 2019, 27, 213–225.e5. [Google Scholar] [CrossRef] [Green Version]
- Keda, K.; Maretich, P.; Kajimura, S. The common and distinct features of brown and beige adipocytes. Trends Endocrinol. Metab. 2018, 29, 191–200. [Google Scholar]
- Peschechera, A.; Eckel, J. “Browning” of adipose tissue—Regulation and therapeutic perspectives. Arch. Physiol. Biochem. 2013, 119, 151–160. [Google Scholar] [CrossRef]
- Bartelt, A.; Heeren, J. Adipose tissue browning and metabolic health. Nat. Rev. Endocrinol. 2014, 10, 24–36. [Google Scholar] [CrossRef]
- Montanari, T.; Boschi, F.; Colitti, M. Comparison of the Effects of Browning-Inducing Capsaicin on Two Murine Adipocyte Models. Front. Physiol. 2019, 10, 1380. [Google Scholar] [CrossRef]
- Wang, S.; Pan, M.-H.; Hung, W.-L.; Tung, Y.-C.; Ho, C.-T. From white to beige adipocytes: Therapeutic potential of dietary molecules against obesity and their molecular mechanisms. Food Funct. 2019, 10, 1263–1279. [Google Scholar] [CrossRef]
- Fayyad, A.M.; Khan, A.A.; Abdallah, S.H.; Alomran, S.S.; Bajou, K.; Khattak, M.N.K. Rosiglitazone Enhances Browning Adipocytes in Association with MAPK and PI3-K Pathways During the Differentiation of Telomerase-Transformed Mesenchymal Stromal Cells into Adipocytes. Int. J. Mol. Sci. 2019, 20, 1618. [Google Scholar] [CrossRef] [Green Version]
- Derrick, M.R.; Stulik, D.; Landry, J.M. Infrared Spectroscopy in Conservation Science; Getty Publications: Los Angeles, CA, USA, 2000. [Google Scholar]
- Baker, M.J.; Byrne, H.J.; Chalmers, J.; Gardner, P.; Goodacre, R.; Henderson, A.; Kazarian, S.G.; Martin, F.L.; Moger, J.; Stone, N.; et al. Clinical applications of infrared and Raman spectroscopy: State of play and future challenges. Analyst 2018, 143, 1735–1757. [Google Scholar] [CrossRef]
- Denbigh, J.L.; Perez-Guaita, D.; Vernooij, R.R.; Tobin, M.J.; Bambery, K.R.; Xu, Y.; Southam, A.D.; Khanim, F.L.; Drayson, M.T.; Lockyer, N.P.; et al. Probing the action of a novel anti-leukaemic drug therapy at the single cell level using modern vibrational spectroscopy techniques. Sci. Rep. 2017, 7, 2649. [Google Scholar] [CrossRef]
- Al-Jorani, K.; Rüther, A.; Haputhanthri, R.; Deacon, G.B.; Li, H.L.; Cullinane, C.; Wood, B.R. ATR-FTIR spectroscopy shows changes in ovarian cancer cells after incubation with novel organoamidoplatinum (ii) complexes. Analyst 2018, 143, 6087–6094. [Google Scholar] [CrossRef]
- Yamaguchi, R.-T.; Hirano-Iwata, A.; Kimura, Y.; Niwano, M.; Miyamoto, K.-i.; Isoda, H.; Miyazaki, H. In situ real-time monitoring of apoptosis on leukemia cells by surface infrared spectroscopy. J. Appl. Phys. 2009, 105, 024701. [Google Scholar] [CrossRef]
- Lamberti, A.; Sanges, C.; Arcari, P. FT-IR spectromicroscopy of mammalian cell cultures during necrosis and apoptosis induced by drugs. Spectroscopy 2010, 24, 420791. [Google Scholar] [CrossRef]
- Dunkhunthod, B.; Thumanu, K.; Eumkeb, G. Application of FTIR microspectroscopy for monitoring and discrimination of the anti-adipogenesis activity of baicalein in 3T3-L1 adipocytes. Vib. Spectrosc. 2017, 89, 92–101. [Google Scholar] [CrossRef]
- Buckus, B.; Brimas, G.; Stašinskas, A.; Smalenskaitė, A.; Tautkus, S.; Beganskienė, A.; Kareiva, A. Analytical characterization of adipose tissue structure and composition: A novel approach towards diagnosis of metabolic disturbances in the human body. chemija 2015, 26, 98–106. [Google Scholar]
- Baloglu, F.K.; Garip, S.; Heise, S.; Brockmann, G.; Severcan, F. FTIR imaging of structural changes in visceral and subcutaneous adiposity and brown to white adipocyte transdifferentiation. Analyst 2015, 140, 2205–2214. [Google Scholar] [CrossRef] [PubMed]
- Kucuk Baloglu, F.; Baloglu, O.; Heise, S.; Brockmann, G.; Severcan, F. Triglyceride dependent differentiation of obesity in adipose tissues by FTIR spectroscopy coupled with chemometrics. J. Biophotonics 2017, 10, 1345–1355. [Google Scholar] [CrossRef] [PubMed]
- Dogan, A.; Lasch, P.; Neuschl, C.; Millrose, M.K.; Alberts, R.; Schughart, K.; Naumann, D.; Brockmann, G.A. ATR-FTIR spectroscopy reveals genomic loci regulating the tissue response in high fat diet fed BXD recombinant inbred mouse strains. BMC Genom. 2013, 14, 386. [Google Scholar] [CrossRef] [PubMed] [Green Version]
- Mathew, P.S.; Pillai, A.S. 10—Artificial intelligence in the management of neurological disorders: Its prevalence and prominence. In Augmenting Neurological Disorder Prediction and Rehabilitation Using Artificial Intelligence; Pillai, A.S., Menon, B., Eds.; Academic Press: Cambridge, MA, USA, 2022; pp. 193–221. [Google Scholar]
- Freedman, D.A. Statistical Models: Theory and Practice; Cambridge University Press: Cambridge, UK, 2009. [Google Scholar]
- Tolles, J.; Meurer, W.J. Logistic regression: Relating patient characteristics to outcomes. Jama 2016, 316, 533–534. [Google Scholar] [CrossRef] [PubMed]
- Norris, C.M.; Ghali, W.A.; Saunders, L.D.; Brant, R.; Galbraith, D.; Faris, P.; Knudtson, M.L.; Investigators, A. Ordinal regression model and the linear regression model were superior to the logistic regression models. J. Clin. Epidemiol. 2006, 59, 448–456. [Google Scholar] [CrossRef]
- Hellevik, O. Linear versus logistic regression when the dependent variable is a dichotomy. Qual. Quant. 2009, 43, 59–74. [Google Scholar] [CrossRef]
- Siregar, C.; Martono, S.; Rohman, A. Application of Fourier transform infrared (FTIR) spectroscopy coupled with multivariate calibration for quantitative analysis of curcuminoid in tablet dosage form. J. Appl. Pharm. Sci. 2018, 8, 151–156. [Google Scholar]
- Algethami, F.K.; Eid, S.M.; Kelani, K.M.; Elghobashy, M.R.; Abd El-Rahman, M.K. Chemical fingerprinting and quantitative monitoring of the doping drugs bambuterol and terbutaline in human urine samples using ATR-FTIR coupled with a PLSR chemometric tool. RSC Adv. 2020, 10, 7146–7154. [Google Scholar] [CrossRef]
- Ahn, H.-G.; Kim, Y.-H. Discrimination of Korean domestic and foreign soybeans using near infrared reflectance spectroscopy. Korean J. Crop Sci. 2012, 57, 296–300. [Google Scholar] [CrossRef] [Green Version]
- Seo, Y.-W.; Ahn, C.K.; Lee, H.; Park, E.; Mo, C.; Cho, B.-K. Non-destructive sorting techniques for viable pepper (Capsicum annuum L.) seeds using Fourier transform near-infrared and raman spectroscopy. J. Biosyst. Eng. 2016, 41, 51–59. [Google Scholar] [CrossRef] [Green Version]
- Naseer, K.; Ali, S.; Mubarik, S.; Hussain, I.; Mirza, B.; Qazi, J. FTIR spectroscopy of freeze-dried human sera as a novel approach for dengue diagnosis. Infrared Phys. Technol. 2019, 102, 102998. [Google Scholar] [CrossRef]
- Wold, S.; Sjöström, M.; Eriksson, L. PLS-regression: A basic tool of chemometrics. Chemom. Intell. Lab. Syst. 2001, 58, 109–130. [Google Scholar] [CrossRef]
- Mukherjee, S.; Martínez-González, J.; Dowling, D.P.; Gowen, A. Predictive modelling of the water contact angle of surfaces using attenuated total reflection–Fourier transform infrared (ATR-FTIR) chemical imaging and partial least squares regression (PLSR). Analyst 2018, 143, 3729–3740. [Google Scholar] [CrossRef]
- Lee, M.-J.; Fried, S.K. Optimal protocol for the differentiation and metabolic analysis of human adipose stromal cells. In Methods in Enzymology; Elsevier: Amsterdam, The Netherlands, 2014; pp. 49–65. [Google Scholar]
- Movasaghi, Z.; Rehman, S.; ur Rehman, D.I. Fourier Transform Infrared (FTIR) Spectroscopy of Biological Tissues. Appl. Spectrosc. Rev. 2008, 43, 134–179. [Google Scholar] [CrossRef]
- Shon, D.; Park, S.; Yoon, S.; Ko, Y. Identification of Biochemical Differences in White and Brown Adipocytes Using FTIR Spectroscopy. Appl. Sci. 2022, 12, 3071. [Google Scholar] [CrossRef]
- Lee, B.-J.; Kim, H.-Y.; Lim, S.R.; Huang, L.; Choi, H.-K. Discrimination and prediction of cultivation age and parts of Panax ginseng by Fourier-transform infrared spectroscopy combined with multivariate statistical analysis. PLoS ONE 2017, 12, e0186664. [Google Scholar] [CrossRef] [Green Version]
- Narkhede, S. Understanding confusion matrix. Towards Data Sci. 2018, 180, 1–12. [Google Scholar]
- Narkhede, S. Understanding auc-roc curve. Towards Data Sci. 2018, 26, 220–227. [Google Scholar]
- Merlin, J.; Sato, M.; Chia, L.Y.; Fahey, R.; Pakzad, M.; Nowell, C.J.; Summers, R.J.; Bengtsson, T.; Evans, B.A.; Hutchinson, D.S. Rosiglitazone and a β3-adrenoceptor agonist are both required for functional browning of white adipocytes in culture. Front. Endocrinol. 2018, 9, 249. [Google Scholar] [CrossRef]
- Bassan, P.; Mellor, J.; Shapiro, J.; Williams, K.J.; Lisanti, M.P.; Gardner, P. Transmission FT-IR chemical imaging on glass substrates: Applications in infrared spectral histopathology. Anal. Chem. 2014, 86, 1648–1653. [Google Scholar] [CrossRef]
- Zandbaaf, S.; Khorrami, M.R.K.; Garmarudi, A.B.; Rashidi, B.H. Infrared spectroscopic and chemometric approach for identifying morphology in embryo culture medium samples. Infrared Phys. Technol. 2020, 106, 103284. [Google Scholar] [CrossRef]
- Sitnikova, V.E.; Kotkova, M.A.; Nosenko, T.N.; Kotkova, T.N.; Martynova, D.M.; Uspenskaya, M.V. Breast cancer detection by ATR-FTIR spectroscopy of blood serum and multivariate data-analysis. Talanta 2020, 214, 120857. [Google Scholar] [CrossRef]
- Morris, A.D.; Morais, C.L.M.; Lima, K.M.G.; Freitas, D.L.D.; Brady, M.E.; Dhaygude, A.P.; Rowbottom, A.W.; Martin, F.L. Distinguishing active from quiescent disease in ANCA-associated vasculitis using attenuated total reflection Fourier-transform infrared spectroscopy. Sci. Rep. 2021, 11, 9981. [Google Scholar] [CrossRef]
- Trevisan, J.; Angelov, P.P.; Carmichael, P.L.; Scott, A.D.; Martin, F.L. Extracting biological information with computational analysis of Fourier-transform infrared (FTIR) biospectroscopy datasets: Current practices to future perspectives. Analyst 2012, 137, 3202–3215. [Google Scholar] [CrossRef]
- Baker, M.J.; Trevisan, J.; Bassan, P.; Bhargava, R.; Butler, H.J.; Dorling, K.M.; Fielden, P.R.; Fogarty, S.W.; Fullwood, N.J.; Heys, K.A. Using Fourier transform IR spectroscopy to analyze biological materials. Nat. Protoc. 2014, 9, 1771. [Google Scholar] [CrossRef]
- Trevisan, J.; Angelov, P.P.; Scott, A.D.; Carmichael, P.L.; Martin, F.L. IRootLab: A free and open-source MATLAB toolbox for vibrational biospectroscopy data analysis. Bioinformatics 2013, 29, 1095–1097. [Google Scholar] [CrossRef] [Green Version]
- Martin, F.L.; Kelly, J.G.; Llabjani, V.; Martin-Hirsch, P.L.; Patel, I.I.; Trevisan, J.; Fullwood, N.J.; Walsh, M.J. Distinguishing cell types or populations based on the computational analysis of their infrared spectra. Nat. Protoc. 2010, 5, 1748–1760. [Google Scholar] [CrossRef]
- Gajjar, K.; Heppenstall, L.D.; Pang, W.; Ashton, K.M.; Trevisan, J.; Patel, I.I.; Llabjani, V.; Stringfellow, H.F.; Martin-Hirsch, P.L.; Dawson, T. Diagnostic segregation of human brain tumours using Fourier-transform infrared and/or Raman spectroscopy coupled with discriminant analysis. Anal. Methods 2013, 5, 89–102. [Google Scholar] [CrossRef]
- Walsh, M.J.; Singh, M.N.; Pollock, H.M.; Cooper, L.J.; German, M.J.; Stringfellow, H.F.; Fullwood, N.J.; Paraskevaidis, E.; Martin-Hirsch, P.L.; Martin, F.L. ATR microspectroscopy with multivariate analysis segregates grades of exfoliative cervical cytology. Biochem. Biophys. Res. Commun. 2007, 352, 213–219. [Google Scholar] [CrossRef]
- Robotti, E.; Marengo, E. Chemometric multivariate tools for candidate biomarker identification: LDA, PLS-DA, SIMCA, Ranking-PCA. In 2-D PAGE Map Analysis; Springer: Berlin/Heidelberg, Germany, 2016; pp. 237–267. [Google Scholar]


| Gene | Forward (5′–3′) | Reverse (5′–3′) | Accession No. |
|---|---|---|---|
| GAPDH | GGAAGGTGAAGGTCGGAGTC | GAAGGGGTCATTGATGGCAAC | NM_001256799 |
| CIDEA | TGGGAGACAACACGCATTTCA | TCATACATGGTGGCCTTCACG | NM_001279 |
| PPARG | GACCCAGAAAGCGATTCCTTC | TCCATTACGGAGAGATCCACG | NM_001330615 |
| ADIPOQ | TTGCCTACCACATCACAGTCT | TTACGCTCTCCTTCCCCATAC | NM_001177800 |
| UCP1 | ACTTGGTGTCGGCTCTTATCG | CCGTTGGTCCTTCGTTAGTGA | NM_021833 |
| CITED1 | CCTCACCTGCGAAGGAGGA | GGAGAGCCTATTGGAGATCCC | NM_001144885 |
| FABP3 | ACCAAGCCTACCACAATCATCG | CAAGTTTCCCTCCATCCAGTGT | NM_001320996 |
| FABP4 | GCAGCTTCCTTCTCACCTTGA | TCACATCCCCATTCACACTGA | NM_001442 |
| PAT2 | TATGTCGCCTCCTGAAAGTGC | TTCTTCACAGCGAGGGGTAGT | NM_181776 |
| SLC25A20 | AGACACAGCCACCGAGTTTG | TCCCCAAACCAAACCCAAAGA | NM_000387 |
| PDK4 | TCAGCCTTCCCTTACACCAAT | AAACCAGCCAAAGGAGCATTC | NM_002612 |
| DIO2 | GTCCTCCATCAGGTTTTAGCAA | CTCACCCAATTTCACCATCCA | NM_000793 |
| Wavenumber | 3005 cm−1 Olefinic | 2955 cm−1 CH3 asy 1 | 2920 cm−1 CH2 asy | 2870 cm−1 CH3 sym 2 | 2850 cm−1 CH2 sym | 1744 cm−1 TG 3 | 1652 cm−1 Amide I | 1543 cm−1 Amide II | 1240 cm−1 B-Form DNA | 1220 cm−1 B-Form DNA | |
|---|---|---|---|---|---|---|---|---|---|---|---|
| Type | |||||||||||
| hBA | X 4 | X | X | X | X | X | X | O 5 | O | O | |
| hBA on a slide glass | O | O | O | O | O | O | O | NA 6 | NA | NA | |
| hBA-CM on a slide glass | O | O | O | X | X | X | X | NA | NA | NA | |
| Statistical Test | Peak Wavenumber (cm−1 ) | |||||||||||||
|---|---|---|---|---|---|---|---|---|---|---|---|---|---|---|
| Meaning of peaks | OH asy | β-sheet amide I | PO2 sym | νPO4 | A-form helix | OH out-of-plane bend | Meaning of peaks | β-sheet amide I | Amide III, collagen | C-O | A-form helix | OH out-of-plane bend | OH out-of-plane bend | |
| differences between mean spectra | hBA + NE | 3347 | 1635 | 1099 | 970 | 881 | 629 | hBA + Rosi | 1626 | 1171 | 668 | 631 | ||
| PCA-LDA cluster | 3449 | 1100 | 972 | 882 | 1628 | 1206 | 1167 | 861 | 668 | 638 | ||||
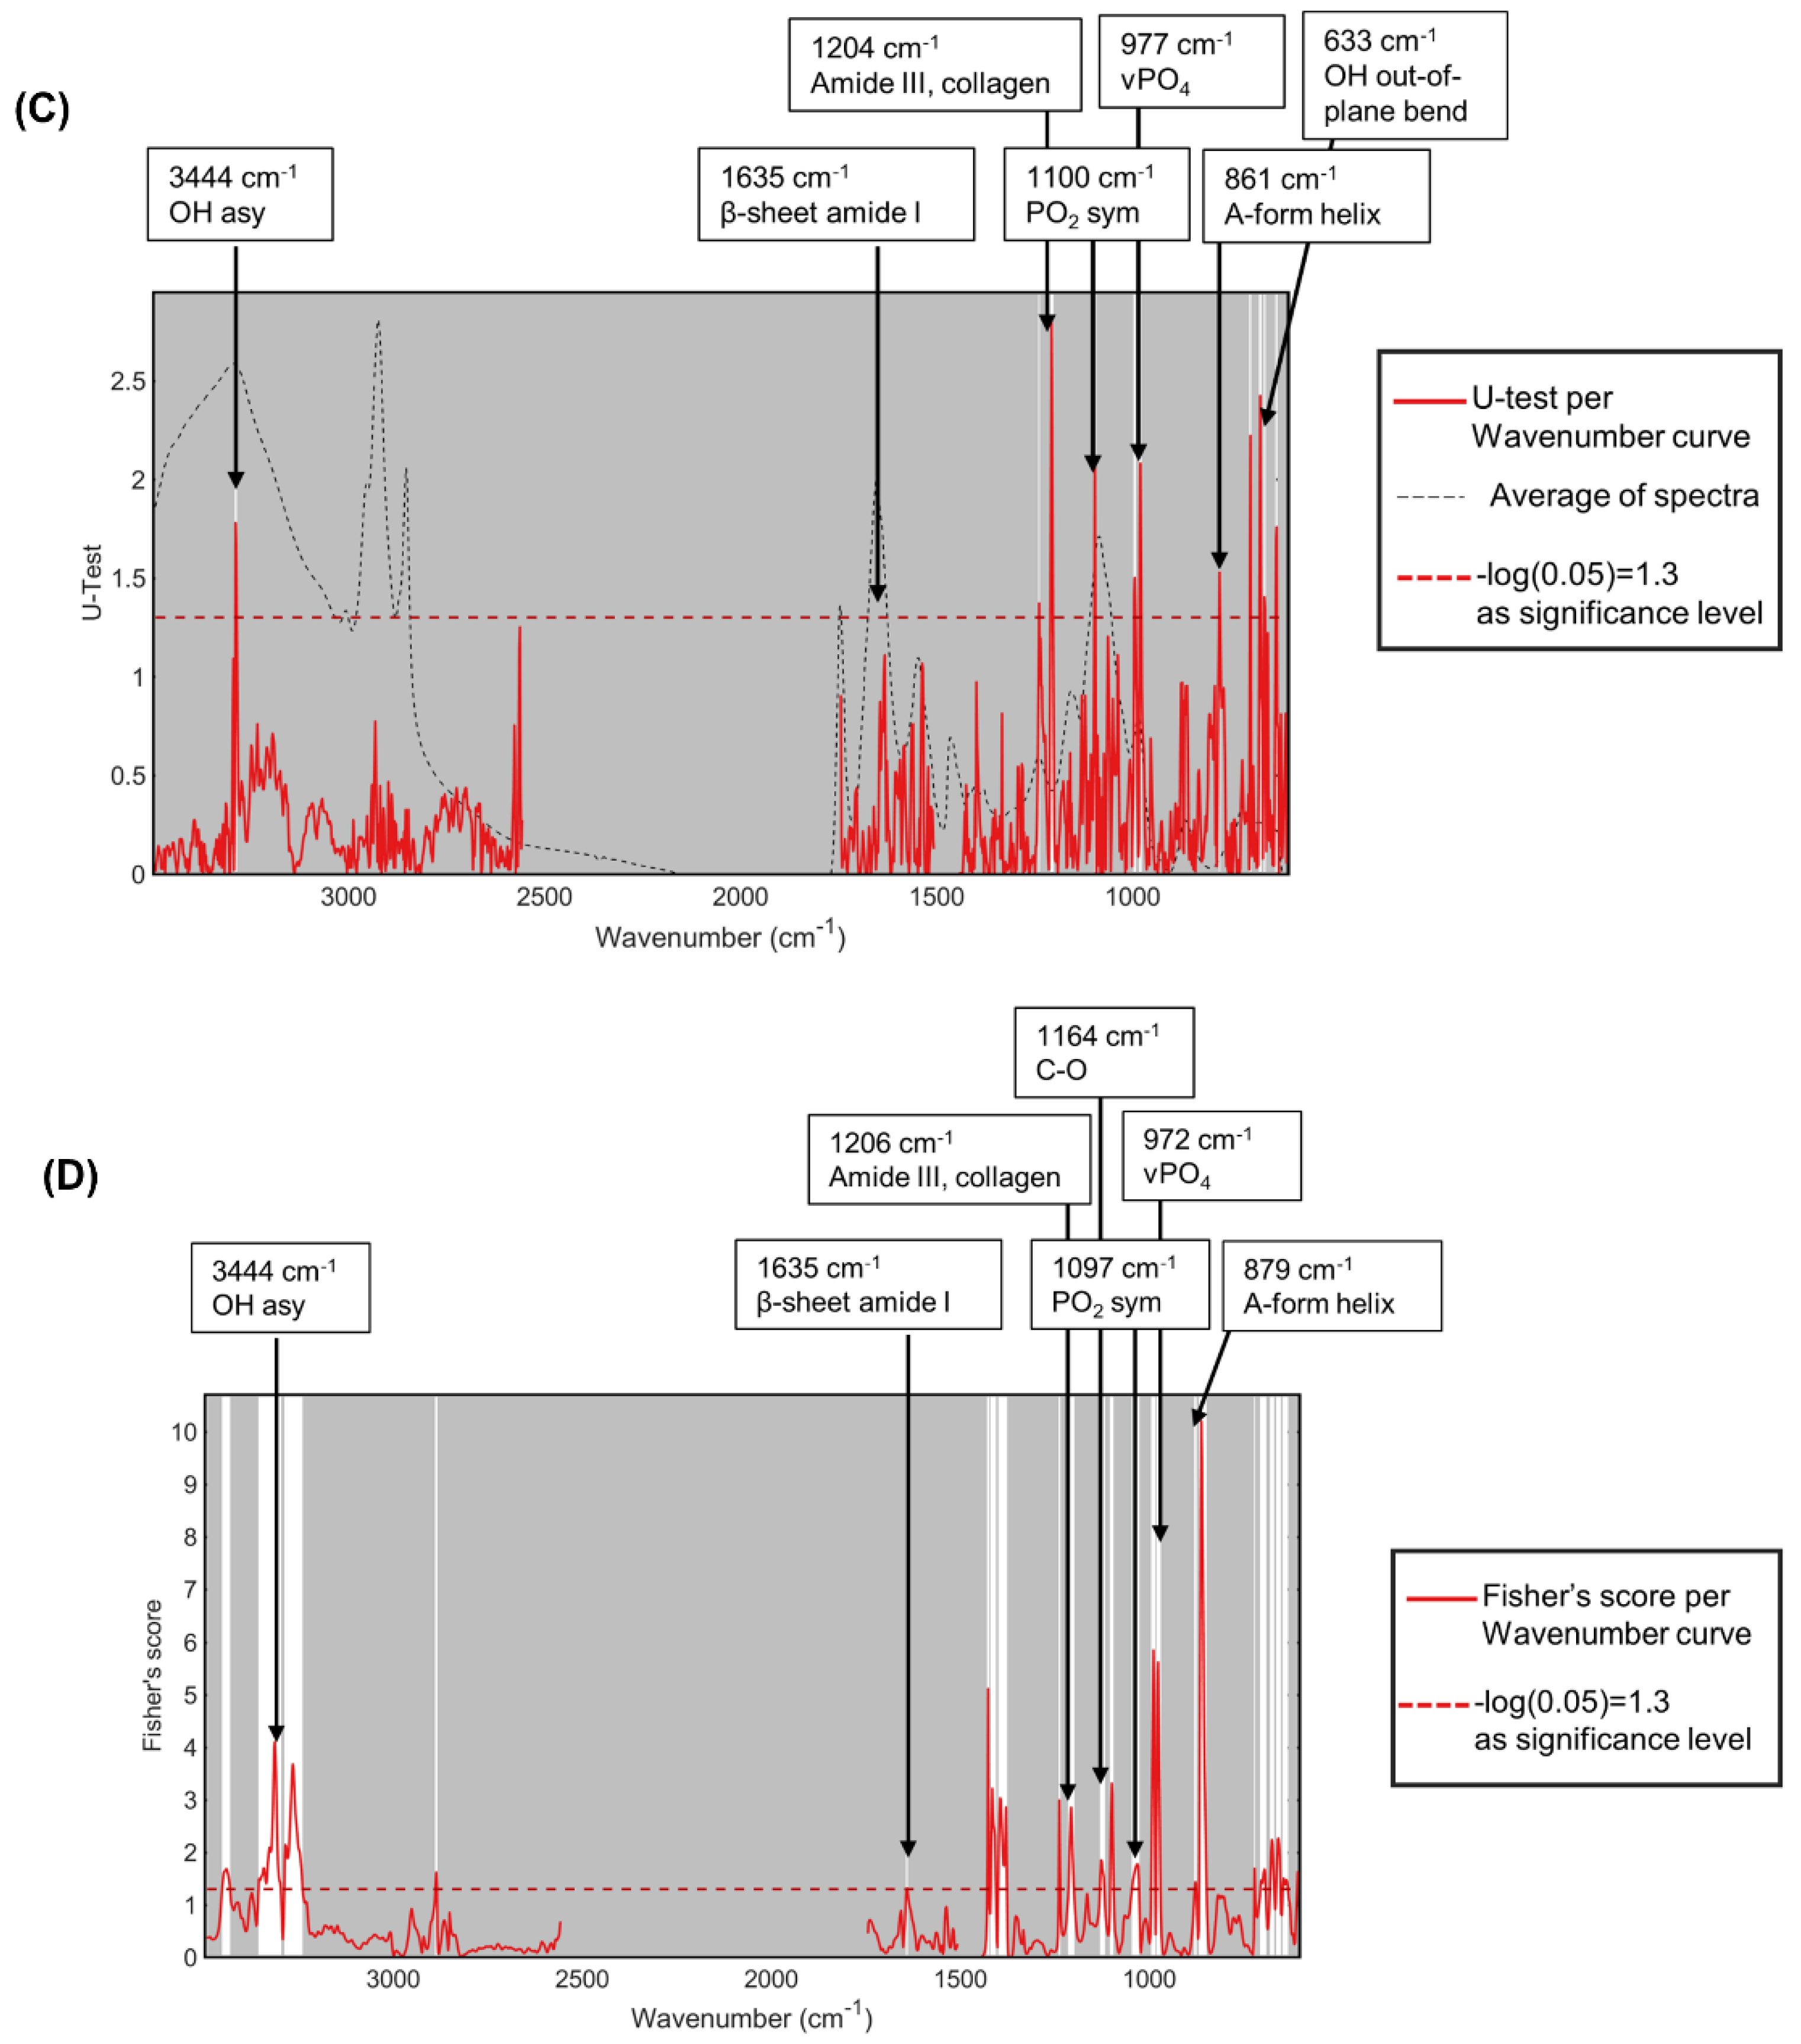
| U-test per wavenumber | 3444 | 1635 | 1100 | 977 | 633 | 1635 | 1204 | 861 | 633 | |||||
| Fisher’s score per wavenumber | 3444 | 1635 | 1097 | 972 | 879 | 1635 | 1206 | 1164 | 860 | 668 | ||||
| Meaning of peaks | C-H | ν(C=C) | C=O | amide I | amide I | amide I | Meaning of peaks | C=O | amide I | amide I | amide I | amide I | ||
| differences between mean spectra | hBA + NE-CM on a slide glass | 2940 | 1754 | 1728 | 1640 | hBA + Rosi-CM on a slide glass | 1666 | 1648 | ||||||
| PCA-LDA cluster | 2941 | 1752 | 1728 | 1688 | 1658 | 1733 | 1686 | 1663 | 1659 | |||||
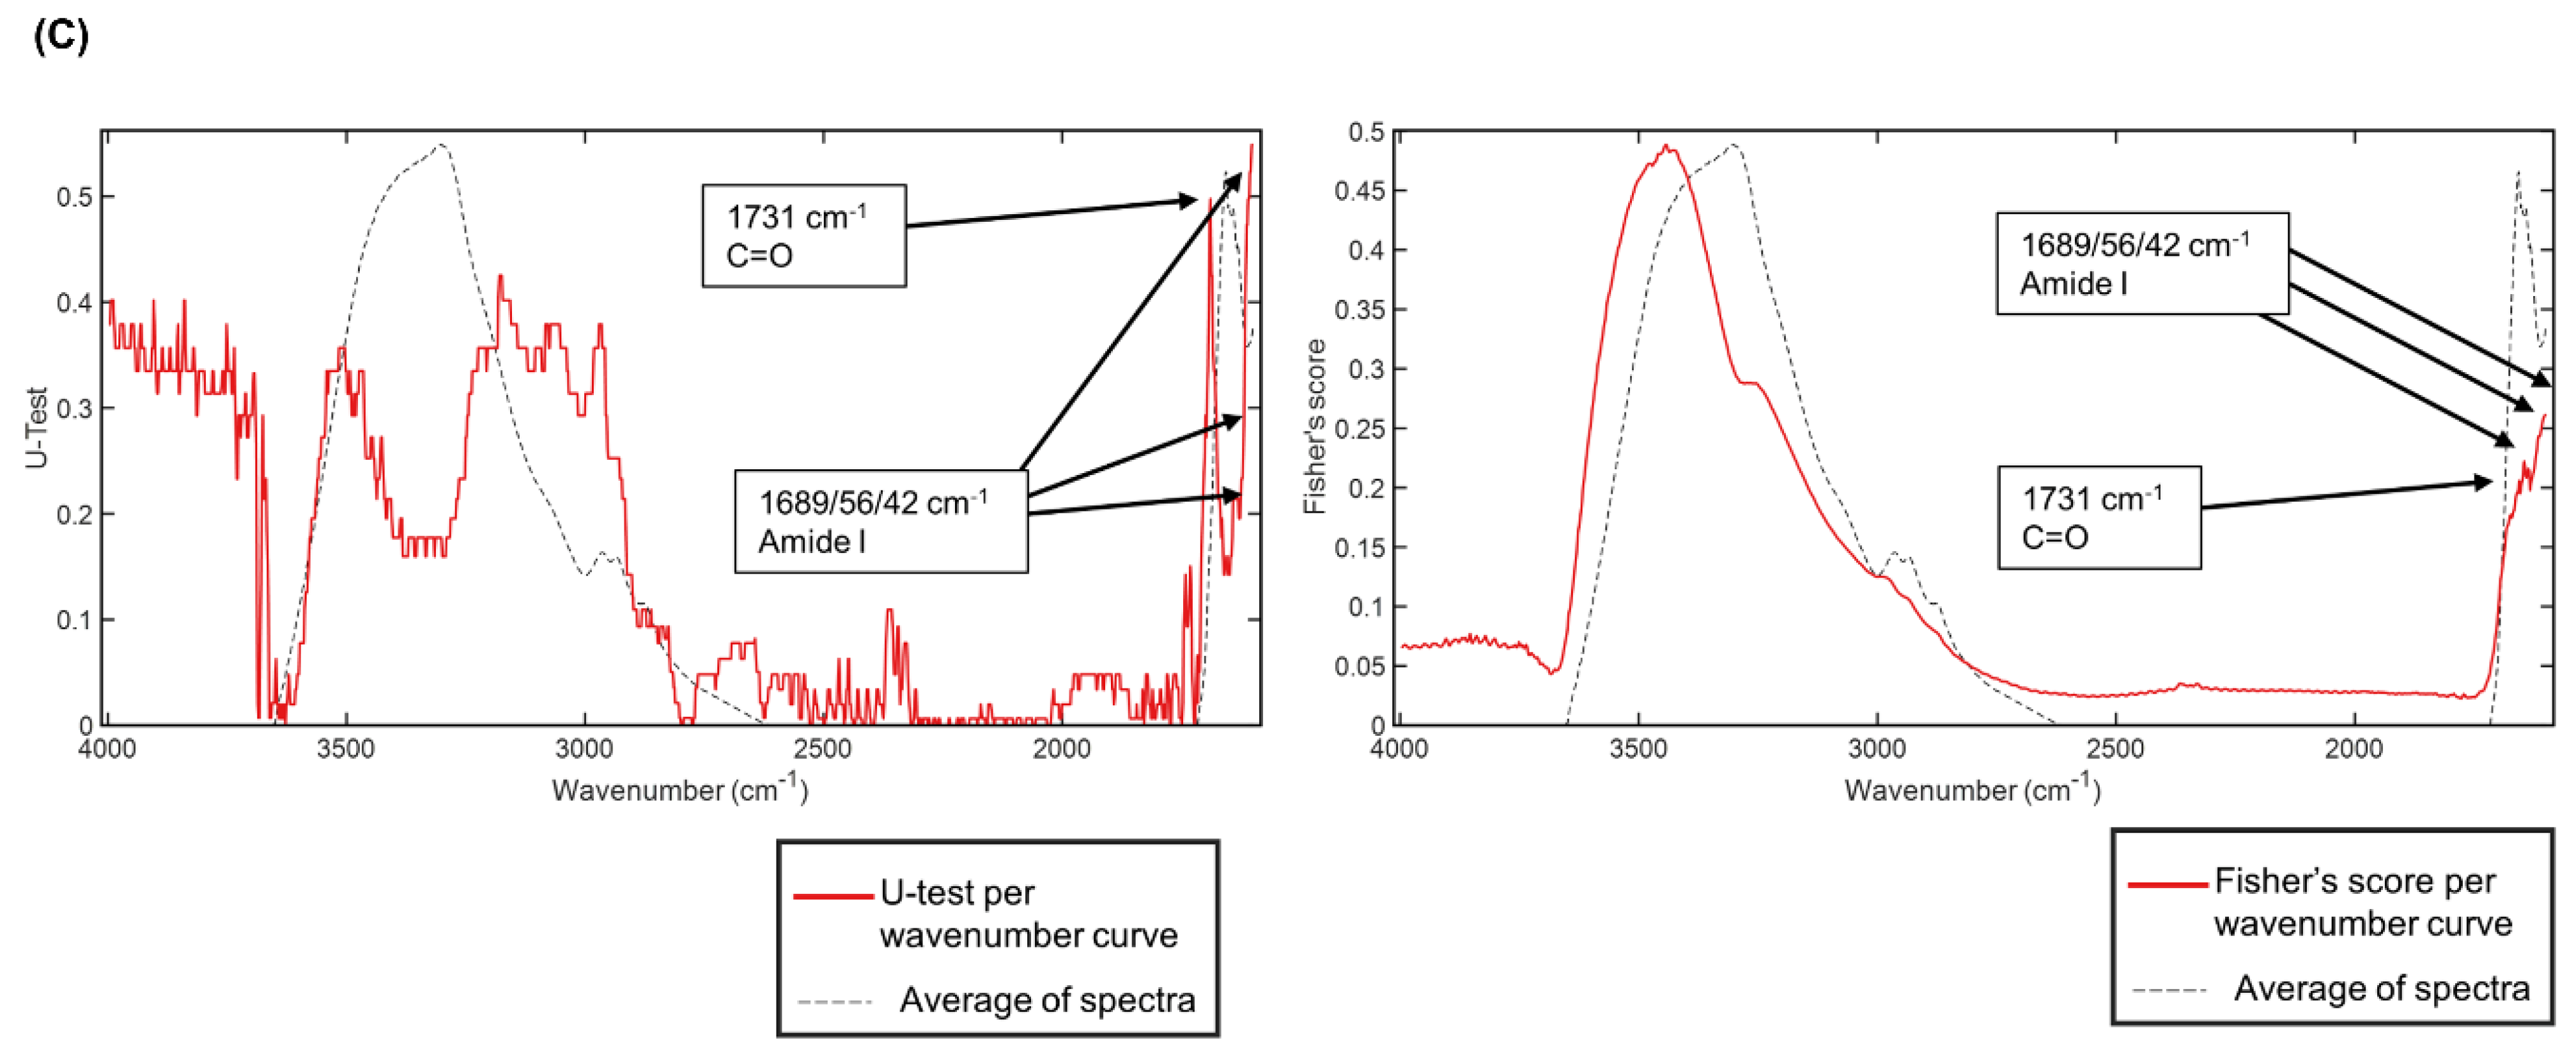
| U-test per wavenumber | 1731 | 1689 | 1656 | 1642 | 1731 | 1689 | 1656 | 1642 | ||||||
| Fisher’s score per wavenumber | 1688 | 1656 | 1643 | 1688 | 1656 | 1645 | ||||||||
Disclaimer/Publisher’s Note: The statements, opinions and data contained in all publications are solely those of the individual author(s) and contributor(s) and not of MDPI and/or the editor(s). MDPI and/or the editor(s) disclaim responsibility for any injury to people or property resulting from any ideas, methods, instructions or products referred to in the content. |
© 2022 by the authors. Licensee MDPI, Basel, Switzerland. This article is an open access article distributed under the terms and conditions of the Creative Commons Attribution (CC BY) license (https://creativecommons.org/licenses/by/4.0/).
Share and Cite
Shon, D.-H.; Park, S.-J.; Yoon, S.-J.; Ryu, Y.-H.; Ko, Y. Identification of Browning in Human Adipocytes by Partial Least Squares Regression (PLSR), Infrared Spectral Biomarkers, and Partial Least Squares Discriminant Analysis (PLS-DA) Using FTIR Spectroscopy. Photonics 2023, 10, 2. https://doi.org/10.3390/photonics10010002
Shon D-H, Park S-J, Yoon S-J, Ryu Y-H, Ko Y. Identification of Browning in Human Adipocytes by Partial Least Squares Regression (PLSR), Infrared Spectral Biomarkers, and Partial Least Squares Discriminant Analysis (PLS-DA) Using FTIR Spectroscopy. Photonics. 2023; 10(1):2. https://doi.org/10.3390/photonics10010002
Chicago/Turabian StyleShon, Dong-Hyun, Se-Jun Park, Suk-Jun Yoon, Yang-Hwan Ryu, and Yong Ko. 2023. "Identification of Browning in Human Adipocytes by Partial Least Squares Regression (PLSR), Infrared Spectral Biomarkers, and Partial Least Squares Discriminant Analysis (PLS-DA) Using FTIR Spectroscopy" Photonics 10, no. 1: 2. https://doi.org/10.3390/photonics10010002
APA StyleShon, D.-H., Park, S.-J., Yoon, S.-J., Ryu, Y.-H., & Ko, Y. (2023). Identification of Browning in Human Adipocytes by Partial Least Squares Regression (PLSR), Infrared Spectral Biomarkers, and Partial Least Squares Discriminant Analysis (PLS-DA) Using FTIR Spectroscopy. Photonics, 10(1), 2. https://doi.org/10.3390/photonics10010002


