Article

Coupled Strip-Array Waveguides for Integrated Mid-IR Gas Sensing

1
Silicon Austria Labs GmbH, 9524 Villach, Austria
2
Infineon Technologies Austria AG, 9500 Villach, Austria
3
Institute for Microelectronics and Microsensors, Johannes Kepler University, 4040 Linz, Austria
*
Author to whom correspondence should be addressed.
Photonics 2023, 10(1), 55; https://doi.org/10.3390/photonics10010055
Submission received: 23 September 2022 / Revised: 15 December 2022 / Accepted: 20 December 2022 / Published: 4 January 2023
(This article belongs to the Special Issue Design and Application of Modern Evanescent Wave Photonic Sensors)

Abstract

:
Non-dispersive infrared (NDIR) absorption spectroscopy is a widespread approach to gas sensing due to its selectivity and conceptual simplicity. One of the main challenges towards the development of fully integrated NDIR sensors is the design and fabrication of microstructures, typically waveguides, that can combine high sensitivity with the ease of integrability of other sensor elements (sources, filters, detectors). Here, we investigate theoretically and experimentally a class of coupled strip-array (CSA) waveguides realized on a SiO2/Si3N4 platform with mass semiconductor fabrication processes. We demonstrate that this class of waveguides shows comparable sensitivity for a wide range of presented geometries, making it a very promising platform for satisfying multiple sensor and fabrication requirements without loss of performance.

1. Introduction

The principal technologies for miniaturized gas detectors include metal-oxide semiconductors, electrochemical detection, thermal acoustic sensing, and non-dispersive infrared (NDIR) detection [1,2]. NDIR sensing in the mid-infrared is particularly interesting due to the high selectivity arising from the characteristic absorption lines of most molecules. The inclusion of photonic microstructures provides a high potential for the miniaturization of NDIR sensors on CMOS-compatible platforms [3]. One of the approaches towards fully integrated NDIR gas detection uses resonant evanescent-wave sensing, where gas detection occurs via the absorption of the evanescent portion of the electric field of the light traveling through sub-wavelength dielectric waveguides [4]. Intensive work has been conducted for the detection of gases at mid-IR wavelengths, such as carbon dioxide (CO2), carbon monoxide, acetylene, and methane, using strip, slot, ridge, and photonic-crystal waveguides on technology platforms spanning from silicon, silicon on insulator (SOI), silicon on sapphire (SOS), chalcogenide glass, germanium on silicon, germanium on SOI, germanium on silicon nitride, and silicon on silicon nitride [5,6,7,8,9,10,11]. While several groups have focused on the theoretical optimization and experimental validation of waveguide structures for CO2 detection in the 4.26 µm band [12,13,14,15,16], several challenges toward the realization of fully integrated CO2 sensors remain open. In particular, cost-effective on-chip mid-IR gas sensors rely on the development of thermal sources and detectors; however, their integration with the waveguide is still a challenge.
Here, we focus on the evanescent-field sensing of CO2 at 4.25 µm using specially designed multimode waveguides, which promote efficient power coupling from incoherent sources and are fabricated on a silicon (Si) platform. Although the Si platform is ideal for the low-cost and well-established mass-fabrication capabilities and its CMOS compatibility, the wavelength region above 4 µm remains challenging because of the absorption onset of the typical cladding materials (silicon oxide, SiO2 [17], and silicon nitride, Si3N4 [18]), and deposition method employed for Si3N4.
In evanescent-wave sensing, the sensitivity of the waveguide is inversely proportional to the ratio between the confinement factor Γ , measuring the fraction of the electric energy within the analyte to be sensed, and the intrinsic propagation losses D due to material absorption and the scattering of the mode [19]. Accordingly, it is possible to define a figure of merit ( F O M ) to compare the different structures as [19,20]:
F O M = D Γ ,
where the F O M will be minimized.
In slot waveguides, the electric field of the guided modes is predominantly confined in the air between the two narrow strips, with confinement factors that can exceed 60% for the fundamental quasi-TE mode [19,21,22]. The disadvantage, as with any single-mode waveguide when used in combination with incoherent light sources, is the low power that can be coupled into the structure [23], which makes it difficult to operate with uncooled thermal detectors. The main limitation of single-mode waveguides relies on the fundamental limit to the power from a thermal source that can be coupled into a single mode [23]; therefore, multi-mode structures can be promising for such applications. We recently demonstrated multi-slot waveguides—arrays of slot waveguides arranged in parallel and close enough to each other to show a significant coupling efficiency—to be extremely promising structures for multi-mode evanescent-wave sensing, with the measured Γ as high as 57% [24]. In multi-slot waveguides, the large cross-section and a high number of modes allow for the increased in-coupling of thermal radiation. Despite the high Γ , the proposed (multi-)slot waveguides are very sensitive to side-wall roughness and imperfections due to the high field intensity at the strip walls and the large refractive-index difference with the air. As the quality of the side walls is technologically more difficult to control than the top and bottom surfaces of the waveguides, such structures typically suffer from high scattering losses, and their fabrication is challenging.
Here, we expand on our previous research by systematically increasing the strip- and gap width of multi-slot waveguides. The structures were designed using FEM simulations and produced on 8-inch wafers by mass-fabrication processes and were optically characterized. By increasing the strip width, the electric field was increasingly confined inside the waveguides, and the structures closely resembled arrays of coupled strip waveguides. For this reason, we refer to this structure class as the coupled-strip-array (CSA) in the following. If, on the one side, the increase in the strip width leads to a decrease in Γ in the cladding region, on the other side, the intrinsic damping and, especially, the effect of surface and side-wall imperfections are strongly reduced. We show that the well-known trade-off between these two effects [20,25], instead of leading to a single optimal geometry (minimizing the F O M ), gives rise to a class of structures that have similar values for the F O M within a large range of geometries. Such a flat F O M with respect to different geometries makes the structures robust towards fabrication tolerances and facilitates the design of the structure to the target application also in the presence of additional constraints, e.g., fabrication tolerances or strict requirements on the sensor size.

2. Materials and Methods

2.1. Simulations

Finite-element method (FEM) simulations of the structures were performed with COMSOL Multiphysics 5.5 and the wave optics module. All structures were composed of 660 nm high silicon strips located on a thin (140 nm) silicon nitride (Si3N4) layer and a thick (2 µm SiO2) substrate. The investigated CSA waveguides (Figure 1) had strip widths w comprised between 0.8 µm and 1.5 µm, separated by a gap width g comprised between 300 and 500 nm. The structures could be simulated by reducing the simulation domain to a single unit cell and imposing Floquet boundary conditions at the horizontal cell boundaries. The simulation was benchmarked against simulations using larger unit cells and periodic boundary conditions. The domain in the vertical direction extended for several µm above and below the waveguide in a way that prevented spurious effects at the boundaries, and no change in the retrieved mode was observed by further increasing the domain size. We additionally simulated an isolated strip waveguide by enlarging the size of the horizontal domain and removing periodicity. The simulations were performed in the mid-IR absorption band of CO2 at a wavelength of 4.25 µm, and the material parameters were taken from the literature (Si [26], Si3N4 [27], SiO2 [17]). We note here that by using these material parameters, were are implicitly neglecting any absorption losses in the silicon and the Si3N4 layers. Whereas this approximation can be reasonable for the silicon at these wavelengths, a certain amount of absorption losses is expected to take place in the Si3N4. The optical properties of Si3N4 are very diverse depending on the details of the fabrication processes (methods, deposition parameters) [17,27]. Due to the very small extinction coefficient of around 4.25 µm, it is difficult to obtain accurate measurements on thin films. Nevertheless, the absorption losses can be significant. We investigated the fabricated 140 nm Si3N4 thin films by ellipsometry (FTIR ellipsometer IR-VASE from J.A. Woollam Co., Lincoln, NE, USA), obtaining an excellent agreement with the results of Luke and coworkers with respect to the real part of the refractive index.
Table 1. Geometries of the fabricated CSA waveguides.
WaveguideWidth w [µm]Gap g [nm]
Strip *1.4-
A1.0300
B1.2300
C1.3300
D1.3400
* Experimental values from Reference [14].
The Si3N4 film was fabricated by LPCVD deposition, as in our work, confirming that there was a good reproducibility of the values of the refractive index for this fabrication process, despite small differences in the details of the production. However, in our measurements, the extinction coefficient was too small to be retrieved by the instrument. It is generally accepted that Si3N4 is less absorptive than SiO2 in the mid-infrared, around 4.25 µm. However, a previous study [14] suggested that the damping from LPCVD-deposited Si3N4 might surpass that of SiO2, although the possible contribution of surface roughness to the measured losses was not addressed. Given the large uncertainties in the value of the Si3N4 extinction coefficient, which translates into large differences in the waveguide damping, we found it reasonable to set the extinction coefficient of the Si3N4 layer to 0, keeping in mind that this would lead to some underestimation of the predicted damping. Moreover, the scattering loss due to the surface roughness was not accounted for in the simulations.
The classification of the waveguides was performed using the F O M defined in equation [1] for the fundamental quasi-TE mode. Both parameters Γ and D were retrieved by a performing modal analysis of the waveguides. The intrinsic damping of the desired mode was obtained by the imaginary part of the effective refractive index n e f f in the absence of an analyte as:
D = 4 π λ 0   Im n e f f ,
where λ 0 is the wavelength in a vacuum.
The confinement factor Γ was obtained from the relationship [19]:
Γ = Im n e f f Im n c l a d ,
where n e f f is the change in the refractive index of the mode upon the assumption that the introduction of the sensing medium causes a small perturbation n c l a d to the refractive index of the sensing region ( n c l a d ) . For the determination of Γ , three simulations were performed, adding a small imaginary part k to n c l a d to mimic a rise in the CO2 concentration in the proximity of the waveguide (k = 0, 1 × 10⁻⁵, 5 × 10⁻⁵, corresponding to a relative concentration of 0%, 0.1%, and 0.5% CO2).

2.2. Fabrication

The fabricated structures have parameters g and w as listed in Table 1. The CSAs investigated in this work consisted of two sections: the actual CSA waveguide, described above and depicted in Figure 1 and Figure 2, and the incoupling structures. The incoupling structures consist of a 0.2 mm long slab waveguide, as broad as the entire CSA. On the top surface of the slab, a grating was etched for incoupling the 4.25 µm light at an angle of 30° from the vertical. The waveguides were fabricated using a mass CMOS fabrication process. Briefly, a 2 µm-thick layer of SiO2 is deposited (LPCVD) on the 400 µm-thick silicon substrates. Another LPCVD process is used to deposit 140 nm Si3N4. The SiO2 and Si3N4 layers act as waveguide cladding. Finally, 660 nm of amorphous silicon is deposited, which is recrystallized by a temperature treatment at around 900 °C to obtain polycrystalline silicon. The polycrystalline silicon is dry etched in two steps to obtain first the waveguide structures, followed by the etching of the » 60 nm deep incoupling gratings. The fabrication process is described in our previous work [28].

2.3. Experimental Setup

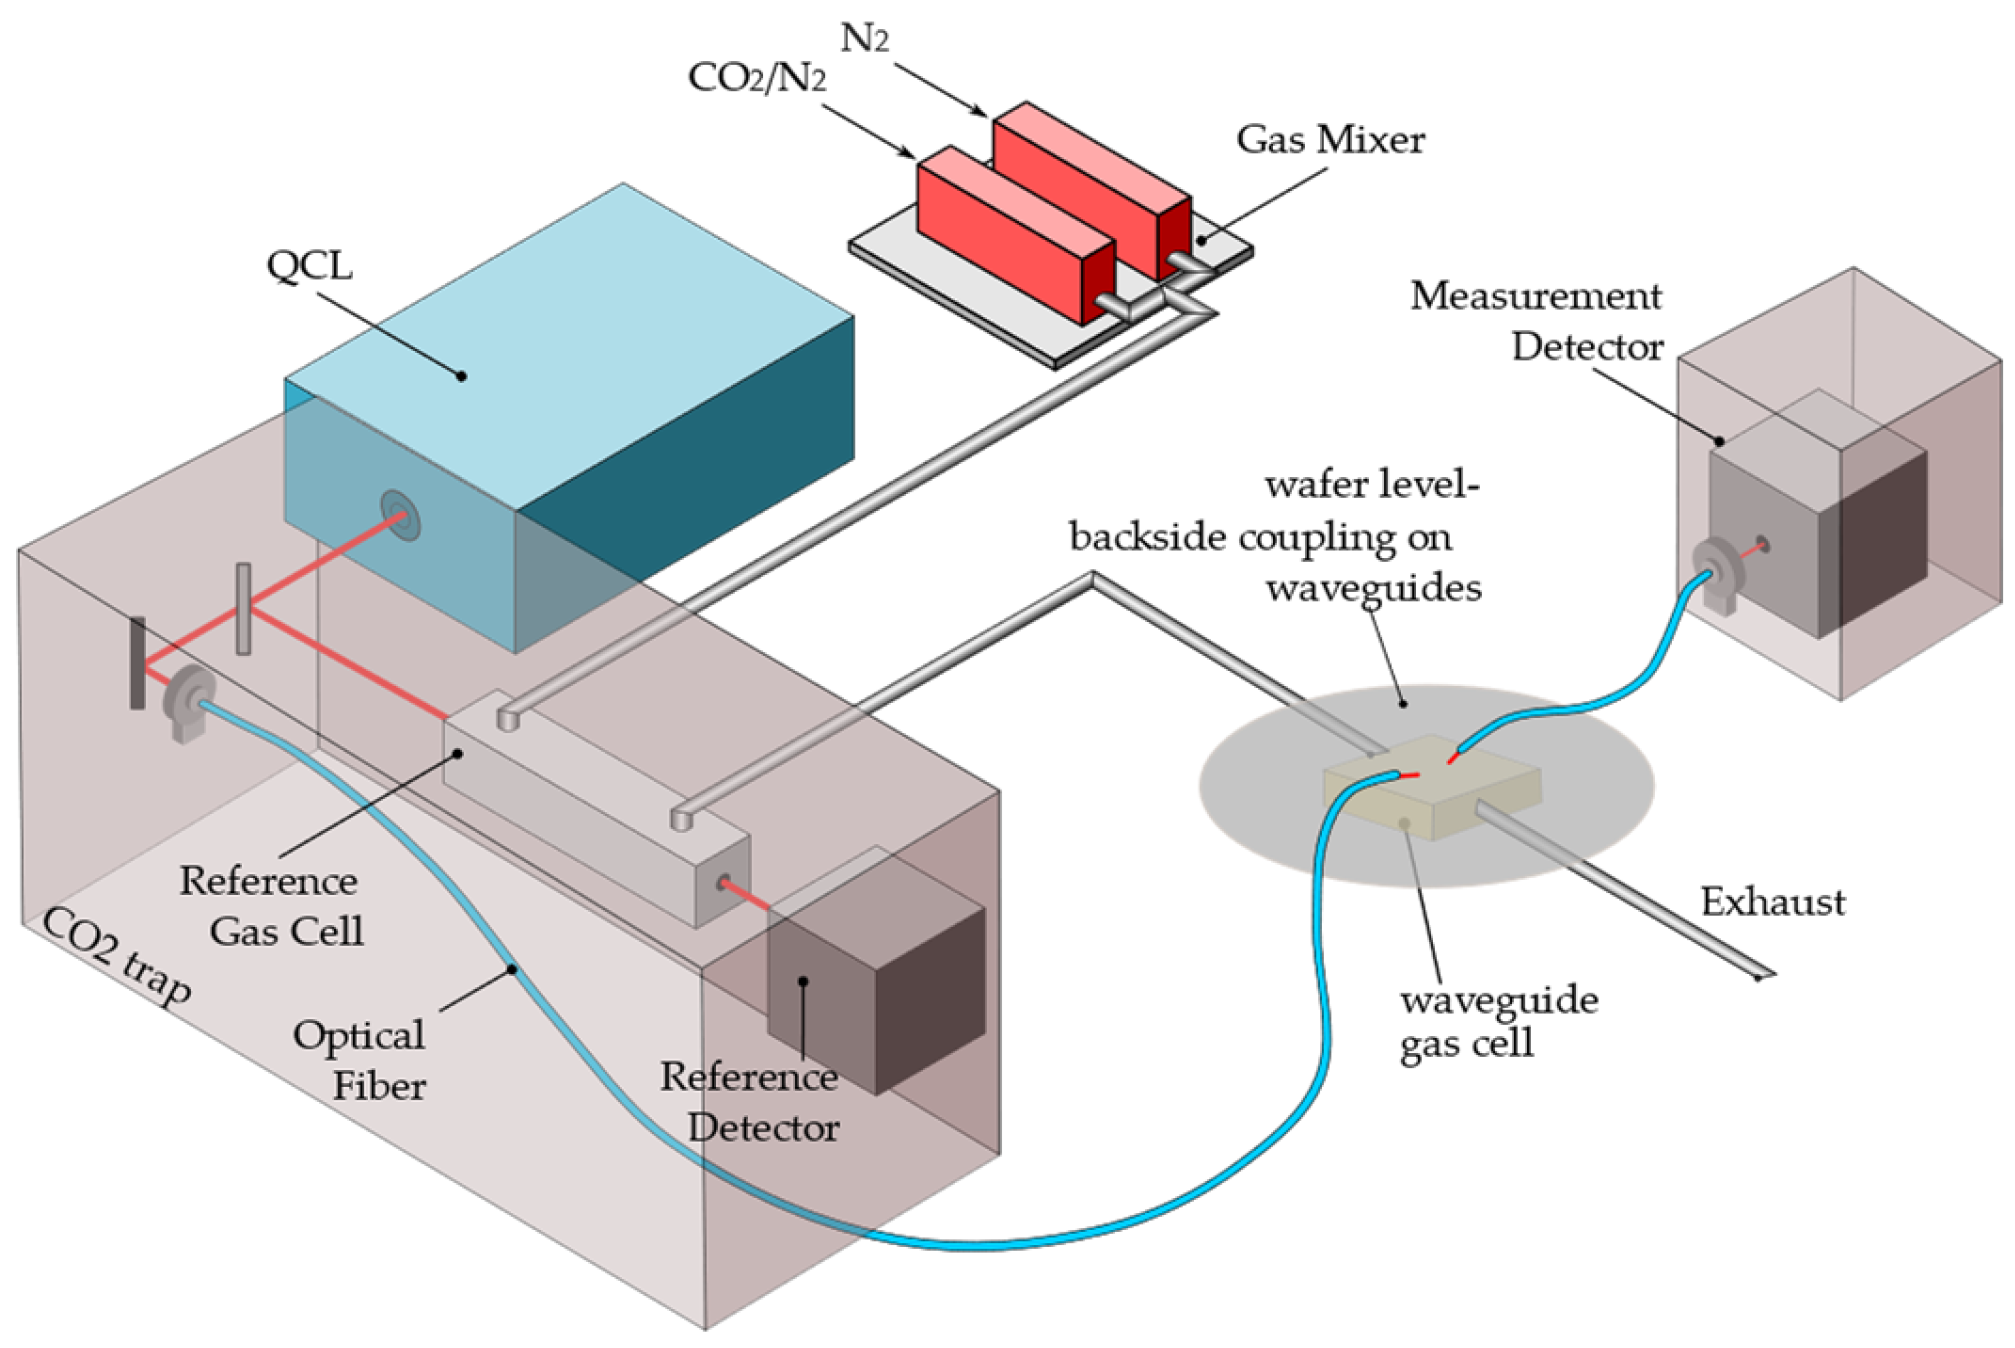
The experimental setup is schematically shown in Figure 3. The output of a quantum cascade laser (MIRcat, Daylight Solutions, San Diego, CA, USA), providing 500 ns pulses at a repetition rate of 100 kHz tunable between 4.08 µm and 4.34 µm, was split into two beams. The first beam (measurement path) was focused into a mid-IR fiber (Thorlabs MF11, Newton, NJ, USA) and conveyed to the waveguide. The light was injected into the waveguide by the illumination of the grating coupler at an angle of 30° from the vertical, and the alignment of the fiber with respect to the grating was performed with a manual 3D stage and a goniometer. At the other end of the waveguide, the light was collected by another bare-end fiber (Thorlabs MZ41) and detected by an MCT detector (Vigo Systems, PVI-2TE-6LabM-I-5, Warsaw, Poland) connected to a lock-in amplifier (Stanford Research, Redwood City, CA, USA). The second beam (reference path) traveled through a home-built stainless-steel—gas cell equipped with calcium fluoride windows, with an optical path length of l r e f = 1.7 mm. Detection was performed by a second MCT detector connected to a second lock-in amplifier. The reference path was realized such that the optical path length in the air was identical to the total optical path length in the air of the measurement path. Home-built enclosures were realized around the optical paths in the air and were continuously flushed with dry air traveling through a CO2 trap (NDC-300 CO2 adsorption dryer, Nano purification solutions) to avoid perturbations due to fluctuations of the CO2 in the optical path.
For each investigated CSA waveguide, four chips from two different wafers were measured. For each CSA type, three waveguides were fabricated near each other with different lengths of the CSA section, namely 1.25 mm, 2.5 mm, and 5 mm. The measurement of the waveguide damping D was performed by recording the intensity at the output of these three identical structures with different lengths. During the measurements, the height of the fibers with respect to the chip plane was maintained at a constant, and only the in-plane position of the fibers was adjusted to the grating position of the structures. Therefore, it can be assumed that the incoupled power was the same for the three structures. To avoid the additional damping due to light absorption by ambient CO2, the laser wavelength was tuned to 4.17 µm, which lies just outside the absorption band of gaseous CO2.
Measurements of Γ are performed at a wavelength of 4.23 µm. For these measurements, light coupling takes place from the backside of the chip through the substrate. The alignment of the fibers on the backside of the wafer is performed with the help of an IR camera (FLIR A6780 MWIR). A home-built gas cell (waveguide gas cell in Figure 3) is glued on the top side of the chip. The transmittance is measured as a function of the CO2 concentration while flushing a CO2-N2 mixture (Figure 3), controlled by two mass-flow controller units (red-y, Vögtlin, Muttenz, Switzerland). The reference and waveguide gas cells are connected in series such that the same CO2-N2 mixture flows through both. The transmittance measured through the reference gas cell is used to determine the effective absorption coefficient [14] of the gas mixture. Since the laser light is tuned to an absorption line of gaseous CO2, a critical step for the evaluation of Γ is to minimize any possible perturbation arising from CO2 fluctuations in the ambient air. Therefore, the enclosures are continuously purged with CO2-free dry air for the whole duration of the experiment.
We note here that the incoupling structures have been realized exclusively for the purpose of characterizing the waveguides with an external light source, while the final sensor design uses in-plane incoupling from a thermal emitter fabricated on the same chip. Therefore, no dedicated experiment was performed to test the incoupling efficiency of the gratings.

3. Results and Discussion

3.1. Simulations

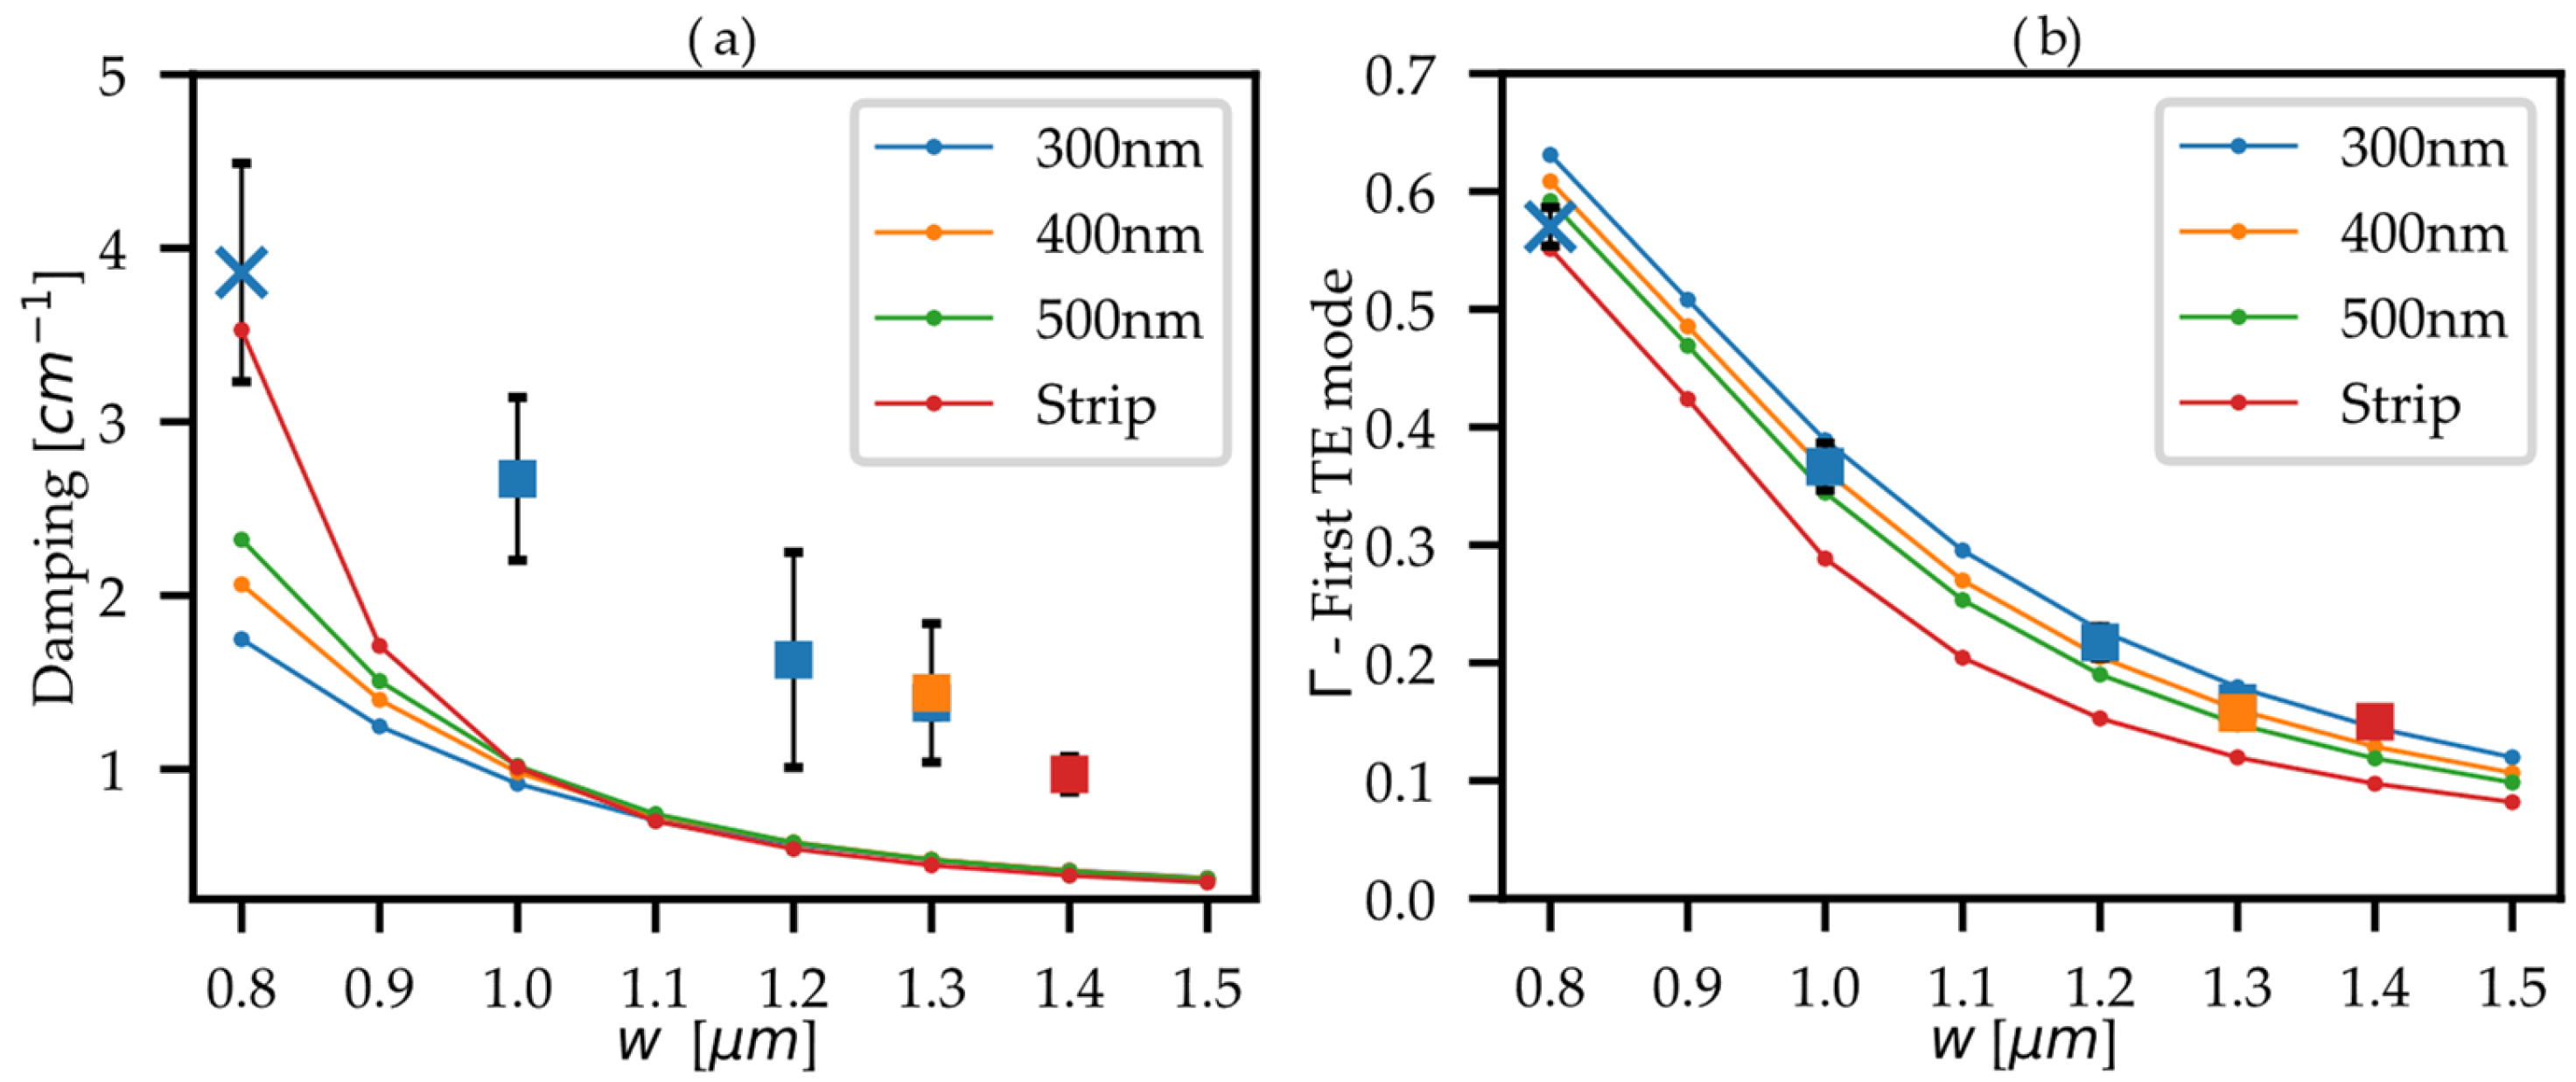
For all the simulated CSA waveguides, the retrieved D , Γ , and F O M for the fundamental quasi-TE mode were plotted as circular markers connected by lines in Figure 4. The simulation results on an isolated strip waveguide were also reported as a reference (red). Table 2 reports the simulated values corresponding to the structures that were fabricated and measured in this study.
As expected, the simulations predict that, at a constant gap size g, Γ increases strongly by decreasing the strip width w, as the electric field becomes “squeezed” in the air gap between the strips. At a constant strip width, Γ decreases by increasing g. In fact, a large gap corresponds to a lower degree of coupling between the adjacent strips; therefore, the larger the gap dimensions, the more the structure approaches the limit of an array of independent strip waveguides.
The simulated damping is rather gap-independent for all the structures with w > 1.1 µm. For structures with w ≤ 1.0 µm, the damping increased significantly and was higher for larger g. At small w, the electric field was pushed in the gap volume but also strongly into the cladding materials below the gap. In our simulations, all material losses were restricted to the SiO2; therefore, our results map the increased penetration depth of the electric field into the cladding. Any additional loss in the thin Si3N4 layer was expected to add to the damping with similar behavior. The simulations also predict lower damping for a smaller g because of the higher confinement of the field into the air gaps. The effect disappears when w increases because the field becomes more and more confined into the strip waveguide, where the vertical extension of the field into the substrate is similar to that of isolated strip waveguides, and the contribution from the field in the gaps is small.
We note here that surface and, especially, side-wall scattering losses, which are not included in our simulations, were expected to affect the structures, particularly for small g because of the higher field intensities at the side walls. Therefore, the trend showing lower damping for smaller g sizes might change in the presence of large side-wall roughness. While it would be very interesting to include scattering losses in our model, a precise experimental characterization of the waveguide side-wall quality in the gaps, including its homogeneity within the waveguide arrays and along the CSA length, is extremely challenging and modeling is thus difficult to rely on. Moreover, the quality of the sidewalls depends strongly on the details of the fabrication processes, and thus, it is a poorly reproducible parameter. The simulation results presented here should be then considered as the best-case scenario that can be approached by an excellent fabrication quality. In comparison, the experimental results shown below represent a low-cost fabrication scenario, where no special treatment was applied to ensure the minimization of side-wall roughness [29,30,31,32].

3.2. Experimental Determination of the Damping D

The damping was evaluated by measuring the intensity of the light out-coupled from the three waveguides with different lengths. The measured data had a linear fit of log I = log ( I 0 ) D · l [14]. Four measured structures for each CSA type were used to determine the average value and standard deviations reported in Figure 4 and Table 2. There was some variation in the measured damping between the different chips, which is reflected in the error bar reported in Table 2 and Figure 4. This might result from (i) minor variations in the vertical distance between the fiber and chip while performing the three measurements, (ii) laser stability, or (iii) small differences in the quality of the waveguides or grating couplers for different chips. As expected, the experimental values were higher than the simulations since the absorption from silicon nitride and scattering losses were neglected in the simulations.

3.3. Experimental Determination of the Confinement Factor Γ

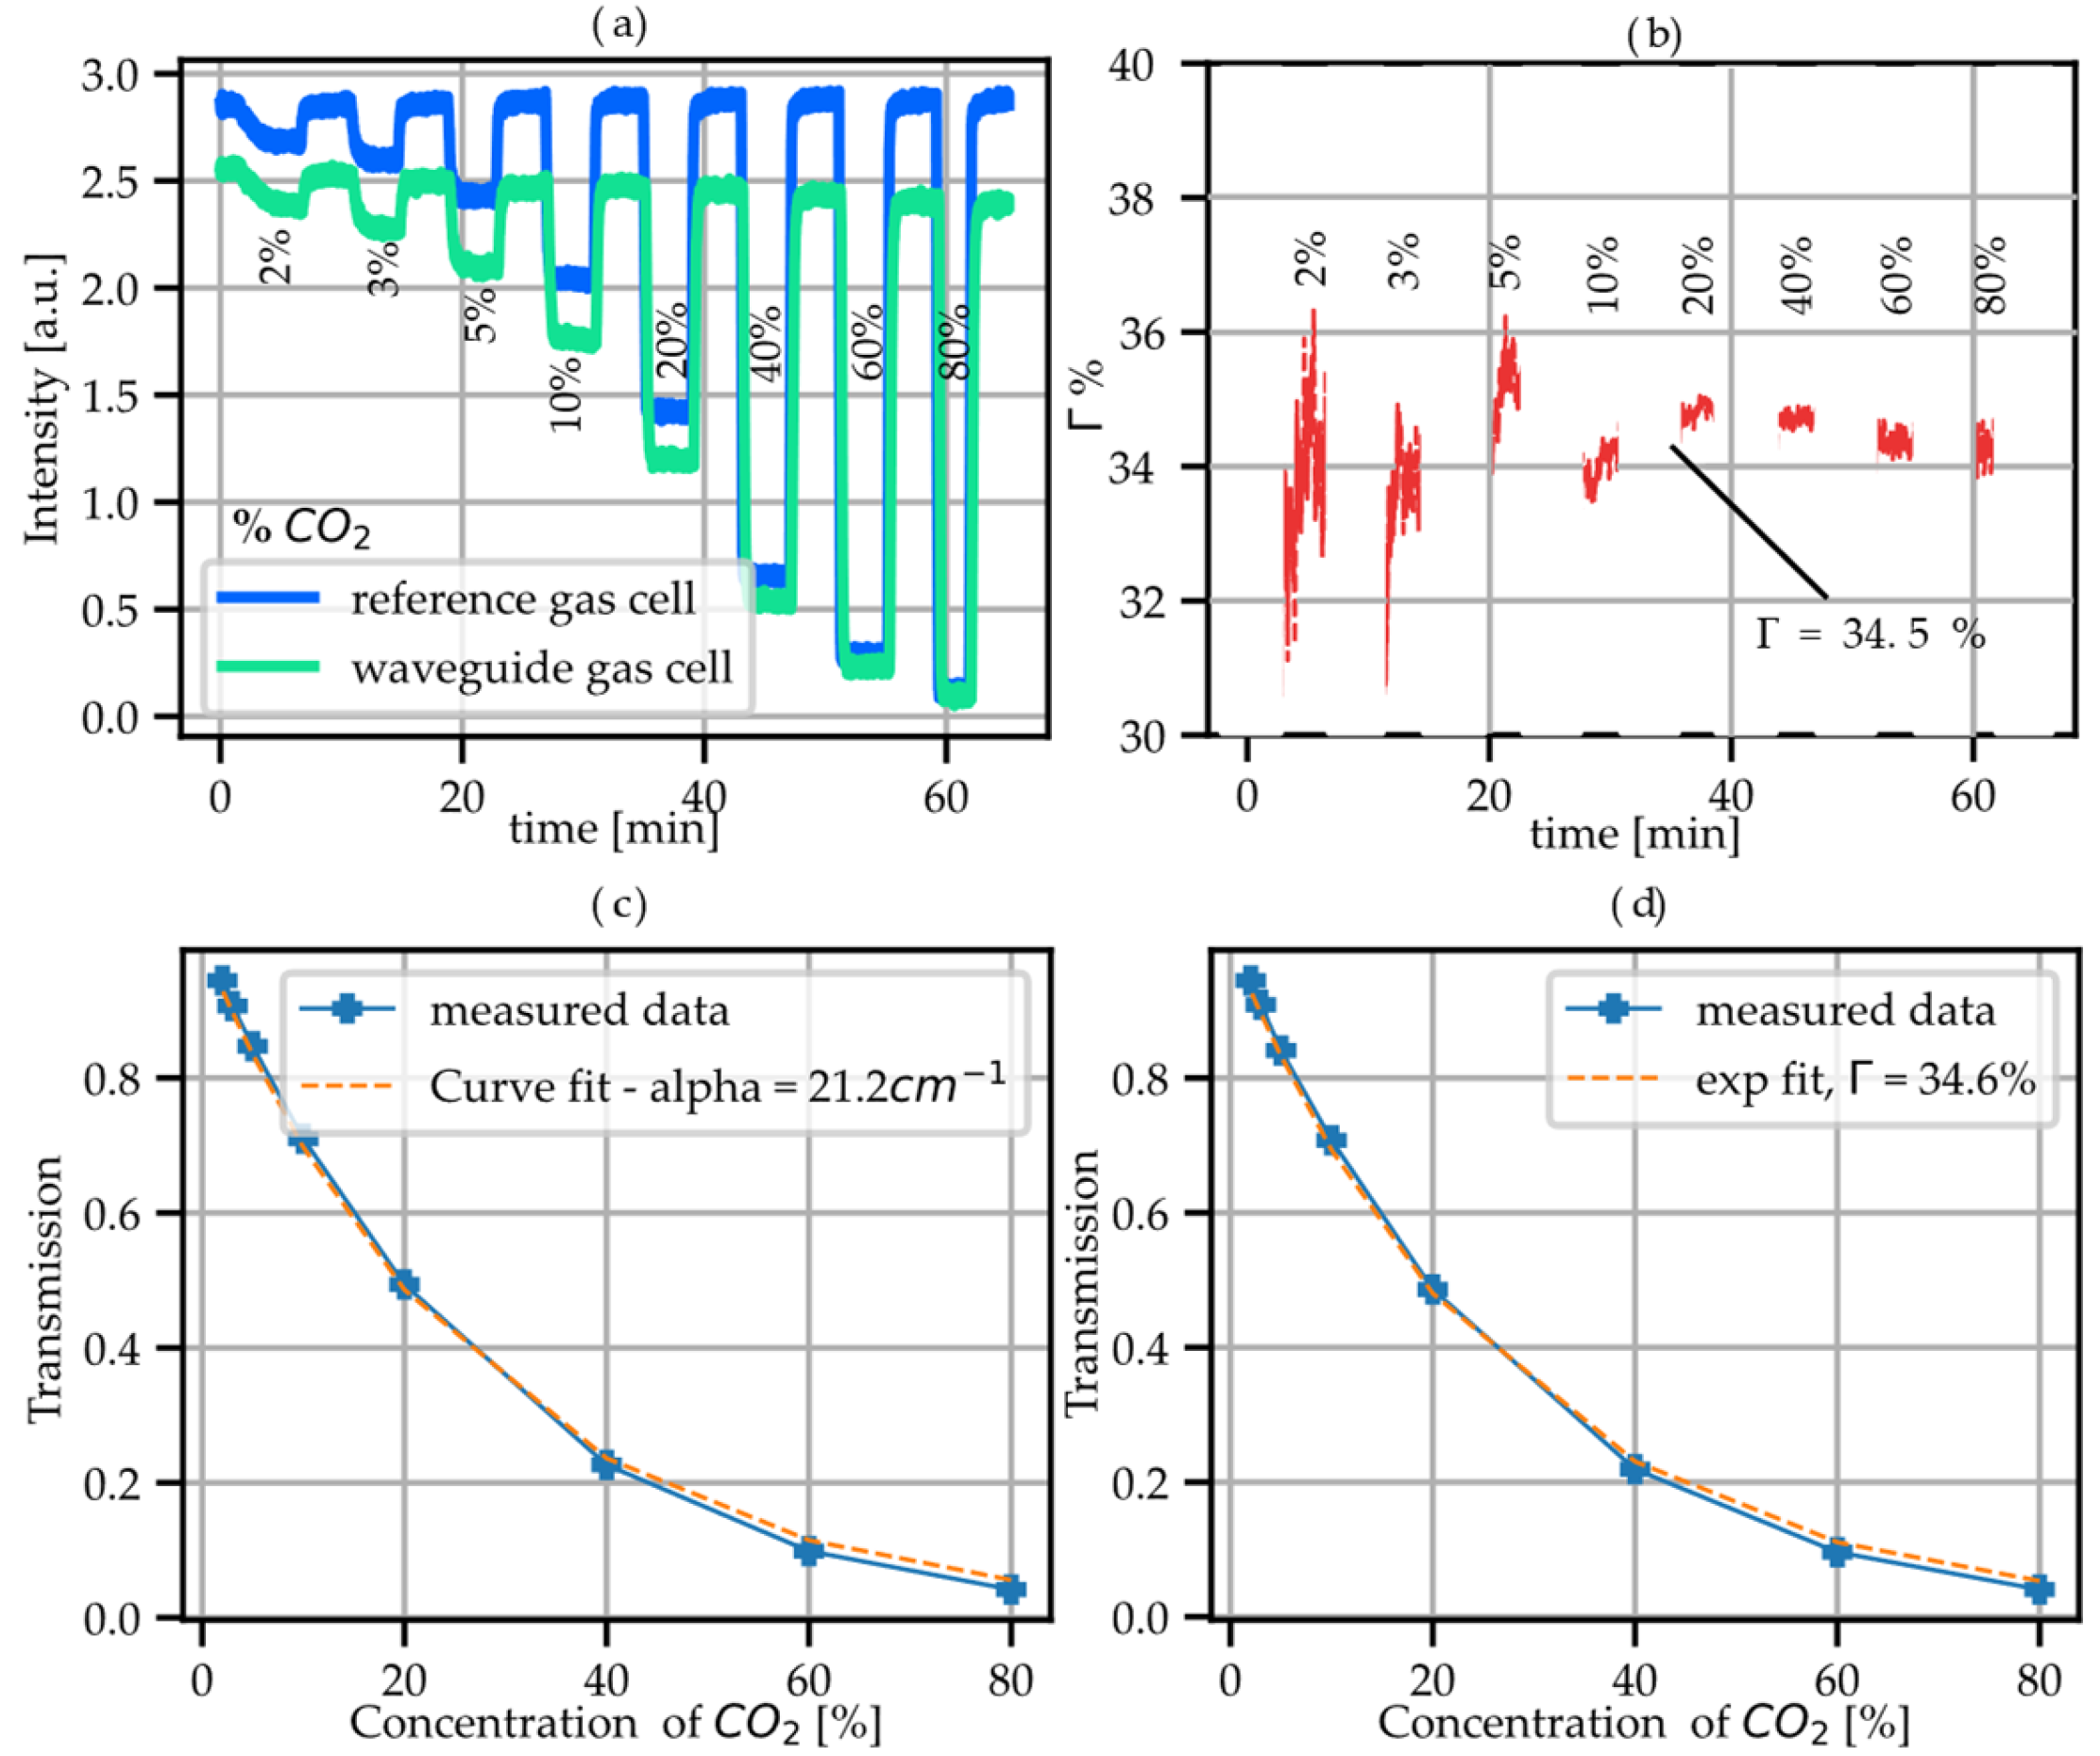
For all CSA waveguides, transmission measurements were performed at concentrations of CO2 varying between 2% and 100% (Figure 5a), and the estimation of Γ was conducted from the data up to 80%. For concentrations >80%, no longer change in the out-coupled light was observed as the gas cell became saturated. The confinement factor Γ was obtained by modeling the transmittance through the waveguide ( T w g ) as an exponentially decaying function of the concentration c according to the BeerLambert law:
T w g = e α e f f · Γ · c · l w g ,
where l w g is the length of the waveguide (the waveguides with l w g = 0.5 cm was used for these measurements) and the absorption coefficient of the gas was replaced by an effective absorption coefficient α e f f , taking into account the overlap between the laser spectrum and the narrow absorption lines of CO2 [33].
A reference transmission T r e f measurement through the l r e f = 1.7 mm-long reference gas cell was performed simultaneously with each CSA measurement:
T r e f = e α e f f · c · l r e f .
Typically, the effective absorption coefficient α e f f was estimated from T r e f [14], and the obtained value was used to determine Γ from the fit of the data with Equation (4).
Here, we evaluate our data using another approach. We observe that this two-step extraction of Γ can be simplified if the concentration of CO2 can be considered identical in both cells at any point in time by re-writing Γ from Equations (4) and (5) as:
Γ = l r e f l w g · l n T w g l n T r e f .
Using this formula for the extraction of Γ has two benefits: (i) it does not require precise additional concentration measurements or (ii) an absorption coefficient measurement. In our experiment, since the gas cells are connected in series, c is identical by design in both gas cells (except for a short transient at the beginning of each concentration step due to the finite tube length separating the cells). Γ is estimated from the measurements in the region where the concentration of CO2 is not zero, indicated in Figure 5b by black markings.
Figure 5 shows an exemplary comparison of the two approaches for waveguide A. As expected, the retrieved Γ is very similar. One can observe in Figure 5b that the estimation of Γ shows increased noise and small deviations at c < 10%, which is due to the longer stabilization time, connected to the diffusion of the gas within the cells, and the smaller signals (and thus worse signal-to-noise ratios). Small shifts in the baseline, e.g., due to long-term power changes in the laser or mechanical drifts causing small changes in the light coupling into the waveguide, might also contribute to this effect. Finally, Γ is evaluated as the mean of the values obtained by Equation (6) at all concentrations, and the reported error is ±1σ. For all CSA waveguides, the retrieved Γ values are reported in Table 2 and graphically plotted in Figure 4 for comparison with the simulations.

3.4. Determination of the F O M

For all investigated CSA waveguides, the F O M was calculated from D and Γ by Equation (1). The F O M was predicted by the simulations shown as circles and connected by lines in Figure 6. For all CSA waveguides, the simulated F O M was relatively flat for w comprised between 0.9 µm and 1.3 µm, with an optimal geometry of (w = 1.0 µm, g = 300 nm), and only a very small increase was observed by increasing the gap size g.
The experimentally retrieved F O M plotted as squares in Figure 6 was larger than the simulated values, which was mostly caused by the higher measured damping. The measured F O M is very similar to the measured structures, with waveguide A showing the lowest value.
Interestingly, all CSA waveguides showed damping that appeared to be about three times larger than the simulated D . The strip waveguide and the multi-slot waveguide (w = 0.8 µm, g = 300 nm) show a damping increase by a factor of between 2.5 and 2.2, respectively. These structures have been produced with the same fabrication processes but on different lots implementing different waveguide designs.
Our experimental data do not allow us to completely disentangle the contributions to the total damping arising from Si3N4 intrinsic losses and the side-wall roughness. SEM measurements of previously published structures [24] confirm the presence of significant side-wall roughness in the gaps of our fabrication protocols. Nevertheless, the behavior of D observed for the series of CSA waveguides with g = 300 nm suggests an important contribution from the intrinsic loss of Si3N4. Damping caused by this mechanism, indeed, is expected to mimic the trend of the simulated losses in SiO2 since an increase in the electric field intensity in the cladding affects both layers similarly. On the contrary, scattering losses in the gaps are expected to affect the structures remarkably with smaller w (because of the higher field at the side walls). The fabrication of more CSA waveguides of all three g-series will help us to retrieve the relative contribution of these effects and will allow us to derive a reliable value for the intrinsic losses of LPCVD Si3N4 at these wavelengths, as well as an estimation of the fabrication quality for the three different gap sizes.
The F O M defined by Equation (1) is defined at the optimal length of the waveguide [19] and expresses how good a waveguide is at sensing by being proportional to the smallest measurable concentration, all things being equal. In particular, it contains information on the magnitude of the signal reaching the end of the waveguide with respect to the input power. One of the main benefits of having a class of structures where the F O M does not vary much for different geometries is that it allows us to accommodate the limitations and tolerances of the fabrication processes. The little variation in the F O M between the simulated geometries with the same pitch but a different w/g ratio (as, for example, the black circles in Figure 6) speaks for a very robust design, where little detrimental effects on the waveguide performance were observed upon even significant geometrical changes. However, we shall not forget that the waveguide is only the sensing element, and there are other relevant elements for the performance of an integrated gas sensor that has not been discussed in this paper so far. These include:
  • The capability of efficiently coupling thermal light into the waveguide. A recent paper [34] proposed a design for a Slab Tamm Plasmon Resonator coupled to a multistrip array for the efficient incoupling of thermal radiation in the mid-IR. While the study investigated only one geometry for the waveguide element, focusing instead on the dependence of the coupling on the slab thickness, it is very likely that the other CSA dimensions (g and w) might also have had an influence on the coupling efficiency and resonance damping.
  • Final sensor size. The proposed CSA waveguides are “bulky” when compared to single-strip waveguides, which can be packed in compact meander structures. With the F O M being similar for all structures, the structure with the shortest optimal length can be chosen to minimize the sensor size at a comparable performance.
  • Fabrication capabilities. Depending on the available technologies and on the typical quality of the fabricated waveguides, a structure that is less demanding in terms of fabrication can be selected without loss in sensitivity.
Although the CSA waveguides presented here were designed for CO2 sensing, similar structures can be implemented for sensing other gases upon adapting the dimensions to the target wavelength. While for gases absorbing in the lower mid-IR range, the silicon platform can provide good performance, at wavelengths above 4.5 µm, due to the high intrinsic losses in the cladding materials, the choice falls on more performant platforms, e.g., chalcogenide glass or Ge. In any case, the performance of CSA waveguides for sensing the desired analyte needs to be evaluated on a case-to-case basis, as it also depends on the absorption coefficient of the gas, the target concentration range, and the details of the implemented light source and detector.

4. Conclusions

In summary, we investigated, both numerically and experimentally, a class of waveguides based on an array of coupled slot waveguides, which were designed for CO2 sensing in the mid-IR at 4.25 µm. The multi-mode character of the array structures, allowing for a higher incoupled power from thermal sources as compared to conventional single-mode waveguides, makes these structures particularly promising for fully integrated chip-scale sensors [24]. Here, we demonstrate that this class of structures shows a comparable performance over a large choice of geometrical parameters due to the interplay between the confinement factor and intrinsic losses, making them robust in performance, and interesting solutions can be adapted to the details of the final sensor and different fabrication requirements. We believe that the proposed structures have great potential for enabling inexpensive silicon-based on-chip gas sensing in the mid-IR using thermal sources and detectors.

Author Contributions

Conceptualization, C.C., C.F., F.D., T.D.D. and A.T.; methodology, C.C., C.F., F.D., T.D.D., A.T., R.J., P.S., G.P. and B.J.; formal analysis, P.T., C.C., A.T. and C.F.; investigation, P.T., C.C., C.F., F.D., T.D.D. and A.T.; resources, G.S., T.O., T.G., R.J., P.S., G.P. and B.J.; writing—original draft preparation, P.T. and C.C.; writing—review and editing, P.T., C.C., C.F., F.D., T.D.D., R.J., P.S., G.P., A.T., T.O. and T.G.; visualization, P.T., C.C., A.T. and C.F.; supervision, C.C., C.F. and A.T.; project administration, T.G., C.F. and B.J. All authors have read and agreed to the published version of the manuscript.

Funding

This work was performed within the COMET Centre ASSIC, Austrian Smart Systems Integration Research Center, which is funded by BMK, BMDW, and the Austrian provinces of Carinthia and Styria, within the framework of COMET—Competence Centers for Excellent Technologies. The COMET program is run by FFG (funding number-865890).

Institutional Review Board Statement

Not applicable.

Informed Consent Statement

Not applicable.

Data Availability Statement

The data presented in this study are available from the authors upon reasonable request.

Conflicts of Interest

The authors declare no conflict of interest.

References

  1. Lakkis, S.; Younes, R.; Alayli, Y.; Sawan, M. Review of Recent Trends in Gas Sensing Technologies and Their Miniaturization Potential. Sens. Rev. 2014, 34, 24–35. [Google Scholar] [CrossRef]
  2. Popa, D.; Udrea, F. Towards Integrated Mid-Infrared Gas Sensors. Sensors 2019, 19, 2076. [Google Scholar] [CrossRef] [Green Version]
  3. Chowdhury, M.F.; Hopper, R.; Ali, S.Z.; Gardner, J.W.; Udrea, F. MEMS Infrared Emitter and Detector for Capnography Applications. Procedia Eng. 2016, 168, 1204–1207. [Google Scholar] [CrossRef]
  4. Almeida, V.R.; Xu, Q.; Barrios, C.A.; Lipson, M. Guiding and Confining Light in Void Nanostructure. Opt. Lett. 2004, 29, 1209. [Google Scholar] [CrossRef]
  5. Lin, H.; Luo, Z.; Gu, T.; Kimerling, L.C.; Wada, K.; Agarwal, A.; Hu, J. Mid-Infrared Integrated Photonics on Silicon: A Perspective. Nanophotonics 2017, 7, 393–420. [Google Scholar] [CrossRef]
  6. Hu, T.; Dong, B.; Luo, X.; Liow, T.-Y.; Song, J.; Lee, C.; Lo, G.-Q. Silicon Photonic Platforms for Mid-Infrared Applications [Invited]. Photonics Res. 2017, 5, 417. [Google Scholar] [CrossRef] [Green Version]
  7. Wu, J.; Yue, G.; Chen, W.; Xing, Z.; Wang, J.; Wong, W.R.; Cheng, Z.; Set, S.Y.; Senthil Murugan, G.; Wang, X.; et al. On-Chip Optical Gas Sensors Based on Group-IV Materials. ACS Photonics 2020, 7, 2923–2940. [Google Scholar] [CrossRef]
  8. Su, P.; Han, Z.; Kita, D.; Becla, P.; Lin, H.; Deckoff-Jones, S.; Richardson, K.; Kimerling, L.C.; Hu, J.; Agarwal, A. Monolithic On-Chip Mid-IR Methane Gas Sensor with Waveguide-Integrated Detector. Appl. Phys. Lett. 2019, 114, 051103. [Google Scholar] [CrossRef] [Green Version]
  9. Alberti, S.; Datta, A.; Jágerská, J. Integrated Nanophotonic Waveguide-Based Devices for IR and Raman Gas Spectroscopy. Sensors 2021, 21, 7224. [Google Scholar] [CrossRef]
  10. Vlk, M.; Datta, A.; Alberti, S.; Yallew, H.D.; Mittal, V.; Murugan, G.S.; Jágerská, J. Extraordinary Evanescent Field Confinement Waveguide Sensor for Mid-Infrared Trace Gas Spectroscopy. Light Sci. Appl. 2021, 10, 26. [Google Scholar] [CrossRef]
  11. Butt, M.A.; Degtyarev, S.A.; Khonina, S.N.; Kazanskiy, N.L. An Evanescent Field Absorption Gas Sensor at Mid-IR 3.39 Μm Wavelength. J. Mod. Opt. 2017, 64, 1892–1897. [Google Scholar] [CrossRef] [Green Version]
  12. Baehr-Jones, T.; Spott, A.; Ilic, R.; Spott, A.; Penkov, B.; Asher, W.; Hochberg, M. Silicon-on-Sapphire Integrated Waveguides for the Mid-Infrared. Opt. Express 2010, 18, 12127. [Google Scholar] [CrossRef] [Green Version]
  13. Ottonello-Briano, F.; Errando-Herranz, C.; Rödjegård, H.; Martin, H.; Sohlström, H.; Gylfason, K.B. Carbon Dioxide Absorption Spectroscopy with a Mid-Infrared Silicon Photonic Waveguide. Opt. Lett. 2020, 45, 109–112. [Google Scholar] [CrossRef] [Green Version]
  14. Ranacher, C.; Consani, C.; Vollert, N.; Tortschanoff, A.; Bergmeister, M.; Grille, T.; Jakoby, B. Characterization of Evanescent Field Gas Sensor Structures Based on Silicon Photonics. IEEE Photonics J. 2018, 10, 2700614. [Google Scholar] [CrossRef]
  15. Lim, J.; Shim, J.; Geum, D.-M.; Kim, S. Experimental Demonstration of Germanium-on-Silicon Slot Waveguides at Mid-Infrared Wavelength. IEEE Photonics J. 2022, 14, 582870. [Google Scholar] [CrossRef]
  16. Gutierrez-Arroyo, A.; Baudet, E.; Bodiou, L.; Nazabal, V.; Rinnert, E.; Michel, K.; Bureau, B.; Colas, F.; Charrier, J. Theoretical Study of an Evanescent Optical Integrated Sensor for Multipurpose Detection of Gases and Liquids in the Mid-Infrared. Sens. Actuators B Chem. 2017, 242, 842–848. [Google Scholar] [CrossRef]
  17. Kischkat, J.; Peters, S.; Gruska, B.; Semtsiv, M.; Chashnikova, M.; Klinkmüller, M.; Fedosenko, O.; Machulik, S.; Aleksandrova, A.; Monastyrskyi, G.; et al. Mid-Infrared Optical Properties of Thin Films of Aluminum Oxide, Titanium Dioxide, Silicon Dioxide, Aluminum Nitride, and Silicon Nitride. Appl. Opt. 2012, 51, 6789–6798. [Google Scholar] [CrossRef]
  18. Philipp, H.R. Optical Properties of Silicon Nitride. J. Electrochem. Soc. 1973, 120, 295. [Google Scholar] [CrossRef]
  19. Consani, C.; Dubois, F.; Auböck, G. Figures of Merit for Mid-IR Evanescent-Wave Absorption Sensors and Their Simulation by FEM Methods. Opt. Express 2021, 29, 9723. [Google Scholar] [CrossRef]
  20. Kita, D.M.; Michon, J.; Johnson, S.G.; Hu, J. Are Slot and Sub-Wavelength Grating Waveguides Better than Strip Waveguides for Sensing? Optica 2018, 5, 1046. [Google Scholar] [CrossRef]
  21. Zengzhi, H.; Zhang, Y.; Zeng, C.; Li, D.; Nisar, M.S.; Yu, J.; Xia, J. High Confinement Factor Ridge Slot Waveguide for Optical Sensing. IEEE Photonics Technol. Lett. 2015, 27, 2395–2398. [Google Scholar] [CrossRef]
  22. Steglich, P.; Villringer, C.; Dümecke, S.; Padilla Michel, Y.; Casalboni, M.; Schrader, S. Silicon-on-Insulator Slot-Waveguide Design Trade-Offs. In Proceedings of the 3rd International Conference on Photonics, Optics and Laser Technology, Berlin, Germany, 13–15 March 2015; SCITEPRESS—Science and and Technology Publications: Berlin, Germany, 2015; pp. 47–52. [Google Scholar]
  23. Fohrmann, L.S.; Petrov, A.Y.; Lang, S.; Jalas, D.; Krauss, T.F.; Eich, M. Single Mode Thermal Emission. Opt. Express 2015, 23, 27672–27682. [Google Scholar] [CrossRef]
  24. Consani, C.; Dubois, F.; Thakkar, P.; Stocker, G.; Fleury, C.; Dao, T.D.; Zhai, Y.; Pühringer, G.; Jannesari, R.; Saeidi, P.; et al. A High Sensitivity Multi-Slot Silicon Waveguide for Mid-IR Evanescent-Field Sensing. Opt. Lett. 2022. submitted. [Google Scholar]
  25. Subramanian, A.Z.; Ryckeboer, E.; Dhakal, A.; Peyskens, F.; Malik, A.; Kuyken, B.; Zhao, H.; Pathak, S.; Ruocco, A.; De Groote, A.; et al. Silicon and Silicon Nitride Photonic Circuits for Spectroscopic Sensing On-a-Chip [Invited]. Photonics Res. 2015, 3, B47. [Google Scholar] [CrossRef] [Green Version]
  26. Pühringer, G.; Consani, C.; Jannesari, R.; Fleury, C.; Dubois, F.; Spettel, J.; Dao, T.D.; Stocker, G.; Grille, T.; Jakoby, B. Design of a Slab Tamm Plasmon Resonator Coupled to a Multistrip Array Waveguide for the Mid Infrared. Sensors 2022, 22, 2968. [Google Scholar] [CrossRef]
  27. Edwards, D.F.; Ochoa, E. Infrared Refractive Index of Silicon. Appl. Opt. 1980, 19, 4130–4131. [Google Scholar] [CrossRef]
  28. Luke, K.; Okawachi, Y.; Lamont, M.R.E.; Gaeta, A.L.; Lipson, M. Broadband Mid-Infrared Frequency Comb Generation in a Si3N4 Microresonator. Opt. Lett. 2015, 40, 4823–4826. [Google Scholar] [CrossRef]
  29. Ranacher, C.; Consani, C.; Tortschanoff, A.; Jannesari, R.; Bergmeister, M.; Grille, T.; Jakoby, B. Mid-Infrared Absorption Gas Sensing Using a Silicon Strip Waveguide. Sens. Actuators Phys. 2018, 277, 117–123. [Google Scholar] [CrossRef]
  30. Gao, F.; Ylinen, S.; Kainlauri, M.; Kapulainen, M. Smooth Silicon Sidewall Etching for Waveguide Structures Using a Modified Bosch Process. J. Micro/Nanolithography MEMS MOEMS 2014, 13, 013010. [Google Scholar] [CrossRef]
  31. Gao, F.; Wang, Y.; Cao, G.; Jia, X.; Zhang, F. Reduction of Sidewall Roughness in Silicon-on-Insulator Rib Waveguides. Appl. Surf. Sci. 2006, 252, 5071–5075. [Google Scholar] [CrossRef]
  32. Lee, M.-C.M.; Wu, M.C. Thermal Annealing in Hydrogen for 3-D Profile Transformation on Silicon-on-Insulator and Sidewall Roughness Reduction. J. Microelectromech. Syst. 2006, 15, 338–343. [Google Scholar] [CrossRef]
  33. Lee, D.H.; Choo, S.J.; Jung, U.; Lee, K.W.; Kim, K.W.; Park, J.H. Low-Loss Silicon Waveguides with Sidewall Roughness Reduction Using a SiO2hard Mask and Fluorine-Based Dry Etching. J. Micromech. Microeng. 2014, 25, 015003. [Google Scholar] [CrossRef]
  34. Consani, C.; Ranacher, C.; Tortschanoff, A.; Grille, T.; Irsigler, P.; Jakoby, B. Mid-Infrared Photonic Gas Sensing Using a Silicon Waveguide and an Integrated Emitter. Sens. Actuators B Chem. 2018, 274, 60–65. [Google Scholar] [CrossRef]
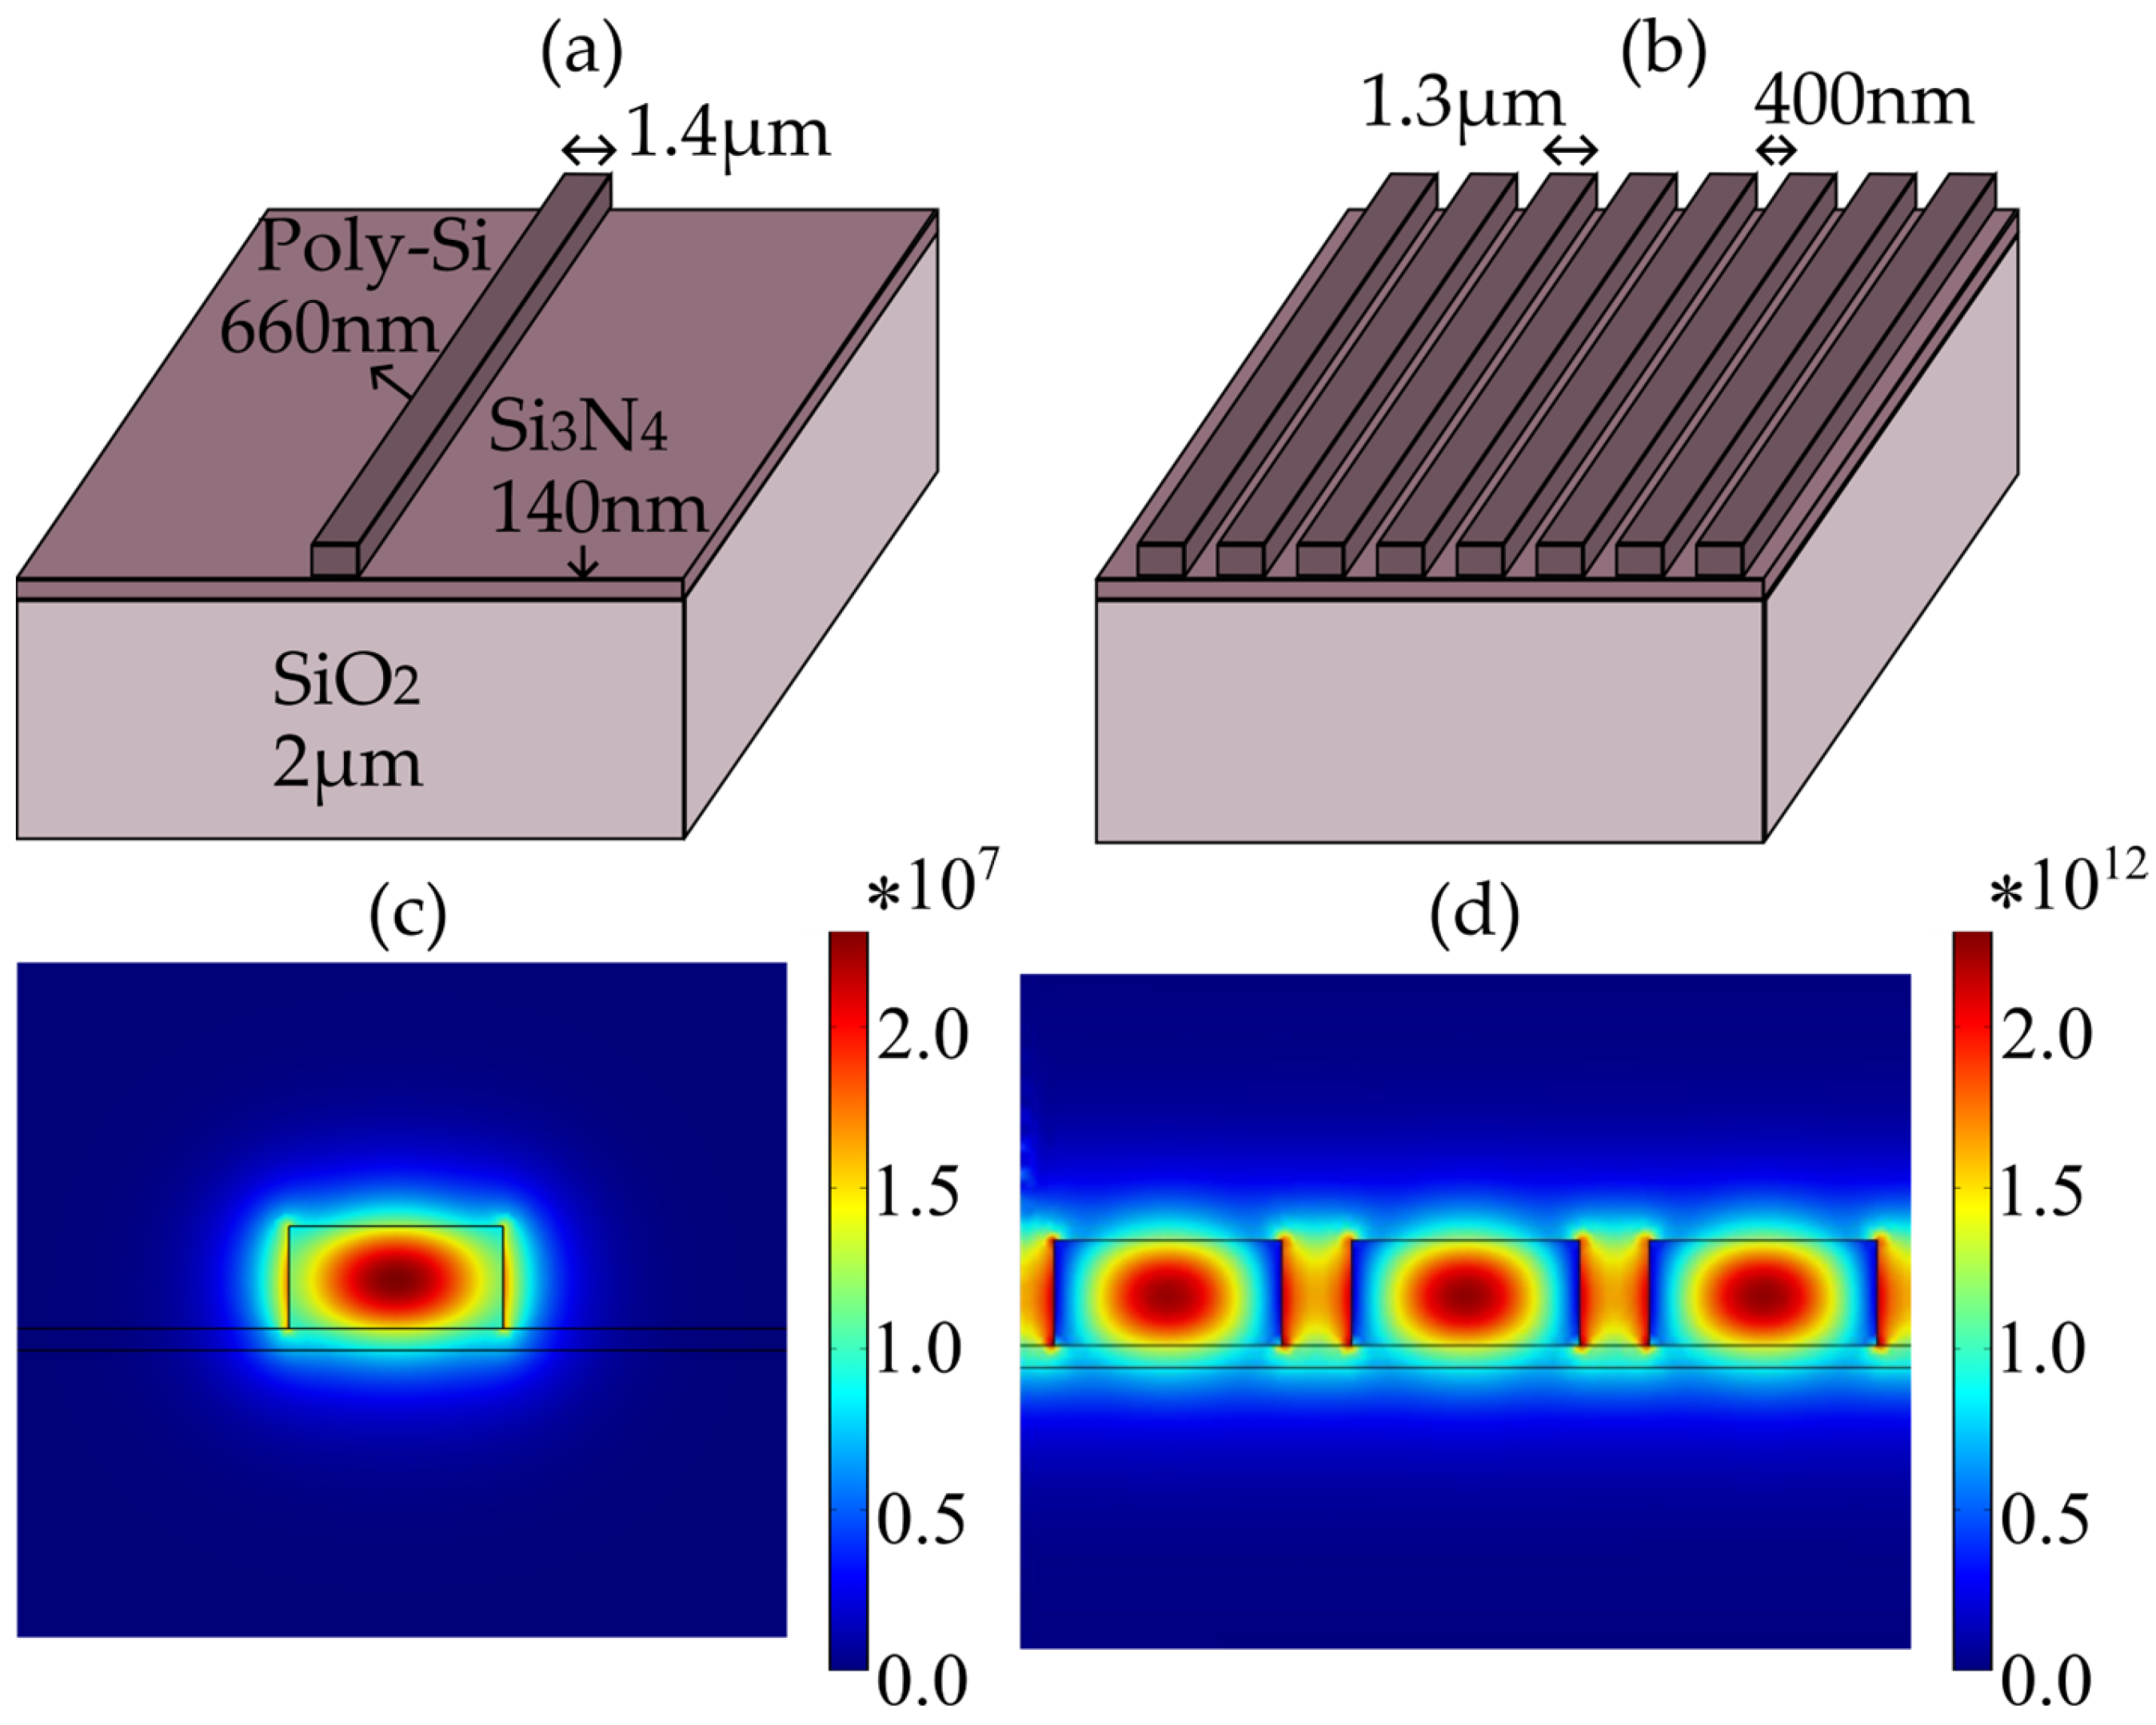
Figure 1. (a) Schematics of a strip waveguide compared to (b) the investigated CSA waveguides. (c,d) Transverse electric field distribution of the fundamental quasi-TE mode as retrieved from FEM simulations for the waveguide dimensions reported in (a,b), respectively.
Photonics 10 00055 g001
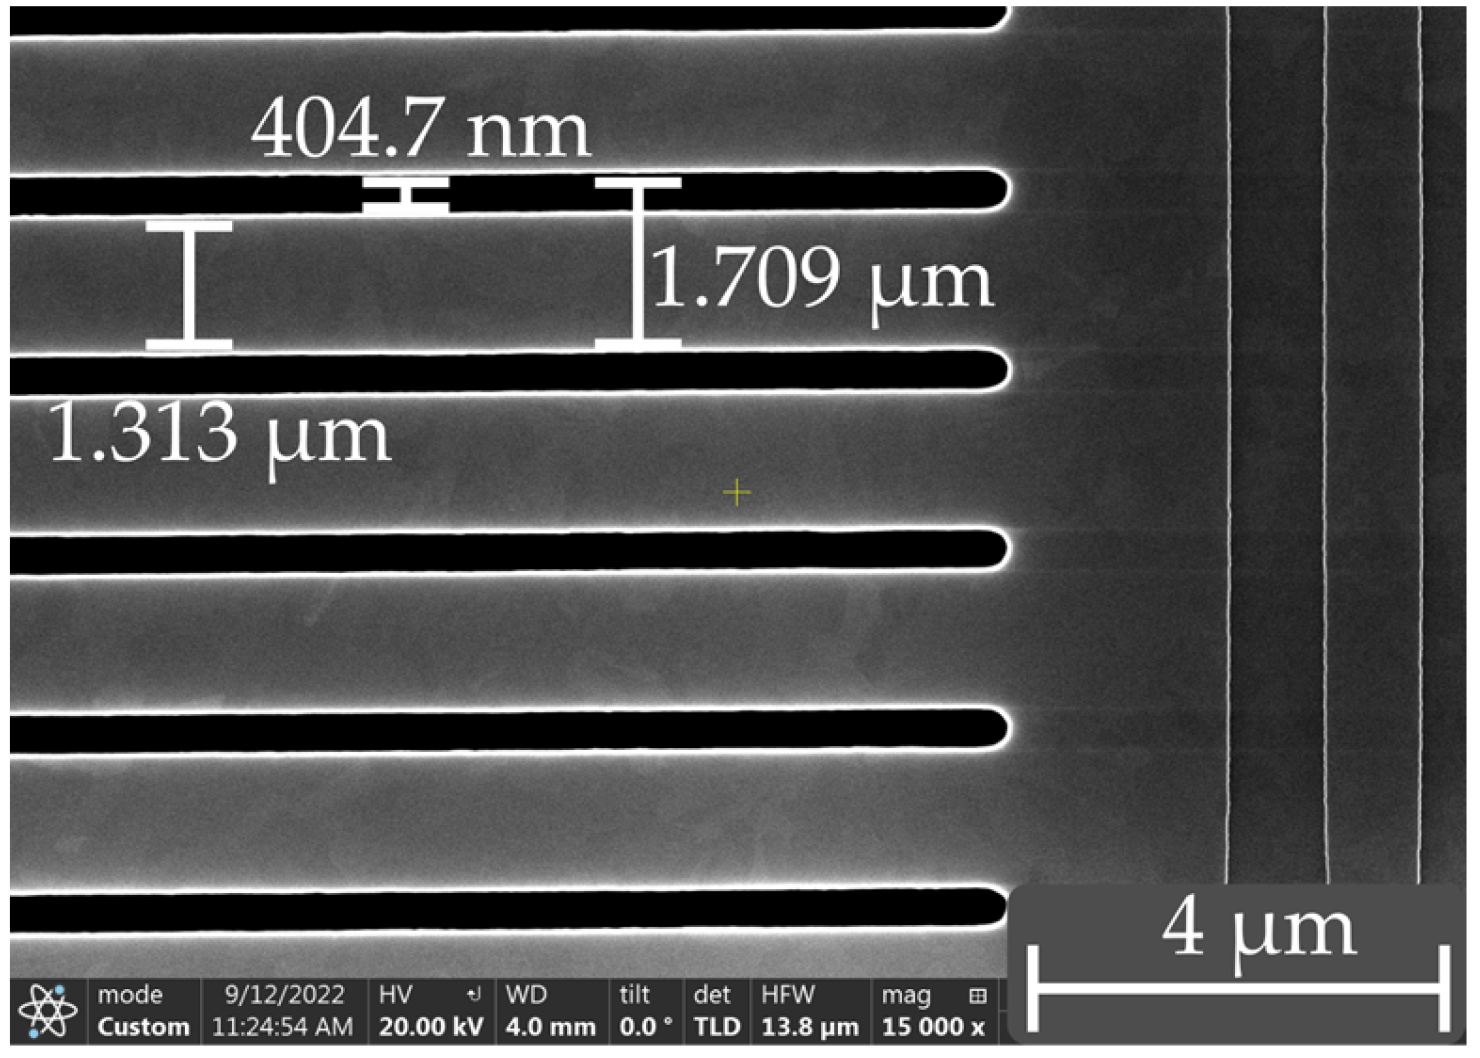
Figure 2. Top view of SEM image of fabricated waveguide structure D.
Photonics 10 00055 g002
Figure 3. Experimental setup for wafer-level measurements of the damping and confinement factor. For measurements of Γ , the enclosures built around the laser beam path in the air are purged with dry CO2-free air to eliminate possible environmental perturbations. Transmission of light is measured simultaneously in the reference gas cell and the waveguide gas cell, while flowing a controlled CO2-N2 mixture through these cells in series.
Photonics 10 00055 g003
Figure 4. Simulation results of (a) D and (b) Γ for the CSA waveguides and comparison with the experimentally determined values for the structures in Table 1. Simulations are reported as circular points connected by lines. Experimental points are squares. Associated error bars are ±s. The colors of the simulation and experimental points are consistent: blue (g = 300 nm), orange (g = 400 nm), and red (strip waveguide). The experimental values of the strip waveguide are taken from Reference [14]. The point at w = 0.8 µm, marked as a cross, is taken from Reference [24].
Photonics 10 00055 g004
Figure 5. Exemplary experimental measurements of Γ , taken from waveguide A. (a) Measured transmission through the waveguide and the reference gas cells for different CO2 concentrations. (b) Extraction of Γ according to Equation (6). (c) Estimation of the effective absorption coefficient of CO2 ( α e f f ) from Equation (5). (d) Extraction of Γ by fitting measured data by Beer–Lambert function Equation (4), using the effective absorption coefficient derived in (c).
Photonics 10 00055 g005
Figure 6. Comparison between the simulated F O M (circular points connected by continuous lines) and the experimentally retrieved F O M for the investigated structures (squares). The F O M s are obtained from the simulated and measured D and Γ presented in Figure 4. Error bars are ±σ. The colors of the simulation and experimental points are consistent: blue (g = 300 nm), orange (g = 400 nm), and red (strip waveguide). The experimental values of the strip waveguide are taken from Reference [14]. The point at w = 0.8 µm, marked as a cross, is taken from Reference [24] and describes a structure produced with identical fabrication processes but on a different wafer lot. The three black circles mark three exemplary geometries with the same pitch.
Photonics 10 00055 g006
Table 2. Values for the parameters Γ , Γ , and F O M were retrieved by the simulations for the fundamental quasi-TE mode, and their corresponding measured values. Four chips were measured for each type of waveguide.
Simulation (First TE Mode)Experiment
Waveguide Γ D (cm−1) F O M Γ D (cm−1) F O M
Strip0.090.383.970.15 ± 0.01 *0.97 ± 0.13 *6.5 ± 1.0 *
A0.390.922.360.37 ± 0.022.7 ± 0.57.3 ± 1.4
B0.230.572.500.22 ± 0.011.6 ± 0.67.3 ± 2.7
C0.180.482.670.17 ± 0.011.4 ± 0.18.2 ± 0.8
D0.160.483.000.16 ± 0.011.4 ± 0.49.0 ± 2.5
* Experimental values are taken from Reference [14].
Disclaimer/Publisher’s Note: The statements, opinions and data contained in all publications are solely those of the individual author(s) and contributor(s) and not of MDPI and/or the editor(s). MDPI and/or the editor(s) disclaim responsibility for any injury to people or property resulting from any ideas, methods, instructions or products referred to in the content.