Article

Fluorescence Anisotropy in Radachlorin and Chlorin e6 in Water–Methanol Solutions under One- and Two-Photon Excitation

by
Ioanna A. Gorbunova
,
Maxim E. Sasin
,
Anna A. Zhikhoreva
,
Andrey V. Belashov
,
Dina M. Beltukova
,
Irina V. Semenova
* and
Oleg S. Vasyutinskii
Ioffe Institute, Russian Academy of Sciences, 26, Polytekhnicheskaya, 194021 St. Petersburg, Russia
*
Author to whom correspondence should be addressed.
Photonics 2023, 10(1), 9; https://doi.org/10.3390/photonics10010009
Submission received: 24 November 2022 / Revised: 16 December 2022 / Accepted: 17 December 2022 / Published: 23 December 2022

Abstract

:
The fluorescence anisotropy of photosensitizers Radachlorin and chlorin e6 was studied using the time-resolved single photon-counting technique under one- and two-photon excitation within the Soret absorption band. A very small negative anisotropy was observed in both photosensitizers under one-photon excitation in the vicinity of the absorption maximum within the wavelength range of 395–405 nm. Meanwhile, two-photon excitation of the photosensitizers in the same spectral range demonstrated high fluorescence anisotropy with the maximum value of about 0.43. The drastic difference of the fluorescence anisotropy parameters at one- and two-photon excitation modes was suggested to be due to the different symmetries of one- and two-photon absorption tensors when two-photon absorption tensor components have comparable values. The variation of excitation wavelengths in the spectral range of 375–425 nm demonstrated nonlinear wavelength dependence of anisotropy of both Radachlorin and chlorin e6, with opposite tendencies at one- and two-photon excitation. The data obtained suggest that one-photon excitation at about 405 nm often utilized in FLIM experiments is not sensitive to fluorescence anisotropy in Radachlorin and chlorin e6 and therefore cannot be used for the determination of anisotropy/rotational diffusion time in these molecules. Meanwhile, two-photon excitation can provide high fluorescence anisotropy and accurate determination of the rotational diffusion time. At the same time, one-photon excitation at about 405 nm can be used for the accurate evaluation of fluorescence lifetimes within the standard FLIM schematic where fluorescence polarization is not taken into account.

Graphical Abstract

1. Introduction

Steady-state and time-resolved analysis of fluorescence signals of various photosensitizers has been demonstrated to be informative for both diagnostics of malignant tumors in vivo [1,2] and fundamental studies related with the efficacy and mechanisms of photodynamic treatment in vitro [3,4]. Analysis of intracellular localization of photosensitizer (PS) molecules or their photobleaching rate can be used for evaluation of an amount of produced reactive oxygen species (ROS) [5,6,7] or analysis of prevailing cell death mechanisms [3,8]. Information on the local microenvironment of PS molecules can be used to make conclusions on PS efficacy in photodynamic treatment and mechanisms of PS uptake by cells [9] or binding to specific proteins [10,11]. A powerful tool to carry out these studies is time-correlated single-photon counting (TCSPC) fluorescence spectroscopy, providing an opportunity to detect fluorescent species (PS molecules in particular) with high sensitivity and to investigate their conformation distributions [12,13,14], binding [15,16], aggregation and clusterization [17,18], as well as to probe local viscosity [10,11,19,20].
The detection of time-resolved fluorescence polarization components allows for retrieving fluorescence decay times τ i , rotational diffusion times τ r o t , and fluorescence anisotropy parameter r 0 related to the angle θ between the excitation and emission transition dipole moments [21]. Fluorescence anisotropy induced by one-photon excitation (OPE) and two-photon excitation (TPE) of exogeneous and endogeneous fluorophores in solutions and proteins was intensively studied for decades [22]. As demonstrated by Lakowicz et al. [22], some fluorophores (2,5-diphenyloxazole, diphenylhexatriene, NADH, coumarine) exhibited TPE anisotropy values related to OPE anisotropy by the simple factor of 10/7; others had similar anisotropy values at TPE and OPE (indole). At the same time, tryptophan and tyrosine showed lower anisotropy at TPE than OPE; in particular, the TPE anisotropy of tyrosine was about zero. In addition, the anisotropy of fluorophores embedded in proteins was shown to depend on the protein environment and to be sensitive to resonance energy transfer and changes in protein conformation [22]. The increased two-photon angular photoselection was successfully employed in several studies related with fluorescence anisotropy detection both in solutions [22] and in living cells [23,24,25].
Time-resolved fluorescence anisotropy imaging (TR-FAIM) is now widely used for the imaging of living cells and investigation of several important phenomena [26,27], including the binding of ligands and receptors in cells, DNA cleavage and probing of local viscosity. Evaluation of the fluorescence anisotropy parameter r 0 was used in [9] for the investigation of a release of meso-TetraHydroxyPhenyl Chlorin (mTHPC) from unilaminar lipid vesicles in model biological systems. It was shown that at increasing mTHPC concentration inside the vesicles, the anisotropy parameter dropped down from r 0 = 0.25 to r 0 = 0.02, corresponding to almost complete depolarization of the fluorescence signal.
Anisotropy of the fluorescence signal of a Norharmane PS was applied by Chakrabarty et al. [10] to investigate the binding of PS molecules to bovine serum albumin and human serum albumin. A significant increase of the fluorescence anisotropy in proteinous environments (from 0.04 to 0.2 at 70 µmol/L of human serum albumin) has been shown, indicating that albumin proteins introduced motional restriction on the drug molecules. Analysis of polarization-sensitive images of mTHPC in EMT6 cells [28] showed a strongly marked banding of alternating high and low anisotropy consistent with ordering of the sensitizer molecules in the nuclear envelope, which evidenced that this particular structure can be the major target of the PDT-induced damage.
The fluorescence anisotropy of six different PSs was also reported in [28]; however, neither Radachlorin nor chlorin e6 were included in this study. The analysis of fluorescence anisotropy can also be used for the investigation of PS aggregates, as shown in [17], where an improved PS nanoGUMBOS aimed at the development of energy-harvesting devices was characterized. The study also demonstrated variations of anisotropy parameter r 0 as a function of excitation wavelength.
The investigation of rotational diffusion time, calculated from time-resolved signals of two orthogonal polarized fluorescence components, was also used in research of properties of different PSs [11,29,30]. Lobanov et al. [29] demonstrated significant variations of rotational correlation time of hematoporphyrin PS, its dimers and aggregates in intracellular compartments, including plasma membrane, cytoplasm and nuclear membrane. Das et al. [11] reported the rotational diffusion time of hypericin in solution with human serum albumin to be as long as 31 ns, which allowed for demonstrating the rigid binding of PS molecules to proteins.
The time-resolved fluorescence of chlorin e6 was analyzed only in a few works, see e.g., [31,32,33], while its fluorescence anisotropy and rotational diffusion time was not studied in detail as yet. Meanwhile, as we mentioned above, the analysis of both fluorescence anisotropy r 0 and rotational diffusion time τ r o t can be used for evaluation of local microenvironment properties [28] and the detection of PS binding to proteins [10,11] or its release from lipid vesicles [9]. The evaluation of PS anisotropy at different excitation wavelengths (with either one- or two-photon excitation) allows for evaluating experimental parameters which are most advantageous for probing the local viscosity of intracellular content or detection of polarization-free time-resolved fluorescence signals aimed at the accurate calculation of fluorescence lifetime components (since the detection of a time-resolved fluorescence signal under ’magic angle’ conditions is not always convenient using fluorescence lifetime imaging microscopy).
In this paper, we present the thorough experimental study of polarized time-resolved fluorescence of the chlorin-based PS Radachlorin and its major constituent chlorin e6, in water and water–methanol solutions under OPE and TPE by femtosecond laser pulses with wavelength scanning within the Soret absorption band.

2. Materials and Methods

2.1. Materials

Chlorin-based PSs, first introduced in 1980s, have been actively studied since then and currently form the class of photosensitizers utilized in clinical practice worldwide. In this research, we studied fluorescence properties of the chlorin-based drug Radachlorin (RadaPharma) comprising a composition of sodium salts of chlorin e6 (∼80%), purpurin 5 (∼15%) and chlorin p6 (∼5%). Molecular structures of the constituents along with their molecular weights are shown in Figure 1. Radachlorin (or Bremachlorin) is clinically approved in several countries including Russia and South Korea and is a candidate for phase III clinical trials in EU. The photosensitizer is widely applied for the PDT of various cancers and for antimicrobial/antiviral photodynamic inactivation. It was shown to possess low dark toxicity. Basic photophysical properties of Radachlorin in solutions have been studied in detail by several research groups (see [34,35,36,37,38] and references therein). We have recently shown that in living cells, Radachlorin accumulates mostly in lysosomes [8]; however, the particular mechanism of the drug uptake by cells is still unclear.
Radachlorin concentrate for the preparation of solution for intravenous infusion was obtained from RadaPharma. The stock solution was dissolved in water to the final concentration of 30 µM for the experiments with TPE and 2 µM for those with OPE. Radachlorin concentration was reduced in the latter case in order to decrease laser beam absorption in the out-of-focus volume.
Radachlorin properties were compared with those of its major constituent chlorin e6 measured under the same experimental conditions. Crystalline solid chlorin e6 (Cayman Chemical) was first dissolved in pure ethanol at high concentration and was used as a stock solution. Then, the stock solution was either dissolved in water or added to 40%MeOH solution in water. The final concentration of chlorin e6 in solution was adjusted to have the same absorption under OPE as that of Radachlorin.

2.2. Time-Resolved Fluorescence Polarization Spectroscopy

The experimental setup used was similar to that described in detail in our previous publications [14,39,40]. The optical schematic of the setup is shown in Figure 2. A femtosecond Ti:Sa oscillator Mai Tai HP DS (Spectra Physics) tunable in the spectral range of 690–1040 nm, with a pulse duration of 100 fs, pulse repetition rate of 80.4 MHz and horizontally polarized emission, was used as an excitation light source. The polarized fluorescence of Radachlorin and chlorin e6 was recorded under excitation within the Soret absorption band peaked at about 405 nm. Excitation was performed under OPE and TPE conditions in the wavelength ranges of 375–420 nm and 750–840 nm, respectively, with a step of no more than 5 nm. In both cases, the laser beam was focused into the molecular sample by a lens. The laser beam in the OPE scheme was produced by frequency doubling of the laser fundamental output by a second harmonic generator Inspire Blue (Spectra Physics). The power density of laser pulse in the focal area of the molecular sample was kept at W p u ( 1 ) = 0.2 MW/cm2 in the case of OPE mode and W p u ( 2 ) = 795 MW/cm2 in that of TPE. The linear polarization degree of the excitation light was better than 0.995, and the polarization direction was adjusted by a half waveplate. The laser beam was focused into the center of a quartz cuvette with the drug solution, and the fluorescence signal was collected in the direction perpendicular to the laser beam. The orthogonally polarized fluorescence components I and I were separated by a Glan prism and then recorded by two ultrafast SPAD photodetectors $PD-050-CTC (MPD). The fluorescence was spectrally separated using a ET645/75 bandpass filter (Chroma). In the TPE mode, the scattered excitation laser radiation was blocked in the fluorescence channel with a shortpass filter SP700 (Chroma), and in the OPE mode, it was blocked with a longpass filter LP470 (Chroma). The fluorescence signals accumulated in the photon-counting mode were analyzed by a TCSPC system PicoHarp 300 (PicoQuant). Signals were typically collected for 3 min with a time bin of 4 ps.

2.3. Experimental Data Processing

The detected orthogonal components I ( t ) , I ( t ) of time-resolved fluorescence signals of Radachlorin and chlorin e6 were further processed and fluorescence lifetimes, anisotropy and rotational diffusion time were determined. The signal processing was performed using the expressions [14,15]:
I ( t ) = G 0 t IRF ( t ) I ( t t ) [ 1 + 2 r ( t t ) ] d t
I ( t ) = 0 t IRF ( t ) I ( t t ) [ 1 r ( t t ) ] d t ,
where I ( t ) denotes the isotropic part of fluorescence decay signal, r ( t ) is the anisotropy, I R F ( t ) is the instrumental response function, and G is the ratio of sensitivity in the two detection channels. Both G and I R F ( t ) were preliminary determined using the workflow described in detail in [15].
The anisotropy r ( t ) was calculated from I ( t ) and I ( t ) in Equations (1) and (2) according to the expression [21]:
r ( t ) = 1 G I ( t ) I ( t ) 1 G I ( t ) + 2 I ( t ) .
In the conditions of our experiments, the anisotropy r ( t ) in Equation (3) could be presented in a single-exponential form:
r ( t ) = r 0 ( n ) e t τ r o t ,
where r 0 ( n ) is the fluorescence anisotropy parameter with index n being equal to n = 1, 2 and labeling excitation in one- and two-photon mode, and τ r o t is a rotational diffusion time.

3. Results and Discussion

3.1. Fluorescence Parameters of Radachlorin under OPE and TPE Modes

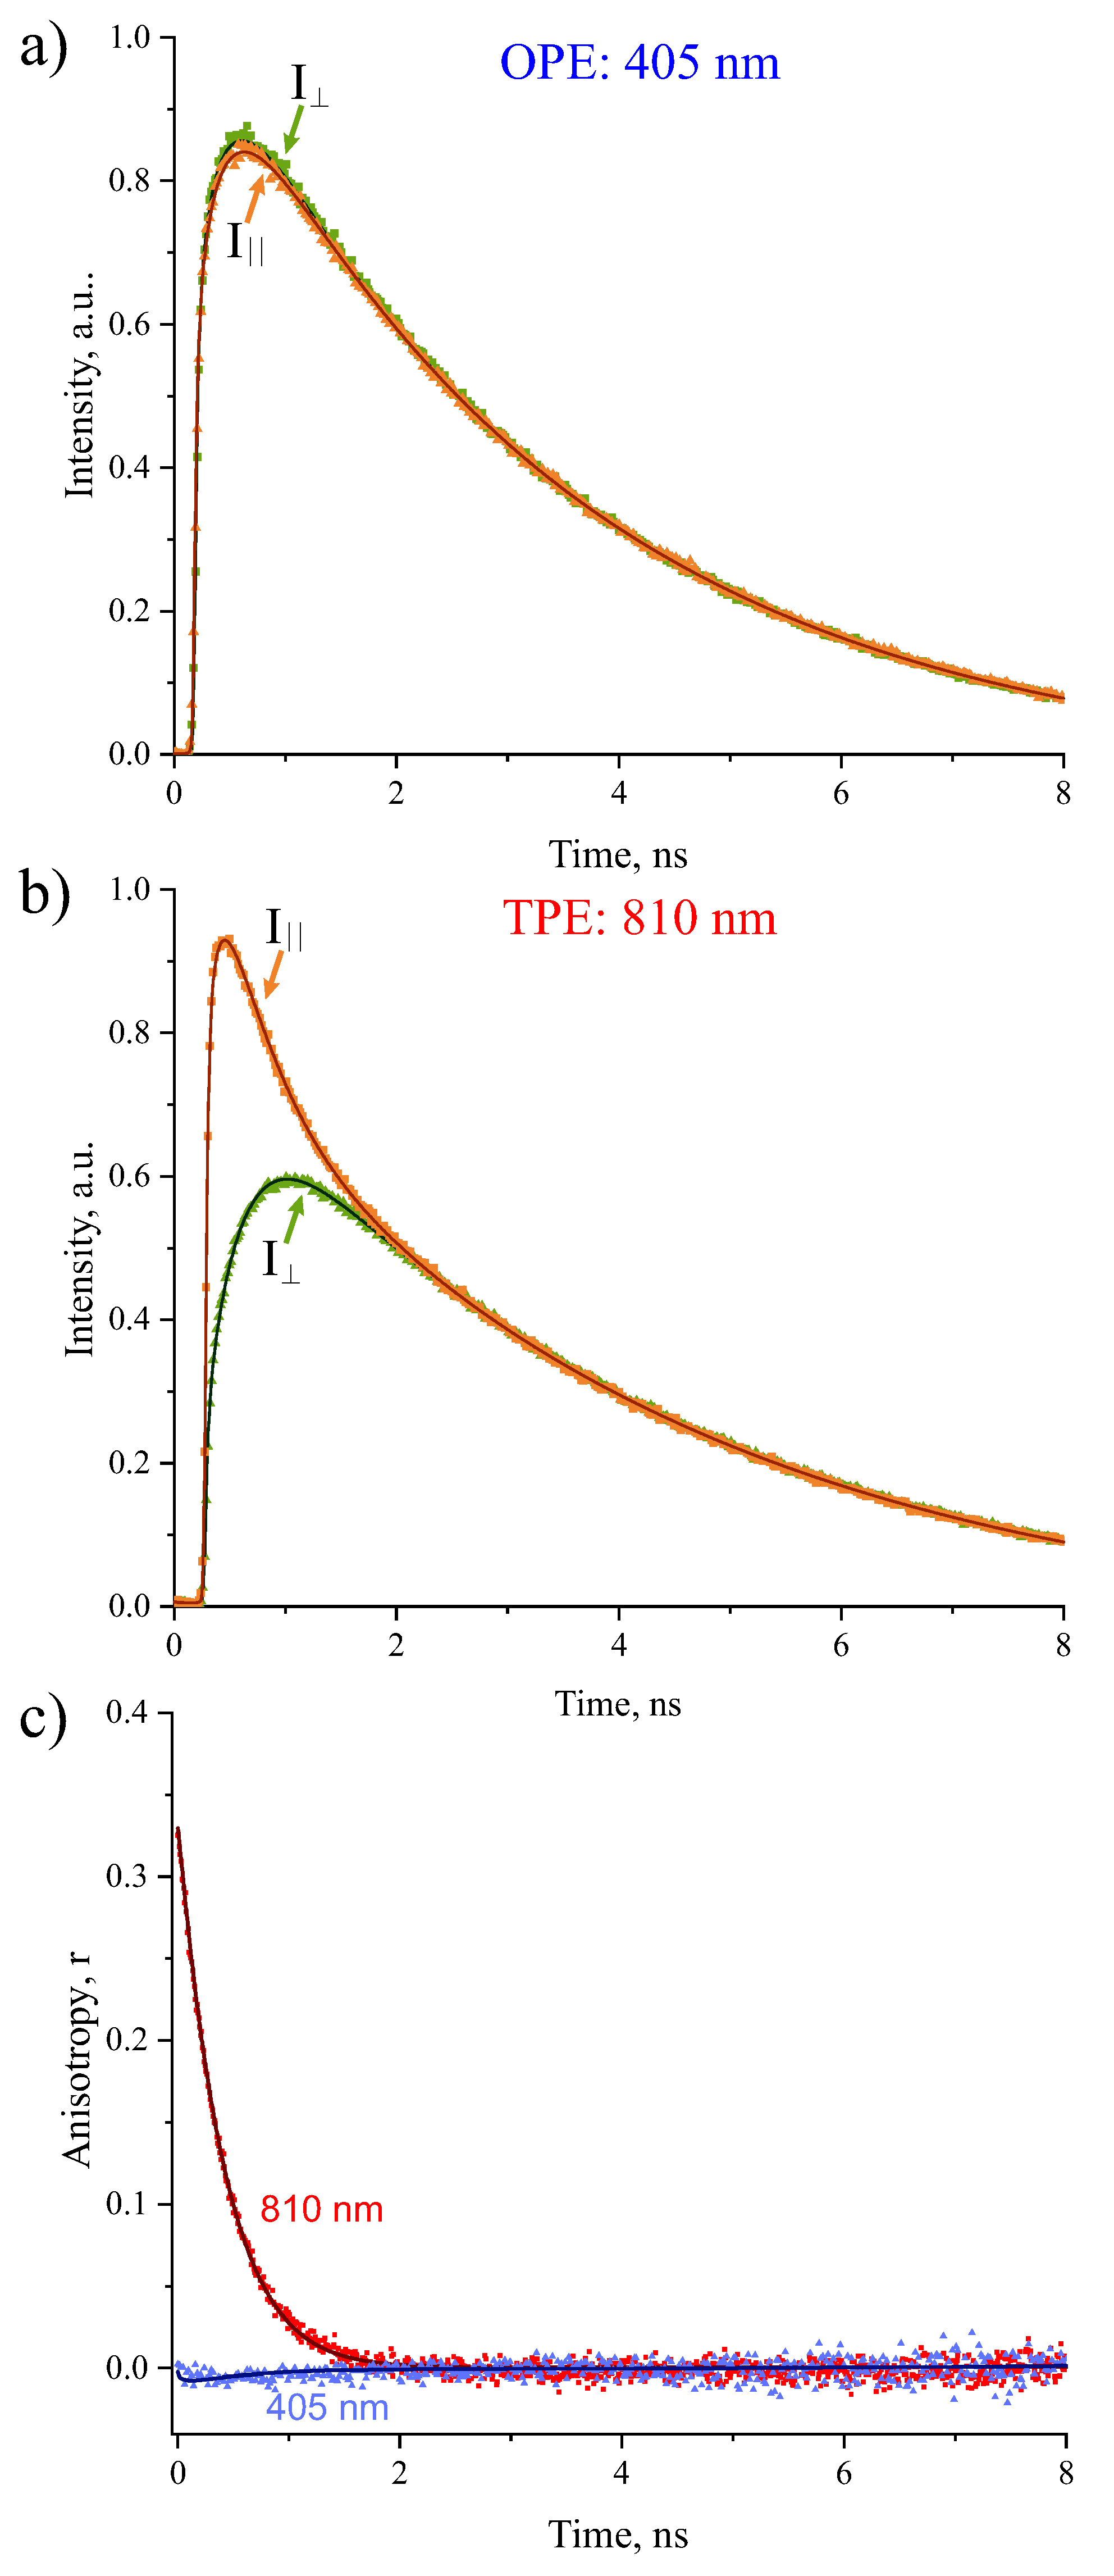
Figure 3a,b shows typical time-resolved decay signals of orthogonal fluorescence polarization components I ( t ) and I ( t ) of Radachlorin in water, obtained under OPE and TPE modes with excitation at 405 nm, in the vicinity of the maximum of Soret absorption band. The fluorescence decay signals were analyzed using Equations (1) and (2) by the global fit procedure. The corresponding time-dependent anisotropy decays r ( t ) calculated from Equation (3) are shown in Figure 3c. The fluorescence parameters obtained from fits are summarized in Table 1.
As can be seen in Table 1, at both OPE and TPE modes, the polarized fluorescence decay of Radachlorin in water could be characterized by a single fluorescence decay time τ , a single rotational diffusion time τ r o t , and an anisotropy parameter r 0 ( n ) . The results presented in Figure 3 and Table 1 manifest a drastic difference of the values of fluorescence anisotropy parameter r 0 obtained at OPE and TPE modes. In the case of TPE, the r 0 ( 2 ) value was determined to be high and positive, r 0 ( 2 ) = 0.35, while in the case of OPE, the r 0 ( 1 ) value turned out to be quite low and negative: r 0 ( 1 ) = −0.03. At the same time, the fluorescence decay time τ was found to be the same for both excitation modes within the experimental error bars. The rotational diffusion time τ r o t determined under TPE was slightly shorter than that under OPE.
Note that Radachlorin fluorescence in pure water in the conditions of our experiments demonstrated a high photobleaching rate that decreased in water–methanol solutions. This behavior could likely be explained by a difference of dielectric constants of the solvents: the dielectric constant of 40% methanol solution in water is 1.5 times smaller than that of pure water. As reported by Spikes and Bommer [41], the photobleaching rate of porphyrins increases with the dielectric constant of the solvent. Therefore, further studies of Radachlorin and chlorin e6 fluorescence were performed in 40% MeOH mixture with water. The fluorescence parameters of Radachlorin in 40% MeOH solution determined under OPE and TPE are given in Table 1. These data demonstrate that the major fluorescence parameters of Radachlorin in water and 40% MeOH are close at both excitation modes, except for τ r o t values. Therefore, we believe that the analysis of the fluorescence anisotropy of Radachlorin and chlorin e6 in water–MeOH solution described in Section 3.2 and Section 3.3 is representative for pure water as well. The utilization of water–alcohol solution for these measurements allowed obtaining more robust results by reducing the photobleaching rates of the drugs.
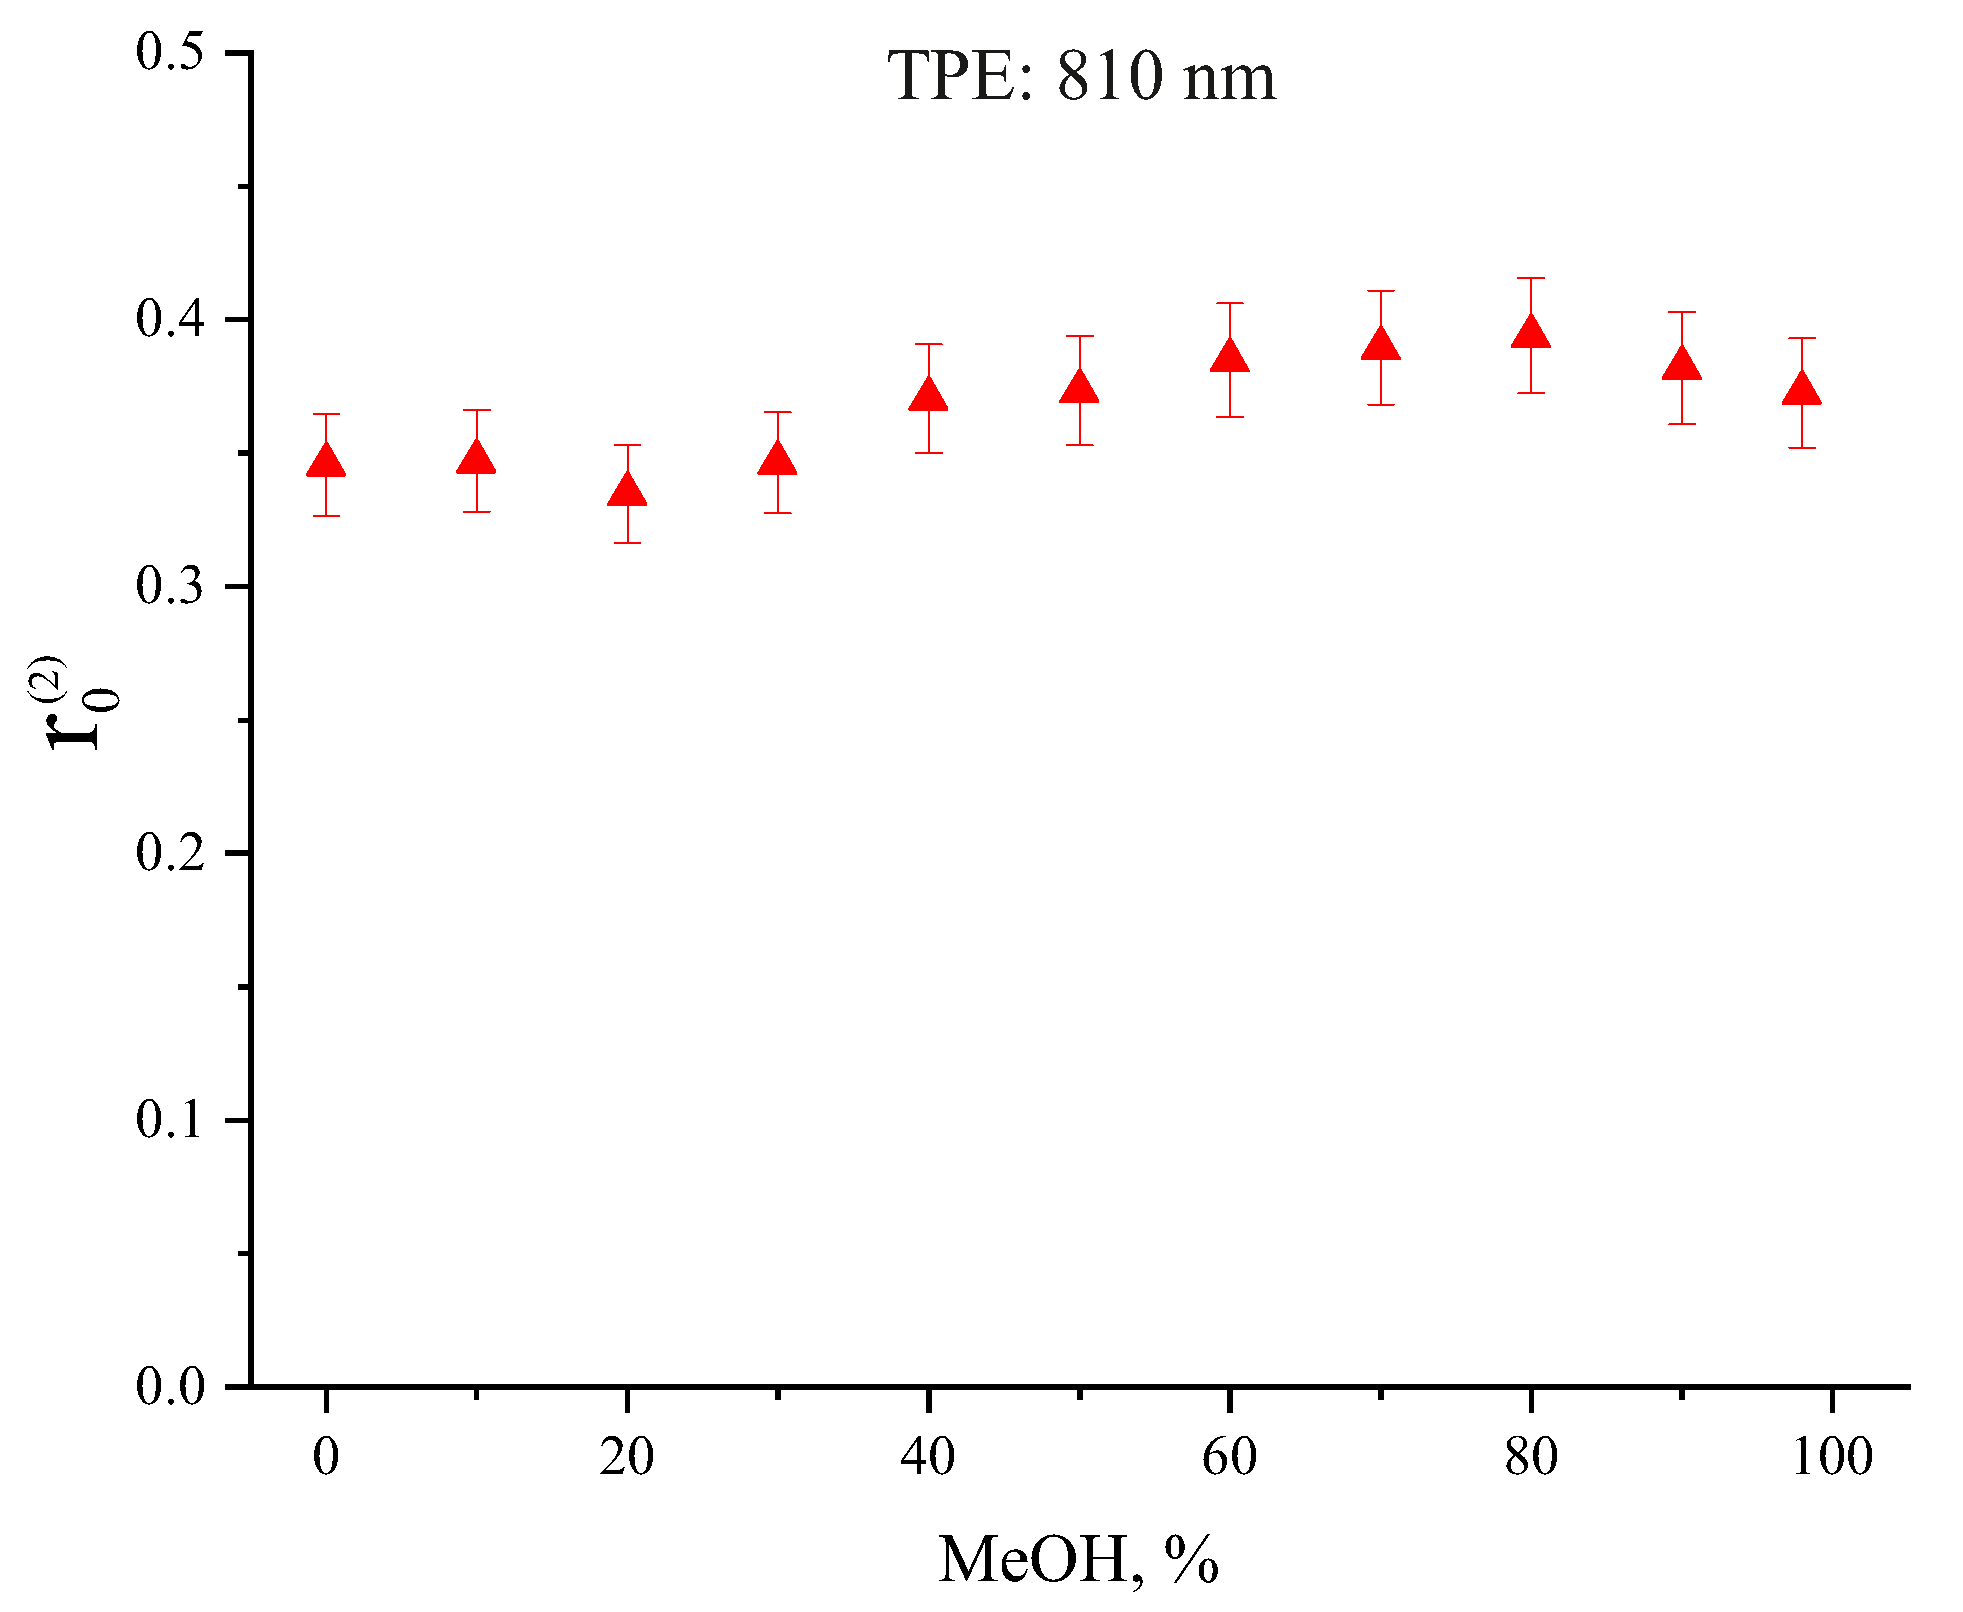
The dependence of initial Radachlorin fluorescence anisotropy r 0 ( 2 ) on MeOH concentration obtained at two-photon excitation is presented in Figure 4. As can be seen in Figure 4, r 0 ( 2 ) rose monotonically with alcohol concentration from 0.35 ± 0.02 in pure water up to the maximum of 0.39 ± 0.02 at 80% MeOH, and then, it slightly decreased down to 0.35 ± 0.02 in pure MeOH. The observed small variations of r 0 ( 2 ) with MeOH concentration can be due to changes in the energy level structure of Radachlorin molecules caused by changes of solution polarity and viscosity.

3.2. Spectral Dependence of Radachlorin Fluorescence Anisotropy

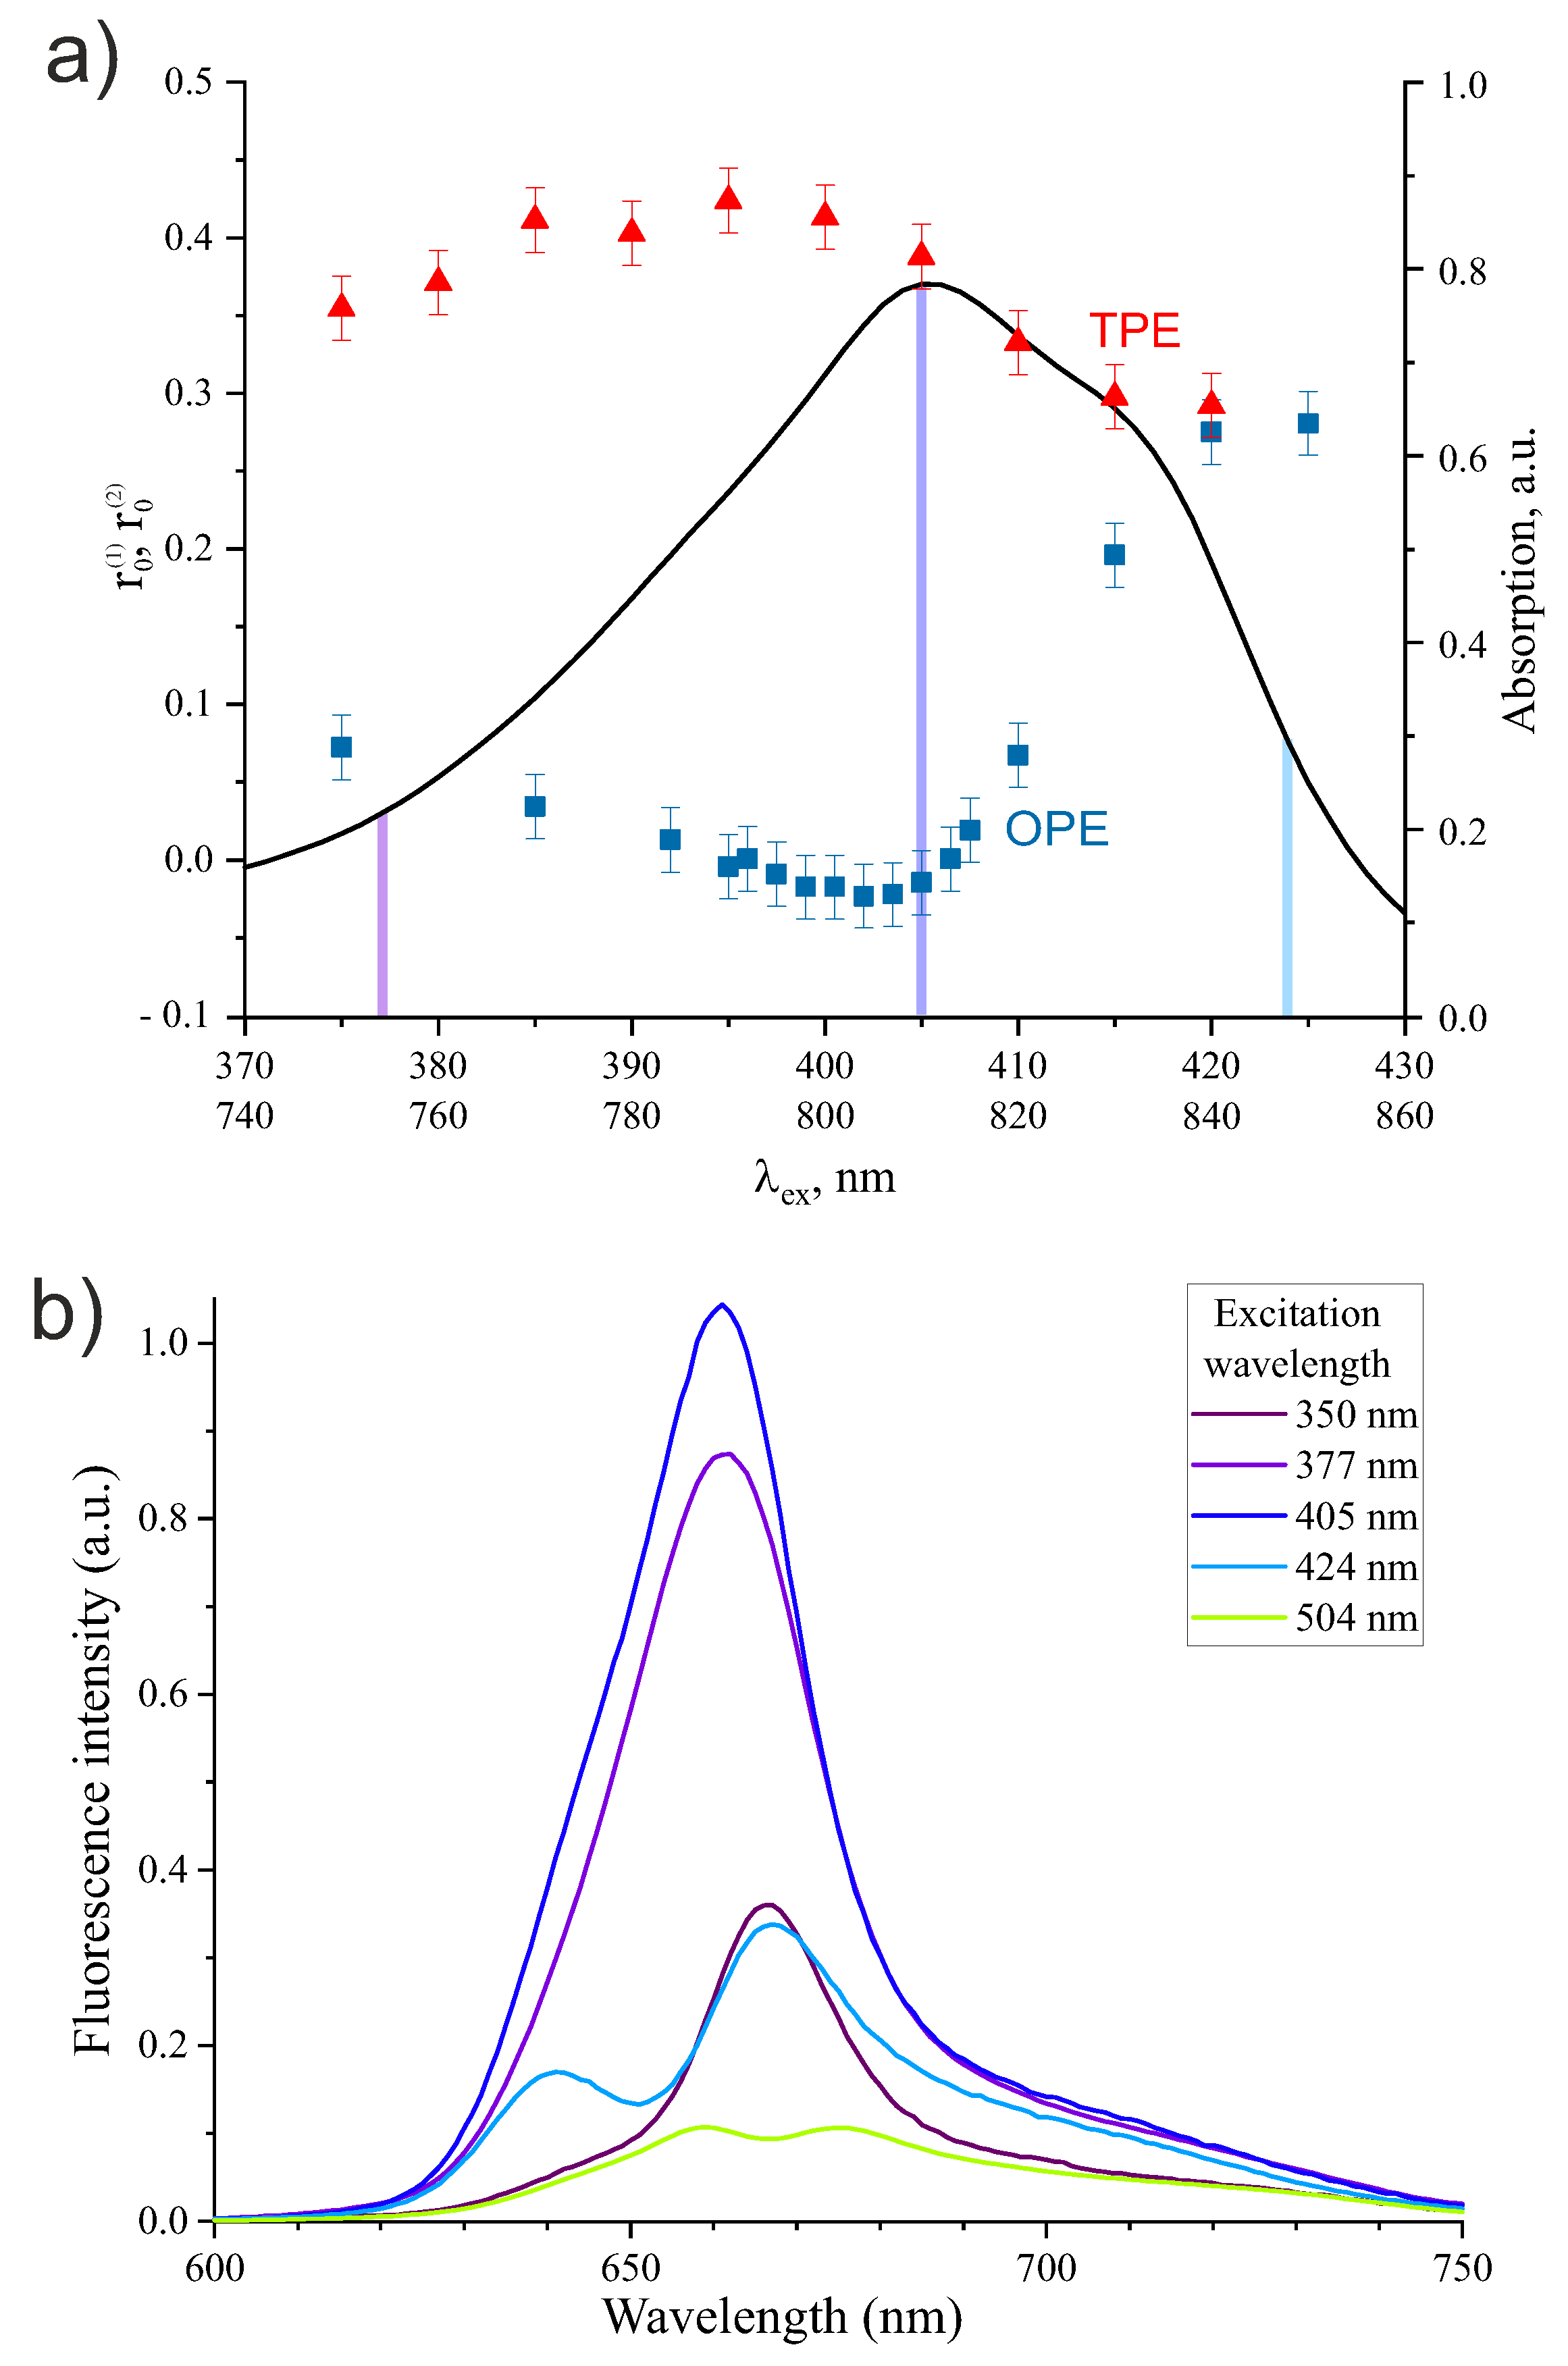
The Radachlorin anisotropy was analyzed as a function of the excitation wavelength within the Soret absorption band under one- and two-photon excitation mode. The data obtained are plotted in Figure 5a along with Radachlorin absorption spectrum in the spectral range of 370–430 nm. As can be seen in Figure 5, the anisotropy parameter r 0 obtained at OPE and TPE modes changed dramatically within the absorption spectral range of 370–430 nm and behaved almost in the opposite phase. In the case of OPE, the anisotropy parameter r 0 ( 1 ) had a small negative, almost zero value in the vicinity of the Soret absorption band maximum at 405 nm and increased significantly in the red and blue wings of the absorption band. In the case of TPE, the parameter r 0 ( 2 ) had a maximum of ≃0.43 at about 395 nm and then decreased smoothly in both absorption band wings. At the red edge of the absorption spectrum, at about 420 nm, the anisotropy parameter became the same for OPE and TPE.
The drastic difference in the fluorescence anisotropy parameters obtained under OPE and TPE shown in Figure 5a and Table 1 can be clarified by considering the expressions describing angular dependencies of the anisotropy parameters. In the case of OPE of a symmetric top molecule, or a planar molecule with in-plane polarized transitions, the anisotropy parameter r 0 ( 1 ) can be presented in the form [21]:
r 0 ( 1 ) = 2 5 P 2 ( cos θ )
where θ is an angle between the transition dipole moments d a b and d f l of the absorption and fluorescence transitions, respectively, and P 2 ( cos θ ) is a second-order Legendre polynomial.
According to Equation (5), the parameter r 0 ( 1 ) takes the values from r 0 ( 1 ) = 2 / 5 to r 0 ( 1 ) = 1 / 5 when the angle θ ranges from θ = 0 to θ = π / 2 and passes zero value at the “magic” angle of θ 57 . Note that a very low anisotropy parameter r 0 ( 1 ) was reported earlier for lanthanides [42] and naphthalene [43]. As shown in Table 1 under OPE of Radachlorin and chlorin e6 at 405 nm, the parameter r 0 ( 1 ) was determined to be close to zero, indicating that in this case, the angle θ was about θ 57 .
If both excitation light photons are the same, the fluorescence anisotropy parameter r 0 ( 2 ) related to TPE can in general be presented in the form [15,44]:
r 0 ( 2 ) = 2 7 3 D T d f l 2 1 ,
where
D = 2 d f l · S 2 · d f l + ( d f l · S · d f l ) T r S ,
and
T = T r 2 S + 2 T r S 2 ,
where S is a two-photon absorption tensor with components S X X , S Y Y , S Z Z with respect to the principal molecular axes.
In general, the direction of the fluorescence transition dipole moment d f l in Equation (7) is described by the polar angles θ F S and ϕ F S with respect to the long principal axis of the two-photon tensor S . The corresponding fluorescence anisotropy parameter r 0 ( 2 ) has the extreme values of (1 ± 3 6 / 5 )/7 [44].
If one of the components of the two-photon absorption tensor S is much larger than the others, S Z Z S X X , S Y Y , the fluorescence anisotropy parameter r 0 ( 2 ) in Equation (6) can be simplified to the form [15,21,22,44]:
r 0 ( 2 ) = 4 7 P 2 ( cos θ F S ) ,
where θ F S θ .
The parameter r 0 ( 2 ) in Equation (9) can range from r 0 ( 2 ) = 4 / 7 to r 0 ( 2 ) = 2 / 7 passing through zero at θ F S 57 .
The significant difference of the fluorescence anisotropy parameters r 0 ( 1 ) and r 0 ( 2 ) observed in our experiments and shown in Figure 5a and Table 1 suggests that under two-photon excitation of Radachlorin and chlorin e6, the approximation S Z Z S X X , S Y Y was not valid. In this case, the principle frame of the two-photon absorption tensor may have no direct relation to the transition dipole for one-photon absorption to the final state, and the angles θ F S and θ are different [44]. The general non-axially symmetric expression in Equation (6) should be used for estimation of the r 0 ( 2 ) value rather than its approximate form in Equation (9). The components of the two-photon absorption tensor S in Radachlorin and chlorin e6 are not known yet, although it is clear that in general, a non-axially symmetric form of Equation (6) can result in different values of TPE anisotropy, r 0 ( 2 ) as compared to those of OPE, r 0 ( 1 ) , as shown in Figure 5a.
As known, the anisotropy often varies across the excitation spectral band [39,44,45]. Lakowicz associated this behavior with the population of several excited states [21]. Meanwhile, in many fluorophores, fluorescence polarization remains practically the same across the emission spectra because radiative transitions to the ground state occur from the lowest excited state [21,46].
Therefore, the variation of Radachlorin anisotropy with excitation wavelength shown in Figure 5a can be due to absorption to different excited states or to different constituents of the drug. This statement is supported by Radachlorin fluorescence spectra in the spectral range of 600–750 nm given in Figure 5b, which demonstrates the significant dependence of the fluorescence band shape on excitation wavelength, especially under excitation within the red wing of the Soret absorption band.
The rotational diffusion time τ r o t in Table 1 was found to be almost constant within the absorption spectral range shown in Figure 5a. As can be seen in Table 1, the time τ r o t was found to be somewhat shorter in pure water than in water–methanol mixture because of the lower viscosity of pure water. In addition, the time τ r o t was somewhat longer under OPE than under TPE and was determined to be 0.44 ns vs. 0.34 ns, respectively. We believe that the observed difference in rotational diffusion times could be due to the difference in local solution temperatures in the focal area at one- and two-photon absorption modes. As already mentioned in Section 2.1 and Section 2.2, the molecular concentration used at TPE mode was about 15 times higher than that at OPE mode. In addition, the power density of laser radiation used for TPE was about 4000 times higher than that used for OPE. Therefore, although the ratio of the absorption cross-sections in TPE and OPE modes was as small as about 10−4, we anticipate that the local solution temperature was higher in the TPE case that could result in a somewhat shorter rotational diffusion time.

3.3. Comparative Analysis of Fluorescence Anisotropy of Radachlorin and Chlorin e6

Since the major component of Radachlorin photonsenizier is chlorin e6, amounting for more than 80% of its active composition, the comparative analysis of photophysical properties of Radachlorin and chlorin e6 is of particular interest. Therefore, the same set of experiments was performed for chlorin e6 in water–methanol solution. The major fluorescence parameters of chlorin e6 in 40% MeOH solution in water are summarized in Table 1. The anisotropy spectra of Radachlorin and chlorin e6 obtained under OPE and TPE are shown in Figure 6. As can be seen in Figure 6, the anisotropy spectra of chlorin e6 coincided with those of Radachlorin within the experimental error bars. The rotational diffusion time τ r o t and fluorescence decay time τ of chlorin e6 were also practically equal to those obtained for Radachlorin both at OPE and TPE modes within the experimental error bars.

4. Conclusions

The observed significant difference in fluorescence anisotropy of Radachlorin at different excitation conditions can be used in a number of ways. In many cases, the analysis of fluorescence lifetime(s) of the fluorophore can be sufficient to obtain required data about the microenvironment. In this case, the contribution of fluorescence anisotropy to the detected time-resolved signal can be undesirable. Therefore, the recording of Radachlorin fluorescence decay under one-photon excitation using commonly used semiconductor laser sources emitting at 405 nm is beneficial for such applications. On the other hand, the recording of Radachlorin fluorescence at two-photon excitation mode can be used in experiments aimed primarily at the evaluation of rotational diffusion time. Finally, the excitation of Radachlorin at ≈405 nm resulting in low fluorescence anisotropy can be used for G-factor evaluation, which is especially convenient in fluorescence lifetime imaging microscopy, where the same optical path is used for both excitation of the sample and collection of the emission signal.

Author Contributions

Conceptualization: I.A.G., M.E.S., A.A.Z., A.V.B., D.M.B., I.V.S. and O.S.V.; Methodology: I.A.G., M.E.S., A.A.Z., A.V.B., D.M.B., I.V.S. and O.S.V.; Validation: I.A.G., M.E.S., A.A.Z., A.V.B. and D.M.B.; investigation: I.A.G., M.E.S., A.A.Z., A.V.B. and D.M.B.; Data curation: I.A.G.; Writing: I.A.G., A.V.B., I.V.S. and O.S.V. All authors have read and agreed to the published version of the manuscript.

Funding

The financial support from Russian Science Foundation under the grant # 21-72-10044 is gratefully acknowledged.

Data Availability Statement

Data are available within the paper.

Acknowledgments

The authors are grateful to RadaPharma for providing Radachlorin for experiments and to the Ioffe Institute for experimental equipment.

Conflicts of Interest

The authors declare no conflict of interest.

References

  1. Sarbadhikary, P.; George, B.P.; Abrahamse, H. Recent advances in photosensitizers as multifunctional theranostic agents for imaging-guided photodynamic therapy of cancer. Theranostics 2021, 11, 9054. [Google Scholar] [CrossRef] [PubMed]
  2. He, J.; Yang, L.; Yi, W.; Fan, W.; Wen, Y.; Miao, X.; Xiong, L. Combination of fluorescence-guided surgery with photodynamic therapy for the treatment of cancer. Mol. Imaging 2017, 16, 1536012117722911. [Google Scholar] [CrossRef] [PubMed] [Green Version]
  3. Oliveira, C.S.; Turchiello, R.; Kowaltowski, A.J.; Indig, G.L.; Baptista, M.S. Major determinants of photoinduced cell death: Subcellular localization versus photosensitization efficiency. Free Radic. Biol. Med. 2011, 51, 824–833. [Google Scholar] [CrossRef] [PubMed]
  4. Kessel, D.; Oleinick, N.L. Cell death pathways associated with photodynamic therapy: An update. Photochem. Photobiol. 2018, 94, 213–218. [Google Scholar] [CrossRef] [PubMed] [Green Version]
  5. James, N.S.; Cheruku, R.R.; Missert, J.R.; Sunar, U.; Pandey, R.K. Measurement of cyanine dye photobleaching in photosensitizer cyanine dye conjugates could help in optimizing light dosimetry for improved photodynamic therapy of cancer. Molecules 2018, 23, 1842. [Google Scholar] [CrossRef] [Green Version]
  6. Sheng, C.; Jack Hoopes, P.; Hasan, T.; Pogue, B.W. Photobleaching-based dosimetry predicts deposited dose in ALA-PpIX PDT of rodent esophagus. Photochem. Photobiol. 2007, 83, 738–748. [Google Scholar] [CrossRef]
  7. Georgakoudi, I.; Nichols, M.G.; Foster, T.H. The mechanism of Photofrin photobleaching and its consequences for photodynamic dosimetry. Photochem. Photobiol. 1997, 65, 135–144. [Google Scholar] [CrossRef]
  8. Zhikhoreva, A.; Belashov, A.; Belyaeva, T.; Salova, A.; Litvinov, I.; Kornilova, E.; Semenova, I.; Vasyutinskii, O. Comparative analysis of Radachlorin accumulation, localization, and photobleaching in three cell lines by means of holographic and fluorescence microscopy. Photodiagn. Photodyn. Ther. 2022, 39, 102973. [Google Scholar] [CrossRef]
  9. Reshetov, V.; Zorina, T.; D’Hallewin, M.A.; Bolotina, L.; Zorin, V. Fluorescence methods for detecting the kinetics of photosensitizer release from nanosized carriers. J. Appl. Spectrosc. 2011, 78, 103–109. [Google Scholar] [CrossRef]
  10. Chakrabarty, A.; Mallick, A.; Haldar, B.; Das, P.; Chattopadhyay, N. Binding interaction of a biological photosensitizer with serum albumins: A biophysical study. Biomacromolecules 2007, 8, 920–927. [Google Scholar] [CrossRef]
  11. Das, K.; Smirnov, A.V.; Wen, J.; Miskovsky, P.; Petrich, J.W. Photophysics of hypericin and hypocrellin A in complex with subcellular components: Interactions with human serum albumin. Photochem. Photobiol. 1999, 69, 633–645. [Google Scholar] [CrossRef] [PubMed]
  12. Calleja, V.; Ameer-Beg, S.M.; Vojnovic, B.; Woscholski, R.; Downward, J.; Larijani, B. Monitoring conformational changes of proteins in cells by fluorescence lifetime imaging microscopy. Biochem. J. 2003, 372, 33–40. [Google Scholar] [CrossRef] [PubMed]
  13. Denicke, S.; Gericke, K.H.; Smolin, A.G.; Shternin, P.S.; Vasyutinskii, O.S. Dynamics of two-color two-photon excited fluorescence of p-terphenyl: Determination and analysis of the molecular parameters. J. Phys. Chem. A 2010, 114, 9681–9692. [Google Scholar] [CrossRef] [PubMed]
  14. Gorbunova, I.A.; Sasin, M.E.; Rubayo-Soneira, J.; Smolin, A.G.; Vasyutinskii, O.S. Two-Photon Excited Fluorescence Dynamics in NADH in Water–Methanol Solutions: The Role of Conformation States. J. Phys. Chem. B 2020, 124, 10682–10697. [Google Scholar] [CrossRef] [PubMed]
  15. Gorbunova, I.A.; Sasin, M.E.; Golyshev, D.P.; Semenov, A.A.; Smolin, A.G.; Beltukov, Y.M.; Vasyutinskii, O.S. Two-photon excited fluorescence dynamics in enzyme-bound NADH: The heterogeneity of fluorescence decay times and anisotropic relaxation. J. Phys. Chem. B 2021, 125, 9692–9707. [Google Scholar] [CrossRef]
  16. Beltukova, D.M.; Belik, V.P.; Semak, B.V.; Semenova, I.V.; Smolin, A.G.; Vasyutinskii, O.S. Relaxation dynamics of alkyl derivatives of fluorescein MitoFluo and C8-Fl in solutions with liposomes. Spectrochim. Acta Part A Mol. Biomol. Spectrosc. 2021, 263, 120145. [Google Scholar] [CrossRef]
  17. Jordan, A.N.; Das, S.; Siraj, N.; De Rooy, S.L.; Li, M.; El-Zahab, B.; Chandler, L.; Baker, G.A.; Warner, I.M. Anion-controlled morphologies and spectral features of cyanine-based nanoGUMBOS–an improved photosensitizer. Nanoscale 2012, 4, 5031–5038. [Google Scholar] [CrossRef]
  18. Varma, R.; Mayor, S. GPI-anchored proteins are organized in submicron domains at the cell surface. Nature 1998, 394, 798–801. [Google Scholar] [CrossRef]
  19. Zheng, W.; Li, D.; Qu, J.Y. Monitoring changes of cellular metabolism and microviscosity in vitro based on time-resolved endogenous fluorescence and its anisotropy decay dynamics. J. Biomed. Opt. 2010, 15, 037013. [Google Scholar] [CrossRef]
  20. Gorbunova, I.A.; Sasin, M.E.; Beltukov, Y.M.; Semenov, A.A.; Vasyutinskii, O.S. Anisotropic relaxation in NADH excited states studied by polarization-modulation pump–probe transient spectroscopy. Phys. Chem. Chem. Phys. 2020, 22, 18155–18168. [Google Scholar] [CrossRef]
  21. Lakowicz, J.R. Principles of Fluorescence Spectroscopy; Springer: Berlin/Heidelberg, Germany, 2006. [Google Scholar]
  22. Kierdaszuk, B.; Gryczynski, I.; Lakowicz, J.R. Two-photon induced fluorescence of proteins. In Topics in Fluorescence Spectroscopy; Springer: Berlin/Heidelberg, Germany, 2002; pp. 187–209. [Google Scholar]
  23. Brasselet, S.; Ferrand, P.; Kress, A.; Wang, X.; Ranchon, H.; Gasecka, A. Imaging molecular order in cell membranes by polarization-resolved fluorescence microscopy. In Fluorescent Methods to Study Biological Membranes; Springer Series on Fluorescence; Springer: Berlin/Heidelberg, Germany, 2012; pp. 311–337. [Google Scholar]
  24. Vishwasrao, H.D.; Trifilieff, P.; Kandel, E.R. In vivo imaging of the actin polymerization state with two-photon fluorescence anisotropy. Biophys. J. 2012, 102, 1204–1214. [Google Scholar] [CrossRef] [PubMed] [Green Version]
  25. Vinegoni, C.; Dubach, J.M.; Feruglio, P.F.; Weissleder, R. Two-photon fluorescence anisotropy microscopy for imaging and direct measurement of intracellular drug target engagement. IEEE J. Sel. Top. Quantum Electron. 2015, 22, 179–185. [Google Scholar] [CrossRef] [PubMed] [Green Version]
  26. Suhling, K.; French, P.M.; Phillips, D. Time-resolved fluorescence microscopy. Photochem. Photobiol. Sci. 2005, 4, 13–22. [Google Scholar] [CrossRef] [PubMed]
  27. Cao, Z.; Huang, C.C.; Tan, W. Nuclease resistance of telomere-like oligonucleotides monitored in live cells by fluorescence anisotropy imaging. Anal. Chem. 2006, 78, 1478–1484. [Google Scholar] [CrossRef]
  28. Foster, T.H.; Pearson, B.D.; Mitra, S.; Bigelow, C.E. Fluorescence anisotropy imaging reveals localization of meso-tetrahydroxyphenyl chlorin in the nuclear envelope. Photochem. Photobiol. 2005, 81, 1544–1547. [Google Scholar] [CrossRef]
  29. Lobanov, O.I.; Arjantsev, S.Y.; Koroteev, N.I. Time-resolved fluorescence polarization microspectroscopy of photosensitizers in a single living cell. Proc. SPIE 1994, 2083, 117–123. [Google Scholar]
  30. Beaton, S.; McPherson, R.; Tilley, L. Alterations in erythrocyte band 3 organization induced by the photosensitizer, hematoporphyrin derivative. Photochem. Photobiol. 1995, 62, 353–355. [Google Scholar] [CrossRef]
  31. Roeder, B.; Wabnitz, H. Time-resolved fluorescence spectroscopy of hematoporphyrin, mesoporphyrin, pheophorbide a and chlorin e6 in ethanol and aqueous solution. J. Photochem. Photobiol. Biol. 1987, 1, 103–113. [Google Scholar] [CrossRef]
  32. Kelbauskas, L.; Dietel, W. Internalization of Aggregated Photosensitizers by Tumor Cells: Subcellular Time-resolved Fluorescence Spectroscopy on Derivatives of Pyropheophorbide-a Ethers and Chlorin e6 under Femtosecond One-and Two-photon Excitation. Photochem. Photobiol. 2002, 76, 686–694. [Google Scholar] [CrossRef]
  33. Parkhats, M.V.; Knyukshto, V.N.; Isakau, H.A.; Petrov, P.T.; Dzhagarov, B.M. Photophysical properties of photosensitizer chlorin e6 incorporated into polyvinylpyrrolidone. Proc. SPIE 2007, 6727, 343–348. [Google Scholar]
  34. Ferreira, J.; Menezes, P.F.C.; Kurachi, C.; Sibata, C.; Allison, R.R.; Bagnato, V.S. Photostability of different chlorin photosensitizers. Laser Phys. Lett. 2008, 5, 156–161. [Google Scholar] [CrossRef]
  35. Douillard, S.; Lhommeau, I.; Olivier, D.; Patrice, T. In vitro evaluation of Radachlorin sensitizer for photodynamic therapy. J. Photochem. Photobiol. Biol. 2010, 98, 128–137. [Google Scholar] [CrossRef] [PubMed]
  36. Belik, V.P.; Gadzhiev, I.M.; Petrenko, M.V.; Petrov, M.A.; Semenova, I.V.; Vasyutinskii, O.S. Visible to near IR luminescence spectrum of Radachlorin under excitation at 405 nm. Chem. Phys. Lett. 2016, 665, 127–130. [Google Scholar] [CrossRef]
  37. Beltukova, D.M.; Semenova, I.V.; Smolin, A.G.; Vasyutinskii, O. Kinetics of photobleaching of Radachlorin photosensitizer in aqueous solutions. Chem. Phys. Lett. 2016, 662, 127–131. [Google Scholar] [CrossRef]
  38. Zhikhoreva, A.; Belashov, A.; Ignatov, E.; Gelfond, M.; Semenova, I.; Vasyutinskii, O. Singlet oxygen generation in aerosol jet and on biological surfaces. J. Photochem. Photobiol. B Biol. 2022, 228, 112395. [Google Scholar] [CrossRef]
  39. Sasin, M.E.; Smolin, A.G.; Gericke, K.H.; Tokunaga, E.; Vasyutinskii, O.S. Fluorescence anisotropy in indole under two-photon excitation in the spectral range 385–510 nm. Phys. Chem. Chem. Phys. 2018, 20, 19922–19931. [Google Scholar] [CrossRef]
  40. Gorbunova, I.A.; Danilova, M.K.; Sasin, M.E.; Belik, V.P.; Golyshev, D.P.; Vasyutinskii, O.S. Determination of fluorescence quantum yields and decay times in NADH and FAD in water-alcohol mixtures: The analysis of radiative and nonradiative relaxation pathways. J. Photochem. Photobiol. A Chem. 2023, 436, 114388. [Google Scholar] [CrossRef]
  41. Spikes, J.D.; Bommer, J.C. Photobleaching of mono-L-aspartyl chlorin e6 (NPe6): A candidate sensitizer for the photodynamic therapy of tumors. Photochem. Photobiol. 1993, 58, 346–350. [Google Scholar] [CrossRef]
  42. Reifenberger, J.G.; Snyder, G.E.; Baym, G.; Selvin, P.R. Emission Polarization of Europium and Terbium Chelates. J. Phys. Chem. B 2003, 107, 12862–12873. [Google Scholar] [CrossRef]
  43. Valeur, B. Molecular Fluorescence: Principles and Applications; Wiley-VCH: Hoboken, NJ, USA, 2022. [Google Scholar]
  44. Callis, P.R. On the theory of two-photon induced fluorescence anisotropy with application to indoles. J. Chem. Phys. 1993, 99, 27–37. [Google Scholar] [CrossRef]
  45. Herbrich, S.; Al-Hadhuri, T.; Gericke, K.H.; Shternin, P.S.; Smolin, A.G.; Vasyutinskii, O.S. Two-color two-photon excited fluorescence of indole: Determination of wavelength-dependent molecular parameters. J. Chem. Phys. 2015, 142, 024310. [Google Scholar] [CrossRef] [PubMed] [Green Version]
  46. Jameson, D.M.; Croney, J.C. Fluorescence polarization: Past, present and future. Comb. Chem. High Throughput Screen. 2003, 6, 167–176. [Google Scholar] [CrossRef] [PubMed]
Figure 1. Molecular structure of chlorin e6, chlorin p6 and purpurin 5. Molecular weights are indicated below each molecule.
Photonics 10 00009 g001
Figure 2. Optical schematic of the experimental setup.
Photonics 10 00009 g002
Figure 3. Decay signals of orthogonally polarized components, I and I , of Radachlorin fluorescence in water under: (a) OPE at 405 nm and (b) TPE at 810 nm. (c) Anisotropic decay signals calculated from I and I using Equation (3).
Photonics 10 00009 g003
Figure 4. Initial fluorescence anisotropy r 0 ( 2 ) in Radachlorin in aqueous solutions of MeOH as a function of alcohol concentration obtained under TPE at 810 nm.
Photonics 10 00009 g004
Figure 5. (a) Initial fluorescence anisotropies r 0 ( 1 ) and r 0 ( 2 ) of Radachlorin in 40% MeOH as a function of excitation wavelength under OPE and TPE modes. Blue squares refer to OPE and red triangles refer to TPE. One-photon absorption spectrum within the Soret band is shown with a black curve. (b) Fluorescence spectra of Radachlorin under OPE at different excitation wavelengths.
Photonics 10 00009 g005
Figure 6. Anisotropy spectra of Radachlorin (filled symbols) and chlorin e6 (empty symbols) at OPE (squares) and TPE (triangles).
Photonics 10 00009 g006
Table 1. Fluorescence parameters of Radachlorin and chlorin e6 at one- and two-photon excitation.
 RadachlorinChlorin e6
 Water40% MeOH40% MeOH
 OPE,
405 nm
TPE,
810 nm
OPE,
405 nm
TPE,
810 nm
OPE,
405 nm
TPE,
810 nm
τ ± 0.35, ns3.33.53.53.83.83.8
τ r o t ± 0.07, ns0.320.240.440.340.450.32
r 0 ± 0.02, ns−0.030.35−0.020.390.020.37
Disclaimer/Publisher’s Note: The statements, opinions and data contained in all publications are solely those of the individual author(s) and contributor(s) and not of MDPI and/or the editor(s). MDPI and/or the editor(s) disclaim responsibility for any injury to people or property resulting from any ideas, methods, instructions or products referred to in the content.