1. Introduction
In recent years, with the rapid development of wireless communication services such as big data, smart home, and shared bicycle, there is a growing demand for high-speed communication. However, the traditional mobile communication system, its capacity, and spectrum resource limitations have been unable to meet the requirements of increasing information capacity and transmission rate. In order to achieve high-speed and high-quality communication and solve the problem of the increasingly exhausted electromagnetic spectrum, utilizing new spectrum resources has become one of the trends of mobile communication. As a promising short-distance transmission technology, indoor visible light communication (VLC) has attracted a growing amount of attention [
1,
2]. VLC is a communication method that utilizes light-emitting diode (LED) as the signal transmitting node, free space as the transmission medium, and receives the signal through photo-diode (PD). Compared with conventional radio frequency (RF) communication technology, VLC has the characteristics of large modulation bandwidth, high security, high signal-to-noise ratio, and no electromagnetic interference. To date, VLC technology has been considered as a complement to other wireless communication technologies. In addition, indoor VLC must satisfy both illumination and data communications. Due to these unique dual characteristics, it can be applied in communication scenarios such as airports, train stations, offices, homes, and underwater. And in order to realize the application of indoor VLC, it is essential to arrange the light source.
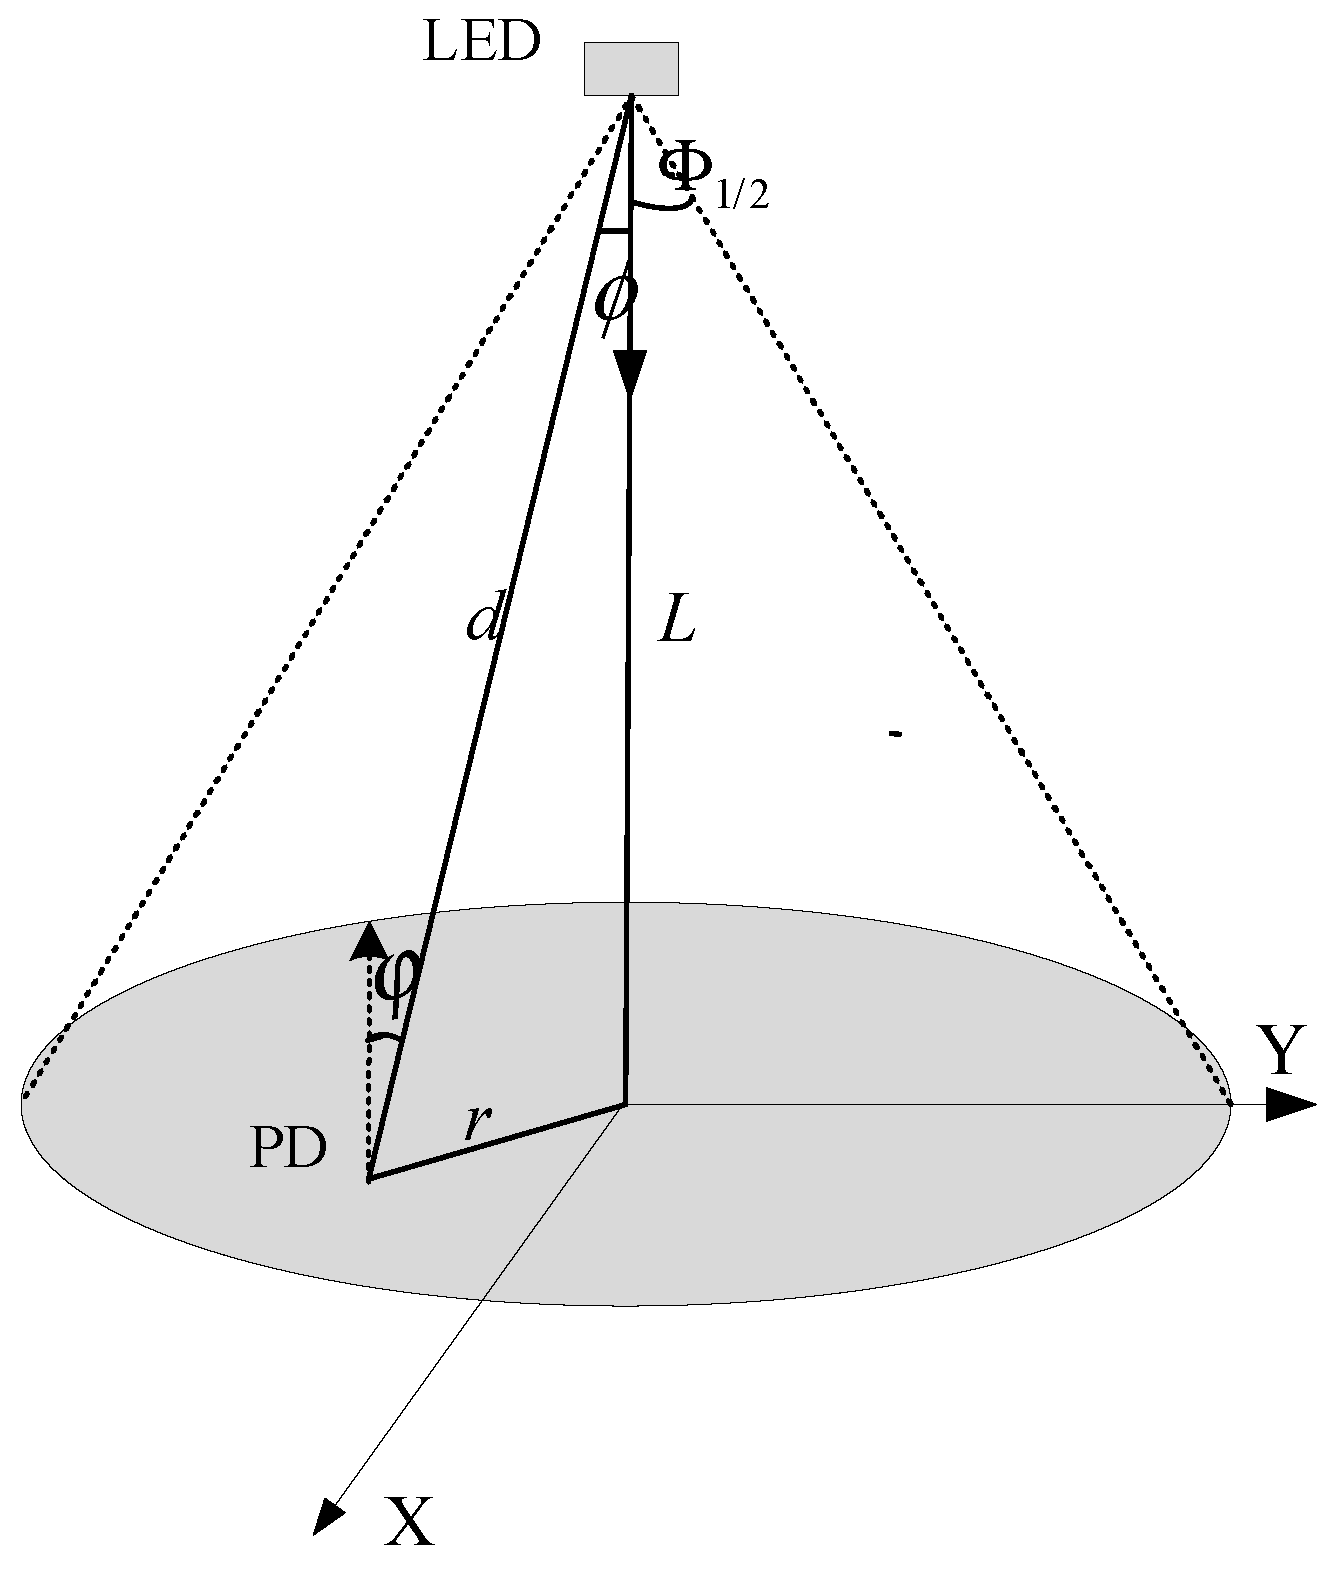
In indoor VLC systems, light signals are transmitted and received by light-emitting diodes (LEDs) and photo-diodes (PDs) [
3]. Because of the propagation characteristics of the visible light, the line-of-sight (LOS) component is dominant compared to the reflection components. In this way, the optical power distribution in the receiving plane is determined by the light source layout. In indoor VLC, the light sources is placed on the ceiling of the room, and the user would appear at any random point. It is obvious that users always want better unobstructed light and a good communication experience. In a typical indoor environment, multiple LEDs are usually used to satisfy the illumination requirements. These LEDs are often placed at the center of the room’s ceiling, which can lead to uneven illumination and optical power reception on the receiving plane and even blind spots. In this situation, both the illumination and optical power decay rapidly from the center to the edge of the receiving plane. Moreover, the non-uniform received optical power will affect the quality of service (QOS) of indoor VLC systems [
4,
5,
6,
7]. Therefore, the optimization of the light source layout is one of the key issues for indoor VLC systems.
Several light source layout optimization schemes have been reported in the literature so far. Komine and Nakagawa analyzed the illumination distribution under indoor VLC array light sources by numerical simulation, and studied the influence of the multi-path effect and signal-to-noise ratio (SNR) of a room of typical size (5 m × 5 m × 3 m) [
8]. On the basis of this theory, some scholars have proposed different methods to optimize the light source layout. Wang and Yu proposed a circular layout of 16 LEDs, and introduced a quality factor
Q to reduce the fluctuation in the SNR [
9]. Pei and Jing proposed a new polygon layout method in three-dimensional space, which further optimizes the circular layout [
10]. Several researchers have incorporated optimization algorithms into the optimization procedure of light source layout. Liu and Tang proposed a square plus ellipse layout, optimized by using the simulated annealing and particle swarm algorithms. The uniformity of the illumination and SNR is further improved [
11]. Che and Wang proposed a hybrid immune clonal bat algorithm to optimize the layout of the light source, which enhances the fair distribution of optical power among indoor users [
12]. Wang and Xu proposed an optimization scheme to improve the uniformity of the received optical power by optimizing the layout of the light source based on an artificial fish swarm algorithm [
13]. Zuo and Liu proposed a modified gray wolf algorithm to optimize the typical square, rectangular, and circular layouts of the light source, which further reduces the fluctuations of the received optical power [
14].
Although much work has been carried out on the optimization of light source layout for indoor VLC systems, there is still room for improvement. Most of the existing schemes are based on the global optimization strategy, which requires searching over a huge number of coordinates, leading to a complicated optimization procedure. Fitness functions based on the received optical power are employed in these optimization schemes, which results in a large number of computations and further reduces the optimization efficiency. Motivated by the above analysis, we propose a sub-regional optimization strategy for light source layout. The main contributions are summarized below.
To reduce the limitations of local optimization, we propose a sub-region partition and optimization priority selection scheme based on the principle of minimum influence among sub-regions.
To address the unpredictable impact of the light sources located on the latter sub-region, we propose a pre-bias compensation scheme based on equivalent mapping.
To reduce the computational complexity, the variance of the square value of the distance between the projection of the light source on the receiving plane and the received point is employed as the fitness function in the optimization of the single light source layout in the sub-region.
The remainder of this paper is organized as follows. The model of the indoor VLC system is described in
Section 2. The design of the sub-regional light source layout optimization strategy is presented in
Section 3, followed by simulation results and a comparative analysis in
Section 4. Finally, the conclusions are drawn in
Section 5.
3. Design of the Sub-Regional Light Source Layout Optimization Strategy
To balance the efficiency and performance of light source layout optimization, we propose a sub-regional light source layout optimization strategy, which consists of a sub-regional partition and optimization priority selection scheme, a pre-bias compensation scheme, and a distance-based sub-regional single-source layout optimization scheme.
3.1. Sub-Region Partition and Optimization Priority Selection Scheme
In order to reduce the mutual influence between sub-regions, we propose a sub-regional partition and optimization priority selection scheme, which divides the optimization region into multiple sub-regions with different areas and optimization priorities. It is important to note that the choice of the number of sub-regions is not the focus of this paper, as this issue has been extensively studied in the relevant literature. We mainly focus on the sub-region partitioning and optimization priority selection under a given number of sub-regions. Considering that the edge sub-regions are less affected than the center sub-regions, we set larger areas and higher optimization priorities for the edge sub-regions. More specifically, the distance between the center of the sub-region and the center of the overall region is used to determine the area and the optimization order of each sub-region. The larger the distance, the smaller the area and the higher the optimization order of the sub-region. Sub-regions with the same distance have the same area but have different optimization priorities. The optimization priority of these sub-regions with the same area is designed as follows. First, anyone is selected as the reference sub-region and the highest optimization priority is set on it. Then, the other sub-regions are assigned optimization priority based on the distance between the center of those sub-regions and the center of the reference sub-region; the larger the distance, the higher the optimization priority.
Figure 2 shows two examples of the sub-region partitions for a 5 m × 5 m region. The numbers listed in
Figure 2 indicate the optimization priority of the sub-regions; the smaller the number, the higher the optimization priority. Since the centers of sub-regions 1–4 are equally distant from the center of the overall region, these four sub-regions are assigned equal area and any of them can be chosen as the reference sub-region. Considering the symmetry of positions between different sub-regions, the optimization orders for the sub-regions exhibited in
Figure 2a,b seem different, but they are essentially consistent. The proposed sub-region partition strategy provides a partitioning principle but does not specify the size of the region. The area of each sub-region is a flexible variable that can be set according to the size of the room. In this work, we present two examples of the sub-region partitions for a 5 m × 5 m room. In these two examples, sub-regions 1–4 are the first priority, with the same area, 1 m
, sub-regions 5–12 are the second priority, with the same area, 1.5 m
, and sub-regions 13–16 are the third priority, with same area, 2.25 m
.
3.2. Pre-Bias Compensation Scheme
Since the light source layout in the sub-regions is optimized sequentially, the influence of the light source located in sub-region j on sub-region is uncertain, as the light source layout optimization in sub-region j has not yet been implemented. In order to minimize as much as possible the optimization error due to such uncertain effects, we propose a pre-bias compensation scheme based on equivalent maps. This scheme approximately equates the effect of a light source located in the unoptimized sub-regions to that of a virtual source located in the center of the overall region, and adjusts this effect for different sub-regions with different factors. The specific implementation procedure is presented below.
When optimizing sub-region
, we assume that the other
unoptimized sub-regions all have a virtual light source located in their centers. Since the ranges of each sub-region have been determined by the proposed sub-regional partition scheme presented in the previous subsection, the projections of their center on the receiving plane can be determined accordingly. Then the square value of the distance between the projection of these virtual light sources on the receiving plane and the center of sub-region
i can be written as
where
and
are the projections of virtual light source
j and the center of sub-region
i on the receiving plane, respectively.
Meanwhile, we assume that there is a virtual light source located at the center of the overall optimization region, and the square value of the distance between its projection on the receiving plane and the projection of the center of sub-region
i can be written as
where
is the projection of this virtual light source on the receiving plane.
Consequently, the pre-bias factor corresponding to the impacts of the light sources located on the other
unoptimized sub-regions on sub-region
i can be obtained as
The specific application of the pre-bias factor is described in the following subsection.
3.3. Single-Light Source Layout Optimization Scheme for Sub-Region
It can be seen from Equation (
6) that the computation required by
P is much greater than that of
u. When the NLOS component of the channel link is considered, the computation required by
P would be greatly increased. To reduce the computation complexity, we propose a single-light source layout optimization scheme, where the variance of the squared distance replaces the receiving optical power as the new fitness function. Moreover, in the optimization of the single-light source layout for the sub-region, the possible impact of the unoptimized sub-regions is simulated through a pre-bias factor.
Assuming
is the projection of the light source located in sub-region
i on the receiving plane, then the square of the distance between this projection and the receiving point
can be written as
When
, only the impacts of the latter optimized
sub-regions need to be considered. Therefore, we revise
through the pre-bias factor as follows.
When
, besides the impacts of the light sources located in the latter optimized
sub-regions, we need to consider the impacts of the light sources located in the former
optimized sub-regions. Assuming that the projection of the light source located in optimized sub-region
on the receiving plane is
,
can be revised as
When
, only the impacts of the light sources located in the former
optimized sub-regions need to be considered. Therefore,
can be revised as
where
can be seen as a random variable and its fluctuations can be described by its variance, which is calculated as
where
and
are the range and area of sub-region
i, and
is the mean value of
, which can be calculated as
The minimum fluctuation of
P can be achieved by searching for the
that minimizes the value of
. Thus, the optimization of the light source layout can be transformed into an optimization search problem, as presented in the following:
This is a non-convex problem for which closed-form solutions cannot be obtained. However, it can be solved through optimization algorithms, such as genetic algorithms (GAs) and bat algorithms (BAs). GA is an optimization method that simulates the principles of biological inheritance and evolution in nature. By simulating the natural evolution process, it searches for the optimal solution in the global range. In the search process, there is no strict requirement on the objective function and constraints, and at the same time, it has strong parallel processing ability, global search ability, and fast convergence ability. Therefore, it has been widely used in many fields.
4. Simulation Results and Discussion
In this section, we evaluate the performance of the proposed light source layout optimization strategy (denoted as the distance-related scheme). The room size we consider is 5 m × 5 m and the total number of light sources is 16, as set in [
12]. Therefore, the sub-region partition and optimization order for each sub-region are the same as shown in
Figure 2. The GA is applied to solve the optimization problem presented in Equation (
16), whose parameters are described in
Table 1. The Python software is used to realize data processing. And the entire strategy flowchart is shown in
Figure 3.
GA provides a general framework for solving a nonlinear program. It encodes the problem parameters as chromosomes, generating an initial population and then using iterative choose, cross, and mutate operations to exchange the information of the chromosomes in the population, ultimately generating a chromosome that meets the optimization objective. In genetic algorithms, chromosomes correspond to data or arrays, usually represented by a one-dimensional string structure, and each position on the string corresponds to the value of the gene.
Taking GA as an example,
Figure 4 shows the process of single-light source layout optimization. It is noteworthy that the fitness function employed in the proposed distance-related optimization scheme is independent for the vertical distance between the ceiling and the receiving plane. Each step of the genetic algorithm is briefly described below:
4.1. Performance Analysis
First, we present the optimization results of the proposed optimization strategy. For comparison, the light source layout determined by the scheme proposed in [
12] (denoted as immune clonal bat algorithm (ICBA)) is also presented in
Figure 5. We can see that the light source layout determined by the proposed optimization strategy is different from that determined by ICBA.
Next, we display the received power distribution determined by the proposed optimization strategy and the ICBA scheme in
Figure 6. Of special note is that the received power consists of two component: the LOS component and NOLS component. Considering the spatial differences of rooms in different scenarios, we set the vertical distance between the ceiling and the receiving plane (denoted as
L) as 2.5 m, 2.85 m, 3.15 m, and 3.5 m, respectively. For the proposed optimization strategy, the FOV is set to 90° and the semi-angle at half power of the LED is set to 60°. The parameters used for the ICBA scheme are the same as those presented in [
12]. We can see that the proposed optimization strategy has a larger fluctuation in the optical power distribution fluctuation compared to the ICBA scheme when
L = 2.5 m. However, the range of fluctuations decreases as the distance increases. When
L = 2.85 m, the optical power distribution of the proposed optimization strategy is lower than that of the ICBA scheme. The greatest challenge for the proposed optimization strategy is the uncertain impact of the latter optimized sub-regions on the current optimized sub-region. However, this uncertain effect decreases as the vertical distance between the ceiling and the receiving plane increases. Therefore, the proposed optimization strategy performs well when
2.85 m. In scenarios such as airports, train stations, and shopping malls, the vertical distance between the ceiling and the receiving plane is always larger than 2.85 m. This proposed optimization strategy is recommended for these scenarios.
In addition,
Table 2 presents the power indices obtained using the two different optimization methods. It is observed that the fluctuations of the maximum and the minimum optical power value in the receiving plane at different heights in the proposed scheme are large compared to the ICBA scheme. However, the power fluctuation range in the proposed scheme becomes limited with the increase in the height, which shows that the receiving optical power distribution is improved when the vertical distance between the ceiling and the receiving plane is not less than 2.85 m, providing a better service quality for users at different positions in the given receiving plane.
In addition, by traversing
L in the range of [2.5 m 3.5 m] with an interval of 0.35 m, we compare the proposed optimization strategy with the ICBA scheme in terms of average performance over a 5 m × 5 m × 1 m space in
Table 3. We can see that the the proposed optimization strategy is is more robust against ICBA.
To analyze the impact of sub-region partition on the proposed optimization strategy, we also evaluate the other two sub-region partitions for a 5 m × 5 m room, denoted as sub-region partition 2 and sub-region partition 3, respectively, as shown in
Figure 7. In sub-region partition 2, sub-regions 1–4 are the first priority, with the same area, 1 m
, sub-regions 5–12 are the second priority, with the same area, 1.5 m
, and sub-regions 13–16 are the third priority, with the same area, 2.25 m
. In sub-region partition 3, sub-regions 1–16 have the same priority, with same area, 1.5625 m
. The power values on the receiver plane (
L = 2.85 m) for different sub-region partitions are shown in
Table 4, where sub-region partition 1 is the sub-region partition shown in
Figure 2. We can see that sub-region partition 1 used in our work has a clear advantage over the other two.
4.2. Complexity Analysis
To demonstrate the low complexity and high efficiency of the proposed optimization strategy, we compare the computational complexity of the power-related fitness function and the distance-related fitness function. In the NLOS channel model, the walls in the room are divided into many small surface elements and each surface element itself acts as a radiator by reflecting the impinging light. Usually, each wall is divided into more than 50 small surfaces. The total gain for all NLOS links is the sum of the contributions from reflections up to a given order. Consequently, obtaining the NLOS component requires a significant amount of computation, which is about a hundred times more than that of u employed in the proposed optimization strategy. Therefore, the proposed optimization strategy has a simple fitness function, which reduces the optimization complexity.
In addition, we compare the convergence of different fitness functions through simulation.
Figure 8 shows the iterative diagram of the distance-related fitness functions and the power-related fitness functions. It can be seen from
Figure 8 that the distance-related fitness function reduces the fitness value to the target value after about 10 iterations, while the power-related fitness function reduces the fitness value to the target value after about 30 iterations. The latter is three times more than the former. In addition, we compare the computer execution time of the two fitness functions: 15.198 s for the distance-related fitness function and 49.317 s for the power-related fitness function. The former reduces the computation by about 70% compared to the latter. Moreover, the proposed optimization strategy does not require diversity in the semi-angle at half power of the LED, which helps to improve the optimization efficiency and expand the applications.
5. Conclusions
In this paper, we introduce an optimization strategy based on pre-bias compensation to improve the reliability and effectiveness of light source layout optimization for indoor VLC systems. Under this optimization strategy framework, we propose a sub-region partition scheme to minimize the mutual impacts between sub-regions as much as possible, a pre-bias compensation scheme to help offset some of the impacts of the latter optimized sub-regions on the current optimized sub-region, and a distance-based sub-regional single-light source layout optimization scheme to improve the optimization efficiency. Simulation results have shown that the proposed optimization strategy has an obvious advantage over the ICBA scheme when 2.5 m, which means that the proposed optimization strategy performs well in rooms with open spaces, such as airports, train stations, and shopping malls. Moreover, the proposed optimization strategy is low-complexity and high-efficiency, as it employees a simple distance-related fitness function and does not require diversity in the semi-angle at half power of the LED. Comparison results in terms of performance and complexity further validate the reliability and effectiveness of the proposed optimization strategy.


