Communication

Electromagnetically Induced Transparency Spectra of 6Li Rydberg Atoms

1
State Key Laboratory of Precision Spectroscopy, East China Normal University, Shanghai 200062, China
2
Collaborative Innovation Center of Extreme Optics, Shanxi University, Taiyuan 030006, China
*
Author to whom correspondence should be addressed.
Photonics 2023, 10(12), 1367; https://doi.org/10.3390/photonics10121367
Submission received: 31 October 2023 / Revised: 23 November 2023 / Accepted: 6 December 2023 / Published: 12 December 2023
(This article belongs to the Special Issue Optical Quantum System)

Abstract

:
Rydberg atoms possess highly excited valence electrons that are far away from atomic cations. Compared with ground states, Rydberg states are excited states with a high principal quantum number n that exhibit large electric dipole moments and have a variety of applications in quantum information processing. In this communication, we report the measurement of the 6 Li Rydberg excitation spectrum by ladder-type electromagnetically induced transparency (EIT) in a vapor cell. The 2 p n s / n d EIT spectra were recorded by sweeping the frequency of an ultraviolet Rydberg pumping laser while keeping the probing laser resonant to the 2 s 2 p transition. All lasers were locked on an ultrastable optical Fabry-Pérot cavity and measured by an optical frequency comb. Our results provide valuable information to precisely determine quantum defects and enable novel experiments with Rydberg-dressed ultracold Fermi gases.

1. Introduction

The Rydberg states of atoms and molecules have highly excited valence electrons with a principle quantum number n 1 . The valence electrons are far away from the nucleus and weakly bound, exhibiting very large electronic dipole moments and high sensitivity to external electromagnetic fields [1]. Rydberg atoms have strong dipole–dipole interactions which scale as n 4 and long radiative lifetimes that scale as n 3 [2]. The lifetime for higher-lying Rydberg states could be in the order of 100 μ s, nearly four orders longer than the lower-lying excited states. Due to their long lifetimes, strong dipole–dipole interactions, and large nonlinear coefficients, Rydberg atoms have been widely used in quantum nonlinear devices [3,4,5,6], high-sensitivity electric field detectors [7], quantum programmable simulators [8,9,10], etc. Particularly for the study of ultracold many-body physics, Rydberg-dressed ultracold quantum gas has attracted increasing attention. Due to its strong long-range dipole interactions, a variety of many-body phenomena, including the Rydberg blockade effects [11,12,13], many-body phase transitions [14,15,16], and formation of exotic molecules [17,18], have been theoretically studied or experimental realized in the past decade.
To achieve better control over the Rydberg states of atoms and molecules, one has to know precisely the atomic Rydberg electronic structure, as the dipole interactions can be controlled by static electric or magnetic, laser, or microwave fields. The Rydberg states of alkali-metal elements usually consist of a fully filled electron core and a far-away valence electron, making them hydrogen-like particles. Precisely measuring the energy structure is crucial in controlling Rydberg atoms. Previous work has been conducted on 7 Li [19,20], 39 K [21], 40 K [22], 85 Rb [23,24], 87 Rb [25], and 133 Cs [26], where Rydberg spectroscopy was experimentally performed in vapor cells and cold atoms.
Among these, lithium is the simplest alkali-metal element. The structure of its electrons make it practically hydrogenic. Knowing its energy levels precisely would help to better understand the details of atomic spectra and verify theoretical atomic models. There are two stable isotopes of lithium in nature, 6 Li and 7 Li. These two isotopes exhibit different quantum statistics, while 7 Li is a composite boson and 6 Li is a composite fermion. Unlike its bosonic isotope, the Rydberg excitation of fermionic 6 Li atoms has been realized with a single-photon process [16,27]. Nevertheless, a detailed calibration of Rydberg spectra in 6 Li is still needed to determine the energy levels. In this communication, we present an experiment carried out to measure the two-photon Rydberg EIT spectra in a 6 Li vapor cell. By carefully shielding the external magnetic field, we precisely measured the energy levels of Rydberg states and determined the ionization energy and quantum defects, which lays a foundation for further research on Rydberg-dressed ultracold 6 Li Fermi gas.

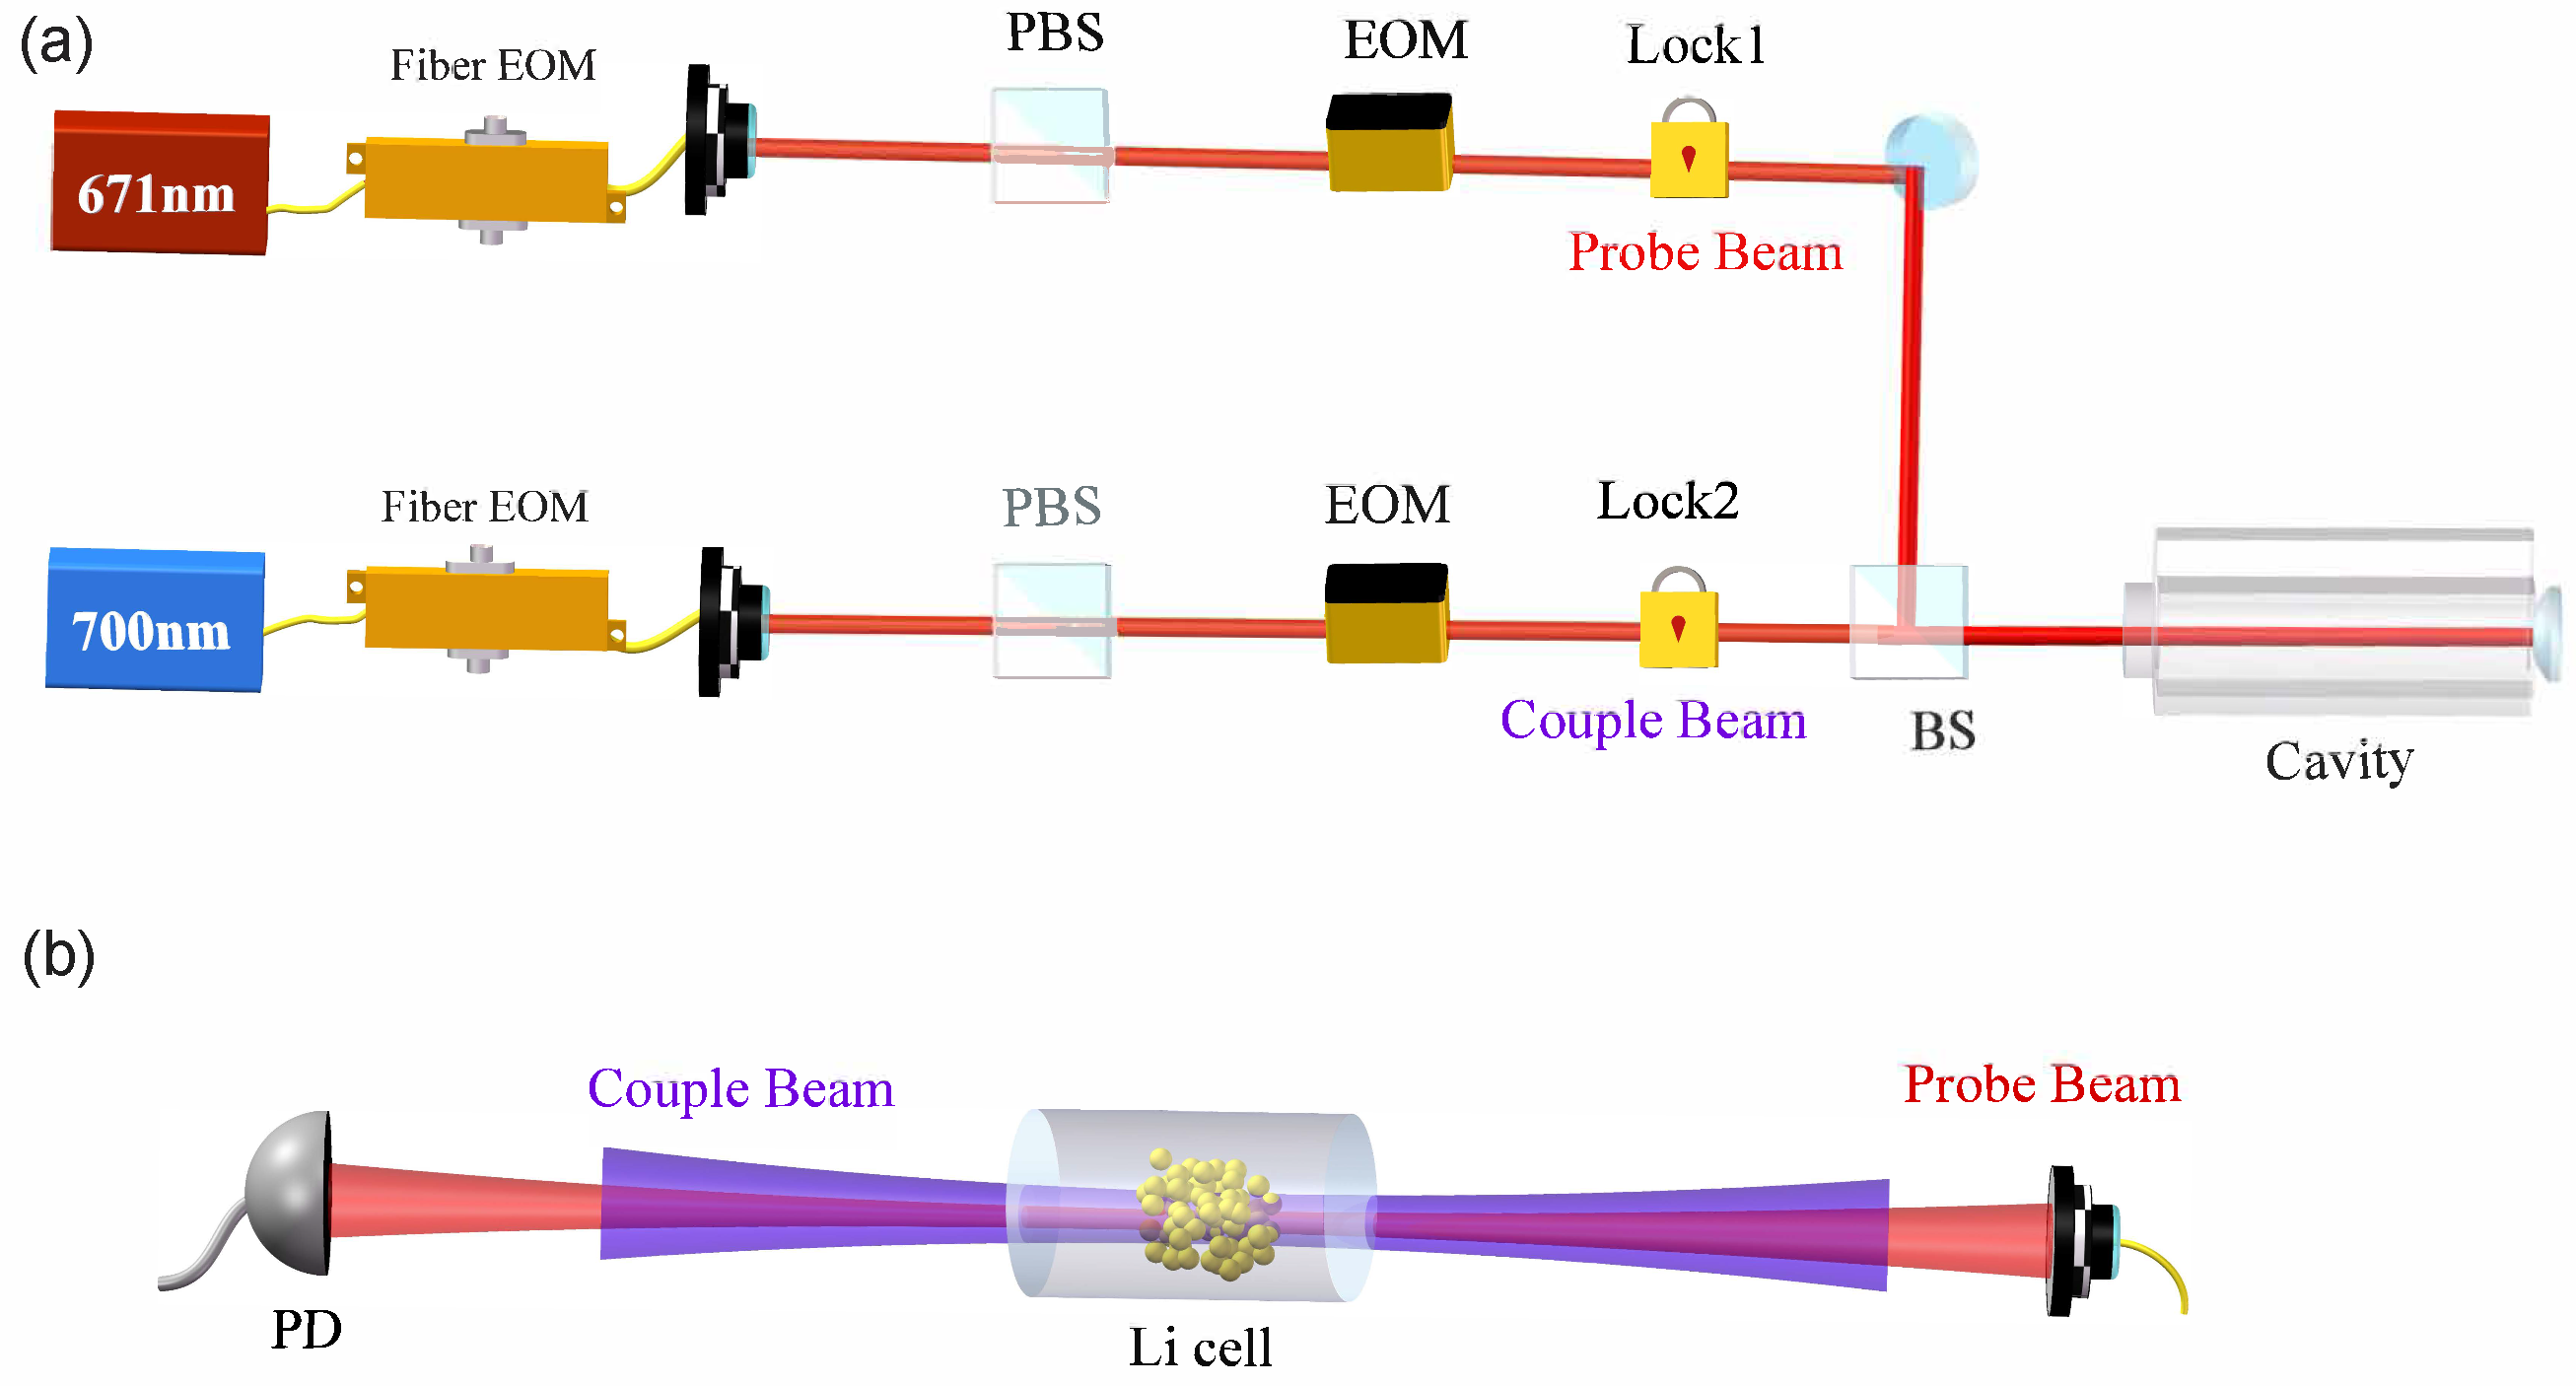
2. Experimental Methods

To measure the Rydberg spectra of 6 Li, we employed the experimental setup shown in Figure 1. The Rydberg states were excited by a two-photon process with a ladder-type EIT method. A weak probe beam with a wavelength of 671 nm was locked to the 2 s 2 p transition, while the strong coupling laser of 350 nm drove the transition of 2 p n s / n d . Both lasers were locked to a high-finesse ultrastable optical cavity, which enabled a frequency stability of about 30 kHz per day and a linewidth of about 10 kHz after being locked on the cavity. Two fiber electro-optic modulators (EOMs) were employed to control the absolute locked frequencies. This provided an ideal laser source to measure the Rydberg spectra.
The probe beam came from a low-noise 671 nm fiber laser (Precilasers,YTFL-SSFQ-671-4-CW), which was realized by combining two high-power fiber laser sources, i.e., 1950 nm and 1023 nm, allowing for an output power of nearly 4 watts with the linewidth narrowed to 20 kHz. In contrast to the 671 nm laser source, the high-power coupling ultraviolet laser was obtained from a frequency-doubling system. The fundamental laser comprised one Ti:sapphire laser system (Sirah Lasertechnik, Matisse TS), which could output 3.5 watts with a 700 nm laser. Then, one ring-cavity frequency-doubler system transferred the laser source to 350 nm with an efficiency of about 12%. An ultraviolet laser of nearly 400 mW could be used to pump the atoms to Rydberg states. The frequency stabilization of the ultraviolet laser was realized by locking the fundamental 700 nm Ti:sapphire laser to the same ultrastable cavity to suppress frequency drifts.
In contrast, we measured the EIT spectra using the D1 and D2 lines [28]. To reduce the Doppler broadening of the spectrum, the weak probe beam and high-power coupling beam propagated in the opposite direction through a vapor cell, as shown in Figure 1b. As the natural abundance of 6 Li is quite low at only 7.5%, the cell was filled with several pieces of 6 Li metal and heated up to about 630 K to reach a high atomic density. To suppress the back-illumination laser light, the cell was sealed with two fused silica windows tilted at the Brewster angle. As Rydberg atoms are extremely sensitive to the environment, external perturbations like RF fields [24] and magnetic fields [29] would certainly split the spectrum and make the energy levels shift and broaden. We placed the cell on a clean table and protected it with 3 layers of permalloy shield. The measured residual magnetic field was considered to be weaker than several tens of mG and so could be neglected in this experiment. In the experiment, the probe beam was focused at the center of the vapor cell with a Gaussian waist of about 100 μm. To obtain a better EIT signal, the coupling beam was also focused at the center of the cell with a Gaussian beam waist of about 70 μm. The power of the probe beam and coupling beam were 40 μW and 100 mW, respectively.

3. Measurements of EIT Spectra

Usually, there are two methods for measuring EIT spectra. The first method is to measure the transmission signal of the probe beam while scanning its frequency and keeping the coupling beam resonant to the Rydberg excited states. The second method is to record the transmission of the probe beam while sweeping the coupling beam. The frequency of the probe beam is locked for this method, which is very useful for suppressing the Doppler background. Figure 2 shows the measurement results using the first method. The Rydberg EIT has a ladder-type configuration, as shown in Figure 2a. We kept the coupling laser resonant to the 2 2 P 3 / 2 30 s / 30 d transition, while the frequency of the probe beam swept near the D2 transition.
The ground state 2 2 S 1 / 2 was split into two hyperfine states, separated by 228.20 MHz. The excited state 2 2 P 3 / 2 was split into three energy states with a total splitting of about 4.4 MHz, smaller than the natural linewidth of 2p excited states. Figure 2b,c show the Rydberg state EIT spectrum of 30 s / 30 d . The signal refers to the transmission of the probe beam. We only found two peaks when sweeping the frequency of the probe beam, representing the hyperfine splitting of the 2 2 S 1 / 2 states. We also found that the EIT signal of 2 2 P 3 / 2 n d was stronger and wider than the transmission of 2 2 P 3 / 2 n s , indicating a larger coupling strength for the n d Rydberg states.
To systematically measure the transition frequency of 2 2 P 3 / 2 to the n s / n d Rydberg spectrum, we swept the frequency of the ultraviolet coupling beam while keeping the probe beam resonant to the 6 Li D2 line, which could suppress the frequency shift due to the Doppler effect in a ladder-type EIT configuration. The intensity of the probe beam was decreased to the limit of our detection system, about three orders smaller than the coupling beam, to obtain sharp EIT peaks. Table 1 shows the measurement results of the Rydberg energy level of n s and n d , which was about 500 MHz to 600 MHz smaller than the theoretical calculation according to Ref. [30].

4. Quantum Defects of 6 Li

To determine the energy level of the n s and n d Rydberg states, we needed to measure the transition frequency of both 2 2 S 1 / 2 to 2 2 P 3 / 2 and 2 2 P 3 / 2 to n s / n d . We then present measurements of the transition frequency from 2 2 S 1 / 2 to 2 2 P 3 / 2 through the saturated absorption spectrum. We observed saturated absorption signals with a linewidth of about 10 MHz by optimizing the temperature of the cell, intensity of the laser light, etc. Calibrated by the ultrastable cavity and optical frequency comb, the measured frequency of the 2 2 S 1 / 2 to 2 2 P 3 / 2 transition was determined to be 446.799574 (1.2) THz, agreeing well with the results in [31].
Combined with the transition frequencies from 2 2 S 1 / 2 to 2 2 P 3 / 2 and 2 2 P 3 / 2 to n s / n d , our results could thus provide a precise determination of ionization energy and quantum defects for 6 Li. The energy levels for a one-valence-electron atom can be described by the Rydberg–Ritz equation [32]:
E n , j = E i R y ( n δ n , j ) 2 ,
δ n , j = δ 0 + a 1 ( n δ 0 ) 2 + a 2 ( n δ 0 ) 4 + . . . ,
where E n , j is the energy levels of the Ryberg states, E i is the ionization energy, R y is the Rydberg constant, and δ n , j is the corresponding quantum defects. For higher Rydberg states (quantum principle number n 30 ), we could take the quantum defects as a constant value to derive other parameters, as the higher-order terms on the right side of Equation (2) would be relatively small.
Thus, the results were fitted with Equation (1), and E i and δ 0 were treated as variable parameters. The experimental dependence of the Rydberg energies on the principal quantum number n and best-fitting curves according to Equation (1) are presented in Figure 3. We obtained a good description with the formula for n ranging from 30 to 60. In Figure 3, we changed the energy units to cm 1 by dividing the transition frequencies by velocity of light in vacuum.
For 6 Li, the Rydberg constant is 109,727.308 cm 1 , about 1.301 × 10 5 smaller than the value of 7 Li [32,33]. We found that the ionization energy for n s and n d was 43,486.545 ± 0.003 cm 1 and 43,486.540 ± 0.002 cm 1 , respectively. The fitted results showed that the quantum defects for n s and n d were 0.4001 ± 0.0007 and 0.0023 ± 0.0008 , respectively. The ionization energy for 6 Li in [32] was determined to be 43,486.55673 cm 1 , about 2.7 × 10 7 larger than our results. The quantum defects for n s and n d were found to be 0.3995106 [33] and 0.002129 [30], which shows excellent consistency with our results.

5. Conclusions

In summary, we established the measurement of Rydberg excitation spectra by ladder-type electromagnetically induced transparency (EIT) in a 6 Li vapor cell. After carefully optimizing the experimental conditions, we observed the narrow n s and broad n d features in the spectra of the excited Rydberg states. The transition from 2 p n s / n d was measured by the combination of the ultrastable optical Fabry-Pérot cavity and optical frequency comb. Based on the Rydberg spectra with principle quantum number n ranging from 30 to 60, we determined the ionization energy and quantum defects of 6 Li with high accuracy. The measured ionization energy was about 2.7 × 10 7 smaller than the theoretical calculation, while the quantum defects for n s and n d showed excellent consistency. Our results provide valuable information for controlling the Rydberg states of 6 Li atoms and promote novel experiments related to ultracold Fermi gases with long-range interactions.

Author Contributions

Formal analysis, S.Y. and L.Y.; Investigation, M.W., P.R. and S.D.; Data curation, M.W., X.B. and S.D.; Writing—original draft, M.W. and S.D.; Writing—review & editing, M.W. and S.D.; Project administration, S.D. and H.W. All authors have read and agreed to the published version of the manuscript.

Funding

This research was funded by National Natural Science Foundation of China (Grant No. 12174105, 11925401, 12234008); National Key Research and Development Program of China (Grant No. 2022YFA1404202); Shanghai Rising-Star Program (Grant No. 23QA1402700).

Institutional Review Board Statement

Not applicable.

Informed Consent Statement

Not applicable.

Data Availability Statement

Data are contained within the article.

Conflicts of Interest

The authors declare no conflict of interest.

References

  1. Oks, E. Advances in Physics of Rydberg Atoms and Molecules; IOP Publishing: Bristol, UK, 2021; pp. 2053–2563. ISBN 978-0-7503-3939-1. [Google Scholar]
  2. Saffman, M.; Walker, T.G.; Mølmer, K. Quantum information with Rydberg atoms. Rev. Mod. Phys. 2010, 82, 2313. [Google Scholar] [CrossRef]
  3. Dlaska, C.; Ender, K.; Mbeng, G.B.; Kruckenhauser, A.; Lechner, W.; van Bijnen, R. Quantum optimization via four-body Rydberg gates. Phys. Rev. Lett. 2022, 128, 120503. [Google Scholar] [CrossRef]
  4. Tiarks, D.; Baur, S.; Schneider, K.; Dürr, S.; Rempe, G. Single-photon transistor using a Förster resonance. Phys. Rev. Lett. 2014, 113, 053602. [Google Scholar] [CrossRef] [PubMed]
  5. Gard, B.T.; Jacobs, K.; McDermott, R.; Saffman, M. Microwave-to-optical frequency conversion using a cesium atom coupled to a superconducting resonator. Phys. Rev. A 2017, 96, 013833. [Google Scholar] [CrossRef]
  6. Yu, Y.; Sun, P.-F.; Zhang, Y.-Z.; Bai, B.; Fang, Y.-Q.; Luo, X.-Y.; An, Z.-Y.; Li, J.; Zhang, J.; Xu, F.; et al. Measurement-Device-Independent Verification of a Quantum Memory. Phys. Rev. Lett. 2021, 127, 160502. [Google Scholar] [CrossRef] [PubMed]
  7. Jing, M.; Hu, Y.; Ma, J.; Zhang, H.; Zhang, L.; Xiao, L.; Jia, S. Atomic superheterodyne receiver based on microwave-dressed Rydberg spectroscopy. Nat. Phys. 2020, 16, 911–915. [Google Scholar] [CrossRef]
  8. Kim, H.; Lee, W.; Lee, H.-G.; Jo, H.; Song, Y.; Ahn, J. In situ single-atom array synthesis using dynamic holographic optical tweezers. Nat. Commun. 2016, 7, 13317. [Google Scholar] [CrossRef]
  9. Endres, M.; Bernien, H.; Keesling, A.; Levine, H.; Anschuetz, E.R.; Krajenbrink, A.; Senko, C.; Vuletic, V.; Greiner, M.; Lukin, M.D. Atom-by-atom assembly of defect-free one-dimensional cold atom arrays. Science 2016, 354, 1024–1027. [Google Scholar] [CrossRef]
  10. Barredo, D.; de Léséleuc, S.; Lienhard, V.; Lahaye, T.; Browaeys, A. An atom-by-atom assembler of defect-free arbitrary two-dimensional atomic arrays. Science 2016, 354, 1021–1023. [Google Scholar] [CrossRef] [PubMed]
  11. Sous, J.; Sadeghpour, H.R.; Killian, T.C.; Demler, E.; Schmidt, R. Rydberg impurity in a Fermi gas: Quantum statistics and rotational blockade. Phys. Rev. Res. 2020, 2, 023021. [Google Scholar] [CrossRef]
  12. Heidemann, R.; Raitzsch, U.; Bendkowsky, V.; Butscher, B.; Löw, R.; Pfau, T. Rydberg excitation of Bose-Einstein condensates. Phys. Rev. Lett. 2008, 100, 033601. [Google Scholar]
  13. Tong, D.; Farooqi, S.M.; Stanojevic, J.; Krishnan, S.; Zhang, Y.P.; Côté, R.; Eyler, E.E.; Gould, P.L. Local blockade of Rydberg excitation in an ultracold gas. Phys. Rev. Lett. 2004, 93, 063001. [Google Scholar] [CrossRef]
  14. Osychenko, O.N.; Astrakharchik, G.E.; Lutsyshyn, Y.; Lozovik, Y.E.; Boronat, J. Phase diagram of Rydberg atoms with repulsive van der Waals interaction. Phys. Rev. A 2011, 84, 063621. [Google Scholar] [CrossRef]
  15. Samajdar, R.; Ho, W.W.; Pichler, H.; Lukin, M.D.; Sachdev, S. Quantum phases of Rydberg atoms on a kagome lattice. Proc. Natl. Acad. Sci. USA 2021, 118, e2015785118. [Google Scholar] [CrossRef] [PubMed]
  16. Guardado-Sanchez, E.; Brown, P.T.; Mitra, D.; Devakul, T.; Huse, D.A.; Schauß, P.; Bakr, W.S. Probing the quench dynamics of antiferromagnetic correlations in a 2D quantum Ising spin system. Phys. Rev. X 2018, 8, 021069. [Google Scholar] [CrossRef]
  17. Zou, Y.-Q.; Berngruber, M.; Anasuri, V.S.V.; Zuber, N.; Meinert, F.; Löw, R.; Pfau, T. Observation of vibrational dynamics of orientated Rydberg-atom-ion molecules. Phys. Rev. Lett. 2023, 130, 023002. [Google Scholar] [CrossRef]
  18. Hummel, F.; Schmelcher, P.; Eiles, M.T. Vibronic interactions in trilobite and butterfly Rydberg molecules. Phys. Rev. Res. 2023, 5, 013114. [Google Scholar] [CrossRef]
  19. Zelener, B.B.; Saakyan, S.A.; Sautenkov, V.A.; Manykin, E.A.; Zelener, B.V.; Fortov, V.E.E. Efficient excitation of Rydberg states in ultracold lithium-7 atoms. JETP Lett. 2014, 100, 366–370. [Google Scholar] [CrossRef]
  20. Murashkin, D.A.; Saakyan, S.A.; Sautenkov, V.A.; Zelener, B.B. Measurements of quantum defect in Rydberg D-states for lithium atoms. J. Phys. Conf. Ser. 2016, 774, 012166. [Google Scholar] [CrossRef]
  21. Xu, W.; DeMarco, B. Velocity-selective electromagnetically-induced-transparency measurements of potassium Rydberg states. Phys. Rev. A 2016, 93, 011801. [Google Scholar] [CrossRef]
  22. Li, D.; Bian, G.; Miao, J.; Wang, P.; Meng, Z.; Chen, L.; Huang, L.; Zhang, J. Rydberg excitation spectrum of 40K ultracold Fermi gases. Phys. Rev. A 2021, 103, 063305. [Google Scholar] [CrossRef]
  23. Stoicheff, B.P.; Weinberger, E. Doppler-free two-photon absorption spectrum of rubidium. Can. J. Phys. 1979, 57, 2143–2154. [Google Scholar] [CrossRef]
  24. Jayaseelan, M.; Rotunno, A.; Prajapati, N.; Berweger, S.; Artusio-Glimpse, A.; Simons, M.; Holloway, C. Electromagnetically-induced-transparency spectra of Rydberg atoms dressed with dual-tone radio-frequency fields. Phys. Rev. A 2023, 108, 033712. [Google Scholar] [CrossRef]
  25. Mack, M.; Karlewski, F.; Hattermann, H.; Höckh, S.; Jessen, F.; Cano, D.; Fortágh, J. Measurement of absolute transition frequencies of Rb 87 to nS and nD Rydberg states by means of electromagnetically induced transparency. Phys. Rev. A 2011, 83, 052515. [Google Scholar] [CrossRef]
  26. Saßmannshausen, H.; Merkt, F.; Deiglmayr, J. High-resolution spectroscopy of Rydberg states in an ultracold cesium gas. Phys. Rev. A 2013, 87, 032519. [Google Scholar] [CrossRef]
  27. Guardado-Sanchez, E.; Spar, B.M.; Schauss, P.; Belyansky, R.; Young, J.T.; Bienias, P.; Gorshkov, A.V.; Iadecola, T.; Bakr, W.S. Quench dynamics of a fermi gas with strong nonlocal interactions. Phys. Rev. X 2021, 11, 021036. [Google Scholar] [CrossRef] [PubMed]
  28. Fuchs, J.; Duffy, G.J.; Rowlands, W.J.; Akulshin, A.M. Electromagnetically induced transparency in 6Li. J. Phys. B At. Mol. Opt. Phys. 2006, 39, 3479. [Google Scholar] [CrossRef]
  29. Bao, S.; Zhang, H.; Zhou, J.; Zhang, L.; Zhao, J.; Xiao, L.; Jia, S. Polarization spectra of Zeeman sublevels in Rydberg electromagnetically induced transparency. Phys. Rev. A 2016, 94, 043822. [Google Scholar] [CrossRef]
  30. Šibalić, N.; Pritchard, J.; Adams, C.; Weatherill, K. ARC: An open-source library for calculating properties of alkali Rydberg atoms. Comput. Phys. Commun. 2017, 220, 319–331. [Google Scholar] [CrossRef]
  31. Li, R.; Wu, Y.; Rui, Y.; Li, B.; Jiang, Y.; Ma, L.; Wu, H. Absolute Frequency Measurement of 6Li D Lines with khz-Level Uncertainty. Phys. Rev. Lett. 2020, 124, 063002. [Google Scholar] [CrossRef] [PubMed]
  32. Bushaw, B.A.; Drake, G.W.F.; Kluge, H.-J. Ionization energy of 6,7Li determined by triple-resonance laser spectroscopy. Phys. Rev. A 2007, 75, 052503. [Google Scholar] [CrossRef]
  33. Goy, P.; Liang, J.; Gross, M.; Haroche, S. Quantum defects and specific-isotopic-shift measurements in ns and np highly excited states of lithium: Exchange effects between Rydberg and core electrons. Phys. Rev. A 1986, 34, 2889. [Google Scholar] [CrossRef] [PubMed]
Figure 1. (a) The frequency stablization of the laser source, including the probe beam and the strong-coupling laser. (b) A schematic figure of the setup to measure the EIT spectrum. PBS: polarized beam splitter, EOM: electro-optic modulator, BS: beam splitter.
Photonics 10 01367 g001
Figure 2. (a) Energy-level diagram of the two-photon excitation of 6 Li to Rydberg n s and n d states. (b) The EIT spectrum of 2 2 S 1 / 2 2 2 P 3 / 2 30 s . (c) The EIT spectrum of 2 2 S 1 / 2 2 2 P 3 / 2 30 d .
Photonics 10 01367 g002
Figure 3. Measurement results for Rydberg n s (black points) and n d (blue dots) energy levels. The solid lines are best fit according to Equation (1).
Photonics 10 01367 g003
Table 1. Rydberg state transition of 6 Li from 2 2 P 3 / 2 n s and 2 2 P 3 / 2 n d according to both theory and the experiment. Here, n is the principle quantum number of the Rydberg state, and the theoretical results were predicted in Ref. [30].
nTheory (ns, THz)Experiment (ns, THz)Theory (nd, THz)Experiment (nd, THz)
30853.14012481853.139625(2.0)853.238946780853.238402(2.5)
31853.38149687853.380931(1.9)853.471000983853.470447(5.5)
32853.60031868853.600253(2.8)853.681640530853.681084(6.4)
33853.79931423853.798746(1.8)853.873421573853.872860(2.9)
34853.98080828853.980256(4.8)854.048529868854.047953(3.4)
35854.14679455854.146233(5.9)854.208843495854.208256(4.6)
43855.08189001855.081821(3.2)855.115241259855.114642(4.5)
44855.16408339855.163507(5.7)855.195201873855.194617(8.6)
45855.24081032855.240745(2.7)855.269890967855.269297(3.0)
46855.31254502855.311976(2.6)855.339761976855.339676(4.5)
47855.37971139855.379642(1.9)855.405220550855.404632(2.3)
48855.44268924855.442116(3.8)855.466630577855.466049(3.7)
49855.50181977855.501250(3.1)855.524319130855.523736(2.9)
50855.55741004855.556839(1.6)855.578580965855.577998(3.9)
Disclaimer/Publisher’s Note: The statements, opinions and data contained in all publications are solely those of the individual author(s) and contributor(s) and not of MDPI and/or the editor(s). MDPI and/or the editor(s) disclaim responsibility for any injury to people or property resulting from any ideas, methods, instructions or products referred to in the content.

